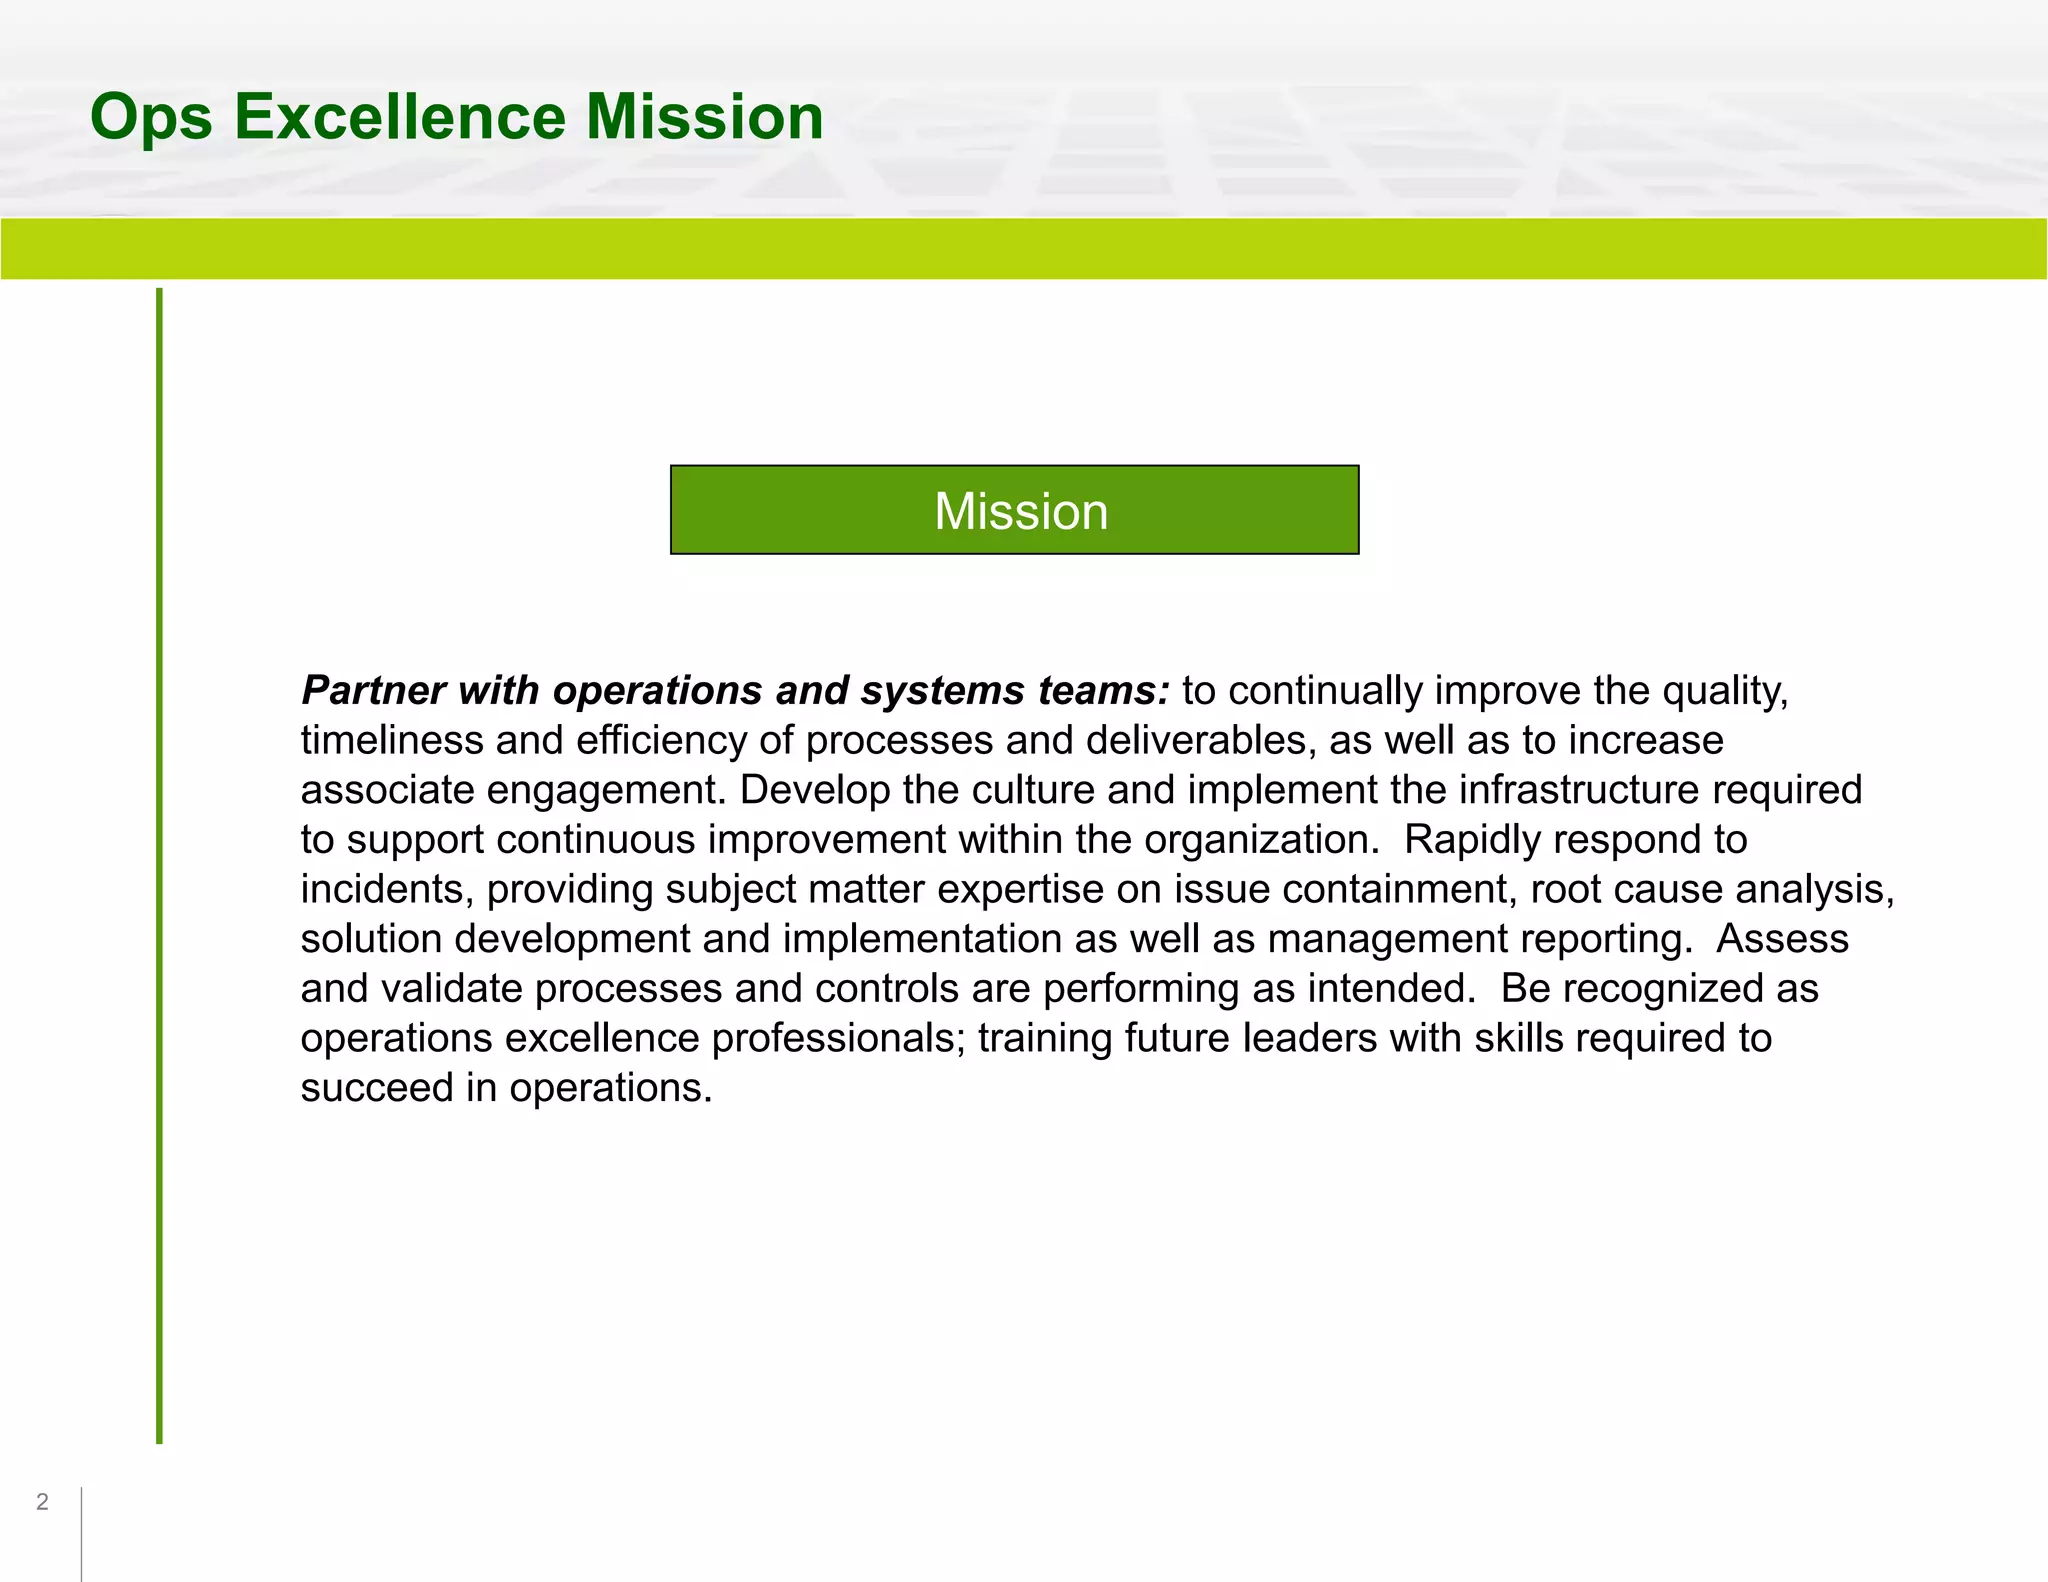
Operations Excellence Offerings
A customized approach to achieve results.
Create and sustain an operations
excellence culture
2
Ops Excellence Mission
Partner with operations and systems teams: to continually improve the quality,
timeliness and efficiency of processes and deliverables, as well as to increase
associate engagement. Develop the culture and implement the infrastructure required
to support continuous improvement within the organization. Rapidly respond to
incidents, providing subject matter expertise on issue containment, root cause analysis,
solution development and implementation as well as management reporting. Assess
and validate processes and controls are performing as intended. Be recognized as
operations excellence professionals; training future leaders with skills required to
succeed in operations.
Mission
3
Lean Offerings
 Task Timeliness Tool
 Review Tool
 Capacity Model
 Kanban
 Metrics Support and Development
6
page
Table of Contents
Performance Management
Lean Offerings
 WorkStreams
 ANA’s
 Eureka
Continuous Improvement
 Procedures Re-Writes
 Process Mapping
Standard Work
Operational Best Practices
 Change Management
 Eureka Ambassadors
 Team Huddle Support
 Ops Excellence Champions
 Procedure Execution Audit
 Supplier Quality Management
7
9
8
10
12
13
14
16
17
19
20
23
21
24
22
4
Lean Offerings ( cont. )
 ANA Business Facilitator Training program
 Lean Simulator
 Lean Six Sigma Training 28
page
Table of Contents ( cont. )
Lean Training Opportunities
Lean and Quality Offerings
 Intake and Triage
 Root Cause Analysis and Solutioning
 Analysis and Reporting
Incident Management
 Support Execution
QC Events
Quality Offerings
Operations Health Assessment
 Procedure Review and Training
 Control Directors
Operational Controls
27
26
32
31
30
34
36
38
5
Performance Management
 Task Timeliness Tool
 Review Tool
 Capacity Model
 Kanban
 Metrics Development and Support
Lean Offerings
6
FloMotion (Visual Management) – The visualization of process progression
Task Timeliness
Benefits to the Business Include
 Increased process transparency
 Improved rigor to follow process
 Proactive issue avoidance
Example
FloMotion (Visual Management) provides
transparency and consistent data.
FloMotion is a visual management tool that provides transparency into
the status of work in progress. This transparency mitigates the risk of
missing daily and other task deadlines in routine operations. Tasks are
visually presented in sequence as they approach their deadlines and
tracked and reported on for timeliness. Data is trended for analysis
and improvement opportunities.
Real time visual management enables: the
 Resolution of issues before they impact delivery
 Structured accountability for process discipline
 Development of consistent performance indicators
Task Timeliness
 Timely resolution
 Measurable performance data
 Issue tracking
Program Approach :
 Daily Tasks: visually appear on a desktop or centrally
located monitor15 mins. prior to their scheduled
delivery time. Completion timeliness is visually indicated and
tasks not completed on time have non timeliness cause data
entered into the tool and categorized for analysis purposes.
 Daily Performance: for Task Timeliness is reported at a
given point in time during the work day for actual vs. scheduled.
 Routine review: of daily performance drives process
control and quick response to task timeliness issues.
 Trending analysis of available data and reporting,
enables solutions to long term problems and provides
valuable insight for organization training focus needs.
 Process Improvement through the development of
recommendations as the result of tool data analysis.
7
Review Tool ( Managing the review process on a day to day basis and making
improvement long term )
Review Tool
The Review Tool provides daily and trending
reporting capability for day to day
management and long term improvement of
review process First Pass Accuracy.
Benefits to the Business Include:
 Review process control and
improvement
 Process standardization
 Efficiency gains
 Identification of training needs
 Improved quality of process
 Mitigated risk downstream
Program Approach:
 Data collection on a daily basis for failed reviews,
failed categories, comment details, etc., provide
valuable information for process control, improvement,
and prevention of errors.
 Routine review of daily performance drives process
control and quick response to current process issues
and quality concerns.
 Trending analysis of available data and reporting,
enables identification of reoccurring problems and
provides valuable insight for organization training
focus needs.
 Process Improvement through the development of
recommendations as the result of tool data analysis.
First Pass Accuracy Trending Data
The Review Tool drives review process control and
improvement, is a predictive indicator of changes in
performance, and can reduce negative downstream
impacts overall.
8
Capacity Models ( Understanding Supply and Demand / making well informed
staffing decisions )
Staffing models built upon measured core operational
demand and driven by defined associate profiles with
work-force experiential factors included ; provide resource
data which clearly describe the available resource supply
required to meet daily demand. Data from the model can
be used to analyze current operational capacity, the ability
to take on project work and other additional demand, or to
forecast future demand requirements.
Capacity Models help managers make
staffing decisions based upon data as well
as experience.
Benefits to the Business Include:
 Well informed staffing decisions
 Right sized organizations
 Efficiency gains
 Enhanced planning
 Identification of required training needs
 Mitigated risk
Program Approach:
 Identify required daily operational demand across the
organization (e.g. tasks).
 Measure the average daily operational demand for an
organization.
 Define the desired associate profile for a typical day in
the life of an associate.
 Factor in experience levels of associates, non routine
demand, and other considerations which impact the
amount of resource supply
 Run the model and measure capacity making
informed staffing decisions.
-40.00%
-30.00%
-20.00%
-10.00%
0.00%
10.00%
20.00%
30.00%
%Physical
%Equivalent
Team Staffing Supply vs Demand
Capacity Model
9
Kanban – ( A visual display of the workflow and constraints )
Benefits to the Business Include:
 Easier to see and understand workflow
 Maximized throughput and First Pass
Accuracy
 Reduced Backlog and overall WIP
 Diminished resolution time
 Quicker recognition of improvement
opportunities
Time to implement can be as soon as one day!
Kanban Example
Kanban Program Approach
Kanban is a catalyst for change through
small, incremental improvements to your
existing process
Kan means “visual,” and ban, means “card” or
“board.” It is a signaling system to trigger action
and uses cards to signal need for work to be done.
You will leverage Kanban if you want to:
 Maximize workflow while prioritizing issues
in conjunction with driving individual
accountability.
 Quickly see constraints and influence the
entire team to work harmoniously to manage
the constraint through the process.
 Introduce change with minimal resistance to
increase customer satisfaction and decrease
delivery time.
Proactive issue avoidance
 Ability to document and analyze
repetitive bottlenecks, themes, and issues
Higher individual and team accountability to
drive positive process changes and process
adherence
 Proactive issue avoidance
 Ability to document and analyze repetitive
bottlenecks, themes, and issues
Kanban
10
Metrics Support ( Ops Health Views, Process KPI’s, and other.)
Activities include:
 Ops Health Monthly Views support for long term
improvement across all major business groups.
 Development of Key Performance Indicators
(KPI’s ) to manage daily operations within a
group.
 Reporting, analysis, and improvement
recommendations
Program Approach:
 Key Performance Indicators ( KPI’s ): are identified and
defined with the business for use in Monthly Ops Health Views
or as metrics to manage daily operations.
 Development: of dashboards for reporting and the collection
of trending data for analysis and improvement.
 Identification: of opportunities for performance improvement
in Quality or Efficiency.
 Planning and Implementation: of improvement
recommendations based upon data analysis.
Metrics Support
Benefits to the Business Include:
 Increased insight and transparency into your processes
 Accountability and process discipline
 Proactive issue avoidance and/or timely resolution
 Analyzable data
 Consistent performance data
 Ability to identify and substantiate common themes, issues, and
bottlenecks
Clearly defined and measurable metrics within an
organization allows the organization to understand
it’s operational performance and paves the way for
improvement.
11
Continuous Improvement
 WorkStreams
 ANA’s
 Eureka
Lean Offerings
12
WorkStreams ( Major process improvements, organizational changes, and more )
WorkStreams
Business teams led by LEAN SME’s engage in process
standardization, metric based analysis, and idea
creation, resulting in the implementation of process
improvement and organizational change
recommendations. Teams are trained in basic
principles of “LEAN” and apply those principles
during the WorkStream and after.
WorkStreams deliver improvement in
process performance and overall efficiency.
Program Approach:
 Organize WorkStream Team: and engage as many
members of the organization as possible as full or
extended team members.
 Facilitate Lean Skills Training: to team members
and others:
 SIPOC, Process Mapping, Pareto Charts,
FMEA, Brainstorming & Affinity Diagram
techniques, Fishbone Diagrams, and Run Charts
 Standardize, Analyze, and Improve: processes as
well as organizational roles and responsibilities while
driving improvement in overall performance.
 Note: A typical WorkStream takes 3 months ( longer
if necessary ) to complete and engages a core team of
6 to 8 business partners with a time commitment
which can vary between 10 to 25%>
Benefits to the Business Include:
 Process standardization
 Improved efficiency and quality
 Metrics development and measurable
results
 Mitigated risk
 Well defined roles and responsibilities
 Improved supplier performance
 More efficient hand-offs between
business partners
Actual WorkStream Example
0
2,000
4,000
6,000
8,000
10,000
12,000
J F M A M J J A S O N D
COG Monthly Volume Trend Data ( 2009 thru 2011 YTD )
2009 2010 2011 2009 Pos 2010 Pos 2011 Pos
13
Program Approach:
 Facilitate: Intro to Lean / Basic Principles.
 Deliver: a Tool Kit of Lean skills:
 SIPOC, Process Mapping, Pareto Charts,
FMEA, Brainstorming & Affinity Diagram
techniques, Fishbone Diagrams, and Run Charts
 Conduct: routinely scheduled ANA events
 Using a DMAIC Approach
 Define
 Measure
 Analyze
 Improve
 Control
 100% participation from all levels of team
 Implementation a guarantee
Train and Certify Business Facilitators: and
become self sustaining.
Transition: program to the business.
Associates in Action ( Small improvements continuously )
ANA’s Create a self-sustaining Lean
culture for process improvement !
Benefits to the Business Include:
 Monthly efficiency gains
 Increased quality of work
 Measurable results
 Mitigated risk
 Process standardization
Associates in Action empowers employees to drive
small continuous improvements in a short period of
time. The goal of the program is to create a Lean
culture that will sustain the program without the
support of the Lean team.
Make change in a day or two !
MMK Dividend Calendar Process - BEFORE
Enter Start & End
Date. Click Clean
up & Load Data.
Save & close
Open Dividend
Calendar
Spreadsheet from
Bloomberg
Hit Bloomberg
Macro.
Print document
once data is
loaded
Is fund
“In Nav”
Dividend
No
Add Security to
appropriate Ex
Date on “In-
Nav”Calendar
Is fund already
on calendar
under
appropriate date?
Add Security to
appropriate Pay
Date on “Ex-Pay”
Calendar
Look up Analyst
who prepares
fund & add
initials next to
fund #
Is fund already
on calendar
under
appropriate date?
Is fund already
on calendar
under
appropriate date?
Look up Analyst
who prepares
fund & add
initials next to
fund #
Starting from top
of document,
look at each
security
No
Is this last
security on
document?
Is this last
security on
document?
Pain Points:
All Manual work
Time consuming
Repeatative work
Risk of Error
No Review.
Will get caught on Ex date though
warning in EMS
Work with Corporate Actions. Can they utilize
Actions Exchange to pull this information? Would
they benefit from knowing the schedule in
advance? (Work load balancing)
Yes
Yes
Done
Print copies for
team
Start
Open Dividend
Calendar report
from desk
Yes
No
No
No
No
 Cross-site continuity
 Employee engagement
and empowerment
 Employee skill development
MMK Dividend Calendar Process - AFTER
Open Dividend
Calendar from
Desk
DoneStart
From Bloomberg
terminal, save
required data to
shared drive.
Click Bloomberg
macro
Click macro to
transfer data to
Word Calendar
format (Email is
sent to team)
Actual ANA Example
Associates in Action ( ANA )
14
Eureka!
Eureka! is an idea submission, tracking and reporting
system designed to support the multi-year strategy to drive
continuous improvement.
Powered by your innovative thinking, Eureka will help us
capture your ideas from process improvement to
strengthening quality, to employee engagement – no idea is
too big or too small!
Once submitted ideas are reviewed, and when appropriate,
implemented. Submitters will receive email notification on
the status of the idea as it progresses through the review
and approval cycle. There is no limit to the number of
ideas you can submit and redeemable points will be
awarded.
Eureka allows for Employees to: Benefits to the Business Include:
 Employee Engagement
 Reduction in Costs
 Reduction in Risk
 Targeted idea generation via
Eureka! Challenge
 Customer Service
 Cross Pollination
 Quality Increase
Eureka Portal
Eureka
Eureka Example
15
Standard Work
 Procedures Re-Writes
 Process Mapping
Lean Offerings
16
Procedures Re-Writes
Creating Ops Health Approved Procedures A Technical Writing team will review existing documents for:
Procedure Overview- explain who, what, when, where, how/what the procedure is
about/how does it begin/ how does it end/provide supplemental information
regarding the procedure (website, SharePoint site, training material, notes)
Procedure Time Frame- frequency, deadline, time to complete
Access Requirements- which systems are needed to complete this procedure/which
folder access is needed
Responsibility-title of associate responsible for completing this procedure
Regulatory Requirements- SSAE 16, SOX, Internal Audits
Correct Usage - of terminology, abbreviations, symbols, folder naming conventions,
titles, fund names, acronyms, inter-department naming conventions, unit naming
conventions
Manager/Lead reviews – Ensure that a manager/lead review is documented
Procedure Central View
A technical writing team headed by Op Ex will
provide a re-write of current procedures. The new
procedures will have elements of Operational
Health and will be posted to our on line repository
called Procedures Central
Procedures Re-Writes
Program Approach:
 Choose Process: Lean RM and Leadership choose high
risk procedures for Lean to map and document.
 Create Process Maps: Lean team and BU working team
create detailed maps and SIPOCS for chosen process.
 Create Outline: Take completed process map and roll
tasks into chapters and sub topics to create an outline
document to guide SME and Technical Writer in authoring
procedure.
 Compare Procedures: If available take current state
procedure and compare and contrast to newly created
process. BU is to load all available procedures on LEAN
Procedures SharePoint for access.
 Create New Procedures: BU SME and Tech writer
create, test, and validate procedure.
 Maintain Procedures: BU maintains changes and edits
to procedure as process changes, Procedure Central
updates assisted by LEAN team.
17
Standard Mapping ( Defining a standard process )
Benefits of Standard Mapping:
 End to End Process Map
 Defined Standard Process
 SIPOC
Program Approach:
 SIPOCS and Std. Maps: are created by Ops Ex
facilitator and business SMEs.
 Task Level of Map Details Include:
 Process steps for all stakeholders and
organizations within process ( swim lanes )
 Controls such as checklists, reviews, SAS 70,
etc. identified at appropriate point in process
 Phase identification if applicable
 Supplemental Map Information may Include:
 Metrics Capture Points
 Data tables
 Legend
 Date created, author, process owner,
approver, etc
 Understanding of where
reviews/controls are located
 Metrics Defined in process flow
Standard Map
Standard Mapping
Asset Diversification Test – (ADT)
Pre-Audit
Treasure’s
Office
Bloomberg
Fund
Accounting
Custody
Auditor
Tax
Manager
Tax
Analyst
No No
Yes
TO Resolves
Issues
Resend to Tax
Yes
Yes
No
Yes
No
Yes
Make Necessary
Corrections
Does Fund
Pass ?
Is Security over
5% or 25% ?
Perform Look
Through Analysis
Is a CIP ?
Review and Clear
Warnings
Perform 50% and
25% Tests
Research and
Identify cause in
E-Tax
Manually Adjust
E-Tax for Non-
Qualified Asset
Perform Manual
Adjustments
Do They Match ?
Is it a Swap ?
Does Fund
Hold Complex
Securities ?
Analyze Excel
Export for
Securities over 5%
or 25%
Notify Manager
R336
FOCASReport
Determine India
Work
Set ADT Schedule
R711 FOCAS
Report
Prove out Market
Value and Cost
Refresh ADT in
E-Tax
Bloomberg Data
Date Created : 1/9/2012
Author : Tony Valdepenas
Owner : Fund Admin, Tax, 40 ACT
Manager : Tom Geary
Sourcing : Lite Work Stream
Version : 1.2
Approver : Brian Kobelski
Initial and Sign Off/
Check In
Create Workflow in
Livelink
Manager Reviewsr
Does Fund
Pass ?
Final Review
Send Workflow to
Auditors
Is it Correct
No
Yes
Receive PDF
Workflow
Are there
comments ?
No End
Yes
Yes Yes
R
C
2A
P
RM
C
43C
P
60 Mins 90 Mins
60 Mins 15 Mins
90 Mins
10 Mins
Production
Lead Time = 300 Mins
Processing Time = 220 Mins
120 Mins
Create PDF in
LInvelink
Receive PDF
Assemble
back up ain
ADT Folder
Legend
P
R
C
2A
M
Standard Maps:
Enables the user to understand a process or sub-process
through graphical representation. A process map can vary in
levels of detail and is an effective way to educate on a process
and identify opportunities for improvement. It represents the
components of the process under analysis (within scope)
showing inputs, outputs, paths, actions, decisions, control
points and ultimately, completion.
Deliverables include:
 SIPOC templates
 Standard process maps
18
Operational Best Practices
 Change Management
 Eureka Ambassadors
 Huddles
 Ops Excellence Champions
 Procedure Execution Support
 Supplier Quality Management
Lean Offerings
19
Change Management (Standardizing the way we make change)
Change Management captures the operation
related changes, including but not limited to: process,
procedure, work instruction, tools, etc., in order to ensure
change implementation is documented and standardized
across the business.
Activities include:
 PCR submission
 Risk assessment if necessary
 Dashboard published onto Tableau
 Updating of Ops Health scorecard
 Update Categorization Framework
Checkpoint
Program Approach:
 Process Change Requests (PCR’s ): are submitted to
Ops EX for Quality, Risk, and Lean evaluation.
 Approval: of PCR drives change implementation per
direction of Ops Excellence coordinator and ensures
Procedures Central and other process procedure controls
are updated with changes made.
 Monitoring: of change results is conducted by business
and Ops Ex with updating of Ops Health metrics ( monthly
dashboard ) and Categorization Framework.
 Monthly Reporting: tracks all PCR’s and improvement
results achieved.
Change Management
Benefits to the Business Include:
 Formal process for PCR requests
 Process standardization following change implementation
 Ability to track performance improvement as result of process changes
20
Eureka! Ambassadors ( Igniting Innovation )
Eureka! Ambassadors Program enables associates to own
the Eureka Idea program, motivate the creation of an innovative
problem solving culture, and cultivate the Community within the
Business Unit.
“Establish a workplace fueled by perpetual innovation by:
• increasing awareness of the Eureka tool
• fostering solution-oriented communication between groups
• recognizing exceptional work
Eureka Ambassadors will serve as catalysts in the creation
of ideas that align resources and goals”
Excite, Encourage
& Empower!
Be a
Resource
to your
Business!
Reward &
Recognize!
Benefits to the Business Include:
 Increase Eureka participation/implementation rate
 Increase ROI on the ideas ( Efficiency and Quality Gains )
 Increase Employee Engagement
Program Approach:
 Selection of Ambassadors: volunteers who have contributed
ideas in Eureka and are considered top Eureka submitters.
Ambassadors are typically associates from the floor or Manager
level.
 Commitment: consists of weekly meetings of 1-2 hours where
recommendations are reviewed, prioritized, and supported for
implementation.
 Implementation: of improvement recommendations for the
business is the major focus.
 Recognition: for the best ideas are included in the program and
awards presented on a routine basis.
Eureka Ambassadors
21
Huddles ( Effective Communication )
Huddles
Huddles provide an effective and efficient way to
communicate Best Practices, Metrics, Problems, Daily topics, and
Administrative information across a team.
 PROVIDE huddle training
 DEFINE metrics and set-up huddle boards
 SURVEY associates and conduct manager meetings
 EVALUATE huddles
 CONDUCT feedback sessions with managers & teams
 IMPLEMENT training for continuous improvement
Benefits to the Business Include:
 Improved employee engagement and team morale
 Enhanced communication among team members
 Improved metrics trending
 More effective problem resolution
 Increased remediation of issues
 Better risk management
 Increased process improvements and efficiencies
 Daily Huddles: drive the communication needed to prepare for the
day by reviewing current operational status, previous 24 hour
performance, prioritizing tasks, implementing change, and
preventing risk.
 Ops Ex: provides he experience and skill to establish team huddles
where needed, develop an assessment tool to monitor huddle
effectiveness, engage managers to understand their perspective,
provide onsite observations to determine if gaps exist between
associate and manager perspectives, and provide feedback and
coaching to teams.
Program Approach:
22
Ops Excellence Champions ( Bridging the gap to Operational Excellence )
Ops Excellence Champions represent a select group of
tier 3 leaders from the business who are accountable for a major
role in the planning and execution of strategic and tactical
Operations Excellence initiatives; as well as the cultivation of Ops
Excellence across the business. Mid level managers capable of long
range planning as well as short term execution typically comprise
the resource pool of candidates for Ops Excellence Champions.
Benefits to the Business Include:
 Leadership development for middle management level
 End to end exposure to Operational Excellence platform
 Lean skills development through training, coaching, and mentoring
 Business performance improvement and growth
Ops Excellence Champions
Program Approach:
 Selection of Champions: Tier 3 mid level managers who have
demonstrated Operations Excellence capability and play a
significant role in the organization’s strategic planning and
execution.
 Commitment: consists of weekly meetings of 2-3 hours for
strategy development, annual and other planning, performance
review, and Ops Excellence event monitoring.
 Relationship Management: Capable of interacting and
communicating at every level of the organization and developing
a team relationship with the Business and Ops Excellence RM’s.
 Delivery: of improved performance across the business.
23
Procedure Execution Audit ( The right procedures being used properly )
 Existence of required procedures
 Usability of required procedures
 Validation of effectiveness of required
procedures
 Proper metrics in place to monitor and
evaluate performance
Procedure Execution Audit (PEA) ensures that
controlled operations plans and process steps are being
executed by qualified individuals in accordance with
appropriate procedures and controls in an ongoing audit effort.
Executing a PEA confirms…
Procedure Execution Audit
Program Approach:
 Controls Director: creates and publishes a monthly
procedures schedule for audit.
 Evaluation: by the Controls Director of randomly
selected associate performing scheduled procedure;
reviews P&P content, associate compliance, appropriate
metrics, and effectiveness of control.
 Audit Findings: are published and reacted to
accordingly with action plans, actions, and re-visits as
determined necessary.
 OP’s Health Performance Metrics: are updated if
required.
Benefits to the Business Include:
 Updated and routinely evaluated controls in place within the process
 Standardized procedures and compliance with their utilization
 Improved Quality and reduced risk / incident reduction
24
Supplier Quality Management ( Improving Supplier Quality into your process)
Collect
Data
Analyze
Corrective
Action
Program Approach:
 Incident Reporting: by Business teams ( Quality and
Operations organizations ) identify supplier
related incidents .
 Data Collection: from various data bases and other sources
lead to short tem or longer term trend analysis resulting in
root cause determination.
 Cross Team: efforts consisting of Supplier, Operations, and
Quality groups lead to corrective action recommendations,
and implementation to prevent reoccurrence.
 OP’s Health Improvement: through input issue reduction.
Benefits to the Business Include:
 Improved Supplier Quality
 Client satisfaction
 Incident and risk reduction ( Improved Output Quality )
 Cost reduction
Incident Reduction
Supplier Quality Management
Supplier Quality Management captures the
supplier related quality issues and help Business
teams to identify root cause of input issues,
implement corrective actions, and reduce down
stream incident risk.
25
Lean Training Opportunities
 Business Certified ANA Facilitators
 Lean Simulation
 Six Sigma Training
Lean Offerings
26
Business Certified ANA Facilitators ( ANA SME’s from within the business)
Business Certified ANA facilitators leading
the way on continuous improvement
efforts across the business!
Benefits to the Business Include:
 Business SME for the facilitation
of ANA’s
 Lean culture growth across
business
 Operational performance
opportunity
Associates at any level are recommended by the business
to undergo training in the facilitation of ANA’ across the
business. ANA standard approach ( DMAIC ) is taught in
the classroom along with basic Lean principles and a full
tool kit to utilize while conducting ANA’s.
Program Approach:
 Manager: selection of candidate based upon
performance and leadership ability.
Training: in the Basic Principles of Lean and six
fundamental tools.
 Demonstrated: knowledge of principles and tools.
 Participation: in two ANA’s as a team member.
Successful: facilitation of at least one ANA with
measurable results.
 Scheduled: plan of a minimum of three ANA’s to
be conducted over a 12 month period with Manager
approval.
Make change in a day or two !
 Employee engagement and
empowerment
 Employee skill development
Certification
DATE MANAGER
This certificate represents the successful completion of training for the Associates in
Action Facilitator Program.
Basic Lean Principles
Process Mapping
Brainstorming Techniques
AffinityDiagrams
Cause Effect Analysis
Pareto Diagram Analysis
FMEA
Certified ANA Facilitators
27
Lean Simulation (Hands-on experience with Lean techniques)
Lean Simulations provide clarity on how
Lean principles and techniques impact
processes and people.
Benefits to the Business Include:
 Exposure to Lean principles in
action
 Promote team camaraderie
 Can test real process in safe
environment
Simulation is an effective teaching tool that makes Lean
concepts easy to grasp. This is primarily due to the active
participation of individuals applying Lean techniques and
methods to a realistic simulated situation where their
decisions impact the results from influencing environmental
variability.
 Scale to need of group, team, or
department
Build individual confidence
 Ease of absorbing knowledge for
quicker reapplication
Actual Lean Simulation Example
You will leverage Lean Simulation if you want to:
 Have your team learn a specific set of Lean tools in a
short period of time
 Promote teamwork in solving problems
 Encourage your team to seek and reapply best practices
Program Approach :
 Contact: Operations Excellence team.
 Determine: a business process to be simulated.
 Identify: wastes in process.
 Determine: Lean tools to address waste .
 Build: simulation model.
 Test and Refine: simulation model.
Begin to make changes from real experience!
Lean Simulation
28
Lean Six Sigma Training Program ( Yellow – Green – Black )
Lean Six Sigma training can impact the
performance of an operation and change
the way it is managed.!
Benefits to the Business Include:
 Efficiency gains
 Quality improvement
 Measurable results
 Mitigated risk
Associates at all levels are trained in the principles of
Lean Six Sigma achieving formal certification at the
various belt levels as they progress through the
training. Lean projects are required at the Green and
Black Belt levels with measurable results required in
order to certify. Control processes, gain efficiencies,
and improve overall performance.
Program Approach:
 Selection: of qualified candidates with standard
criteria and business recommendations being key to
the selection process.
 Six Sigma Training: at the following levels by
certified SME’s:
Yellow Belt ( 8 hr class in basic principles & tools )
Green Belt ( Includes Lean project )
Black Belt ( Includes major Lean project )
 Successful Completion: at each level prior to
review
and selection for advancement to next level.
 SME: as Certified Black /Green Belt project lead for
business improvement projects or improvement SME
as a Certified Yellow Belt.
 Process standardization
 Employee engagement
and empowerment
 Employee skill development
 Changing the way of managing the
operation
Become an SME of Lean Tools and Improve Operational Performance!
CAUSES
Cause and Effect Analysis Diagram
Lean Six Sigma Training
29
Incident Management
 Intake and Triage
 Root Cause Analysis and Solutioning
 Analysis and Reporting
Quality Offerings
30
Ops Excellence Incident Management (Intake and Triage)
Benefits to the Business Include:
 Independent and objective assessment of the Incident
 Dedicated subject matter expertise and broader/deeper insights
 Capacity extension capabilities through the use of Quality
 One Point of Contact through Incident life cycle
Incident Management
Program Approach:
 Intake: Incidents are identified and self-reported by the
Business. Incident Severities are rated 1 - 4 based on a pre-
established criteria which considers among other factors
duration, customer and financial impact.
 Capture: Upon reporting an incident, Quality engages with
the Incident Manager and provides an objective and
independent assessment of the incident cause classification
and Severity rating. Incident details are retained in a Quality
Team managed database.
 Response: The Quality Team provides advisory services to
the Business to assist with issue containment where
applicable and facilitates communications with the wider
organizational audience or stakeholders as needed.
Intake Capture Response
Solution &
Implement
Closure
Trending,
Research &
Response
Reporting
Intake & Triage Root Cause Analysis & Solutioning Analysis & Reporting
Root Cause
Analysis
31
Ops Excellence Incident Management (Root Cause Analysis & Solutioning)
Benefits to the Business Include:
 True root cause is identified
 Independent Solution implementation oversight
 Infrastructure development advice (e.g. controls etc)
 Detailed Incident life cycle records
Incident Management
Program Approach:
 Root Cause Analysis: Through the use of
various tools ( e.g. Process Mapping, ensuring
Root Cause with 5 Why’s, FMEA, Affinity
Diagrams) we assist the Business to understand
and identify the real causes of incidents.
 Solution and Implement: Based on the
identified root causes , clear and actionable
solutions are identified. Through the use of the
Incident Database, implementation efforts are
tracked and reported accordingly.
 Closure: Provide assistance to ensure all
necessary steps were performed prior to
incident closure.
Intake Capture Response
Solution &
Implement
Closure
Trending,
Research &
Response
Reporting
Intake & Triage Root Cause Analysis & Solutioning Analysis & Reporting
Root Cause
Analysis
32
Ops Excellence Incident Management (Analysis & Reporting)
Benefits to the Business Include:
 Availability of fact based/data driven decision making information
 Drive holistic vs. ‘stop gap’ individual level issue resolutions
 Confirmation of identified areas of process improvement/focus
 Availability of regular and insightful Management Reports
 Business performance improvement and growth
Incident Management
Program Approach:
 Trending, Research and Response: We
utilize incident trending analysis to recommend
focused remediation efforts and continuous
process improvements. The trending
information also allows the Business and other
key stakeholders such the Risk to make the
distinction between matters indicative of
significant process deficiencies vs. random
variations.
 Reporting: Utilizing applications such as
Tableau, we provide real-time, interactive views
that allow the Business and other Stake Holders
to manipulate Incident data views and
confirm/validate different hypothesis or
dispense of their various Incident related
reporting obligations.
Intake Capture Response
Solution &
Implement
Closure
Trending,
Research &
Response
Reporting
Intake & Triage Root Cause Analysis & Solutioning Analysis & Reporting
Root Cause
Analysis
33
Q.C. Events
Supporting Execution
Quality Offerings
34
Quality Check Events (Supporting Execution )
QC Events Program provides complimentary and
collaborative activities that ensure rigor and discipline
around transaction execution and provides a secondary,
parallel review of final outputs in outputs. Events can be
proactive or reactionary based on the situation.
“Provide rigor and independent
perspectives that help Business
Teams execute to quality standards in
various operating conditions”
Benefits to the Business Include:
 Assurance – partnering in advance or in real-time to enable success
 Validation – ensuring successful execution; second set of eyes
 Testing – post implementation affirmation of effective execution
 Perspective – working across business units for optimal solutions
 Control – bringing discipline to ad hoc processing environment
Program Approach:
 Initiation: Push or Pull, Quality team works with
Operations Leaders, Managers and Analysts to
identify and mitigate the risk involved when
processing Non- Standard, Complex, High Pressure
or Change Related transactions.
 Execution: Team works when you work, to ensure
your processing is accurate when it matters most – so
the relied upon records are correct when they need
to be correct. Team will opine on Controls design
and operating effectiveness where applicable during
the process.
 Results: Team packages and presents results via
initial e-mal notification, and ultimately, through
delivery of work papers and closing memo detailing
findings and improvement opportunities where
applicable
QC Events
35
Operations Health Assessment
 Procedure, Review, and Training
Quality Offerings
36
Operations Health Assessment ( pulse check )
Operations Health Assessment compares
performance against industry standard foundational
quality elements by providing insight into opportunities
and improvements at the process level.
“Ops Health Assessments help business leaders
understand where they are, and how they can
continue to improve over time”
Benefits to the Business Include:
 Industry Standard – Operations Excellence partnered with E&Y to
apply industry standard perspectives to unit specific challenges
 Process Level – allows business leaders and managers to identify
model teams and processes, and areas requiring immediate triage
 Detailed Insights – teams receive custom feedback and notes on
specific challenges within the Foundational Quality Elements
Program Approach:
 Training: Formal classroom, e-learning or structured
on the job training is designed and documented at
the technical job requirements level; training content
is consistent with procedures; effectiveness and
adoption is measured.
 Manager Reviews: Transactions and instructions
are classified as requiring an independent validation
by a trained employee who confirms that
transactions or interpretations of written instructions
are consistent to written policies and procedures.
 Procedures: Procedure contains a clear business
scope, and content is aligned to the work; defines
task ownership, activity instruction, control steps and
escalation protocols; the procedure is centrally
located and available, and effectiveness is measured.
Operations Health Assessment
Training
Manager
Review
Procedures
37
Operational Controls
 Control Directors
Quality Offerings
38
Control Directors
Control Directors are responsible for the continuous
improvement of the control environment through
collaborative development, implementation, and
maintenance of control activities. Control Directors work
closely with the Business to enhance processes through the
use of best practices, improved control activities and
increased internal control awareness.
Control Directors
Program Approach:
 Continued Improvement: Control Directors and/or
business owners identify areas for potential
improvement based on current or past incidents or
processes in need of improvement.
 Best Practices: Control directors collaborate with the
process owners to improve controls through knowledge
sharing and thought leadership
 Team Development: Process owners receive training
that improves their risk and controls awareness.
 Design and Operating Effectiveness Opinions:
Control Directors and Business owners evaluate ongoing
operations to ensure continued execution of process
controls and their design effectiveness.
Benefits to the Business Include:
 Standard, consistent and predictable control environment
 Allow focus on continuous improvement
 Improved ability to proactively identify risks and proactively
implement successful control activities to mitigate them
 Business Unit aligned control knowledgeable resources
Continued
Improvement
Best
Practices
Team
Development
Oversight
Trusted advisors with a commitment
to continuous control and process
improvement

Offering Booklet Draft - Generic

  • 1.
    Operations Excellence Offerings Acustomized approach to achieve results. Create and sustain an operations excellence culture
  • 2.
    2 Ops Excellence Mission Partnerwith operations and systems teams: to continually improve the quality, timeliness and efficiency of processes and deliverables, as well as to increase associate engagement. Develop the culture and implement the infrastructure required to support continuous improvement within the organization. Rapidly respond to incidents, providing subject matter expertise on issue containment, root cause analysis, solution development and implementation as well as management reporting. Assess and validate processes and controls are performing as intended. Be recognized as operations excellence professionals; training future leaders with skills required to succeed in operations. Mission
  • 3.
    3 Lean Offerings  TaskTimeliness Tool  Review Tool  Capacity Model  Kanban  Metrics Support and Development 6 page Table of Contents Performance Management Lean Offerings  WorkStreams  ANA’s  Eureka Continuous Improvement  Procedures Re-Writes  Process Mapping Standard Work Operational Best Practices  Change Management  Eureka Ambassadors  Team Huddle Support  Ops Excellence Champions  Procedure Execution Audit  Supplier Quality Management 7 9 8 10 12 13 14 16 17 19 20 23 21 24 22
  • 4.
    4 Lean Offerings (cont. )  ANA Business Facilitator Training program  Lean Simulator  Lean Six Sigma Training 28 page Table of Contents ( cont. ) Lean Training Opportunities Lean and Quality Offerings  Intake and Triage  Root Cause Analysis and Solutioning  Analysis and Reporting Incident Management  Support Execution QC Events Quality Offerings Operations Health Assessment  Procedure Review and Training  Control Directors Operational Controls 27 26 32 31 30 34 36 38
  • 5.
    5 Performance Management  TaskTimeliness Tool  Review Tool  Capacity Model  Kanban  Metrics Development and Support Lean Offerings
  • 6.
    6 FloMotion (Visual Management)– The visualization of process progression Task Timeliness Benefits to the Business Include  Increased process transparency  Improved rigor to follow process  Proactive issue avoidance Example FloMotion (Visual Management) provides transparency and consistent data. FloMotion is a visual management tool that provides transparency into the status of work in progress. This transparency mitigates the risk of missing daily and other task deadlines in routine operations. Tasks are visually presented in sequence as they approach their deadlines and tracked and reported on for timeliness. Data is trended for analysis and improvement opportunities. Real time visual management enables: the  Resolution of issues before they impact delivery  Structured accountability for process discipline  Development of consistent performance indicators Task Timeliness  Timely resolution  Measurable performance data  Issue tracking Program Approach :  Daily Tasks: visually appear on a desktop or centrally located monitor15 mins. prior to their scheduled delivery time. Completion timeliness is visually indicated and tasks not completed on time have non timeliness cause data entered into the tool and categorized for analysis purposes.  Daily Performance: for Task Timeliness is reported at a given point in time during the work day for actual vs. scheduled.  Routine review: of daily performance drives process control and quick response to task timeliness issues.  Trending analysis of available data and reporting, enables solutions to long term problems and provides valuable insight for organization training focus needs.  Process Improvement through the development of recommendations as the result of tool data analysis.
  • 7.
    7 Review Tool (Managing the review process on a day to day basis and making improvement long term ) Review Tool The Review Tool provides daily and trending reporting capability for day to day management and long term improvement of review process First Pass Accuracy. Benefits to the Business Include:  Review process control and improvement  Process standardization  Efficiency gains  Identification of training needs  Improved quality of process  Mitigated risk downstream Program Approach:  Data collection on a daily basis for failed reviews, failed categories, comment details, etc., provide valuable information for process control, improvement, and prevention of errors.  Routine review of daily performance drives process control and quick response to current process issues and quality concerns.  Trending analysis of available data and reporting, enables identification of reoccurring problems and provides valuable insight for organization training focus needs.  Process Improvement through the development of recommendations as the result of tool data analysis. First Pass Accuracy Trending Data The Review Tool drives review process control and improvement, is a predictive indicator of changes in performance, and can reduce negative downstream impacts overall.
  • 8.
    8 Capacity Models (Understanding Supply and Demand / making well informed staffing decisions ) Staffing models built upon measured core operational demand and driven by defined associate profiles with work-force experiential factors included ; provide resource data which clearly describe the available resource supply required to meet daily demand. Data from the model can be used to analyze current operational capacity, the ability to take on project work and other additional demand, or to forecast future demand requirements. Capacity Models help managers make staffing decisions based upon data as well as experience. Benefits to the Business Include:  Well informed staffing decisions  Right sized organizations  Efficiency gains  Enhanced planning  Identification of required training needs  Mitigated risk Program Approach:  Identify required daily operational demand across the organization (e.g. tasks).  Measure the average daily operational demand for an organization.  Define the desired associate profile for a typical day in the life of an associate.  Factor in experience levels of associates, non routine demand, and other considerations which impact the amount of resource supply  Run the model and measure capacity making informed staffing decisions. -40.00% -30.00% -20.00% -10.00% 0.00% 10.00% 20.00% 30.00% %Physical %Equivalent Team Staffing Supply vs Demand Capacity Model
  • 9.
    9 Kanban – (A visual display of the workflow and constraints ) Benefits to the Business Include:  Easier to see and understand workflow  Maximized throughput and First Pass Accuracy  Reduced Backlog and overall WIP  Diminished resolution time  Quicker recognition of improvement opportunities Time to implement can be as soon as one day! Kanban Example Kanban Program Approach Kanban is a catalyst for change through small, incremental improvements to your existing process Kan means “visual,” and ban, means “card” or “board.” It is a signaling system to trigger action and uses cards to signal need for work to be done. You will leverage Kanban if you want to:  Maximize workflow while prioritizing issues in conjunction with driving individual accountability.  Quickly see constraints and influence the entire team to work harmoniously to manage the constraint through the process.  Introduce change with minimal resistance to increase customer satisfaction and decrease delivery time. Proactive issue avoidance  Ability to document and analyze repetitive bottlenecks, themes, and issues Higher individual and team accountability to drive positive process changes and process adherence  Proactive issue avoidance  Ability to document and analyze repetitive bottlenecks, themes, and issues Kanban
  • 10.
    10 Metrics Support (Ops Health Views, Process KPI’s, and other.) Activities include:  Ops Health Monthly Views support for long term improvement across all major business groups.  Development of Key Performance Indicators (KPI’s ) to manage daily operations within a group.  Reporting, analysis, and improvement recommendations Program Approach:  Key Performance Indicators ( KPI’s ): are identified and defined with the business for use in Monthly Ops Health Views or as metrics to manage daily operations.  Development: of dashboards for reporting and the collection of trending data for analysis and improvement.  Identification: of opportunities for performance improvement in Quality or Efficiency.  Planning and Implementation: of improvement recommendations based upon data analysis. Metrics Support Benefits to the Business Include:  Increased insight and transparency into your processes  Accountability and process discipline  Proactive issue avoidance and/or timely resolution  Analyzable data  Consistent performance data  Ability to identify and substantiate common themes, issues, and bottlenecks Clearly defined and measurable metrics within an organization allows the organization to understand it’s operational performance and paves the way for improvement.
  • 11.
    11 Continuous Improvement  WorkStreams ANA’s  Eureka Lean Offerings
  • 12.
    12 WorkStreams ( Majorprocess improvements, organizational changes, and more ) WorkStreams Business teams led by LEAN SME’s engage in process standardization, metric based analysis, and idea creation, resulting in the implementation of process improvement and organizational change recommendations. Teams are trained in basic principles of “LEAN” and apply those principles during the WorkStream and after. WorkStreams deliver improvement in process performance and overall efficiency. Program Approach:  Organize WorkStream Team: and engage as many members of the organization as possible as full or extended team members.  Facilitate Lean Skills Training: to team members and others:  SIPOC, Process Mapping, Pareto Charts, FMEA, Brainstorming & Affinity Diagram techniques, Fishbone Diagrams, and Run Charts  Standardize, Analyze, and Improve: processes as well as organizational roles and responsibilities while driving improvement in overall performance.  Note: A typical WorkStream takes 3 months ( longer if necessary ) to complete and engages a core team of 6 to 8 business partners with a time commitment which can vary between 10 to 25%> Benefits to the Business Include:  Process standardization  Improved efficiency and quality  Metrics development and measurable results  Mitigated risk  Well defined roles and responsibilities  Improved supplier performance  More efficient hand-offs between business partners Actual WorkStream Example 0 2,000 4,000 6,000 8,000 10,000 12,000 J F M A M J J A S O N D COG Monthly Volume Trend Data ( 2009 thru 2011 YTD ) 2009 2010 2011 2009 Pos 2010 Pos 2011 Pos
  • 13.
    13 Program Approach:  Facilitate:Intro to Lean / Basic Principles.  Deliver: a Tool Kit of Lean skills:  SIPOC, Process Mapping, Pareto Charts, FMEA, Brainstorming & Affinity Diagram techniques, Fishbone Diagrams, and Run Charts  Conduct: routinely scheduled ANA events  Using a DMAIC Approach  Define  Measure  Analyze  Improve  Control  100% participation from all levels of team  Implementation a guarantee Train and Certify Business Facilitators: and become self sustaining. Transition: program to the business. Associates in Action ( Small improvements continuously ) ANA’s Create a self-sustaining Lean culture for process improvement ! Benefits to the Business Include:  Monthly efficiency gains  Increased quality of work  Measurable results  Mitigated risk  Process standardization Associates in Action empowers employees to drive small continuous improvements in a short period of time. The goal of the program is to create a Lean culture that will sustain the program without the support of the Lean team. Make change in a day or two ! MMK Dividend Calendar Process - BEFORE Enter Start & End Date. Click Clean up & Load Data. Save & close Open Dividend Calendar Spreadsheet from Bloomberg Hit Bloomberg Macro. Print document once data is loaded Is fund “In Nav” Dividend No Add Security to appropriate Ex Date on “In- Nav”Calendar Is fund already on calendar under appropriate date? Add Security to appropriate Pay Date on “Ex-Pay” Calendar Look up Analyst who prepares fund & add initials next to fund # Is fund already on calendar under appropriate date? Is fund already on calendar under appropriate date? Look up Analyst who prepares fund & add initials next to fund # Starting from top of document, look at each security No Is this last security on document? Is this last security on document? Pain Points: All Manual work Time consuming Repeatative work Risk of Error No Review. Will get caught on Ex date though warning in EMS Work with Corporate Actions. Can they utilize Actions Exchange to pull this information? Would they benefit from knowing the schedule in advance? (Work load balancing) Yes Yes Done Print copies for team Start Open Dividend Calendar report from desk Yes No No No No  Cross-site continuity  Employee engagement and empowerment  Employee skill development MMK Dividend Calendar Process - AFTER Open Dividend Calendar from Desk DoneStart From Bloomberg terminal, save required data to shared drive. Click Bloomberg macro Click macro to transfer data to Word Calendar format (Email is sent to team) Actual ANA Example Associates in Action ( ANA )
  • 14.
    14 Eureka! Eureka! is anidea submission, tracking and reporting system designed to support the multi-year strategy to drive continuous improvement. Powered by your innovative thinking, Eureka will help us capture your ideas from process improvement to strengthening quality, to employee engagement – no idea is too big or too small! Once submitted ideas are reviewed, and when appropriate, implemented. Submitters will receive email notification on the status of the idea as it progresses through the review and approval cycle. There is no limit to the number of ideas you can submit and redeemable points will be awarded. Eureka allows for Employees to: Benefits to the Business Include:  Employee Engagement  Reduction in Costs  Reduction in Risk  Targeted idea generation via Eureka! Challenge  Customer Service  Cross Pollination  Quality Increase Eureka Portal Eureka Eureka Example
  • 15.
    15 Standard Work  ProceduresRe-Writes  Process Mapping Lean Offerings
  • 16.
    16 Procedures Re-Writes Creating OpsHealth Approved Procedures A Technical Writing team will review existing documents for: Procedure Overview- explain who, what, when, where, how/what the procedure is about/how does it begin/ how does it end/provide supplemental information regarding the procedure (website, SharePoint site, training material, notes) Procedure Time Frame- frequency, deadline, time to complete Access Requirements- which systems are needed to complete this procedure/which folder access is needed Responsibility-title of associate responsible for completing this procedure Regulatory Requirements- SSAE 16, SOX, Internal Audits Correct Usage - of terminology, abbreviations, symbols, folder naming conventions, titles, fund names, acronyms, inter-department naming conventions, unit naming conventions Manager/Lead reviews – Ensure that a manager/lead review is documented Procedure Central View A technical writing team headed by Op Ex will provide a re-write of current procedures. The new procedures will have elements of Operational Health and will be posted to our on line repository called Procedures Central Procedures Re-Writes Program Approach:  Choose Process: Lean RM and Leadership choose high risk procedures for Lean to map and document.  Create Process Maps: Lean team and BU working team create detailed maps and SIPOCS for chosen process.  Create Outline: Take completed process map and roll tasks into chapters and sub topics to create an outline document to guide SME and Technical Writer in authoring procedure.  Compare Procedures: If available take current state procedure and compare and contrast to newly created process. BU is to load all available procedures on LEAN Procedures SharePoint for access.  Create New Procedures: BU SME and Tech writer create, test, and validate procedure.  Maintain Procedures: BU maintains changes and edits to procedure as process changes, Procedure Central updates assisted by LEAN team.
  • 17.
    17 Standard Mapping (Defining a standard process ) Benefits of Standard Mapping:  End to End Process Map  Defined Standard Process  SIPOC Program Approach:  SIPOCS and Std. Maps: are created by Ops Ex facilitator and business SMEs.  Task Level of Map Details Include:  Process steps for all stakeholders and organizations within process ( swim lanes )  Controls such as checklists, reviews, SAS 70, etc. identified at appropriate point in process  Phase identification if applicable  Supplemental Map Information may Include:  Metrics Capture Points  Data tables  Legend  Date created, author, process owner, approver, etc  Understanding of where reviews/controls are located  Metrics Defined in process flow Standard Map Standard Mapping Asset Diversification Test – (ADT) Pre-Audit Treasure’s Office Bloomberg Fund Accounting Custody Auditor Tax Manager Tax Analyst No No Yes TO Resolves Issues Resend to Tax Yes Yes No Yes No Yes Make Necessary Corrections Does Fund Pass ? Is Security over 5% or 25% ? Perform Look Through Analysis Is a CIP ? Review and Clear Warnings Perform 50% and 25% Tests Research and Identify cause in E-Tax Manually Adjust E-Tax for Non- Qualified Asset Perform Manual Adjustments Do They Match ? Is it a Swap ? Does Fund Hold Complex Securities ? Analyze Excel Export for Securities over 5% or 25% Notify Manager R336 FOCASReport Determine India Work Set ADT Schedule R711 FOCAS Report Prove out Market Value and Cost Refresh ADT in E-Tax Bloomberg Data Date Created : 1/9/2012 Author : Tony Valdepenas Owner : Fund Admin, Tax, 40 ACT Manager : Tom Geary Sourcing : Lite Work Stream Version : 1.2 Approver : Brian Kobelski Initial and Sign Off/ Check In Create Workflow in Livelink Manager Reviewsr Does Fund Pass ? Final Review Send Workflow to Auditors Is it Correct No Yes Receive PDF Workflow Are there comments ? No End Yes Yes Yes R C 2A P RM C 43C P 60 Mins 90 Mins 60 Mins 15 Mins 90 Mins 10 Mins Production Lead Time = 300 Mins Processing Time = 220 Mins 120 Mins Create PDF in LInvelink Receive PDF Assemble back up ain ADT Folder Legend P R C 2A M Standard Maps: Enables the user to understand a process or sub-process through graphical representation. A process map can vary in levels of detail and is an effective way to educate on a process and identify opportunities for improvement. It represents the components of the process under analysis (within scope) showing inputs, outputs, paths, actions, decisions, control points and ultimately, completion. Deliverables include:  SIPOC templates  Standard process maps
  • 18.
    18 Operational Best Practices Change Management  Eureka Ambassadors  Huddles  Ops Excellence Champions  Procedure Execution Support  Supplier Quality Management Lean Offerings
  • 19.
    19 Change Management (Standardizingthe way we make change) Change Management captures the operation related changes, including but not limited to: process, procedure, work instruction, tools, etc., in order to ensure change implementation is documented and standardized across the business. Activities include:  PCR submission  Risk assessment if necessary  Dashboard published onto Tableau  Updating of Ops Health scorecard  Update Categorization Framework Checkpoint Program Approach:  Process Change Requests (PCR’s ): are submitted to Ops EX for Quality, Risk, and Lean evaluation.  Approval: of PCR drives change implementation per direction of Ops Excellence coordinator and ensures Procedures Central and other process procedure controls are updated with changes made.  Monitoring: of change results is conducted by business and Ops Ex with updating of Ops Health metrics ( monthly dashboard ) and Categorization Framework.  Monthly Reporting: tracks all PCR’s and improvement results achieved. Change Management Benefits to the Business Include:  Formal process for PCR requests  Process standardization following change implementation  Ability to track performance improvement as result of process changes
  • 20.
    20 Eureka! Ambassadors (Igniting Innovation ) Eureka! Ambassadors Program enables associates to own the Eureka Idea program, motivate the creation of an innovative problem solving culture, and cultivate the Community within the Business Unit. “Establish a workplace fueled by perpetual innovation by: • increasing awareness of the Eureka tool • fostering solution-oriented communication between groups • recognizing exceptional work Eureka Ambassadors will serve as catalysts in the creation of ideas that align resources and goals” Excite, Encourage & Empower! Be a Resource to your Business! Reward & Recognize! Benefits to the Business Include:  Increase Eureka participation/implementation rate  Increase ROI on the ideas ( Efficiency and Quality Gains )  Increase Employee Engagement Program Approach:  Selection of Ambassadors: volunteers who have contributed ideas in Eureka and are considered top Eureka submitters. Ambassadors are typically associates from the floor or Manager level.  Commitment: consists of weekly meetings of 1-2 hours where recommendations are reviewed, prioritized, and supported for implementation.  Implementation: of improvement recommendations for the business is the major focus.  Recognition: for the best ideas are included in the program and awards presented on a routine basis. Eureka Ambassadors
  • 21.
    21 Huddles ( EffectiveCommunication ) Huddles Huddles provide an effective and efficient way to communicate Best Practices, Metrics, Problems, Daily topics, and Administrative information across a team.  PROVIDE huddle training  DEFINE metrics and set-up huddle boards  SURVEY associates and conduct manager meetings  EVALUATE huddles  CONDUCT feedback sessions with managers & teams  IMPLEMENT training for continuous improvement Benefits to the Business Include:  Improved employee engagement and team morale  Enhanced communication among team members  Improved metrics trending  More effective problem resolution  Increased remediation of issues  Better risk management  Increased process improvements and efficiencies  Daily Huddles: drive the communication needed to prepare for the day by reviewing current operational status, previous 24 hour performance, prioritizing tasks, implementing change, and preventing risk.  Ops Ex: provides he experience and skill to establish team huddles where needed, develop an assessment tool to monitor huddle effectiveness, engage managers to understand their perspective, provide onsite observations to determine if gaps exist between associate and manager perspectives, and provide feedback and coaching to teams. Program Approach:
  • 22.
    22 Ops Excellence Champions( Bridging the gap to Operational Excellence ) Ops Excellence Champions represent a select group of tier 3 leaders from the business who are accountable for a major role in the planning and execution of strategic and tactical Operations Excellence initiatives; as well as the cultivation of Ops Excellence across the business. Mid level managers capable of long range planning as well as short term execution typically comprise the resource pool of candidates for Ops Excellence Champions. Benefits to the Business Include:  Leadership development for middle management level  End to end exposure to Operational Excellence platform  Lean skills development through training, coaching, and mentoring  Business performance improvement and growth Ops Excellence Champions Program Approach:  Selection of Champions: Tier 3 mid level managers who have demonstrated Operations Excellence capability and play a significant role in the organization’s strategic planning and execution.  Commitment: consists of weekly meetings of 2-3 hours for strategy development, annual and other planning, performance review, and Ops Excellence event monitoring.  Relationship Management: Capable of interacting and communicating at every level of the organization and developing a team relationship with the Business and Ops Excellence RM’s.  Delivery: of improved performance across the business.
  • 23.
    23 Procedure Execution Audit( The right procedures being used properly )  Existence of required procedures  Usability of required procedures  Validation of effectiveness of required procedures  Proper metrics in place to monitor and evaluate performance Procedure Execution Audit (PEA) ensures that controlled operations plans and process steps are being executed by qualified individuals in accordance with appropriate procedures and controls in an ongoing audit effort. Executing a PEA confirms… Procedure Execution Audit Program Approach:  Controls Director: creates and publishes a monthly procedures schedule for audit.  Evaluation: by the Controls Director of randomly selected associate performing scheduled procedure; reviews P&P content, associate compliance, appropriate metrics, and effectiveness of control.  Audit Findings: are published and reacted to accordingly with action plans, actions, and re-visits as determined necessary.  OP’s Health Performance Metrics: are updated if required. Benefits to the Business Include:  Updated and routinely evaluated controls in place within the process  Standardized procedures and compliance with their utilization  Improved Quality and reduced risk / incident reduction
  • 24.
    24 Supplier Quality Management( Improving Supplier Quality into your process) Collect Data Analyze Corrective Action Program Approach:  Incident Reporting: by Business teams ( Quality and Operations organizations ) identify supplier related incidents .  Data Collection: from various data bases and other sources lead to short tem or longer term trend analysis resulting in root cause determination.  Cross Team: efforts consisting of Supplier, Operations, and Quality groups lead to corrective action recommendations, and implementation to prevent reoccurrence.  OP’s Health Improvement: through input issue reduction. Benefits to the Business Include:  Improved Supplier Quality  Client satisfaction  Incident and risk reduction ( Improved Output Quality )  Cost reduction Incident Reduction Supplier Quality Management Supplier Quality Management captures the supplier related quality issues and help Business teams to identify root cause of input issues, implement corrective actions, and reduce down stream incident risk.
  • 25.
    25 Lean Training Opportunities Business Certified ANA Facilitators  Lean Simulation  Six Sigma Training Lean Offerings
  • 26.
    26 Business Certified ANAFacilitators ( ANA SME’s from within the business) Business Certified ANA facilitators leading the way on continuous improvement efforts across the business! Benefits to the Business Include:  Business SME for the facilitation of ANA’s  Lean culture growth across business  Operational performance opportunity Associates at any level are recommended by the business to undergo training in the facilitation of ANA’ across the business. ANA standard approach ( DMAIC ) is taught in the classroom along with basic Lean principles and a full tool kit to utilize while conducting ANA’s. Program Approach:  Manager: selection of candidate based upon performance and leadership ability. Training: in the Basic Principles of Lean and six fundamental tools.  Demonstrated: knowledge of principles and tools.  Participation: in two ANA’s as a team member. Successful: facilitation of at least one ANA with measurable results.  Scheduled: plan of a minimum of three ANA’s to be conducted over a 12 month period with Manager approval. Make change in a day or two !  Employee engagement and empowerment  Employee skill development Certification DATE MANAGER This certificate represents the successful completion of training for the Associates in Action Facilitator Program. Basic Lean Principles Process Mapping Brainstorming Techniques AffinityDiagrams Cause Effect Analysis Pareto Diagram Analysis FMEA Certified ANA Facilitators
  • 27.
    27 Lean Simulation (Hands-onexperience with Lean techniques) Lean Simulations provide clarity on how Lean principles and techniques impact processes and people. Benefits to the Business Include:  Exposure to Lean principles in action  Promote team camaraderie  Can test real process in safe environment Simulation is an effective teaching tool that makes Lean concepts easy to grasp. This is primarily due to the active participation of individuals applying Lean techniques and methods to a realistic simulated situation where their decisions impact the results from influencing environmental variability.  Scale to need of group, team, or department Build individual confidence  Ease of absorbing knowledge for quicker reapplication Actual Lean Simulation Example You will leverage Lean Simulation if you want to:  Have your team learn a specific set of Lean tools in a short period of time  Promote teamwork in solving problems  Encourage your team to seek and reapply best practices Program Approach :  Contact: Operations Excellence team.  Determine: a business process to be simulated.  Identify: wastes in process.  Determine: Lean tools to address waste .  Build: simulation model.  Test and Refine: simulation model. Begin to make changes from real experience! Lean Simulation
  • 28.
    28 Lean Six SigmaTraining Program ( Yellow – Green – Black ) Lean Six Sigma training can impact the performance of an operation and change the way it is managed.! Benefits to the Business Include:  Efficiency gains  Quality improvement  Measurable results  Mitigated risk Associates at all levels are trained in the principles of Lean Six Sigma achieving formal certification at the various belt levels as they progress through the training. Lean projects are required at the Green and Black Belt levels with measurable results required in order to certify. Control processes, gain efficiencies, and improve overall performance. Program Approach:  Selection: of qualified candidates with standard criteria and business recommendations being key to the selection process.  Six Sigma Training: at the following levels by certified SME’s: Yellow Belt ( 8 hr class in basic principles & tools ) Green Belt ( Includes Lean project ) Black Belt ( Includes major Lean project )  Successful Completion: at each level prior to review and selection for advancement to next level.  SME: as Certified Black /Green Belt project lead for business improvement projects or improvement SME as a Certified Yellow Belt.  Process standardization  Employee engagement and empowerment  Employee skill development  Changing the way of managing the operation Become an SME of Lean Tools and Improve Operational Performance! CAUSES Cause and Effect Analysis Diagram Lean Six Sigma Training
  • 29.
    29 Incident Management  Intakeand Triage  Root Cause Analysis and Solutioning  Analysis and Reporting Quality Offerings
  • 30.
    30 Ops Excellence IncidentManagement (Intake and Triage) Benefits to the Business Include:  Independent and objective assessment of the Incident  Dedicated subject matter expertise and broader/deeper insights  Capacity extension capabilities through the use of Quality  One Point of Contact through Incident life cycle Incident Management Program Approach:  Intake: Incidents are identified and self-reported by the Business. Incident Severities are rated 1 - 4 based on a pre- established criteria which considers among other factors duration, customer and financial impact.  Capture: Upon reporting an incident, Quality engages with the Incident Manager and provides an objective and independent assessment of the incident cause classification and Severity rating. Incident details are retained in a Quality Team managed database.  Response: The Quality Team provides advisory services to the Business to assist with issue containment where applicable and facilitates communications with the wider organizational audience or stakeholders as needed. Intake Capture Response Solution & Implement Closure Trending, Research & Response Reporting Intake & Triage Root Cause Analysis & Solutioning Analysis & Reporting Root Cause Analysis
  • 31.
    31 Ops Excellence IncidentManagement (Root Cause Analysis & Solutioning) Benefits to the Business Include:  True root cause is identified  Independent Solution implementation oversight  Infrastructure development advice (e.g. controls etc)  Detailed Incident life cycle records Incident Management Program Approach:  Root Cause Analysis: Through the use of various tools ( e.g. Process Mapping, ensuring Root Cause with 5 Why’s, FMEA, Affinity Diagrams) we assist the Business to understand and identify the real causes of incidents.  Solution and Implement: Based on the identified root causes , clear and actionable solutions are identified. Through the use of the Incident Database, implementation efforts are tracked and reported accordingly.  Closure: Provide assistance to ensure all necessary steps were performed prior to incident closure. Intake Capture Response Solution & Implement Closure Trending, Research & Response Reporting Intake & Triage Root Cause Analysis & Solutioning Analysis & Reporting Root Cause Analysis
  • 32.
    32 Ops Excellence IncidentManagement (Analysis & Reporting) Benefits to the Business Include:  Availability of fact based/data driven decision making information  Drive holistic vs. ‘stop gap’ individual level issue resolutions  Confirmation of identified areas of process improvement/focus  Availability of regular and insightful Management Reports  Business performance improvement and growth Incident Management Program Approach:  Trending, Research and Response: We utilize incident trending analysis to recommend focused remediation efforts and continuous process improvements. The trending information also allows the Business and other key stakeholders such the Risk to make the distinction between matters indicative of significant process deficiencies vs. random variations.  Reporting: Utilizing applications such as Tableau, we provide real-time, interactive views that allow the Business and other Stake Holders to manipulate Incident data views and confirm/validate different hypothesis or dispense of their various Incident related reporting obligations. Intake Capture Response Solution & Implement Closure Trending, Research & Response Reporting Intake & Triage Root Cause Analysis & Solutioning Analysis & Reporting Root Cause Analysis
  • 33.
  • 34.
    34 Quality Check Events(Supporting Execution ) QC Events Program provides complimentary and collaborative activities that ensure rigor and discipline around transaction execution and provides a secondary, parallel review of final outputs in outputs. Events can be proactive or reactionary based on the situation. “Provide rigor and independent perspectives that help Business Teams execute to quality standards in various operating conditions” Benefits to the Business Include:  Assurance – partnering in advance or in real-time to enable success  Validation – ensuring successful execution; second set of eyes  Testing – post implementation affirmation of effective execution  Perspective – working across business units for optimal solutions  Control – bringing discipline to ad hoc processing environment Program Approach:  Initiation: Push or Pull, Quality team works with Operations Leaders, Managers and Analysts to identify and mitigate the risk involved when processing Non- Standard, Complex, High Pressure or Change Related transactions.  Execution: Team works when you work, to ensure your processing is accurate when it matters most – so the relied upon records are correct when they need to be correct. Team will opine on Controls design and operating effectiveness where applicable during the process.  Results: Team packages and presents results via initial e-mal notification, and ultimately, through delivery of work papers and closing memo detailing findings and improvement opportunities where applicable QC Events
  • 35.
    35 Operations Health Assessment Procedure, Review, and Training Quality Offerings
  • 36.
    36 Operations Health Assessment( pulse check ) Operations Health Assessment compares performance against industry standard foundational quality elements by providing insight into opportunities and improvements at the process level. “Ops Health Assessments help business leaders understand where they are, and how they can continue to improve over time” Benefits to the Business Include:  Industry Standard – Operations Excellence partnered with E&Y to apply industry standard perspectives to unit specific challenges  Process Level – allows business leaders and managers to identify model teams and processes, and areas requiring immediate triage  Detailed Insights – teams receive custom feedback and notes on specific challenges within the Foundational Quality Elements Program Approach:  Training: Formal classroom, e-learning or structured on the job training is designed and documented at the technical job requirements level; training content is consistent with procedures; effectiveness and adoption is measured.  Manager Reviews: Transactions and instructions are classified as requiring an independent validation by a trained employee who confirms that transactions or interpretations of written instructions are consistent to written policies and procedures.  Procedures: Procedure contains a clear business scope, and content is aligned to the work; defines task ownership, activity instruction, control steps and escalation protocols; the procedure is centrally located and available, and effectiveness is measured. Operations Health Assessment Training Manager Review Procedures
  • 37.
    37 Operational Controls  ControlDirectors Quality Offerings
  • 38.
    38 Control Directors Control Directorsare responsible for the continuous improvement of the control environment through collaborative development, implementation, and maintenance of control activities. Control Directors work closely with the Business to enhance processes through the use of best practices, improved control activities and increased internal control awareness. Control Directors Program Approach:  Continued Improvement: Control Directors and/or business owners identify areas for potential improvement based on current or past incidents or processes in need of improvement.  Best Practices: Control directors collaborate with the process owners to improve controls through knowledge sharing and thought leadership  Team Development: Process owners receive training that improves their risk and controls awareness.  Design and Operating Effectiveness Opinions: Control Directors and Business owners evaluate ongoing operations to ensure continued execution of process controls and their design effectiveness. Benefits to the Business Include:  Standard, consistent and predictable control environment  Allow focus on continuous improvement  Improved ability to proactively identify risks and proactively implement successful control activities to mitigate them  Business Unit aligned control knowledgeable resources Continued Improvement Best Practices Team Development Oversight Trusted advisors with a commitment to continuous control and process improvement