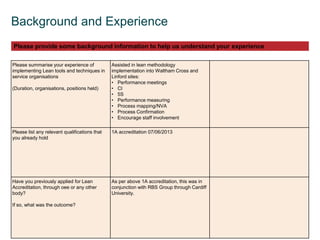
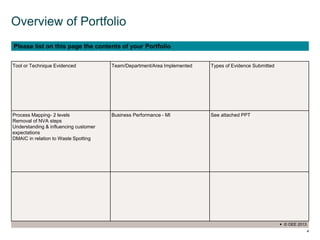
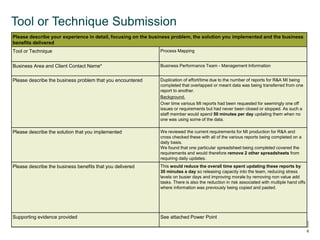
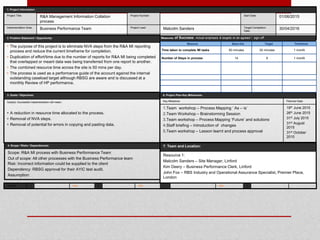
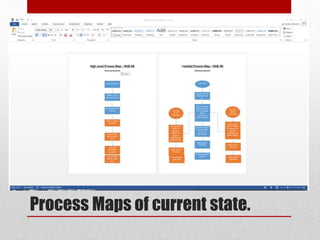
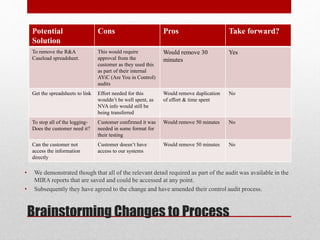
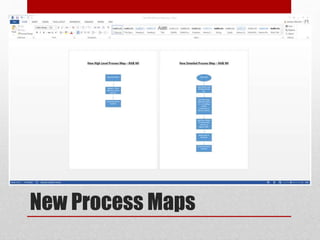
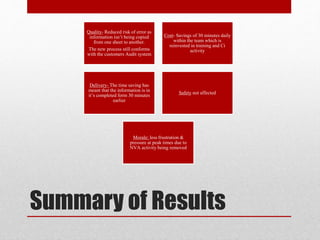
SlideShare a Scribd company logo
LCS/OEE Lean Accreditation
Scheme
Lean Practitioner Evidence Portfolio
 © OEE 2013
2
LCS/OEE Lean Accreditation Scheme Lean
Practitioner Evidence Portfolio
Name Malcolm Sanders
Organisation HP
Date 01/06/2015
 © OEE 2013
3
Background and Experience
Please summarise your experience of
implementing Lean tools and techniques in
service organisations
(Duration, organisations, positions held)
Assisted in lean methodology
implementation into Waltham Cross and
Linford sites:
• Performance meetings
• CI
• 5S
• Performance measuring
• Process mapping/NVA
• Process Confirmation
• Encourage staff involvement
Please list any relevant qualifications that
you already hold
1A accreditation 07/06/2013
Have you previously applied for Lean
Accreditation, through oee or any other
body?
If so, what was the outcome?
As per above 1A accreditation, this was in
conjunction with RBS Group through Cardiff
University.
Please provide some background information to help us understand your experience
 © OEE 2013
4
Overview of Portfolio
Tool or Technique Evidenced Team/Department/Area Implemented Types of Evidence Submitted
Process Mapping- 2 levels
Removal of NVA steps
Understanding & influencing customer
expectations
DMAIC in relation to Waste Spotting
Business Performance - MI See attached PPT
Please list on this page the contents of your Portfolio
 © OEE 2013
5
Understanding Lean Thinking
In your own words, define “Lean” and describe how you would implement Lean effectively and sustainably into an
organisation. Your answer should fit into the box below.
I would define Lean as a way in which to identify and remove areas of risk and process deficiencies, improve work flow and eliminate
waste and striving to be the best you can be through continuous improvement. Taking into account your customers needs and asking
yourself what services you would pay for.
I would look to implement Lean effectively by firstly engaging with my team so that they understand what is required, the methodologies,
who has the responsibility and how important they are as they have the experience and knowledge to help transform what they do.
Ensure relevant Key Performance Metrics and measures are introduced so individuals can identify what they do to our own and
customer’s service levels.
I would then introduce different aspects of Lean methodology based on the speed of understanding ensuring that each element has
been taken on-board and working before introducing the next. Working with Team Leads, smaller staff teams and or SME’s to:
 Introduce daily meetings for two way performance feedback, discuss and log issues.
 Map out processes to identify waste opportunities and increase efficiencies creating standard operating procedures.
 Gain individual/team ownership with ‘Champions’ of various activities such as CI/Waste, 5S.
 Ensure benefits are tracked and reported back to the team(s)
 Complete regular reviews to ensure tasks are being carried out correctly and performance criteria measurements are still relevant and
effective.
It is paramount that staff feel engaged and can see the benefits being derived from these processes and even how creating this capacity
is used are understood. Ensuring that there is a good 2 way feedback process in place to aid this can make a huge difference in staff
sustainability and future engagement.
 © OEE 2013
6
Tool or Technique Submission
Please describe your experience in detail, focusing on the business problem, the solution you implemented and the business
benefits delivered
Tool or Technique Process Mapping
Business Area and Client Contact Name* Business Performance Team - Management Information
Please describe the business problem that you encountered Duplication of effort/time due to the number of reports for R&A MI being
completed that overlapped or meant data was being transferred from one
report to another.
Background.
Over time various MI reports had been requested for seemingly one off
issues or requirements but had never been closed or stopped. As such a
staff member would spend 50 minutes per day updating them when no
one was using some of the data.
Please describe the solution that you implemented We reviewed the current requirements for MI production for R&A and
cross checked these with all of the various reports being completed on a
daily basis.
We found that one particular spreadsheet being completed covered the
requirements and would therefore remove 2 other spreadsheets from
requiring daily updates.
Please describe the business benefits that you delivered This would reduce the overall time spent updating these reports by
30 minutes a day so releasing capacity into the team, reducing stress
levels on busier days and improving morale by removing non value add
tasks. There is also the reduction in risk associated with multiple hand offs
where information was previously being copied and pasted.
Supporting evidence provided See attached Power Point
 © OEE 2013
7
Statement of Authorship
In submitting this portfolio, I certify that the contents, and all supporting evidence, represent
either:
My own work, or
Work I carried out jointly with another Lean team member, who has been suitably credited in the
relevant sections of this document, or
Work completed by members of a client team or department, working under my direct guidance and
coaching
None of the evidence submitted represents the work of others except as described above
By making this submission I give my consent to an OEE assessor contacting other members
of my team, and any of the client contacts named, to verify that the work described is my
own work and was completed to the standards I have described
I understand that, should this declaration prove (now or in the future) to be untrue, the relevant
part of this evidence portfolio will become invalid. Should the evidence portfolio be
weakened as a result, OEE reserve the right to revoke Lean accreditation should the
revised submission no longer provide a suitably strong case.
Southill
Cornbury Park
Charlbury
Oxfordshire OX7 3EW
t: +44 (0) 1608 811900
training@oeeuk.com
www.oeeuk.com
www.oee-training.com
MI Duplication
Malcolm Sanders, Linford Forum
Site Manager
1. Project Information:
Project Title: R&A Management Information Collation
process
Project Number: Start Date: 01/06/2015
Implementation Area: Business Performance Team Project Lead: Malcolm Sanders Target Completion
Date:
30/04/2016
Site: Linford Sponsor: Deane Sheppard Duration: 10 months2. Problem Statement / Opportunity:
• The purpose of this project is to eliminate NVA steps from the R&A MI reporting
process and reduce the current timeframe for completion.
• Duplication of effort/time due to the number of reports for R&A MI being completed
that overlapped or meant data was being transferred from one report to another.
• The combined resource time across the site is 50 mins per day.
• The process is used as a performance guide of the account against the internal
outstanding caseload target although RBSG are aware and is discussed at a
monthly Review of HP performance.
Measures of Success: Actual emphasis & targets to be agreed / sign off
3. Goals / Objectives:
Goal(s): Successful Implementation will mean:
• A reduction in resource time allocated to the process.
• Removal of NVA steps.
• Removal of potential for errors in copying and pasting data.
4. Scope / Risks / Dependencies:
Scope: R&A MI process with Business Performance Team
Out of scope: All other processes with the Business Performance team
Risk: Incorrect information could be supplied to the client
Dependency: RBSG approval for their AYiC test audit.
Assumption:
Approval: 1 Date 2 Date 3 Date 4
6. Project Plan-Key Milestones:
Key Milestone Planned Date
1.Team workshop – Process Mapping ‘ As – is’
2.Team Workshop – Brainstorming Session
3.Team workshop – Process Mapping ‘Future’ and solutions
4.Staff briefing – Introduction of changes
5.Team workshop – Lesson learnt and process approval
19th June 2015
26th June 2015
31st July 2015
31st August
2015
31st October
2015
7. Team and Location:
Resource 1:
Malcolm Sanders – Site Manager, Linford
Kim Deery – Business Performance Clerk, Linford
John Fox – RBS Industry and Operational Assurance Specialist, Premier Place,
London
Measure Base-line Target Timeframe
Time taken to complete MI tasks 50 minutes 30 minutes 1 month
Number of Steps in process 14 8 1 month
Background
• Management Information is gathered on behalf of the Royal Bank of Scotland and internally to the Linford site in
respect of Research and Adjustment volumetrics. These show the number of items per error type received, and therefore
outstanding, or closed.
• This information is used to review movement in error type volumes, highlight spikes in volume received and provide a
visual breakdown of outstanding cases to enable monitoring against internal targets.
• Over the years a number of one off MI requests had been actioned but not closed off and as such there is a lot of
duplication of effort, data being copied and pasted from one sheet to another, wasted resource time and during peak
times, stress.
• During a Gemba the issue was overheard by the Site Manager and as such a review was undertaken.
Current R&A MI Produced
• MIRA On / Off report - System produced report saved to a local drive.
• R&A Caseload Spreadsheet – 10 minutes per day produced but data transferred
from the On / Off report.
• R&A Open / Closed report – 20 minutes per day. Data transferred from the On /
Off report.
Approach Taken
• A meeting was requested to discuss the approach review the current customer
and internal requirements.
• Process mapping of the R&A Management Information tasks.
• This was then used to identify duplication and NVA steps.
• A revised flow was agreed upon and introduced into the team.
Process Maps of current state.
Brainstorming Changes to Process
• We demonstrated though that all of the relevant detail required as part of the audit was available in the
MIRA reports that are saved and could be accessed at any point.
• Subsequently they have agreed to the change and have amended their control audit process.
Potential
Solution
Cons Pros Take forward?
To remove the R&A
Caseload spreadsheet.
This would require
approval from the
customer as they used this
as part of their internal
AYiC (Are You in Control)
audits
Would remove 30
minutes
Yes
Get the spreadsheets to link Effort needed for this
wouldn’t be well spent, as
NVA info would still be
being transferred
Would remove duplication
of effort & time spent
No
To stop all of the logging-
Does the customer need it?
Customer confirmed it was
needed in some format for
their testing
Would remove 50 minutes No
Can the customer not
access the information
directly
Customer doesn’t have
access to our systems
Would remove 50 minutes No
New Process Maps
Summary of Results
Quality- Reduced risk of error as
information isn’t being copied
from one sheet to another.
The new process still conforms
with the customers Audit system
Cost- Savings of 30 minutes daily
within the team which is
reinvested in training and Ci
activity
Delivery- The time saving has
meant that the information is in
it’s completed form 30 minutes
earlier
Safety not affected
Morale: less frustration &
pressure at peak times due to
NVA activity being removed
Lessons learnt
• There is still work to be done in ensuring that staff feel
empowered to actively stop and assess what they do.
• That GEMBA is an extremely useful tool in which to
keep abreast of how teams and individuals are feeling &
where there might be opportunity for improvement
• You can change the customers requirements by
highlighting NVA activity.

More Related Content

What's hot

Organizational process improvement online presentation
Organizational process improvement online presentationOrganizational process improvement online presentation
Organizational process improvement online presentation
Ojiugo Ajunwa
 
Business Process Improvement (BPI 7) Process Training Module
Business Process Improvement (BPI 7) Process Training ModuleBusiness Process Improvement (BPI 7) Process Training Module
Business Process Improvement (BPI 7) Process Training Module
Frank-G. Adler
 
Lean Management System Assessment
Lean Management System AssessmentLean Management System Assessment
Lean Management System Assessment
Operational Excellence Consulting
 
Sumana Sundaram - Resumev2.1
Sumana Sundaram - Resumev2.1Sumana Sundaram - Resumev2.1
Sumana Sundaram - Resumev2.1Sumana Sundaram
 
June 21 2012 Process Performance Metrics Presentation
June 21 2012 Process Performance Metrics PresentationJune 21 2012 Process Performance Metrics Presentation
June 21 2012 Process Performance Metrics Presentation
gmasiuk
 
Service Process Improvement Project
Service Process Improvement ProjectService Process Improvement Project
Service Process Improvement ProjectPrateek Gupta
 
Process mapping v2
Process mapping v2Process mapping v2
Process mapping v2
Daniele Chenal
 
Process Change: Communication & Training Tips
Process Change:  Communication & Training TipsProcess Change:  Communication & Training Tips
Process Change: Communication & Training Tips
TKMG, Inc.
 
Value Stream Mapping (VSM) Poster
Value Stream Mapping (VSM) PosterValue Stream Mapping (VSM) Poster
Value Stream Mapping (VSM) Poster
Operational Excellence Consulting
 
Strategy Deployment: Accelerating Improvement Through Focus and Alignment
Strategy Deployment: Accelerating Improvement Through Focus and AlignmentStrategy Deployment: Accelerating Improvement Through Focus and Alignment
Strategy Deployment: Accelerating Improvement Through Focus and Alignment
TKMG, Inc.
 
Operational Readiness and Importance of Operator Training
Operational Readiness and Importance of Operator TrainingOperational Readiness and Importance of Operator Training
Operational Readiness and Importance of Operator TrainingJuan Jorge
 
Service Delivery & Support
Service Delivery & SupportService Delivery & Support
Service Delivery & Support
Anand Subramaniam
 
Business process improvement (special report) presentation
Business process improvement (special report) presentationBusiness process improvement (special report) presentation
Business process improvement (special report) presentation
Michael Ligayo
 
It Service Management Implementation Overview
It Service Management Implementation OverviewIt Service Management Implementation Overview
It Service Management Implementation OverviewAlan McSweeney
 
Process Mapping Checklist
Process Mapping ChecklistProcess Mapping Checklist
Process Mapping Checklist
Janet McGreevy
 
Resume - Diana Sandhya
Resume - Diana SandhyaResume - Diana Sandhya
Resume - Diana SandhyaDiana Sandhya
 
Business Process Improvement
Business Process ImprovementBusiness Process Improvement
Business Process Improvement
Anand Subramaniam
 
How To Beat The Recession: BOS, Operations Excellence and a Problem Solving C...
How To Beat The Recession: BOS, Operations Excellence and a Problem Solving C...How To Beat The Recession: BOS, Operations Excellence and a Problem Solving C...
How To Beat The Recession: BOS, Operations Excellence and a Problem Solving C...
Dave Watkins
 
Mapping the End to End Process
Mapping the End to End ProcessMapping the End to End Process
Mapping the End to End Process
Lean Enterprise Academy
 

What's hot (20)

Organizational process improvement online presentation
Organizational process improvement online presentationOrganizational process improvement online presentation
Organizational process improvement online presentation
 
Business Process Improvement (BPI 7) Process Training Module
Business Process Improvement (BPI 7) Process Training ModuleBusiness Process Improvement (BPI 7) Process Training Module
Business Process Improvement (BPI 7) Process Training Module
 
Lean Management System Assessment
Lean Management System AssessmentLean Management System Assessment
Lean Management System Assessment
 
Sumana Sundaram - Resumev2.1
Sumana Sundaram - Resumev2.1Sumana Sundaram - Resumev2.1
Sumana Sundaram - Resumev2.1
 
June 21 2012 Process Performance Metrics Presentation
June 21 2012 Process Performance Metrics PresentationJune 21 2012 Process Performance Metrics Presentation
June 21 2012 Process Performance Metrics Presentation
 
Service Process Improvement Project
Service Process Improvement ProjectService Process Improvement Project
Service Process Improvement Project
 
Process mapping v2
Process mapping v2Process mapping v2
Process mapping v2
 
Process Change: Communication & Training Tips
Process Change:  Communication & Training TipsProcess Change:  Communication & Training Tips
Process Change: Communication & Training Tips
 
Value Stream Mapping (VSM) Poster
Value Stream Mapping (VSM) PosterValue Stream Mapping (VSM) Poster
Value Stream Mapping (VSM) Poster
 
Strategy Deployment: Accelerating Improvement Through Focus and Alignment
Strategy Deployment: Accelerating Improvement Through Focus and AlignmentStrategy Deployment: Accelerating Improvement Through Focus and Alignment
Strategy Deployment: Accelerating Improvement Through Focus and Alignment
 
Operational Readiness and Importance of Operator Training
Operational Readiness and Importance of Operator TrainingOperational Readiness and Importance of Operator Training
Operational Readiness and Importance of Operator Training
 
Service Delivery & Support
Service Delivery & SupportService Delivery & Support
Service Delivery & Support
 
Business process improvement (special report) presentation
Business process improvement (special report) presentationBusiness process improvement (special report) presentation
Business process improvement (special report) presentation
 
It Service Management Implementation Overview
It Service Management Implementation OverviewIt Service Management Implementation Overview
It Service Management Implementation Overview
 
Process mapping
Process mappingProcess mapping
Process mapping
 
Process Mapping Checklist
Process Mapping ChecklistProcess Mapping Checklist
Process Mapping Checklist
 
Resume - Diana Sandhya
Resume - Diana SandhyaResume - Diana Sandhya
Resume - Diana Sandhya
 
Business Process Improvement
Business Process ImprovementBusiness Process Improvement
Business Process Improvement
 
How To Beat The Recession: BOS, Operations Excellence and a Problem Solving C...
How To Beat The Recession: BOS, Operations Excellence and a Problem Solving C...How To Beat The Recession: BOS, Operations Excellence and a Problem Solving C...
How To Beat The Recession: BOS, Operations Excellence and a Problem Solving C...
 
Mapping the End to End Process
Mapping the End to End ProcessMapping the End to End Process
Mapping the End to End Process
 

Similar to 1B project MS V2

Vaibhav Kumar Resume
Vaibhav Kumar ResumeVaibhav Kumar Resume
Vaibhav Kumar Resumevaibhav kumar
 
Business management consulting response (2)
Business management consulting response (2)Business management consulting response (2)
Business management consulting response (2)
Marcelo Alterman
 
CV-SAM JAN 2016 - application 1
CV-SAM JAN 2016 - application 1CV-SAM JAN 2016 - application 1
CV-SAM JAN 2016 - application 1Sherrill Moore
 
Mis unit iv PIMR
Mis unit iv PIMRMis unit iv PIMR
Mis unit iv PIMR
Arnav Chowdhury
 
40 JANUARYFEBRUARY 2010 INFORMATIONMANAGEMENTSelecting .docx
40 JANUARYFEBRUARY 2010 INFORMATIONMANAGEMENTSelecting .docx40 JANUARYFEBRUARY 2010 INFORMATIONMANAGEMENTSelecting .docx
40 JANUARYFEBRUARY 2010 INFORMATIONMANAGEMENTSelecting .docx
alinainglis
 
ITIL Process Assessment - Service Design (XLS)
ITIL Process Assessment - Service Design (XLS)ITIL Process Assessment - Service Design (XLS)
ITIL Process Assessment - Service Design (XLS)
Flevy.com Best Practices
 
Lss pharma presentation2-2006
Lss pharma presentation2-2006Lss pharma presentation2-2006
Lss pharma presentation2-2006Omnex Inc.
 
Business process mapping
Business process mappingBusiness process mapping
Business process mapping
DAVIS THOMAS
 
Optimize Project Intake Approval and Prioritization
Optimize Project Intake Approval and PrioritizationOptimize Project Intake Approval and Prioritization
Optimize Project Intake Approval and Prioritization
Info-Tech Research Group
 
Resource Management Maturity - Does Your Resource Management Practice Work Fo...
Resource Management Maturity - Does Your Resource Management Practice Work Fo...Resource Management Maturity - Does Your Resource Management Practice Work Fo...
Resource Management Maturity - Does Your Resource Management Practice Work Fo...
Unanet
 
Assessmentsaudit322112 13008159137665-phpapp01
Assessmentsaudit322112 13008159137665-phpapp01Assessmentsaudit322112 13008159137665-phpapp01
Assessmentsaudit322112 13008159137665-phpapp01
Ana Maria Dulgheru
 
Course 1 Requirements Definition Overview.pptx
Course 1 Requirements Definition Overview.pptxCourse 1 Requirements Definition Overview.pptx
Course 1 Requirements Definition Overview.pptx
adikesavulu
 
PMO Managed Service Introduction
PMO Managed Service IntroductionPMO Managed Service Introduction
PMO Managed Service Introduction
Keith Rackley
 
Planning and monitoring work section 22
Planning and monitoring work section 22Planning and monitoring work section 22
Planning and monitoring work section 22
Khaled Alanzi - 6 Sigma Green Belt
 
LSS Intro
LSS IntroLSS Intro
LSS Introevansjr
 
Lean Six Sigma Awareness Handouts
Lean Six Sigma Awareness HandoutsLean Six Sigma Awareness Handouts
Lean Six Sigma Awareness Handouts
guest0981f4
 

Similar to 1B project MS V2 (20)

Vaibhav Kumar Resume
Vaibhav Kumar ResumeVaibhav Kumar Resume
Vaibhav Kumar Resume
 
Senthil S
Senthil SSenthil S
Senthil S
 
Business management consulting response (2)
Business management consulting response (2)Business management consulting response (2)
Business management consulting response (2)
 
CV-SAM JAN 2016 - application 1
CV-SAM JAN 2016 - application 1CV-SAM JAN 2016 - application 1
CV-SAM JAN 2016 - application 1
 
Mis unit iv PIMR
Mis unit iv PIMRMis unit iv PIMR
Mis unit iv PIMR
 
40 JANUARYFEBRUARY 2010 INFORMATIONMANAGEMENTSelecting .docx
40 JANUARYFEBRUARY 2010 INFORMATIONMANAGEMENTSelecting .docx40 JANUARYFEBRUARY 2010 INFORMATIONMANAGEMENTSelecting .docx
40 JANUARYFEBRUARY 2010 INFORMATIONMANAGEMENTSelecting .docx
 
Resume
ResumeResume
Resume
 
ITIL Process Assessment - Service Design (XLS)
ITIL Process Assessment - Service Design (XLS)ITIL Process Assessment - Service Design (XLS)
ITIL Process Assessment - Service Design (XLS)
 
Lss pharma presentation2-2006
Lss pharma presentation2-2006Lss pharma presentation2-2006
Lss pharma presentation2-2006
 
Business process mapping
Business process mappingBusiness process mapping
Business process mapping
 
Optimize Project Intake Approval and Prioritization
Optimize Project Intake Approval and PrioritizationOptimize Project Intake Approval and Prioritization
Optimize Project Intake Approval and Prioritization
 
Resource Management Maturity - Does Your Resource Management Practice Work Fo...
Resource Management Maturity - Does Your Resource Management Practice Work Fo...Resource Management Maturity - Does Your Resource Management Practice Work Fo...
Resource Management Maturity - Does Your Resource Management Practice Work Fo...
 
PACMTN Portfolio1
PACMTN Portfolio1PACMTN Portfolio1
PACMTN Portfolio1
 
Melissa Lorenzo Resume
Melissa Lorenzo ResumeMelissa Lorenzo Resume
Melissa Lorenzo Resume
 
Assessmentsaudit322112 13008159137665-phpapp01
Assessmentsaudit322112 13008159137665-phpapp01Assessmentsaudit322112 13008159137665-phpapp01
Assessmentsaudit322112 13008159137665-phpapp01
 
Course 1 Requirements Definition Overview.pptx
Course 1 Requirements Definition Overview.pptxCourse 1 Requirements Definition Overview.pptx
Course 1 Requirements Definition Overview.pptx
 
PMO Managed Service Introduction
PMO Managed Service IntroductionPMO Managed Service Introduction
PMO Managed Service Introduction
 
Planning and monitoring work section 22
Planning and monitoring work section 22Planning and monitoring work section 22
Planning and monitoring work section 22
 
LSS Intro
LSS IntroLSS Intro
LSS Intro
 
Lean Six Sigma Awareness Handouts
Lean Six Sigma Awareness HandoutsLean Six Sigma Awareness Handouts
Lean Six Sigma Awareness Handouts
 

1B project MS V2

  • 1. LCS/OEE Lean Accreditation Scheme Lean Practitioner Evidence Portfolio
  • 2.  © OEE 2013 2 LCS/OEE Lean Accreditation Scheme Lean Practitioner Evidence Portfolio Name Malcolm Sanders Organisation HP Date 01/06/2015
  • 3.  © OEE 2013 3 Background and Experience Please summarise your experience of implementing Lean tools and techniques in service organisations (Duration, organisations, positions held) Assisted in lean methodology implementation into Waltham Cross and Linford sites: • Performance meetings • CI • 5S • Performance measuring • Process mapping/NVA • Process Confirmation • Encourage staff involvement Please list any relevant qualifications that you already hold 1A accreditation 07/06/2013 Have you previously applied for Lean Accreditation, through oee or any other body? If so, what was the outcome? As per above 1A accreditation, this was in conjunction with RBS Group through Cardiff University. Please provide some background information to help us understand your experience
  • 4.  © OEE 2013 4 Overview of Portfolio Tool or Technique Evidenced Team/Department/Area Implemented Types of Evidence Submitted Process Mapping- 2 levels Removal of NVA steps Understanding & influencing customer expectations DMAIC in relation to Waste Spotting Business Performance - MI See attached PPT Please list on this page the contents of your Portfolio
  • 5.  © OEE 2013 5 Understanding Lean Thinking In your own words, define “Lean” and describe how you would implement Lean effectively and sustainably into an organisation. Your answer should fit into the box below. I would define Lean as a way in which to identify and remove areas of risk and process deficiencies, improve work flow and eliminate waste and striving to be the best you can be through continuous improvement. Taking into account your customers needs and asking yourself what services you would pay for. I would look to implement Lean effectively by firstly engaging with my team so that they understand what is required, the methodologies, who has the responsibility and how important they are as they have the experience and knowledge to help transform what they do. Ensure relevant Key Performance Metrics and measures are introduced so individuals can identify what they do to our own and customer’s service levels. I would then introduce different aspects of Lean methodology based on the speed of understanding ensuring that each element has been taken on-board and working before introducing the next. Working with Team Leads, smaller staff teams and or SME’s to:  Introduce daily meetings for two way performance feedback, discuss and log issues.  Map out processes to identify waste opportunities and increase efficiencies creating standard operating procedures.  Gain individual/team ownership with ‘Champions’ of various activities such as CI/Waste, 5S.  Ensure benefits are tracked and reported back to the team(s)  Complete regular reviews to ensure tasks are being carried out correctly and performance criteria measurements are still relevant and effective. It is paramount that staff feel engaged and can see the benefits being derived from these processes and even how creating this capacity is used are understood. Ensuring that there is a good 2 way feedback process in place to aid this can make a huge difference in staff sustainability and future engagement.
  • 6.  © OEE 2013 6 Tool or Technique Submission Please describe your experience in detail, focusing on the business problem, the solution you implemented and the business benefits delivered Tool or Technique Process Mapping Business Area and Client Contact Name* Business Performance Team - Management Information Please describe the business problem that you encountered Duplication of effort/time due to the number of reports for R&A MI being completed that overlapped or meant data was being transferred from one report to another. Background. Over time various MI reports had been requested for seemingly one off issues or requirements but had never been closed or stopped. As such a staff member would spend 50 minutes per day updating them when no one was using some of the data. Please describe the solution that you implemented We reviewed the current requirements for MI production for R&A and cross checked these with all of the various reports being completed on a daily basis. We found that one particular spreadsheet being completed covered the requirements and would therefore remove 2 other spreadsheets from requiring daily updates. Please describe the business benefits that you delivered This would reduce the overall time spent updating these reports by 30 minutes a day so releasing capacity into the team, reducing stress levels on busier days and improving morale by removing non value add tasks. There is also the reduction in risk associated with multiple hand offs where information was previously being copied and pasted. Supporting evidence provided See attached Power Point
  • 7.  © OEE 2013 7 Statement of Authorship In submitting this portfolio, I certify that the contents, and all supporting evidence, represent either: My own work, or Work I carried out jointly with another Lean team member, who has been suitably credited in the relevant sections of this document, or Work completed by members of a client team or department, working under my direct guidance and coaching None of the evidence submitted represents the work of others except as described above By making this submission I give my consent to an OEE assessor contacting other members of my team, and any of the client contacts named, to verify that the work described is my own work and was completed to the standards I have described I understand that, should this declaration prove (now or in the future) to be untrue, the relevant part of this evidence portfolio will become invalid. Should the evidence portfolio be weakened as a result, OEE reserve the right to revoke Lean accreditation should the revised submission no longer provide a suitably strong case.
  • 8. Southill Cornbury Park Charlbury Oxfordshire OX7 3EW t: +44 (0) 1608 811900 training@oeeuk.com www.oeeuk.com www.oee-training.com
  • 9. MI Duplication Malcolm Sanders, Linford Forum Site Manager
  • 10. 1. Project Information: Project Title: R&A Management Information Collation process Project Number: Start Date: 01/06/2015 Implementation Area: Business Performance Team Project Lead: Malcolm Sanders Target Completion Date: 30/04/2016 Site: Linford Sponsor: Deane Sheppard Duration: 10 months2. Problem Statement / Opportunity: • The purpose of this project is to eliminate NVA steps from the R&A MI reporting process and reduce the current timeframe for completion. • Duplication of effort/time due to the number of reports for R&A MI being completed that overlapped or meant data was being transferred from one report to another. • The combined resource time across the site is 50 mins per day. • The process is used as a performance guide of the account against the internal outstanding caseload target although RBSG are aware and is discussed at a monthly Review of HP performance. Measures of Success: Actual emphasis & targets to be agreed / sign off 3. Goals / Objectives: Goal(s): Successful Implementation will mean: • A reduction in resource time allocated to the process. • Removal of NVA steps. • Removal of potential for errors in copying and pasting data. 4. Scope / Risks / Dependencies: Scope: R&A MI process with Business Performance Team Out of scope: All other processes with the Business Performance team Risk: Incorrect information could be supplied to the client Dependency: RBSG approval for their AYiC test audit. Assumption: Approval: 1 Date 2 Date 3 Date 4 6. Project Plan-Key Milestones: Key Milestone Planned Date 1.Team workshop – Process Mapping ‘ As – is’ 2.Team Workshop – Brainstorming Session 3.Team workshop – Process Mapping ‘Future’ and solutions 4.Staff briefing – Introduction of changes 5.Team workshop – Lesson learnt and process approval 19th June 2015 26th June 2015 31st July 2015 31st August 2015 31st October 2015 7. Team and Location: Resource 1: Malcolm Sanders – Site Manager, Linford Kim Deery – Business Performance Clerk, Linford John Fox – RBS Industry and Operational Assurance Specialist, Premier Place, London Measure Base-line Target Timeframe Time taken to complete MI tasks 50 minutes 30 minutes 1 month Number of Steps in process 14 8 1 month
  • 11. Background • Management Information is gathered on behalf of the Royal Bank of Scotland and internally to the Linford site in respect of Research and Adjustment volumetrics. These show the number of items per error type received, and therefore outstanding, or closed. • This information is used to review movement in error type volumes, highlight spikes in volume received and provide a visual breakdown of outstanding cases to enable monitoring against internal targets. • Over the years a number of one off MI requests had been actioned but not closed off and as such there is a lot of duplication of effort, data being copied and pasted from one sheet to another, wasted resource time and during peak times, stress. • During a Gemba the issue was overheard by the Site Manager and as such a review was undertaken.
  • 12. Current R&A MI Produced • MIRA On / Off report - System produced report saved to a local drive. • R&A Caseload Spreadsheet – 10 minutes per day produced but data transferred from the On / Off report. • R&A Open / Closed report – 20 minutes per day. Data transferred from the On / Off report.
  • 13. Approach Taken • A meeting was requested to discuss the approach review the current customer and internal requirements. • Process mapping of the R&A Management Information tasks. • This was then used to identify duplication and NVA steps. • A revised flow was agreed upon and introduced into the team.
  • 14. Process Maps of current state.
  • 15. Brainstorming Changes to Process • We demonstrated though that all of the relevant detail required as part of the audit was available in the MIRA reports that are saved and could be accessed at any point. • Subsequently they have agreed to the change and have amended their control audit process. Potential Solution Cons Pros Take forward? To remove the R&A Caseload spreadsheet. This would require approval from the customer as they used this as part of their internal AYiC (Are You in Control) audits Would remove 30 minutes Yes Get the spreadsheets to link Effort needed for this wouldn’t be well spent, as NVA info would still be being transferred Would remove duplication of effort & time spent No To stop all of the logging- Does the customer need it? Customer confirmed it was needed in some format for their testing Would remove 50 minutes No Can the customer not access the information directly Customer doesn’t have access to our systems Would remove 50 minutes No
  • 17. Summary of Results Quality- Reduced risk of error as information isn’t being copied from one sheet to another. The new process still conforms with the customers Audit system Cost- Savings of 30 minutes daily within the team which is reinvested in training and Ci activity Delivery- The time saving has meant that the information is in it’s completed form 30 minutes earlier Safety not affected Morale: less frustration & pressure at peak times due to NVA activity being removed
  • 18. Lessons learnt • There is still work to be done in ensuring that staff feel empowered to actively stop and assess what they do. • That GEMBA is an extremely useful tool in which to keep abreast of how teams and individuals are feeling & where there might be opportunity for improvement • You can change the customers requirements by highlighting NVA activity.