Download as PDF, PPTX
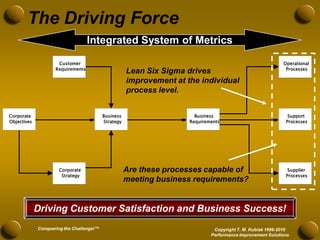


The document discusses developing meaningful metrics and provides an overview of key considerations for measurement including definitions, reasons for measuring, barriers, pitfalls to avoid, characteristics of good measures, and examples. It addresses how to determine what to measure, where to measure, and how to develop measures that are actionable and drive improvement. The presentation provides guidance on establishing an effective integrated system of metrics across all levels of an organization.