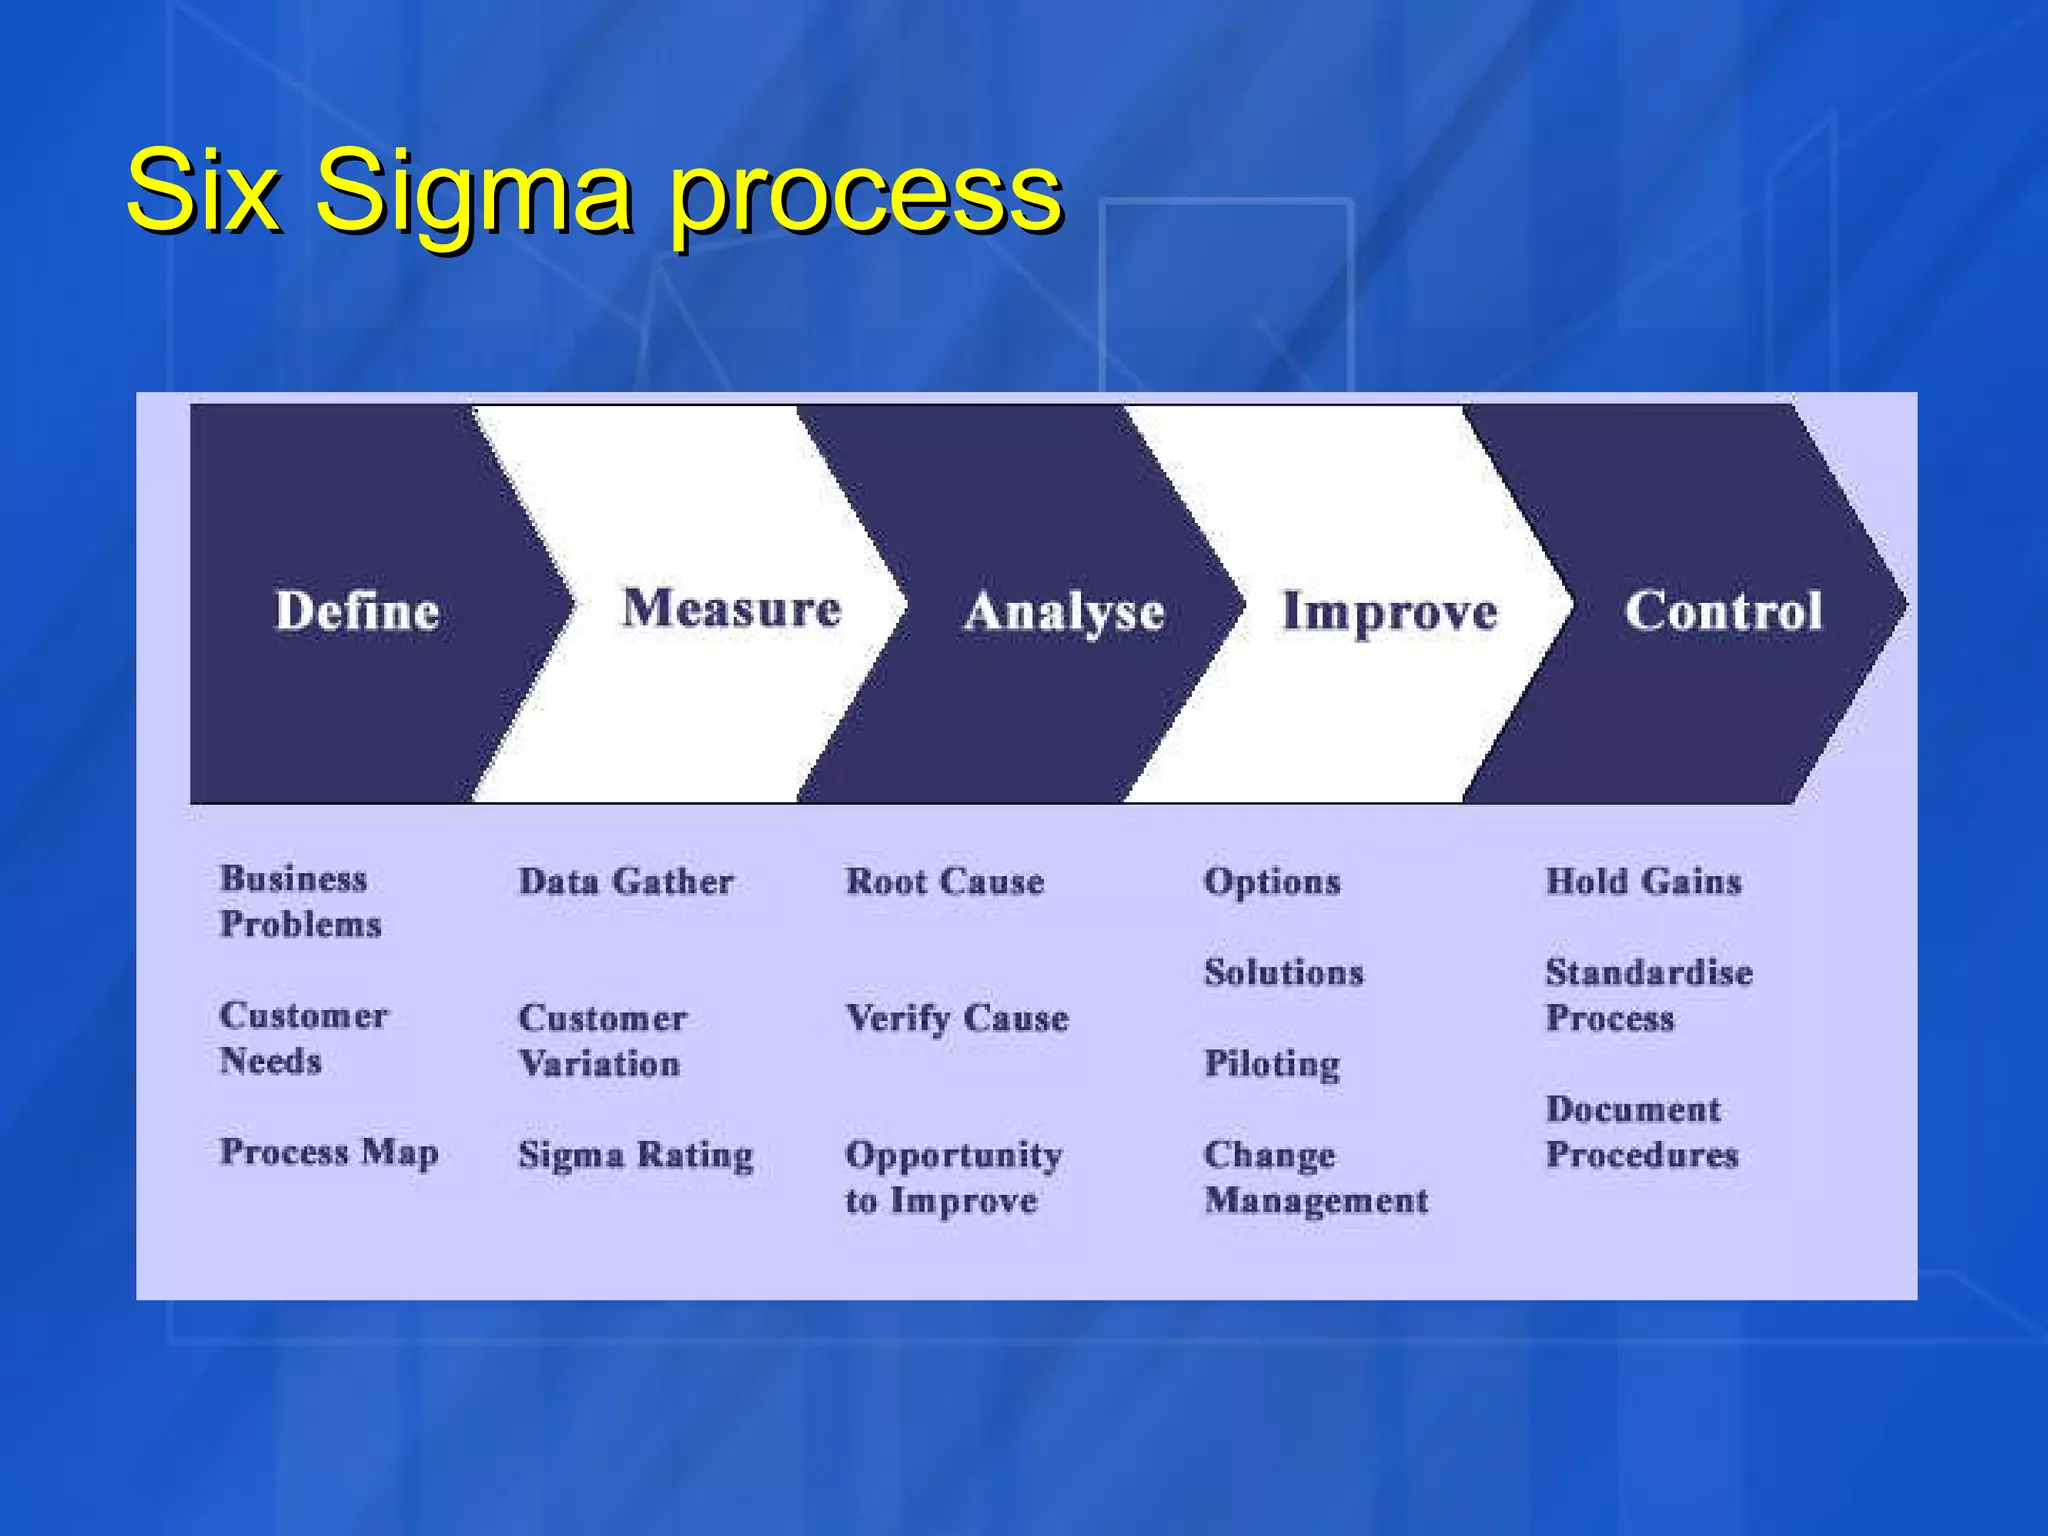
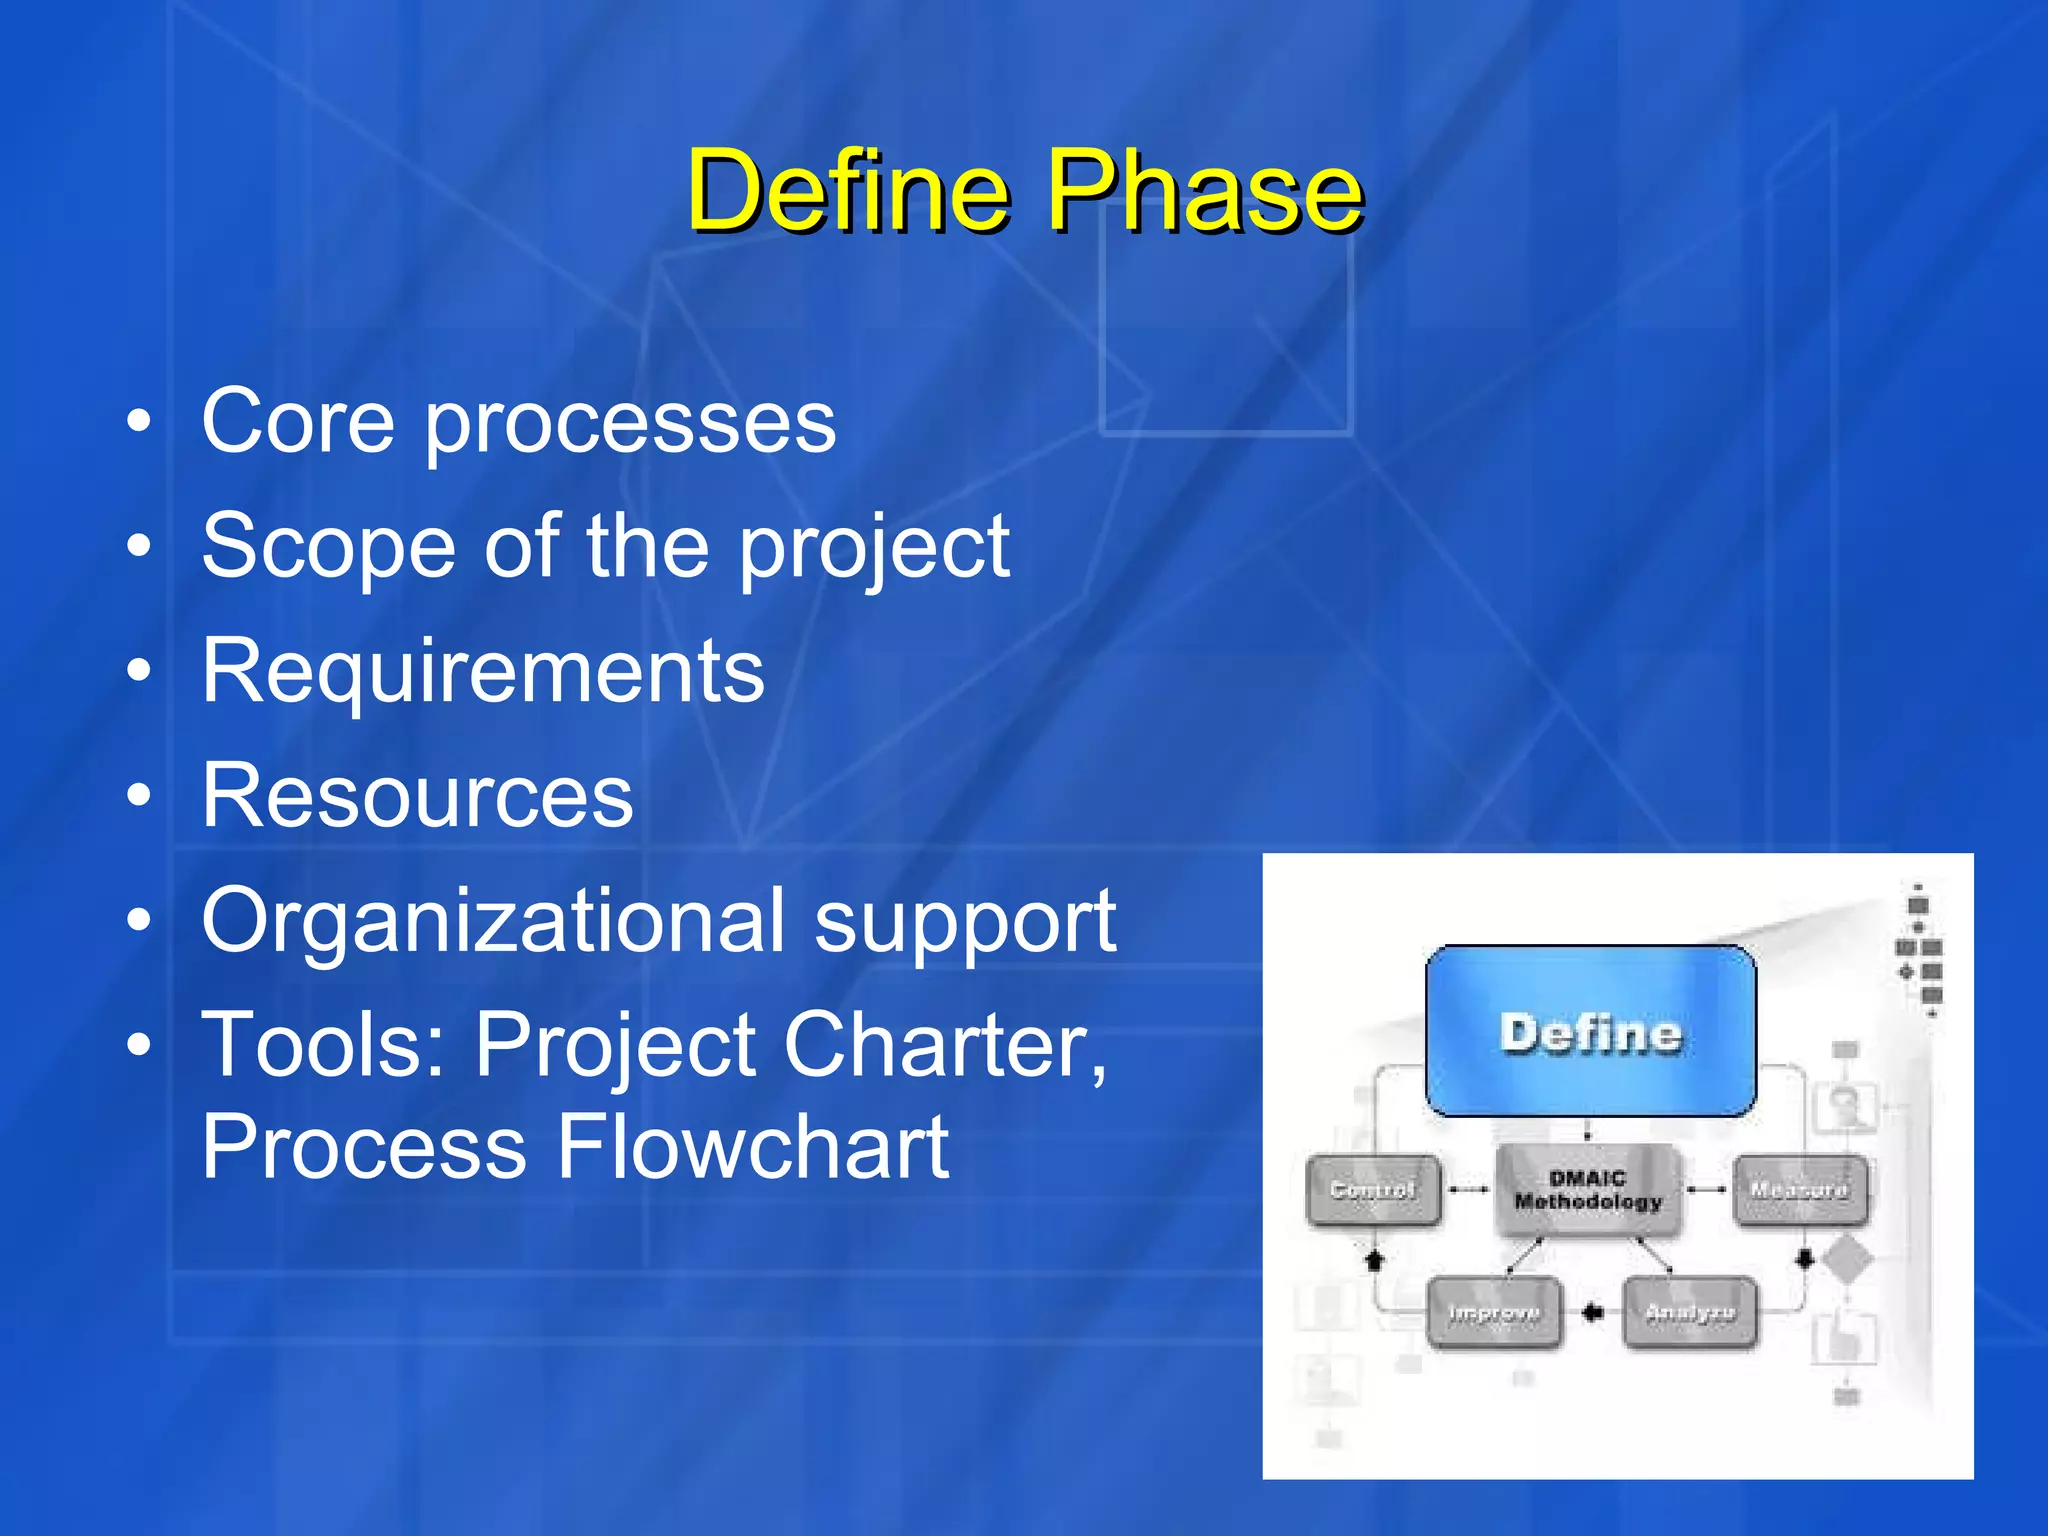
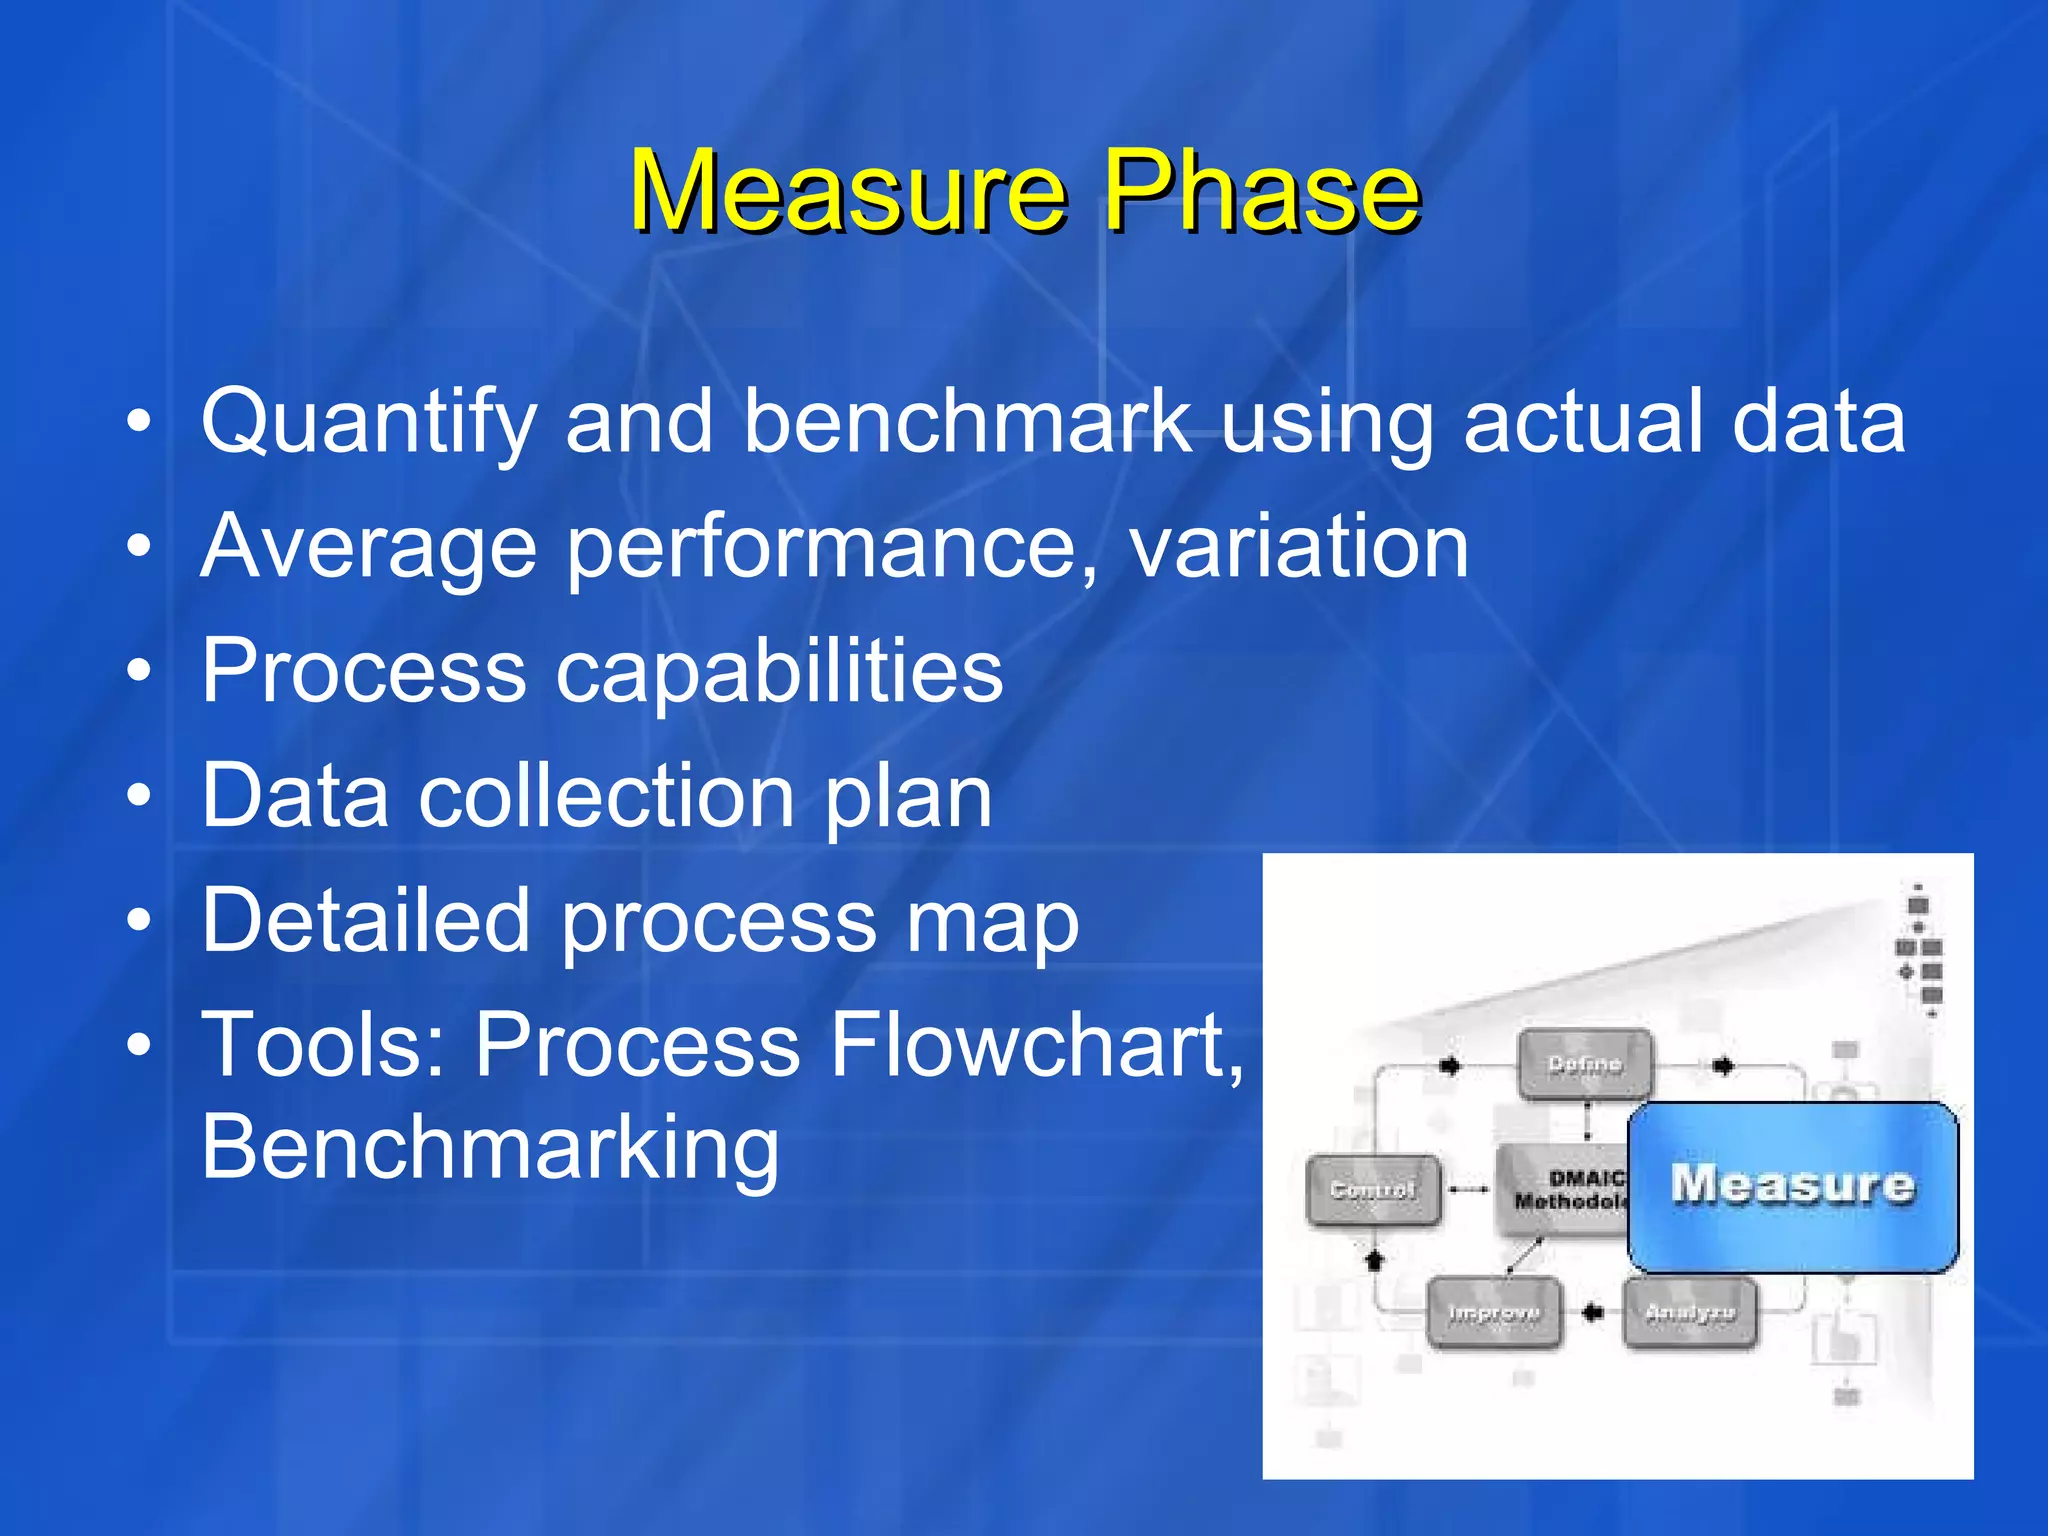
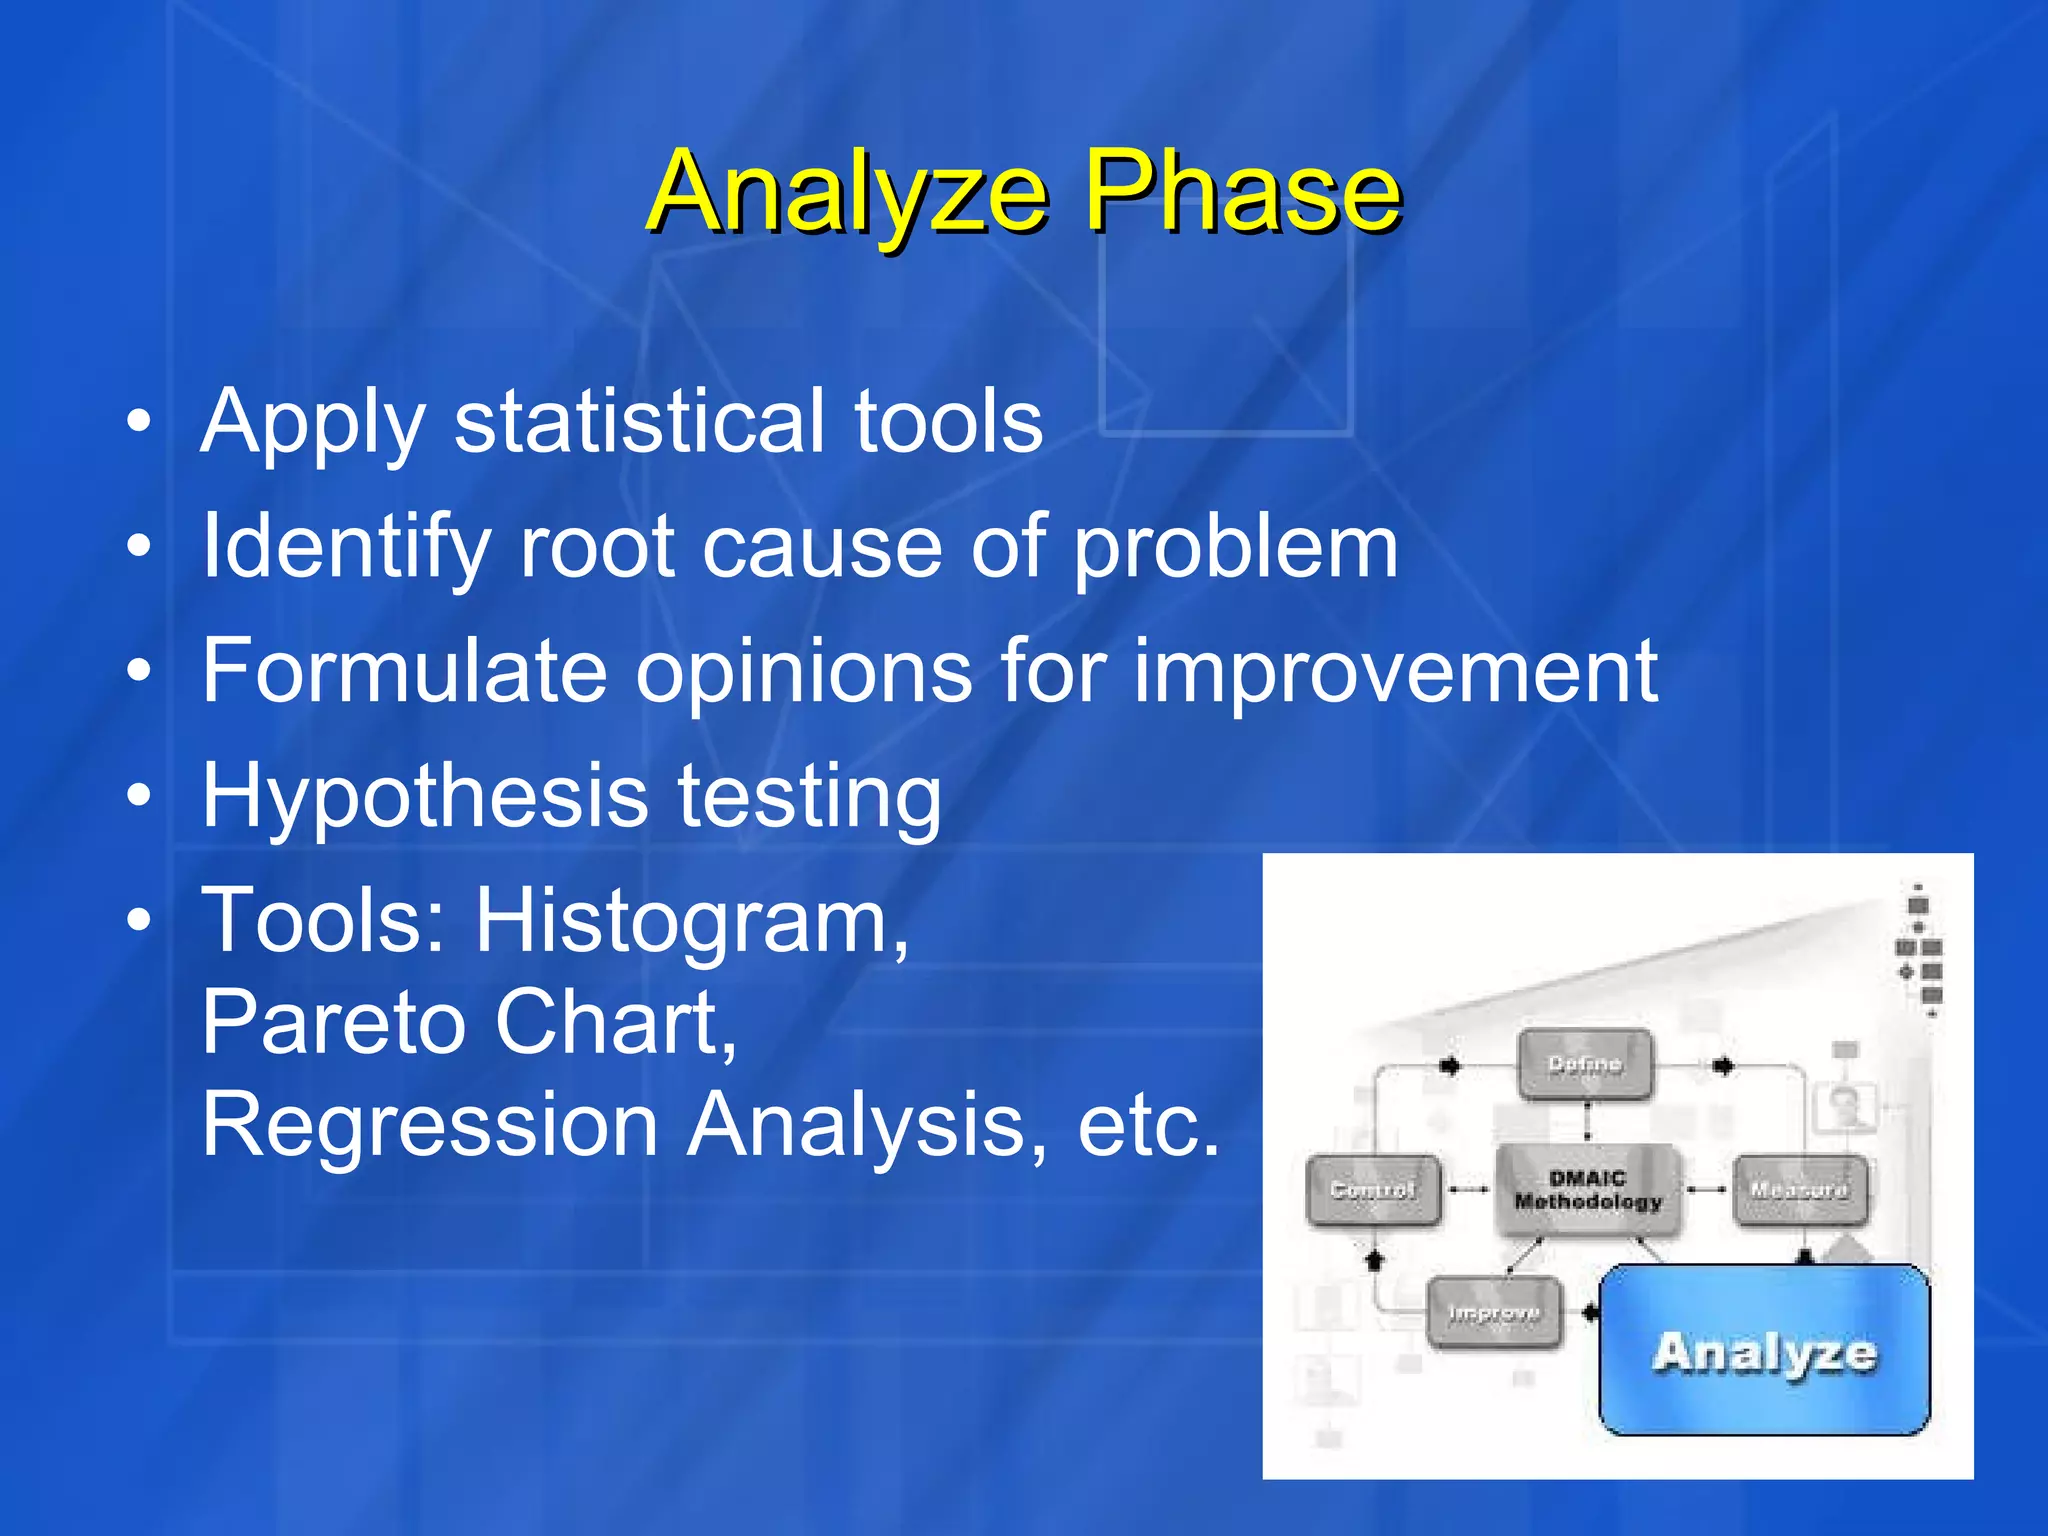
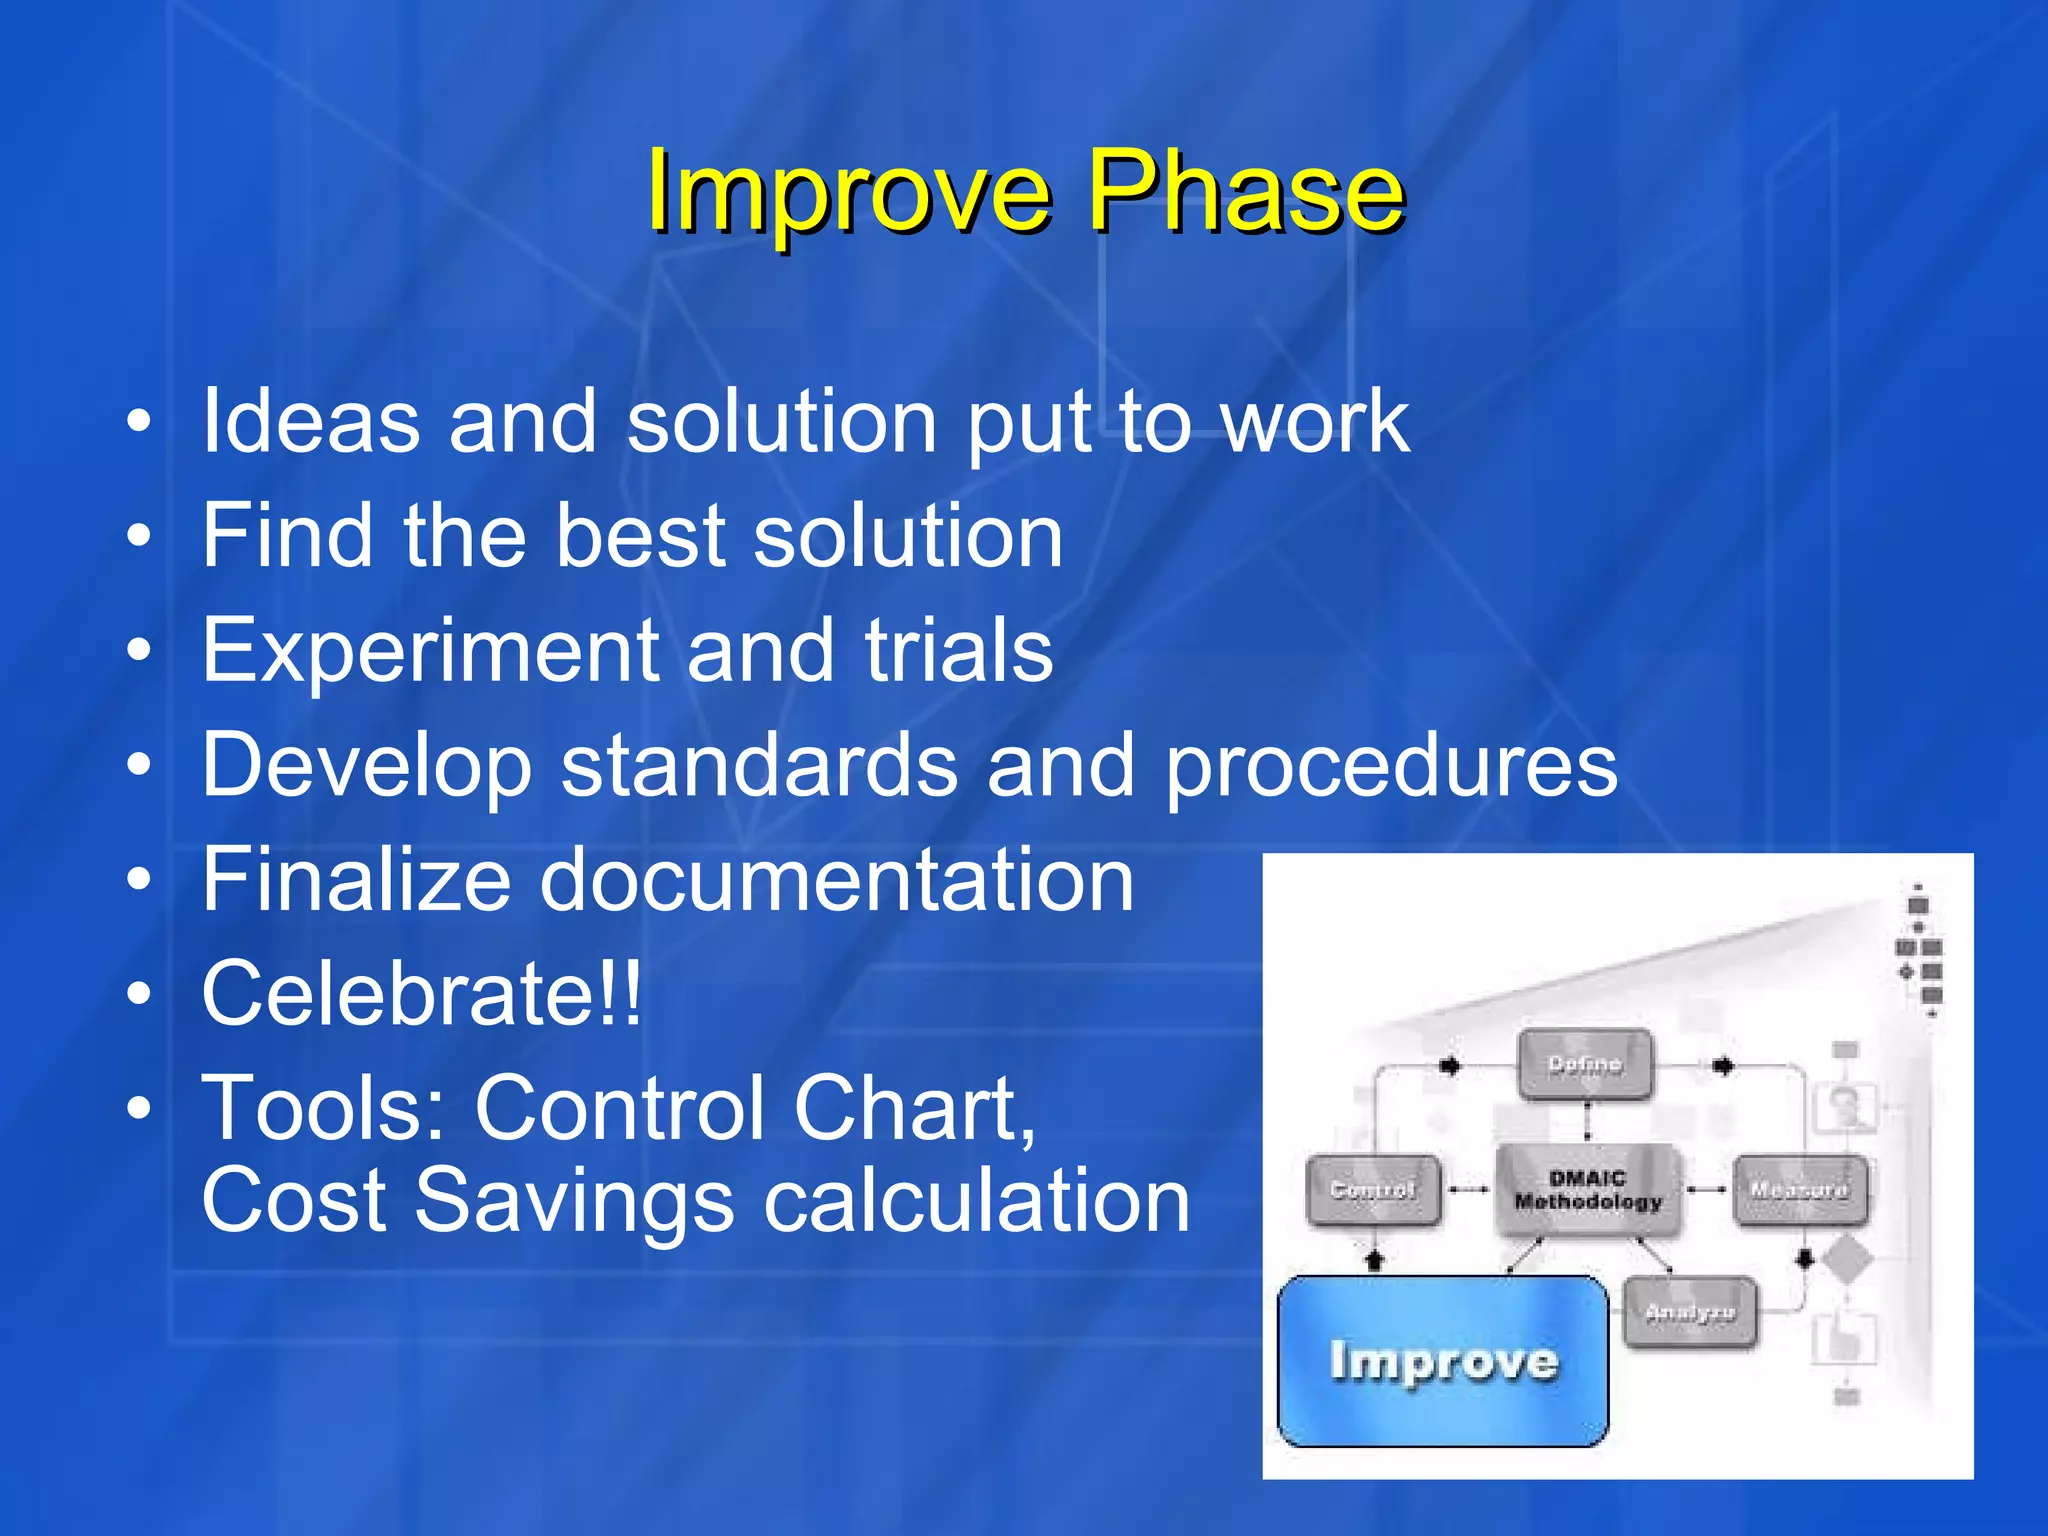
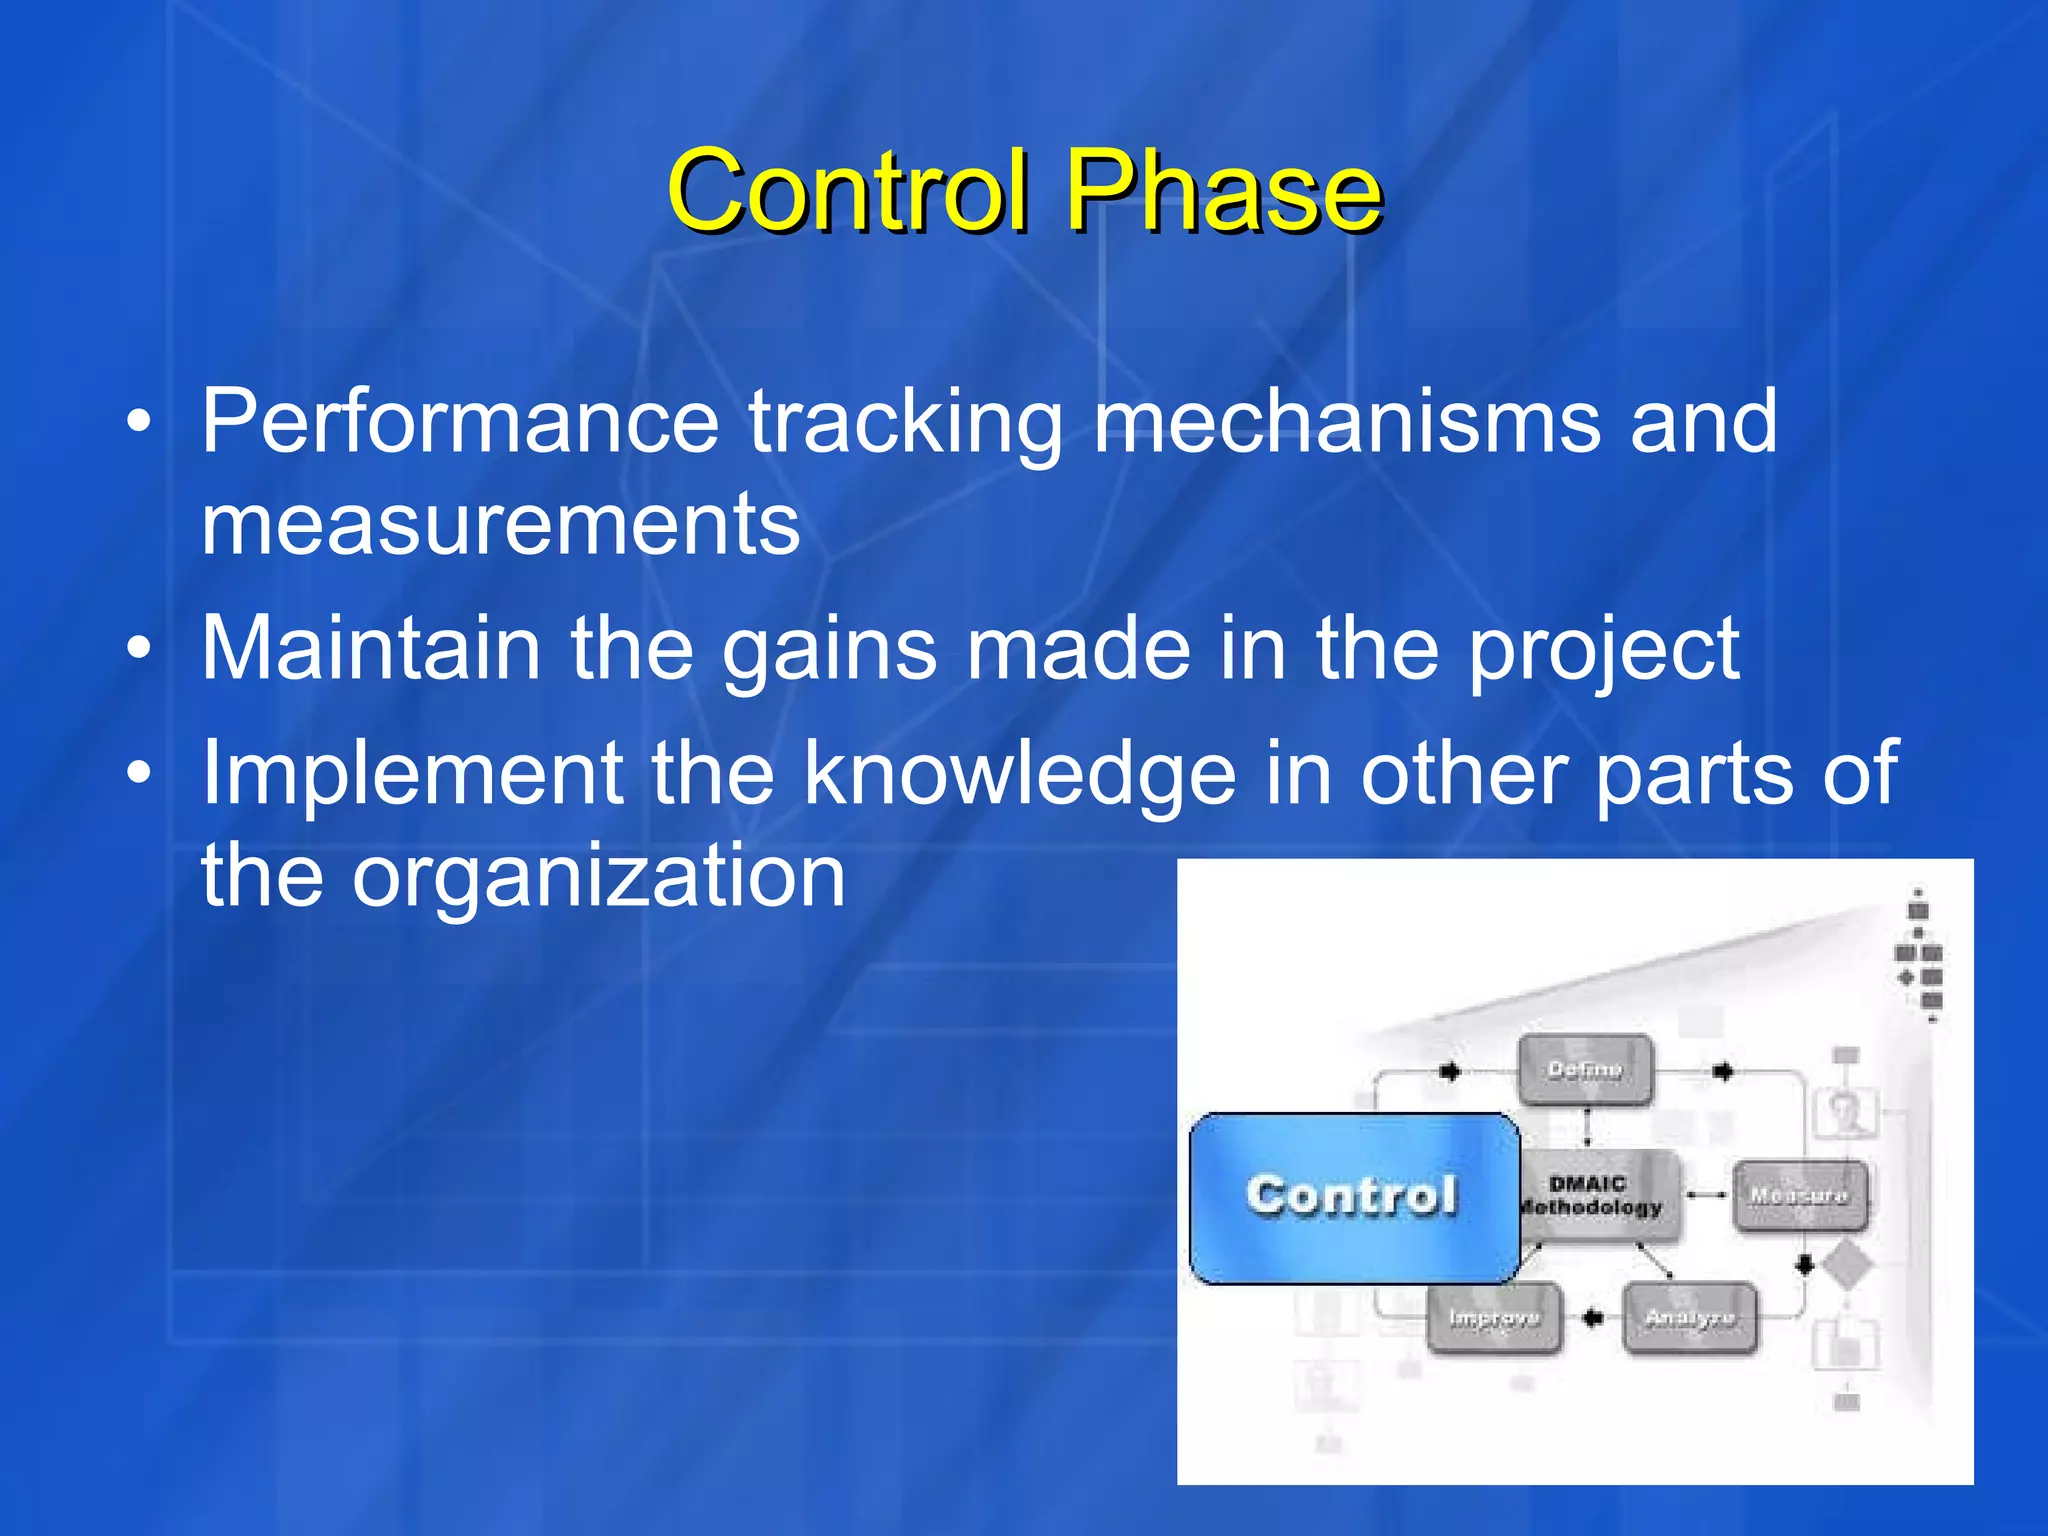
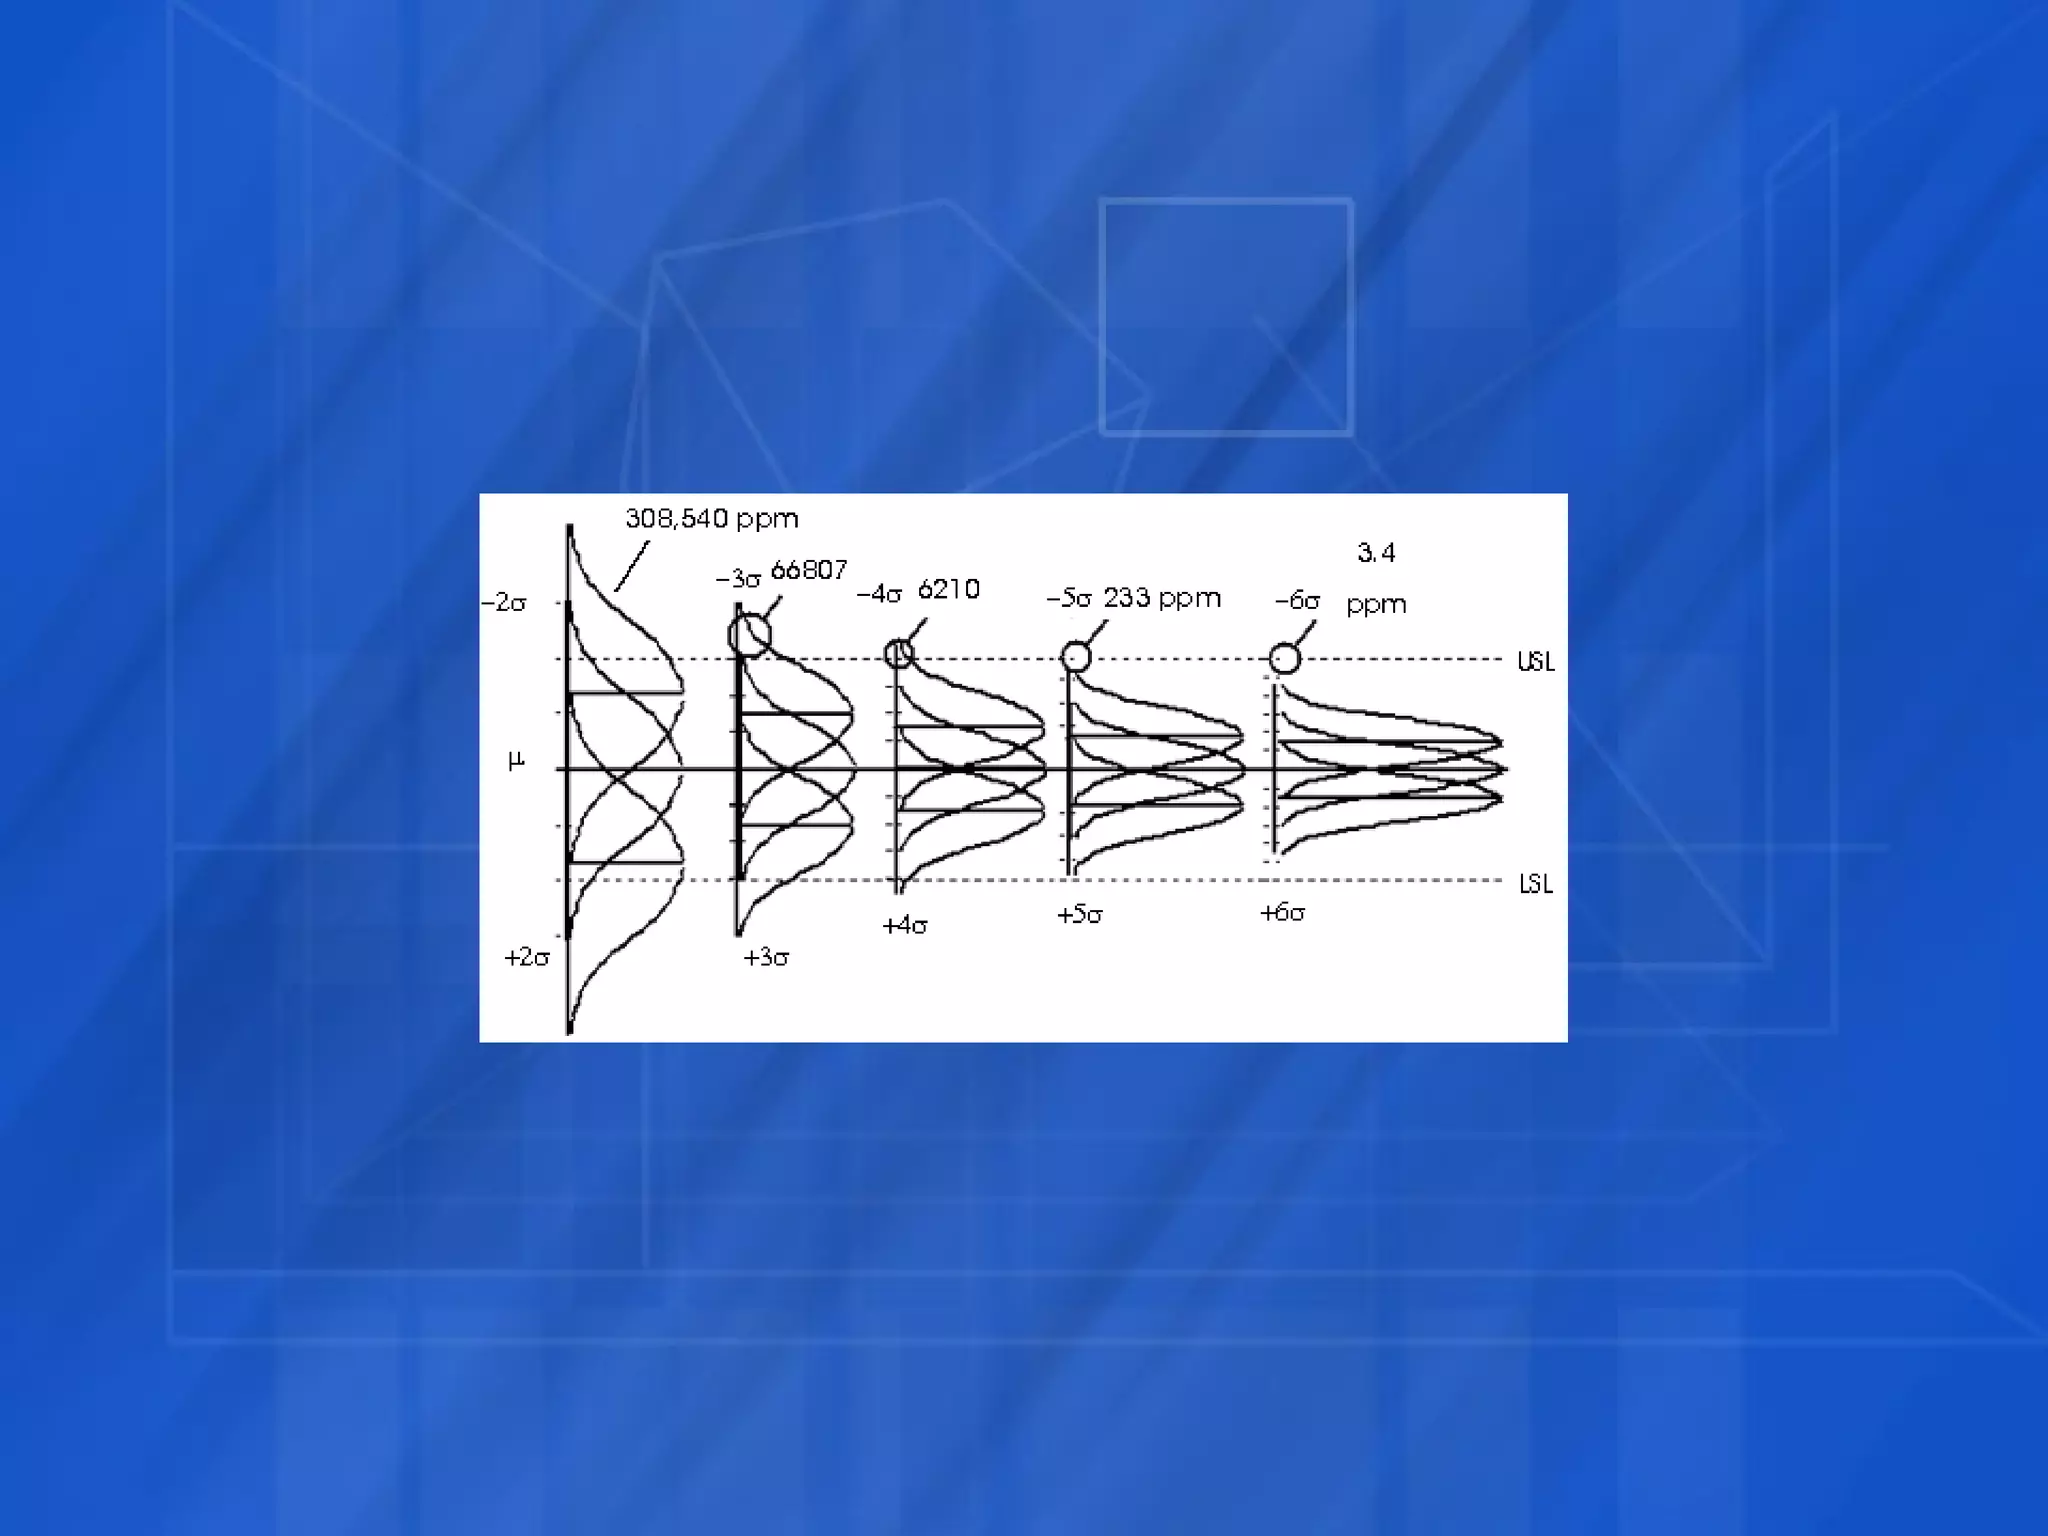
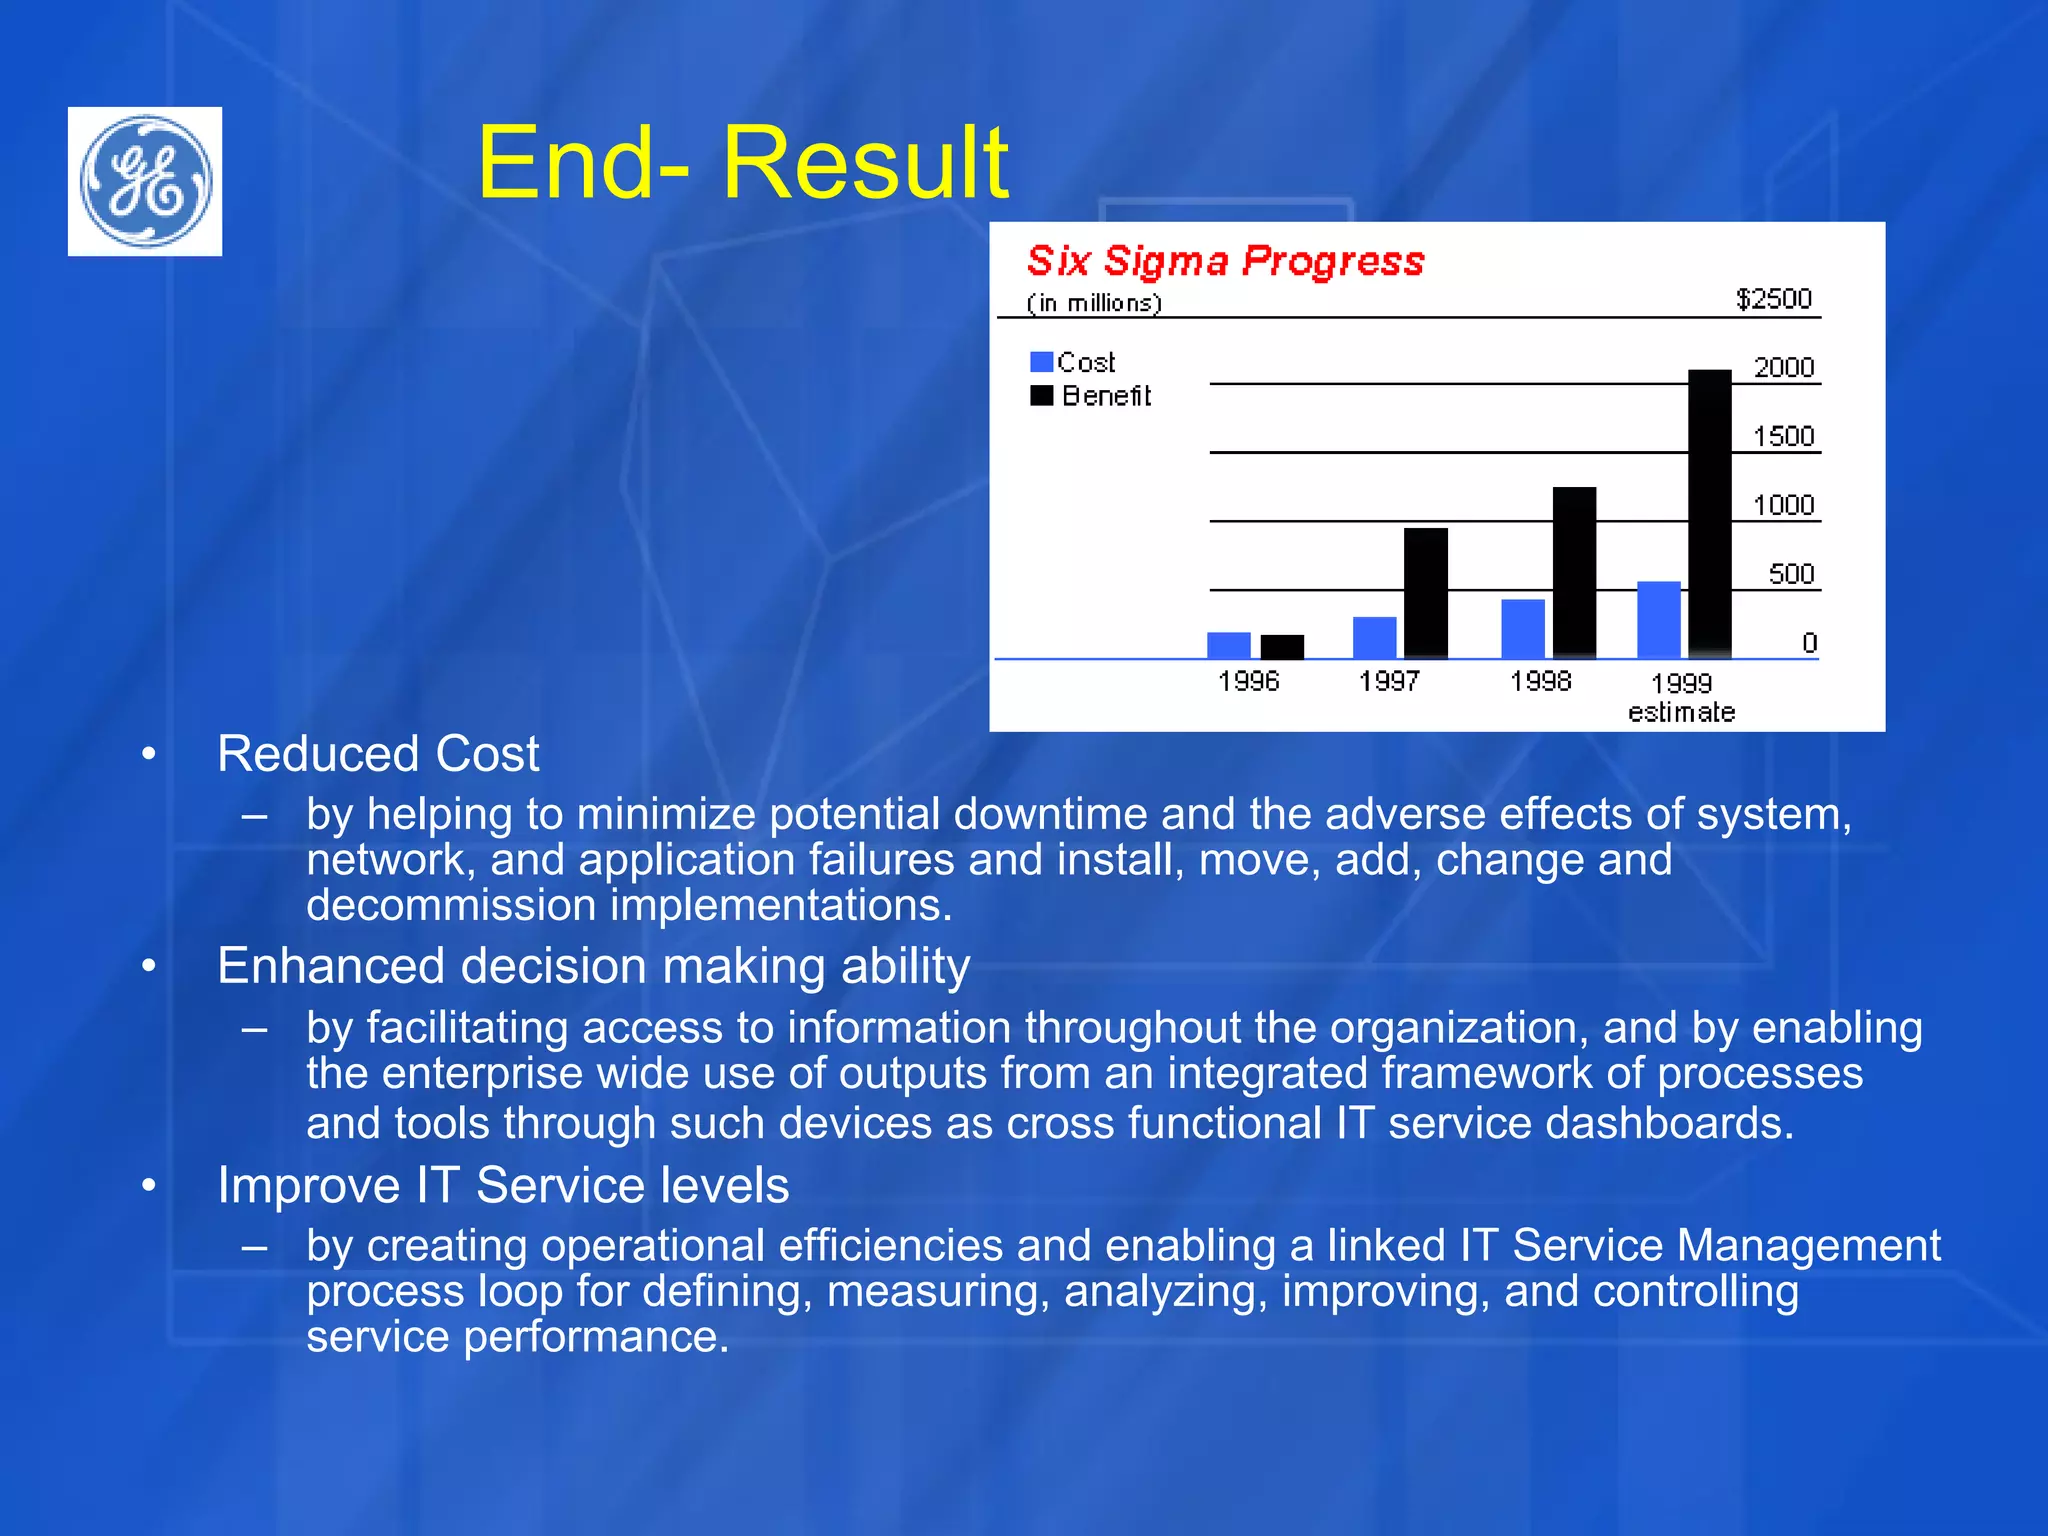
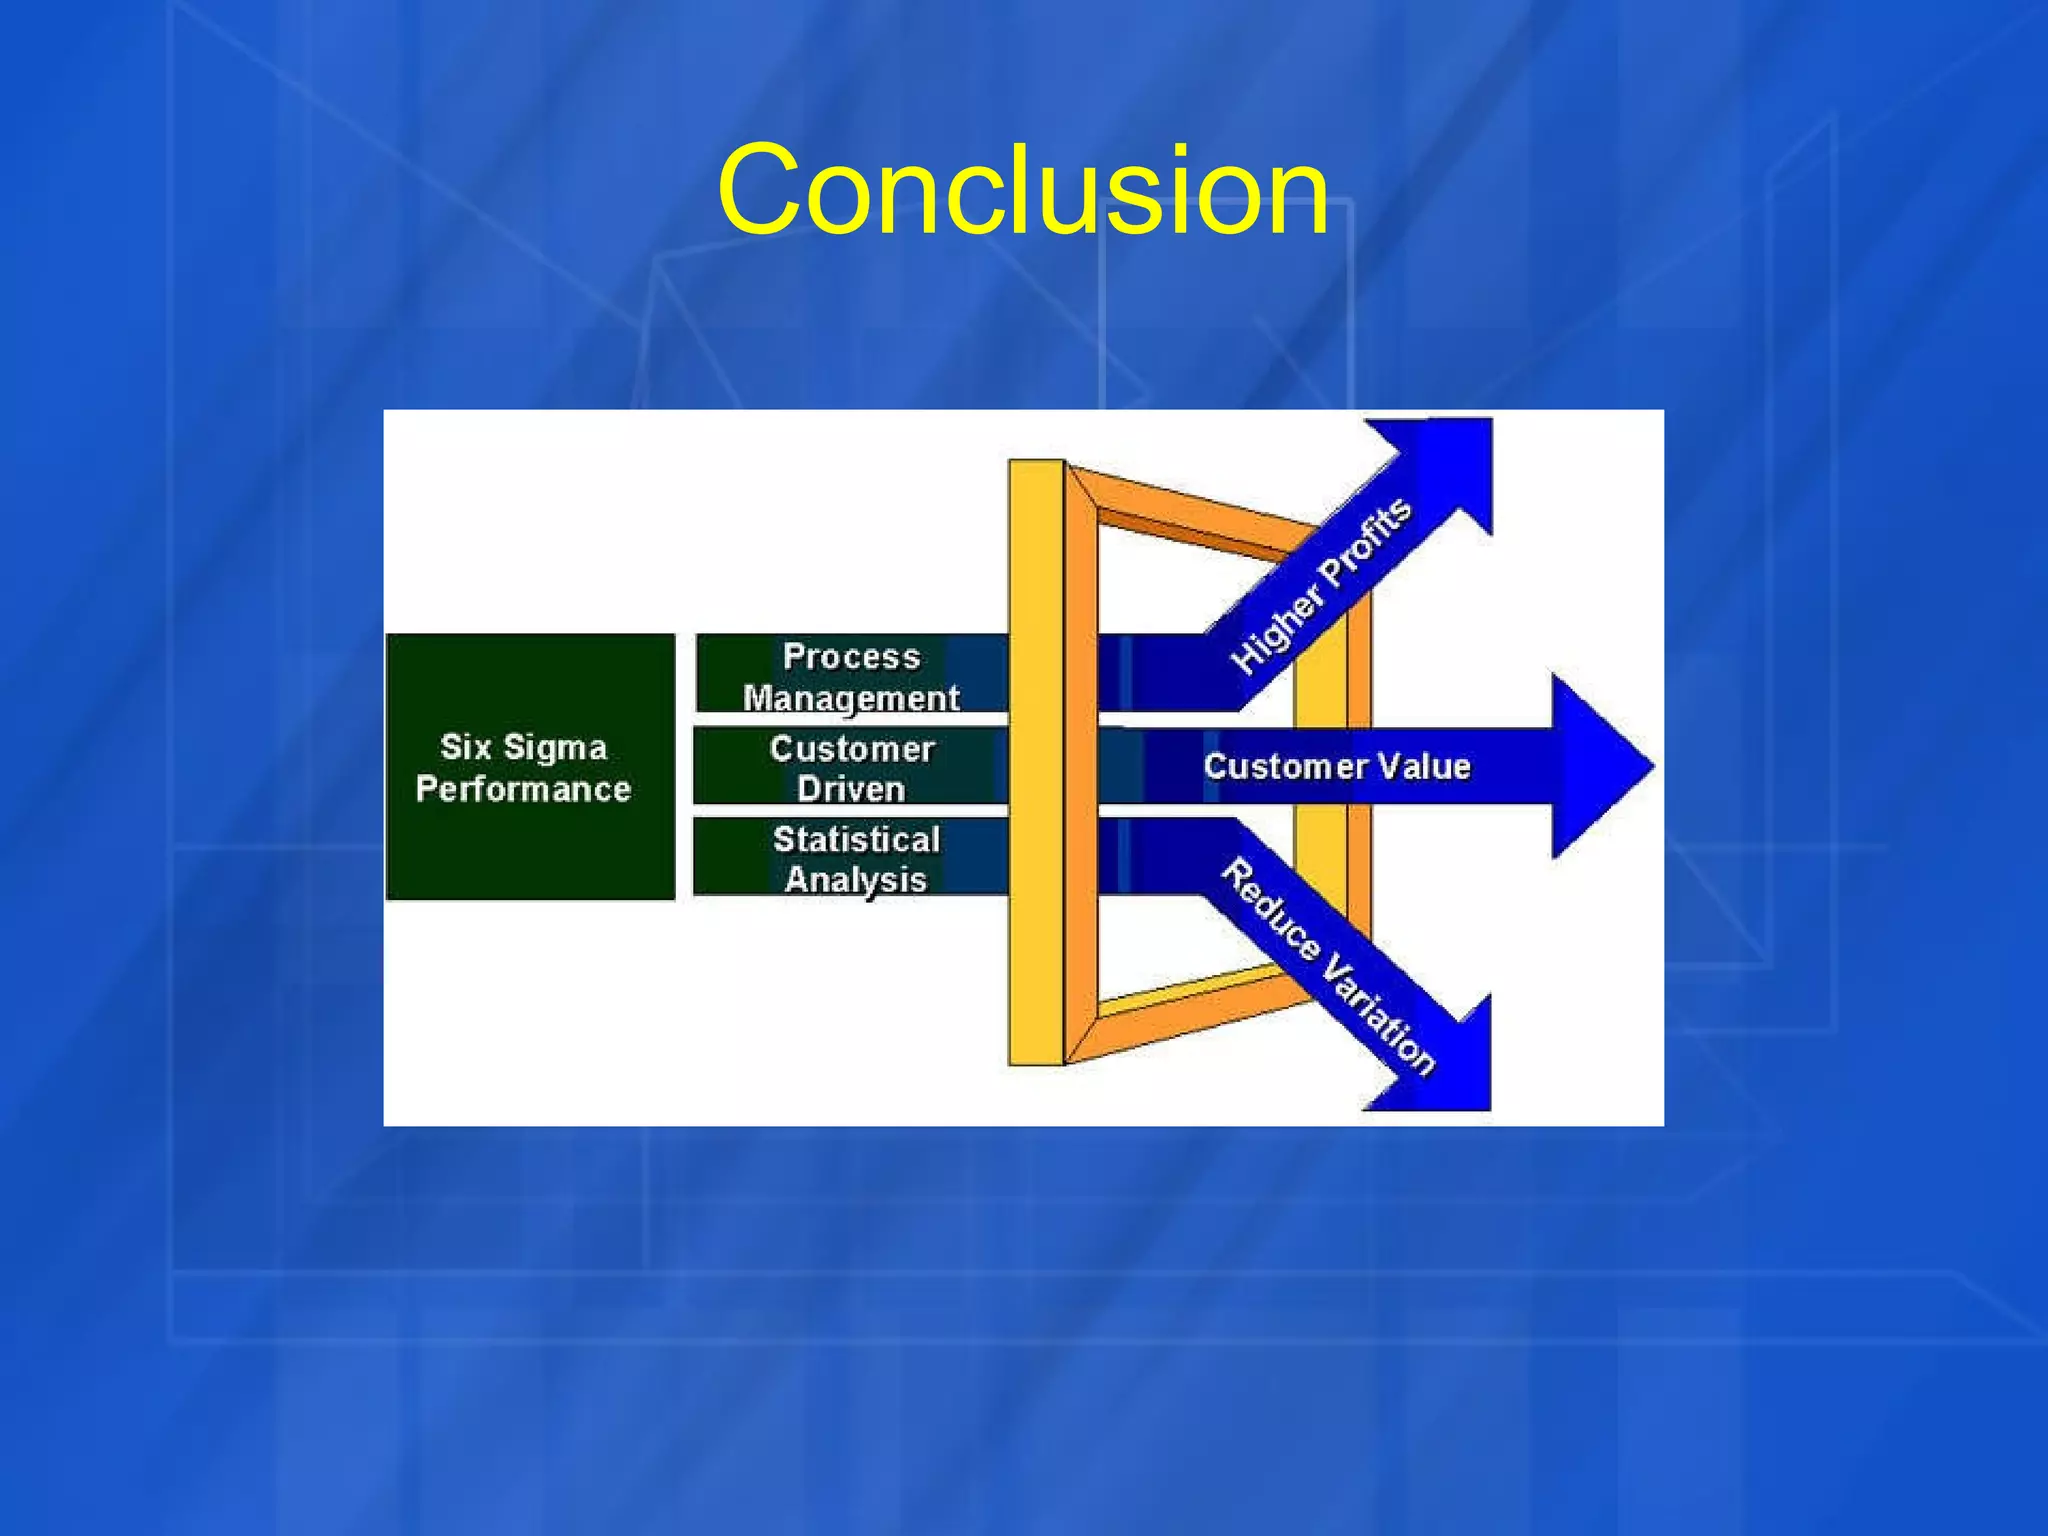
Magesh Mani Sohel Imroz Udaya Vangipurapu 4/27/2005 Improving IT Application Services with Six Sigma
Agenda Introduction Six Sigma process Synergy with IT Service Management Case Study Conclusion
Introduction Fastest growing business management system Developed by Motorola Popularized by GE
Introduction The process cannot produce more than 3.4 defects per million opportunities Two different processes in Six Sigma DMADV -  D efine  M easure  A nalyze  D esigns  V erifies the target processes; for  new   processes DMAIC-  D efine  M easure  A nalyze  I mprove and  C ontrol the target process; for  existing   processes
Six Sigma process
Define Phase Core processes Scope of the project Requirements Resources Organizational support Tools: Project Charter,  Process Flowchart
Measure Phase Quantify and benchmark using actual data Average performance, variation Process capabilities Data collection plan Detailed process map Tools: Process Flowchart,  Benchmarking
Analyze Phase Apply statistical tools Identify root cause of problem Formulate opinions for improvement Hypothesis testing Tools: Histogram,  Pareto Chart,  Regression Analysis, etc.
Improve Phase Ideas and solution put to work Find the best solution Experiment and trials Develop standards and procedures Finalize documentation Celebrate!! Tools: Control Chart,  Cost Savings calculation
Control Phase Performance tracking mechanisms and measurements Maintain the gains made in the project Implement the knowledge in other parts of the organization
Synergy with IT Service Management Any IT driven organization is expected to have corporate IT good practices, which is the focus of Organization’s IT Service Management strategy “ ITSM is a method to manage IT Service Provisioning across the enterprise and through a full cycle of Service Delivery and Service Support. By nature it uses best practices to manage the balance between Quality of Service and Cost of Service, with a focus on the profitability of the IT customers.”   As discussed, Six-Sigma-  a management’s initiative for quality improvement and cost reduction. Both focus on  Quality  and  Cost Reduction .
Benefits of leveraging Six Sigma with ITSM Provide better insight into the activities related to delivery and IT support services to the IT management Providing consistent IT support for critical business functions with better service quality. Benchmarking an accurate customer expectation level Improving the customer satisfaction experience for all the IT services provided to them. Improved understanding of the existing and proposed IT service capability and requirements. Better alignment of the personal effort linkage with the success of the business and to the value of IT services. Increased implementation time to incorporate the changes for a better success rate Usage of proven best practices to gain operational effectiveness in various processes of the business.
 
Case Study - 1 Challenge:  Improve IT service management practices internally Solution: Combining Six Sigma and ITIL® to improve IT service management at GE Business Value: Reduced Cost, Enhanced decision making ability, Improve IT service levels by creating operational efficiencies enabling a linked IT Service Management process loop for defining, measuring, analyzing, improving, and controlling service performance Cost Savings: Saved $12 billion over five years and added $1 to earnings per share.
Goals IT Consulting group at GE had the following goals: Achieve ISO compliance Leverage ITIL® best practices Determine the current state of IT service Continually improve Establish ongoing measurements to ensure improvement/control
1  - DEFINE OPPORTUNITIES The team produced 5 deliverables in the Define phase: Team Charter describes the purpose, goals, and resources for the project Data Collection Plan that includes such items as interview schedules and questions Critical to Quality (CTQ) outline that identifies the critical success factors Current Situation Analysis that was created using the CAT tool “ as-is” Process Map Outline that provides an understanding of the current processes to which the solution has to be aligned
2  – MEASURE PERFORMANCE The team produced 3 deliverables in the Measure phase: An accurate assessment Of current process performance Detailed “as-is” process maps Based on the outline created in phase-1 Critical success factors (CTQ) summary chart Based on the Critical To Quality outline
3  – ANALYZE FACTORS  IMPACTING PERFORMANCE The team produced 4 deliverables in the Analyze phase: Identified major process gaps Created am “opportunities table” that provides solutions to map the process gaps. Critical success factors (CTQ) benchmarked against IITL To identify opportunities for improvement Created a Cause and Effect diagram To demonstrate the effect of efficient process Pareto Chart for opportunities
4  – IMPROVE PERFORMANCE The team produced 3 deliverables in the Improve phase: “ to-be” process maps Were created based on innovative and cost effective ideas Prioritization Of potential Solutions based on the ROI Improvement in the following: Risk assessment Failure Modes and Effect Analysis (FMEA) Contingency Plan Creation of Solution Pilot
5  – CONTROL PERFORMANCE The team produced 5 deliverables in the Control phase: Implemented full solution successfully Defined Process metrics to control performance Created a Multi Generational Project Plan Implemented Control/Response plan (loop) Completed Risk Mitigation actions
Reduced Cost by helping to minimize potential downtime and the adverse effects of system, network, and application failures and install, move, add, change and decommission implementations.  Enhanced decision making ability by facilitating access to information throughout the organization, and by enabling the enterprise wide use of outputs from an integrated framework of processes and tools through such devices as cross functional IT service dashboards.   Improve IT Service levels by creating operational efficiencies and enabling a linked IT Service Management process loop for defining, measuring, analyzing, improving, and controlling service performance.  End- Result
Conclusion
Questions ???
Thank you Magesh Mani Sohel Imroz Udaya Vangipurapu

Improving IT application services with six sigma

  • 1.
    Magesh Mani SohelImroz Udaya Vangipurapu 4/27/2005 Improving IT Application Services with Six Sigma
  • 2.
    Agenda Introduction SixSigma process Synergy with IT Service Management Case Study Conclusion
  • 3.
    Introduction Fastest growingbusiness management system Developed by Motorola Popularized by GE
  • 4.
    Introduction The processcannot produce more than 3.4 defects per million opportunities Two different processes in Six Sigma DMADV - D efine M easure A nalyze D esigns V erifies the target processes; for new processes DMAIC- D efine M easure A nalyze I mprove and C ontrol the target process; for existing processes
  • 5.
  • 6.
    Define Phase Coreprocesses Scope of the project Requirements Resources Organizational support Tools: Project Charter, Process Flowchart
  • 7.
    Measure Phase Quantifyand benchmark using actual data Average performance, variation Process capabilities Data collection plan Detailed process map Tools: Process Flowchart, Benchmarking
  • 8.
    Analyze Phase Applystatistical tools Identify root cause of problem Formulate opinions for improvement Hypothesis testing Tools: Histogram, Pareto Chart, Regression Analysis, etc.
  • 9.
    Improve Phase Ideasand solution put to work Find the best solution Experiment and trials Develop standards and procedures Finalize documentation Celebrate!! Tools: Control Chart, Cost Savings calculation
  • 10.
    Control Phase Performancetracking mechanisms and measurements Maintain the gains made in the project Implement the knowledge in other parts of the organization
  • 11.
    Synergy with ITService Management Any IT driven organization is expected to have corporate IT good practices, which is the focus of Organization’s IT Service Management strategy “ ITSM is a method to manage IT Service Provisioning across the enterprise and through a full cycle of Service Delivery and Service Support. By nature it uses best practices to manage the balance between Quality of Service and Cost of Service, with a focus on the profitability of the IT customers.” As discussed, Six-Sigma- a management’s initiative for quality improvement and cost reduction. Both focus on Quality and Cost Reduction .
  • 12.
    Benefits of leveragingSix Sigma with ITSM Provide better insight into the activities related to delivery and IT support services to the IT management Providing consistent IT support for critical business functions with better service quality. Benchmarking an accurate customer expectation level Improving the customer satisfaction experience for all the IT services provided to them. Improved understanding of the existing and proposed IT service capability and requirements. Better alignment of the personal effort linkage with the success of the business and to the value of IT services. Increased implementation time to incorporate the changes for a better success rate Usage of proven best practices to gain operational effectiveness in various processes of the business.
  • 13.
  • 14.
    Case Study -1 Challenge: Improve IT service management practices internally Solution: Combining Six Sigma and ITIL® to improve IT service management at GE Business Value: Reduced Cost, Enhanced decision making ability, Improve IT service levels by creating operational efficiencies enabling a linked IT Service Management process loop for defining, measuring, analyzing, improving, and controlling service performance Cost Savings: Saved $12 billion over five years and added $1 to earnings per share.
  • 15.
    Goals IT Consultinggroup at GE had the following goals: Achieve ISO compliance Leverage ITIL® best practices Determine the current state of IT service Continually improve Establish ongoing measurements to ensure improvement/control
  • 16.
    1 -DEFINE OPPORTUNITIES The team produced 5 deliverables in the Define phase: Team Charter describes the purpose, goals, and resources for the project Data Collection Plan that includes such items as interview schedules and questions Critical to Quality (CTQ) outline that identifies the critical success factors Current Situation Analysis that was created using the CAT tool “ as-is” Process Map Outline that provides an understanding of the current processes to which the solution has to be aligned
  • 17.
    2 –MEASURE PERFORMANCE The team produced 3 deliverables in the Measure phase: An accurate assessment Of current process performance Detailed “as-is” process maps Based on the outline created in phase-1 Critical success factors (CTQ) summary chart Based on the Critical To Quality outline
  • 18.
    3 –ANALYZE FACTORS IMPACTING PERFORMANCE The team produced 4 deliverables in the Analyze phase: Identified major process gaps Created am “opportunities table” that provides solutions to map the process gaps. Critical success factors (CTQ) benchmarked against IITL To identify opportunities for improvement Created a Cause and Effect diagram To demonstrate the effect of efficient process Pareto Chart for opportunities
  • 19.
    4 –IMPROVE PERFORMANCE The team produced 3 deliverables in the Improve phase: “ to-be” process maps Were created based on innovative and cost effective ideas Prioritization Of potential Solutions based on the ROI Improvement in the following: Risk assessment Failure Modes and Effect Analysis (FMEA) Contingency Plan Creation of Solution Pilot
  • 20.
    5 –CONTROL PERFORMANCE The team produced 5 deliverables in the Control phase: Implemented full solution successfully Defined Process metrics to control performance Created a Multi Generational Project Plan Implemented Control/Response plan (loop) Completed Risk Mitigation actions
  • 21.
    Reduced Cost byhelping to minimize potential downtime and the adverse effects of system, network, and application failures and install, move, add, change and decommission implementations. Enhanced decision making ability by facilitating access to information throughout the organization, and by enabling the enterprise wide use of outputs from an integrated framework of processes and tools through such devices as cross functional IT service dashboards. Improve IT Service levels by creating operational efficiencies and enabling a linked IT Service Management process loop for defining, measuring, analyzing, improving, and controlling service performance. End- Result
  • 22.
  • 23.
  • 24.
    Thank you MageshMani Sohel Imroz Udaya Vangipurapu