Downloaded 174 times


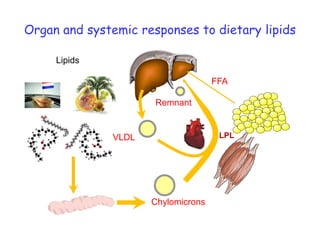
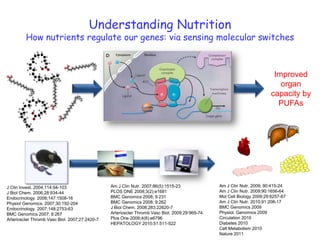
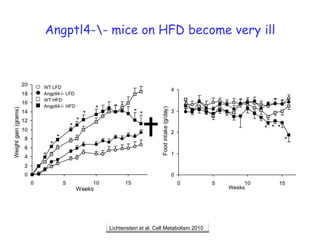
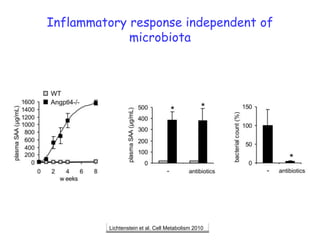
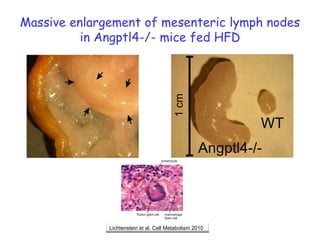
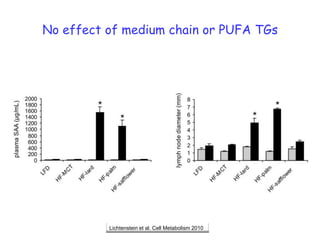
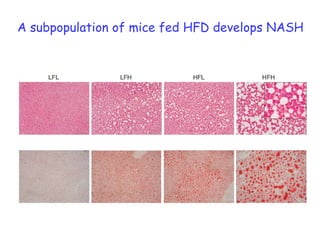
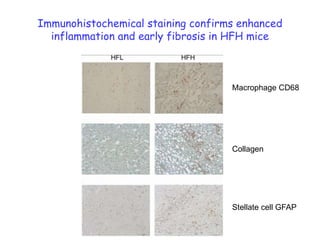
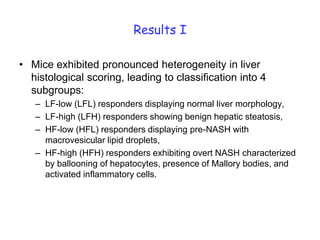
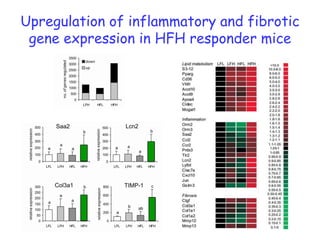
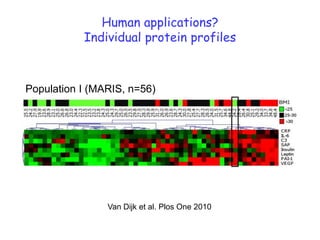
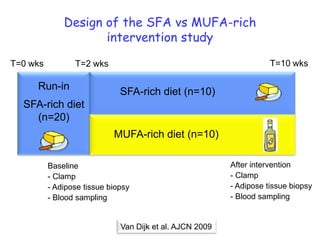
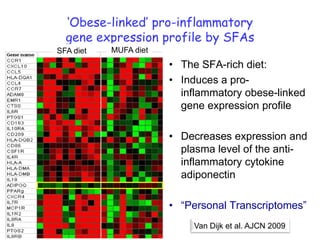
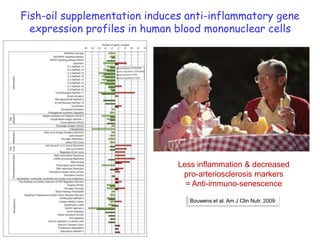


1) The document discusses nutrigenomics research on the effects of different types of dietary fats on human health. Certain long chain saturated fats are described as potentially pro-inflammatory, while unsaturated fats like omega-3 PUFAs are anti-inflammatory. 2) Studies in mice found that a high-fat diet led to heterogeneity in liver responses, with some mice developing non-alcoholic steatohepatitis (NASH) due to interactions between dysfunctional adipose tissue and the liver. Certain plasma proteins were identified as potential early biomarkers for NASH. 3) Human studies found that saturated fat-rich diets induced pro-inflammatory gene expression in adipose tissue and blood cells


