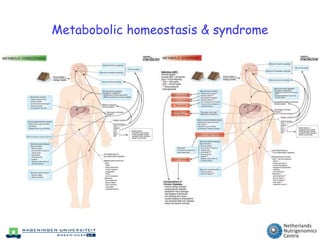
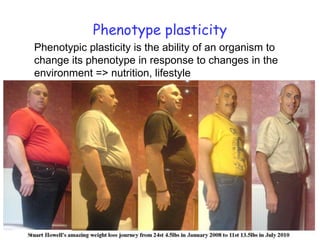
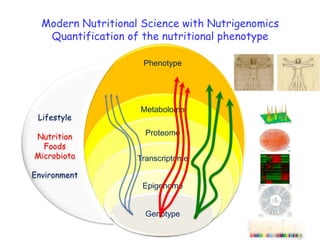
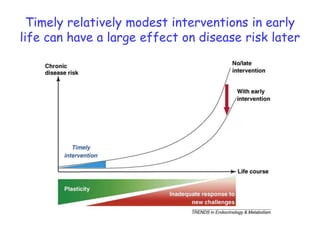
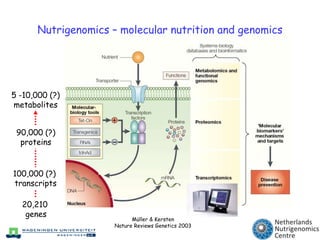
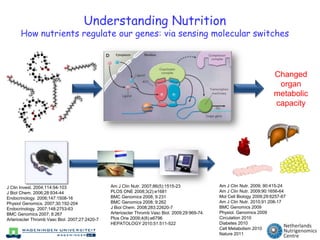
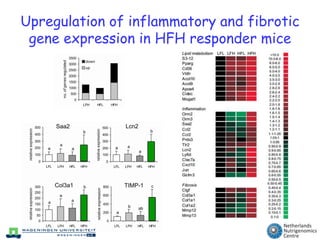
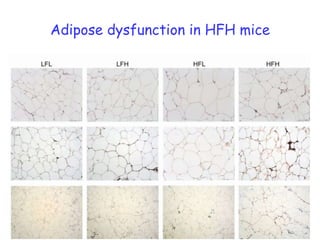
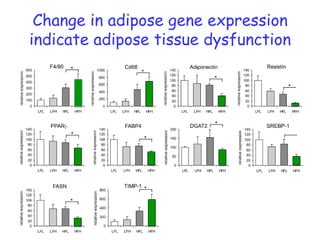
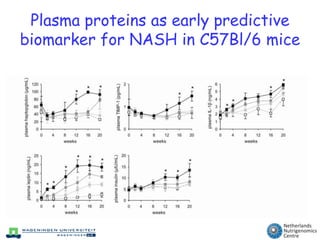
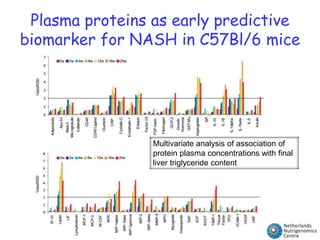
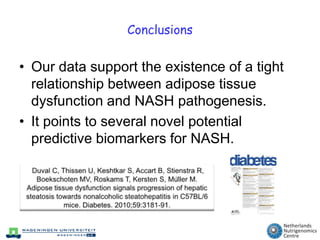
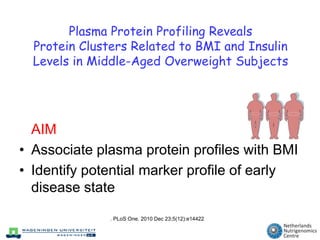
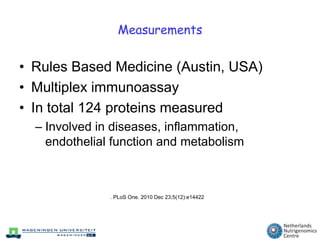
Using nutrigenomics to study ranges and plasticity in homeostasishttp://twitter.com/nutrigenomicsMichael MüllerNetherlands Nutrigenomics Centre& Nutrition, Metabolism and Genomics GroupDivision of Human Nutrition, Wageningen University
Our scientific challenge: What's healthy?
Metabobolic homeostasis & syndrome
Metabolic health = plasticity / flexibilityThe personal genome is the starting point & we can get comprehensive information about it but we should not underestimate the challenges of“bioinformatics & databasing”Health is dynamic: The property to adapt to metabolic perturbations / challenges Feeding / fasting => autophagy => cellular homeostasis & “exercise” Caloric restriction => chromatin “exercise”Food bioactives that modulate transcription (e.g. via nuclear receptors) or chromatin activity (nutriepigenome) => cell & organ “exercise”4
Phenotype plasticity	Phenotypic plasticity is the ability of an organism to change its phenotype in response to changes in the environment => nutrition, lifestyle
Duality of biological information:Epigenetic & Genetic
Modern Nutritional Science with Nutrigenomics Quantification of the nutritional phenotype LifestyleNutritionFoodsMicrobiotaEnvironment
Timelyrelatively modest interventions in early life can have a large effect on disease risk later
Nutrigenomics – molecular nutrition and genomics5 -10,000 (?)metabolites90,000 (?)proteins100,000 (?) transcripts20,210 genesMüller & KerstenNature Reviews Genetics 2003
Understanding NutritionHow nutrients regulate our genes: via sensing molecular switchesChanged organ metabolic capacityAm J ClinNutr. 2009; 90:415-24Am J ClinNutr. 2009;90:1656-64Mol CellBiology2009;29:6257-67Am J ClinNutr. 2010;91:208-17BMC Genomics2009Physiol. Genomics2009Circulation 2010Diabetes 2010Cell Metabolism 2010Nature 2011Am J Clin Nutr. 2007;86(5):1515-23PLOS ONE 2008;3(2):e1681 BMC Genomics 2008; 9:231BMC Genomics 2008; 9:262J Biol Chem. 2008;283:22620-7Arterioscler Thromb Vasc Biol. 2009;29:969-74.Plos One 2009;4(8):e6796HEPATOLOGY 2010;51:511-522J Clin Invest. 2004;114:94-103J Biol Chem. 2006;28:934-44 Endocrinology. 2006;147:1508-16Physiol Genomics. 2007;30:192-204Endocrinology. 2007;148:2753-63 BMC Genomics 2007; 8:267 Arterioscler Thromb Vasc Biol. 2007;27:2420-7
Dose-dependent effects of dietary fat on development of obesity in relation to intestinal differential gene expression in C57BL/6J micePLOS one 2011
Robust & concentration dependent effects in small intestineDifferentially regulated intestinal genes by high fat dietC1C2C3C4C5C6C7C8C9C10PLOS one 2011
Cellular localization and specific lipid metabolism-related function of fat-dose dependently regulated genes PLOS one 2011
Intestinal capacity for lipid absorption 40 cm4 cmC1C2C3C4C5C6C7C8C9C10Microbiota             10% FAT                               45% FAT
Dangerous interaction - The two hitsStress from Metabolism & Inflammation
Liver, FAT & NASH/NAFLDNonalcoholic Fatty Liver Diseases (NAFLD):Liver component of Metabolic Syndrome
Different stages in NAFLD progression:
Molecular events involved in NASH pathogenesis:
Role of PPARa (Endocrinology 2008 & Hepatology 2010)
Role Kupffer cells (Hepatology 2010)
Role of macrophages in lipid metabolism (JBC 2008; Cell Metabolism 2010)hepatic steatosis 		              steatohepatitis (NASH) & fibrosiscirrhosis
Experimental Designtissue collectionrun-in diet20 weeks diet interventionplasma collectionmultiple proteinassaysliver
stratification on body weightfrozen sections: histological feat.lipid contentRNA extraction:Affx microarrays10 LFD0248121620 weeks20 LFD-3quality control & data analysis pipeline10 HFDMouse  genome 430 2.010% low fat diet (palm oil)45% high fat diet (palm oil)ep. white adipose tissueparaffin sections: histological feat.RNA extraction: real-time PCR
High fat diet-induced obesity0248121620HFLLFLHFHLFH2520**15**BW gain (g)*10****50weeks under diet interventionLiver TG contentHepatomegalyALT plasma activity20010100********160880**120660*Ratio LW/BW (%)mg TG/g liverALT activity (UI)80440**40220000LFLLFHHFLHFH
The HFH mice develops NASH
Immunohistochemicalstaining confirms enhanced liver inflammation and early fibrosis in HFH miceMacrophage CD68CollagenStellate cell GFAP
Upregulation of inflammatory and fibrotic gene expression in HFH responder mice
Adipose dysfunction in HFH mice
Change in adipose gene expression indicate adipose tissue dysfunction
Plasma proteins as early predictive biomarker for NASH in C57Bl/6 mice
Plasma proteins as early predictive biomarker for NASH in C57Bl/6 miceMultivariate analysis of association of protein plasma concentrations with final liver triglyceride content
ConclusionsOur data support the existence of a tight relationship between adipose tissue dysfunction and NASH pathogenesis.It points to several novel potential predictive biomarkers for NASH. Duval C, Thissen U, Keshtkar S, Accart B, Stienstra R, Boekschoten MV, Roskams T, Kersten S, Müller M. Adipose tissue dysfunction signals progression of hepatic steatosis towards nonalcoholic steatohepatitis in C57BL/6 mice. Diabetes. 2010;59:3181-91.
Plasma Protein Profiling Reveals Protein Clusters Related to BMI and Insulin Levels in Middle-Aged Overweight SubjectsAIMAssociate plasma protein profiles with BMIIdentifypotential marker profile of earlydisease state. PLoS One. 2010 Dec 23;5(12):e14422

Using nutrigenomics to study ranges and plasticity in homeostasis

  • 1.
    Using nutrigenomics tostudy ranges and plasticity in homeostasishttp://twitter.com/nutrigenomicsMichael MüllerNetherlands Nutrigenomics Centre& Nutrition, Metabolism and Genomics GroupDivision of Human Nutrition, Wageningen University
  • 2.
  • 3.
  • 4.
    Metabolic health =plasticity / flexibilityThe personal genome is the starting point & we can get comprehensive information about it but we should not underestimate the challenges of“bioinformatics & databasing”Health is dynamic: The property to adapt to metabolic perturbations / challenges Feeding / fasting => autophagy => cellular homeostasis & “exercise” Caloric restriction => chromatin “exercise”Food bioactives that modulate transcription (e.g. via nuclear receptors) or chromatin activity (nutriepigenome) => cell & organ “exercise”4
  • 5.
    Phenotype plasticity Phenotypic plasticityis the ability of an organism to change its phenotype in response to changes in the environment => nutrition, lifestyle
  • 6.
    Duality of biologicalinformation:Epigenetic & Genetic
  • 7.
    Modern Nutritional Sciencewith Nutrigenomics Quantification of the nutritional phenotype LifestyleNutritionFoodsMicrobiotaEnvironment
  • 8.
    Timelyrelatively modest interventionsin early life can have a large effect on disease risk later
  • 9.
    Nutrigenomics – molecularnutrition and genomics5 -10,000 (?)metabolites90,000 (?)proteins100,000 (?) transcripts20,210 genesMüller & KerstenNature Reviews Genetics 2003
  • 10.
    Understanding NutritionHow nutrientsregulate our genes: via sensing molecular switchesChanged organ metabolic capacityAm J ClinNutr. 2009; 90:415-24Am J ClinNutr. 2009;90:1656-64Mol CellBiology2009;29:6257-67Am J ClinNutr. 2010;91:208-17BMC Genomics2009Physiol. Genomics2009Circulation 2010Diabetes 2010Cell Metabolism 2010Nature 2011Am J Clin Nutr. 2007;86(5):1515-23PLOS ONE 2008;3(2):e1681 BMC Genomics 2008; 9:231BMC Genomics 2008; 9:262J Biol Chem. 2008;283:22620-7Arterioscler Thromb Vasc Biol. 2009;29:969-74.Plos One 2009;4(8):e6796HEPATOLOGY 2010;51:511-522J Clin Invest. 2004;114:94-103J Biol Chem. 2006;28:934-44 Endocrinology. 2006;147:1508-16Physiol Genomics. 2007;30:192-204Endocrinology. 2007;148:2753-63 BMC Genomics 2007; 8:267 Arterioscler Thromb Vasc Biol. 2007;27:2420-7
  • 11.
    Dose-dependent effects ofdietary fat on development of obesity in relation to intestinal differential gene expression in C57BL/6J micePLOS one 2011
  • 12.
    Robust & concentrationdependent effects in small intestineDifferentially regulated intestinal genes by high fat dietC1C2C3C4C5C6C7C8C9C10PLOS one 2011
  • 13.
    Cellular localization andspecific lipid metabolism-related function of fat-dose dependently regulated genes PLOS one 2011
  • 14.
    Intestinal capacity forlipid absorption 40 cm4 cmC1C2C3C4C5C6C7C8C9C10Microbiota 10% FAT 45% FAT
  • 16.
    Dangerous interaction -The two hitsStress from Metabolism & Inflammation
  • 17.
    Liver, FAT &NASH/NAFLDNonalcoholic Fatty Liver Diseases (NAFLD):Liver component of Metabolic Syndrome
  • 18.
    Different stages inNAFLD progression:
  • 19.
    Molecular events involvedin NASH pathogenesis:
  • 20.
    Role of PPARa(Endocrinology 2008 & Hepatology 2010)
  • 21.
    Role Kupffer cells(Hepatology 2010)
  • 22.
    Role of macrophagesin lipid metabolism (JBC 2008; Cell Metabolism 2010)hepatic steatosis steatohepatitis (NASH) & fibrosiscirrhosis
  • 23.
    Experimental Designtissue collectionrun-indiet20 weeks diet interventionplasma collectionmultiple proteinassaysliver
  • 24.
    stratification on bodyweightfrozen sections: histological feat.lipid contentRNA extraction:Affx microarrays10 LFD0248121620 weeks20 LFD-3quality control & data analysis pipeline10 HFDMouse genome 430 2.010% low fat diet (palm oil)45% high fat diet (palm oil)ep. white adipose tissueparaffin sections: histological feat.RNA extraction: real-time PCR
  • 25.
    High fat diet-inducedobesity0248121620HFLLFLHFHLFH2520**15**BW gain (g)*10****50weeks under diet interventionLiver TG contentHepatomegalyALT plasma activity20010100********160880**120660*Ratio LW/BW (%)mg TG/g liverALT activity (UI)80440**40220000LFLLFHHFLHFH
  • 26.
    The HFH micedevelops NASH
  • 27.
    Immunohistochemicalstaining confirms enhancedliver inflammation and early fibrosis in HFH miceMacrophage CD68CollagenStellate cell GFAP
  • 28.
    Upregulation of inflammatoryand fibrotic gene expression in HFH responder mice
  • 29.
  • 30.
    Change in adiposegene expression indicate adipose tissue dysfunction
  • 31.
    Plasma proteins asearly predictive biomarker for NASH in C57Bl/6 mice
  • 32.
    Plasma proteins asearly predictive biomarker for NASH in C57Bl/6 miceMultivariate analysis of association of protein plasma concentrations with final liver triglyceride content
  • 33.
    ConclusionsOur data supportthe existence of a tight relationship between adipose tissue dysfunction and NASH pathogenesis.It points to several novel potential predictive biomarkers for NASH. Duval C, Thissen U, Keshtkar S, Accart B, Stienstra R, Boekschoten MV, Roskams T, Kersten S, Müller M. Adipose tissue dysfunction signals progression of hepatic steatosis towards nonalcoholic steatohepatitis in C57BL/6 mice. Diabetes. 2010;59:3181-91.
  • 34.
    Plasma Protein ProfilingReveals Protein Clusters Related to BMI and Insulin Levels in Middle-Aged Overweight SubjectsAIMAssociate plasma protein profiles with BMIIdentifypotential marker profile of earlydisease state. PLoS One. 2010 Dec 23;5(12):e14422

Editor's Notes

  • #17 Inflammation has been associated with many disease phenotypes including steatohepatitis or diabetes. This relationship is in particular when inflammation is chronic or non-resolving. There is an interaction between metabolism and inflammation with positive or negative consequences with respect to organ and systemic health.In my talk I will briefly discuss two unpublished studies, one investigating the important interaction of WAT and liver in particular under conditions of diet-induced obesity. Organ-specific macrophages in WAT and liver play an crucial role in progressing organ-specific inflammatory phenotypes. In the second study we found very interesting interaction between dietary fat and macrophages in mesenteric lymph nodes that are exposed postprandially to very high concentrations of chylomicrons. We used a k.o. mouse for ANGPTL4 and could show that chronic consumption of saturated fat can be deadly.
  • #21 Haematoxylin and eosin staining (D) and oil red O staining (E) of representative liver sections of the 4 subgroups
  • #22  (Immuno)histochemical staining confirms enhanced inflammation and early fibrosis in HFH miceImmunohistochemical staining of macrophage activation in representative liver section of HFL and HFH mice using antibody against the specific macrophagemarker Cd68Collagen staining using fast green FCF/sirius red F3B. Staining of stellate cell activation using antibody against GFAP.
  • #23 - Number of genes up- or down-regulated in the various subgroups in comparison to the LFL mice, as determined by Affymetrix GeneChip analysis. Genes with a p-value below 0.05 were considered significantly regulated. - Heat map showing changes in expression of selected genes involved in lipid metabolism, inflammation and fibrosis in liver. Changes in gene expression of selected genes as determined by real-time quantitative PCR. Mean expression in LFL mice was set at 100%. Error bars reflect standard deviation. Bars with different letters are statistically different (P<0.05 according to Student’s t-test). Number of mice per group: n=4 (LFL, HFL, HFH), n=6 (LFH).
  • #24 Haematoxylin and eosin staining of representative adipose tissue sections. Immunohistochemical staining of macrophages using antibody against Cd68. Collagen staining using fast green FCF/sirius red F3B.
  • #25 Adipose tissue mRNA expression of a selected group of genes was determined by quantitative real-time PCR after 21 weeks of dietary intervention. Mean expression in LFL mice was set at 100%. Error bars reflect standard deviation. * = significantly different from HFL mice according to Student’s t-test (P<0.05). Number of mice per group: n=4 (LFL, HFL, HFH), n=6 (LFH).
  • #26 . A) Plasma concentration of haptoglobin, TIMP-1, IL-1β, leptin and insulin were determined by multiplex assay at specific time points during the 21 weeks of dietary intervention after a 6h fast. White squares: LFL, Light grey squares: LFH, dark grey squares: HFL, black squares: HFH. Error bars reflect standard deviation. * = significantly different from HFL mice according to Student’s t-test (P<0.05). Number of mice per group: n=4 (LFL, HFL, HFH), n=6 (LFH).
  • #27 Graphs illustrating the result of multivariate analysis showing the association of protein plasma concentrations at various time points with final liver triglyceride content. Significant proteins display an inverse RSD value higher than 2 (bold line indicates the inverse RSD threshold value of 2).RSD = Relative standard deviation.