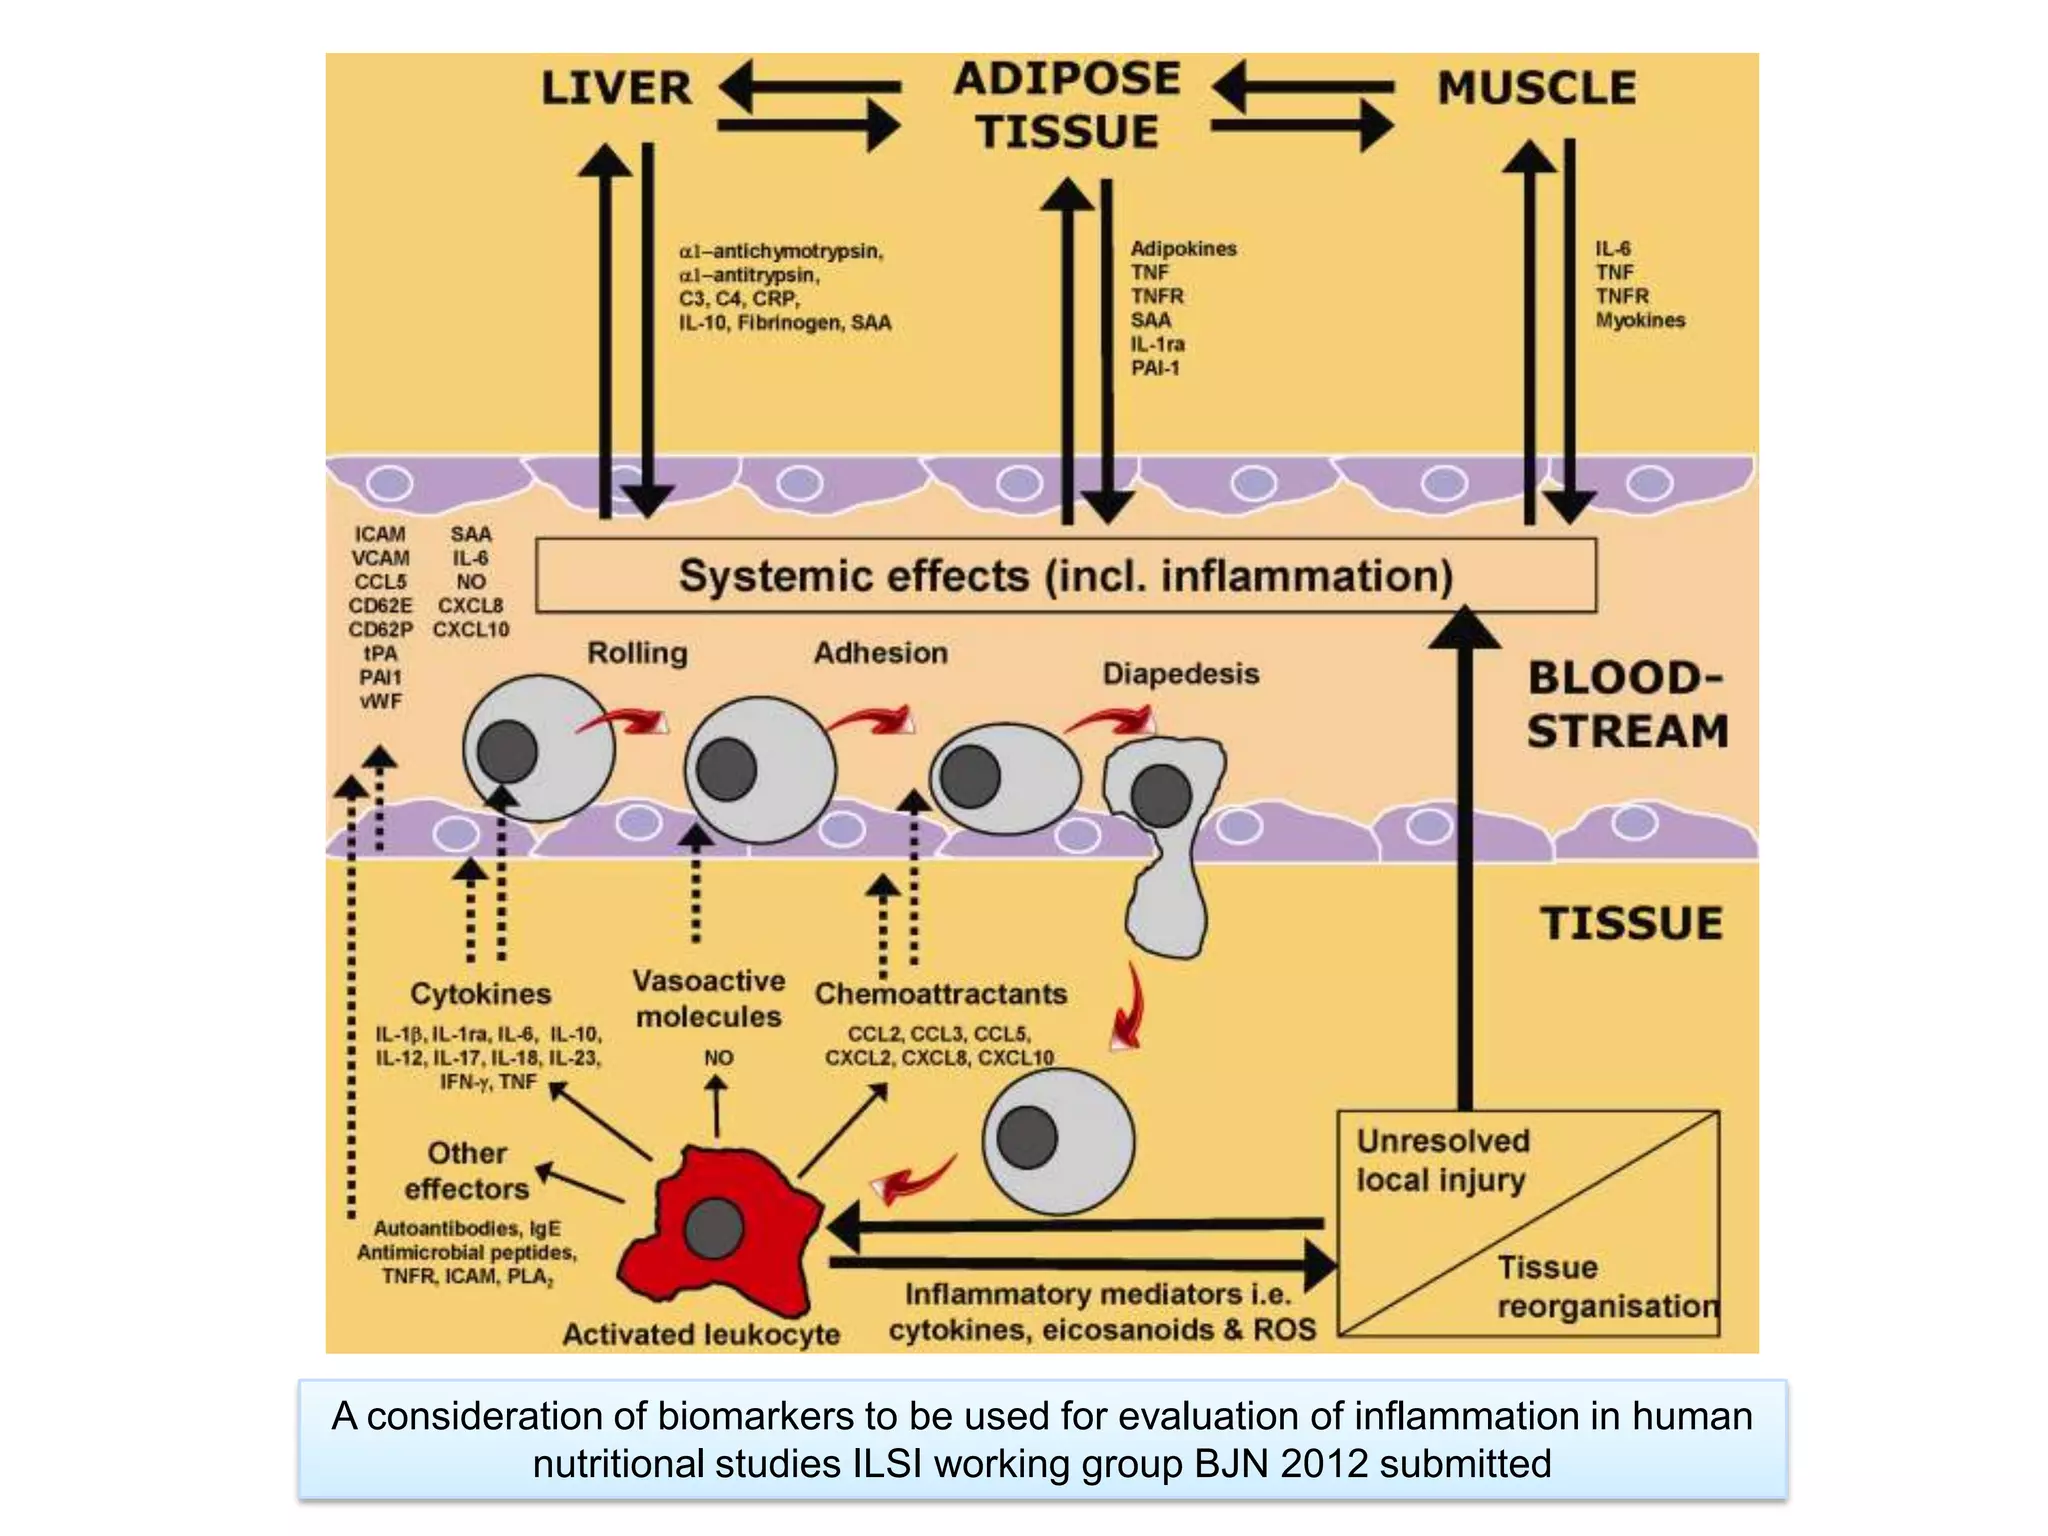
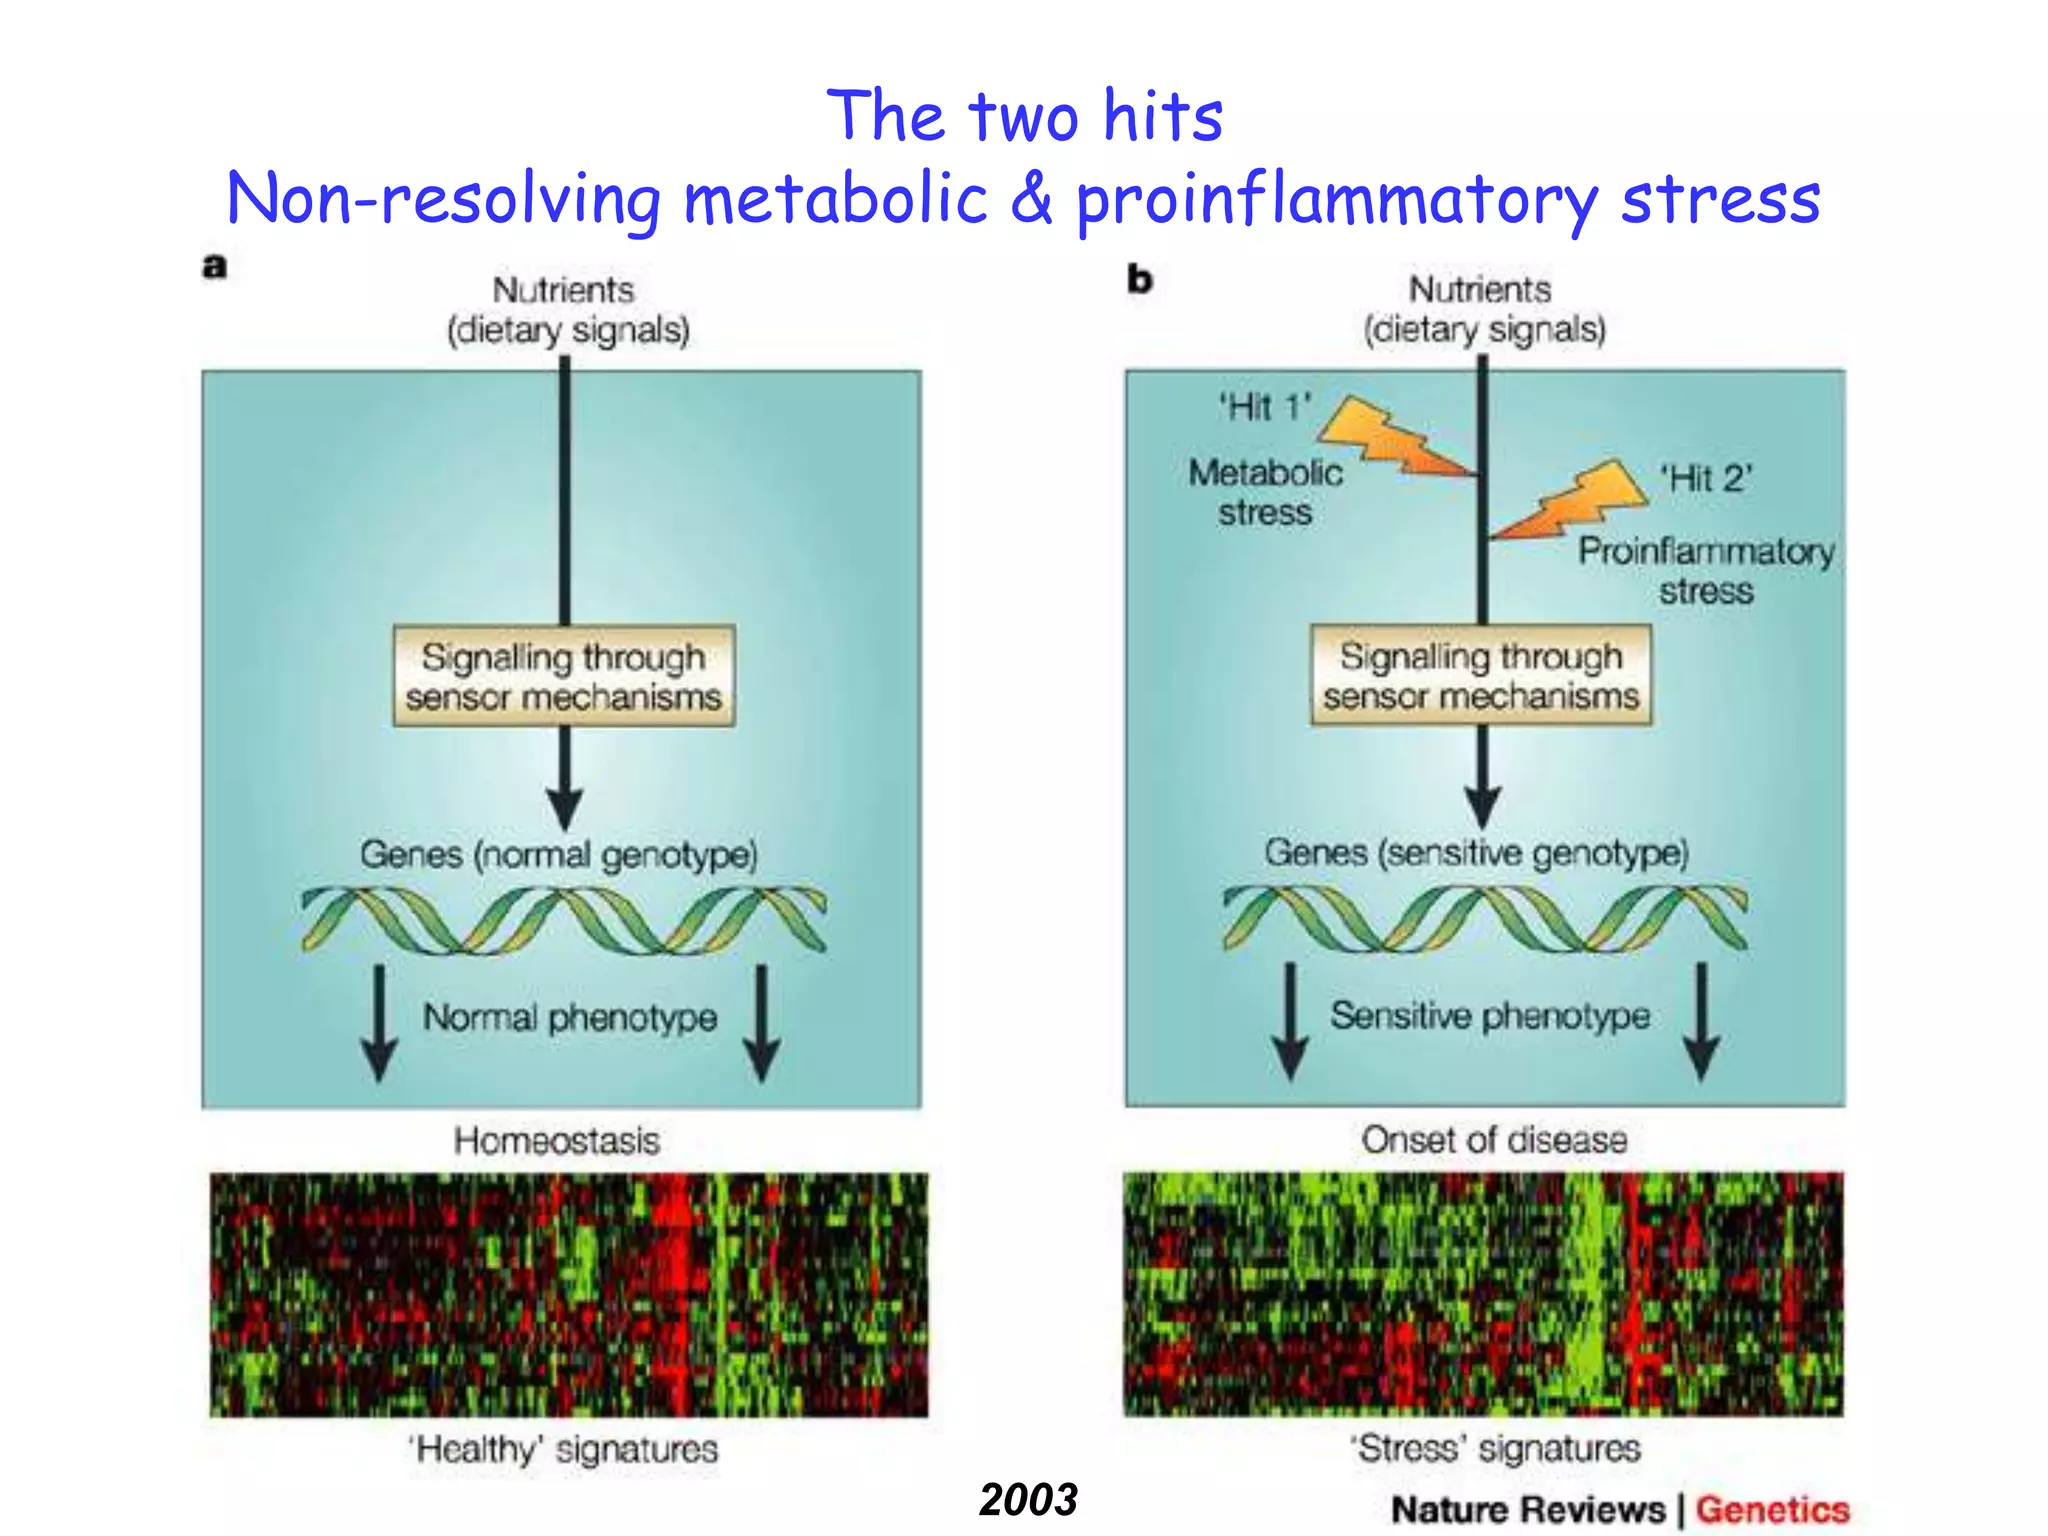
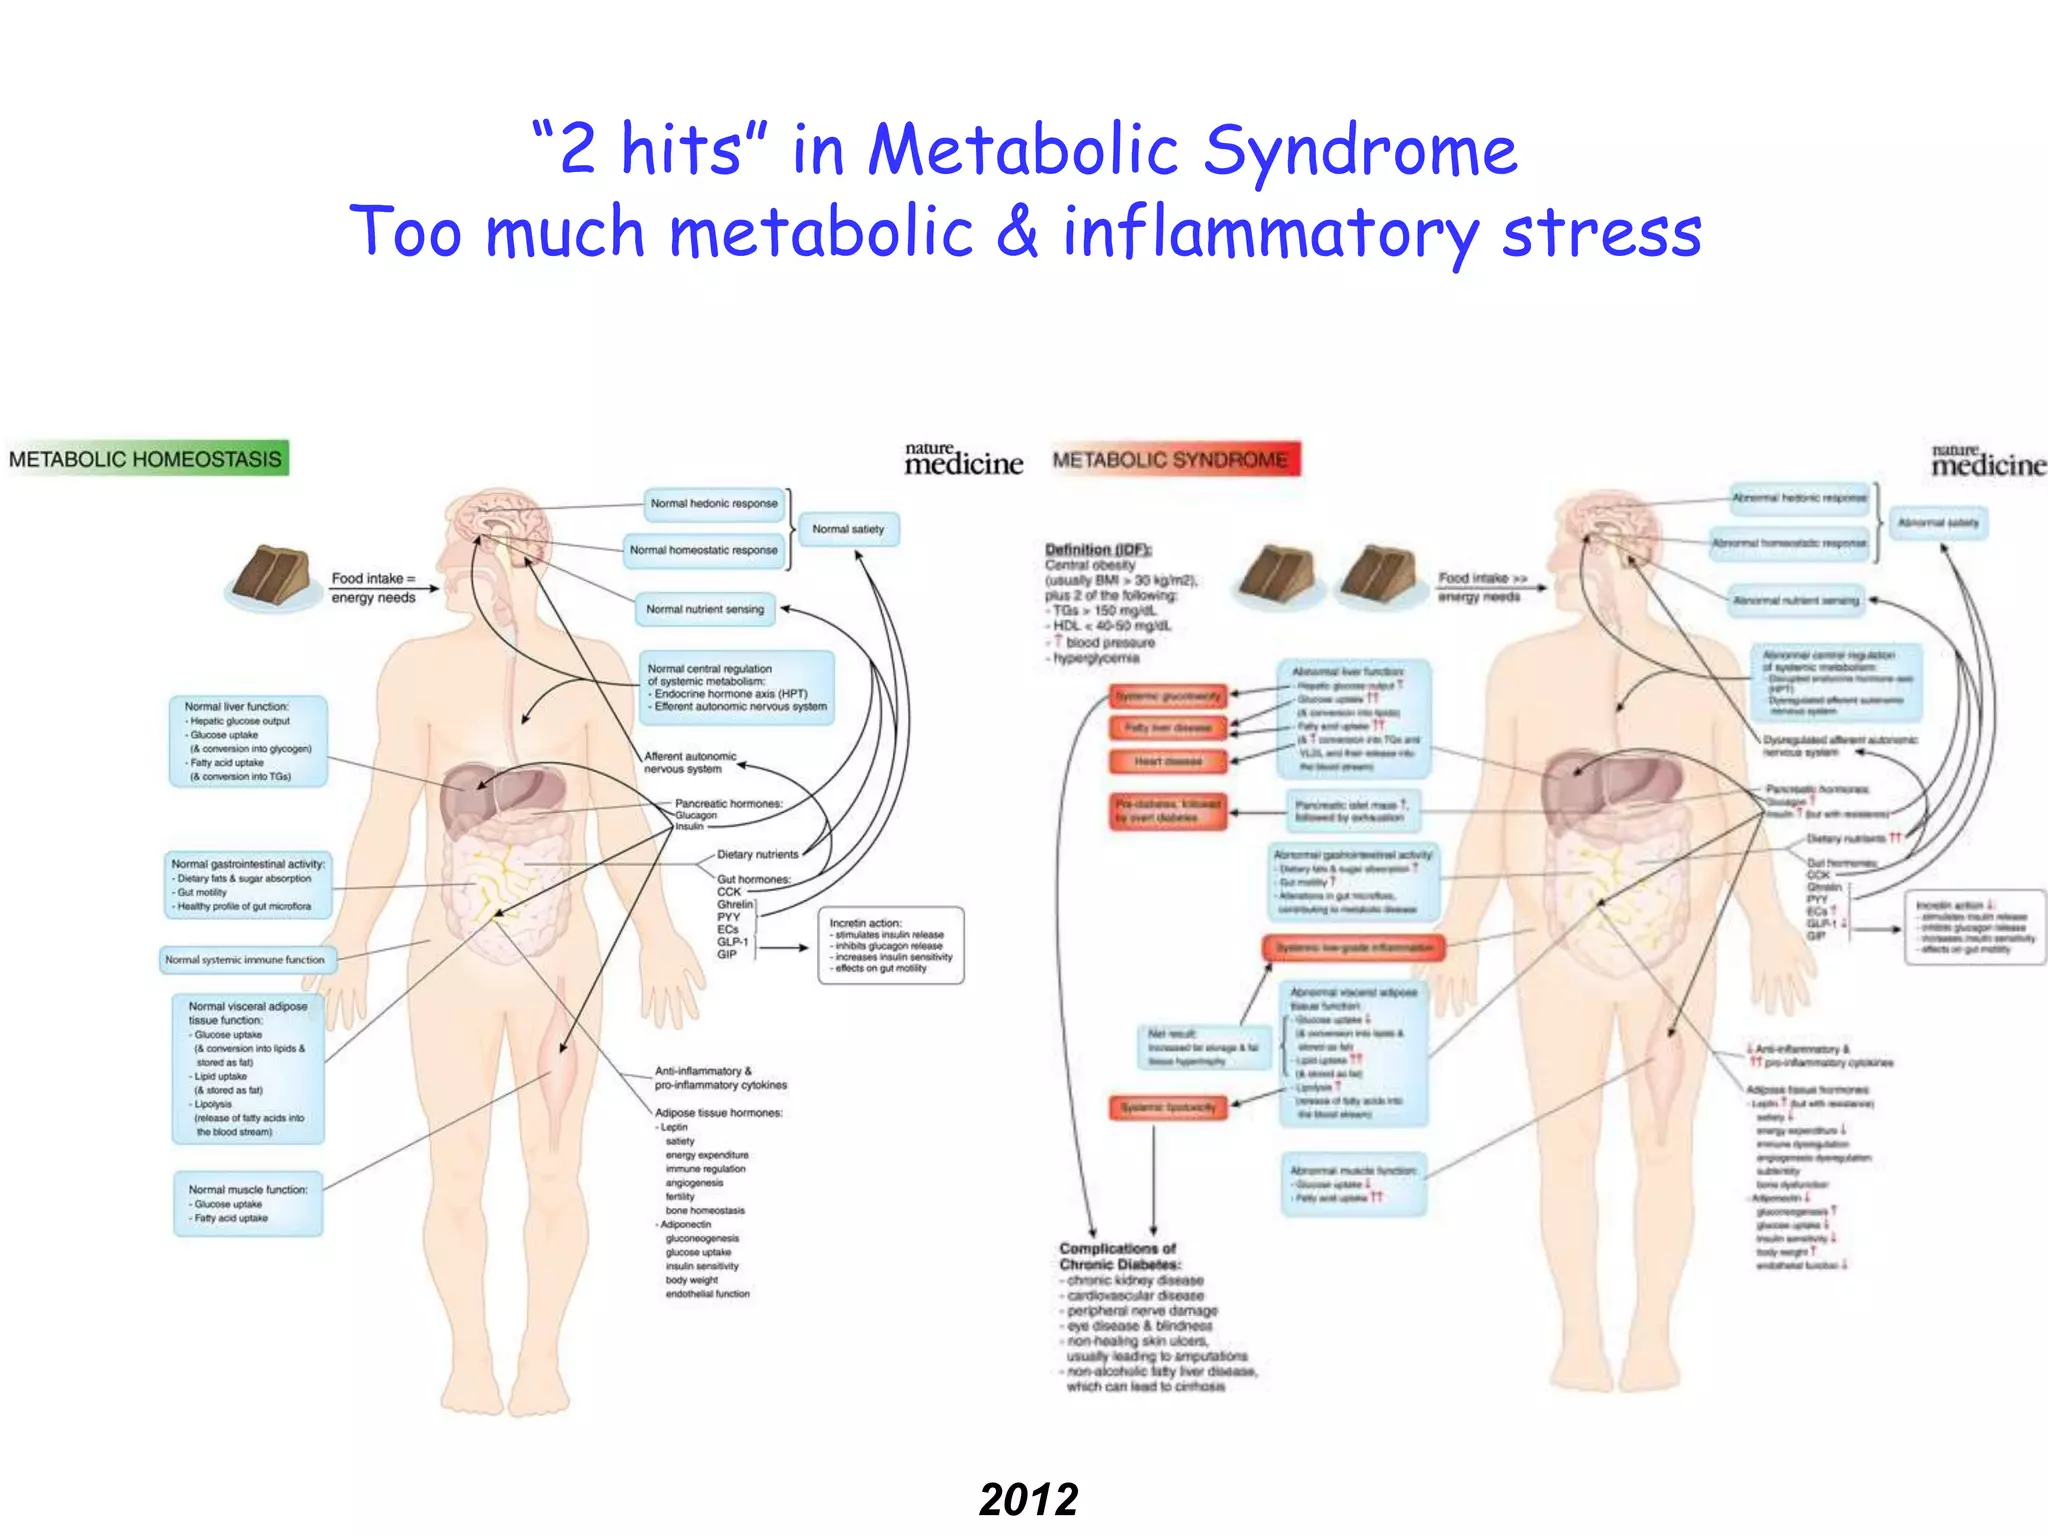
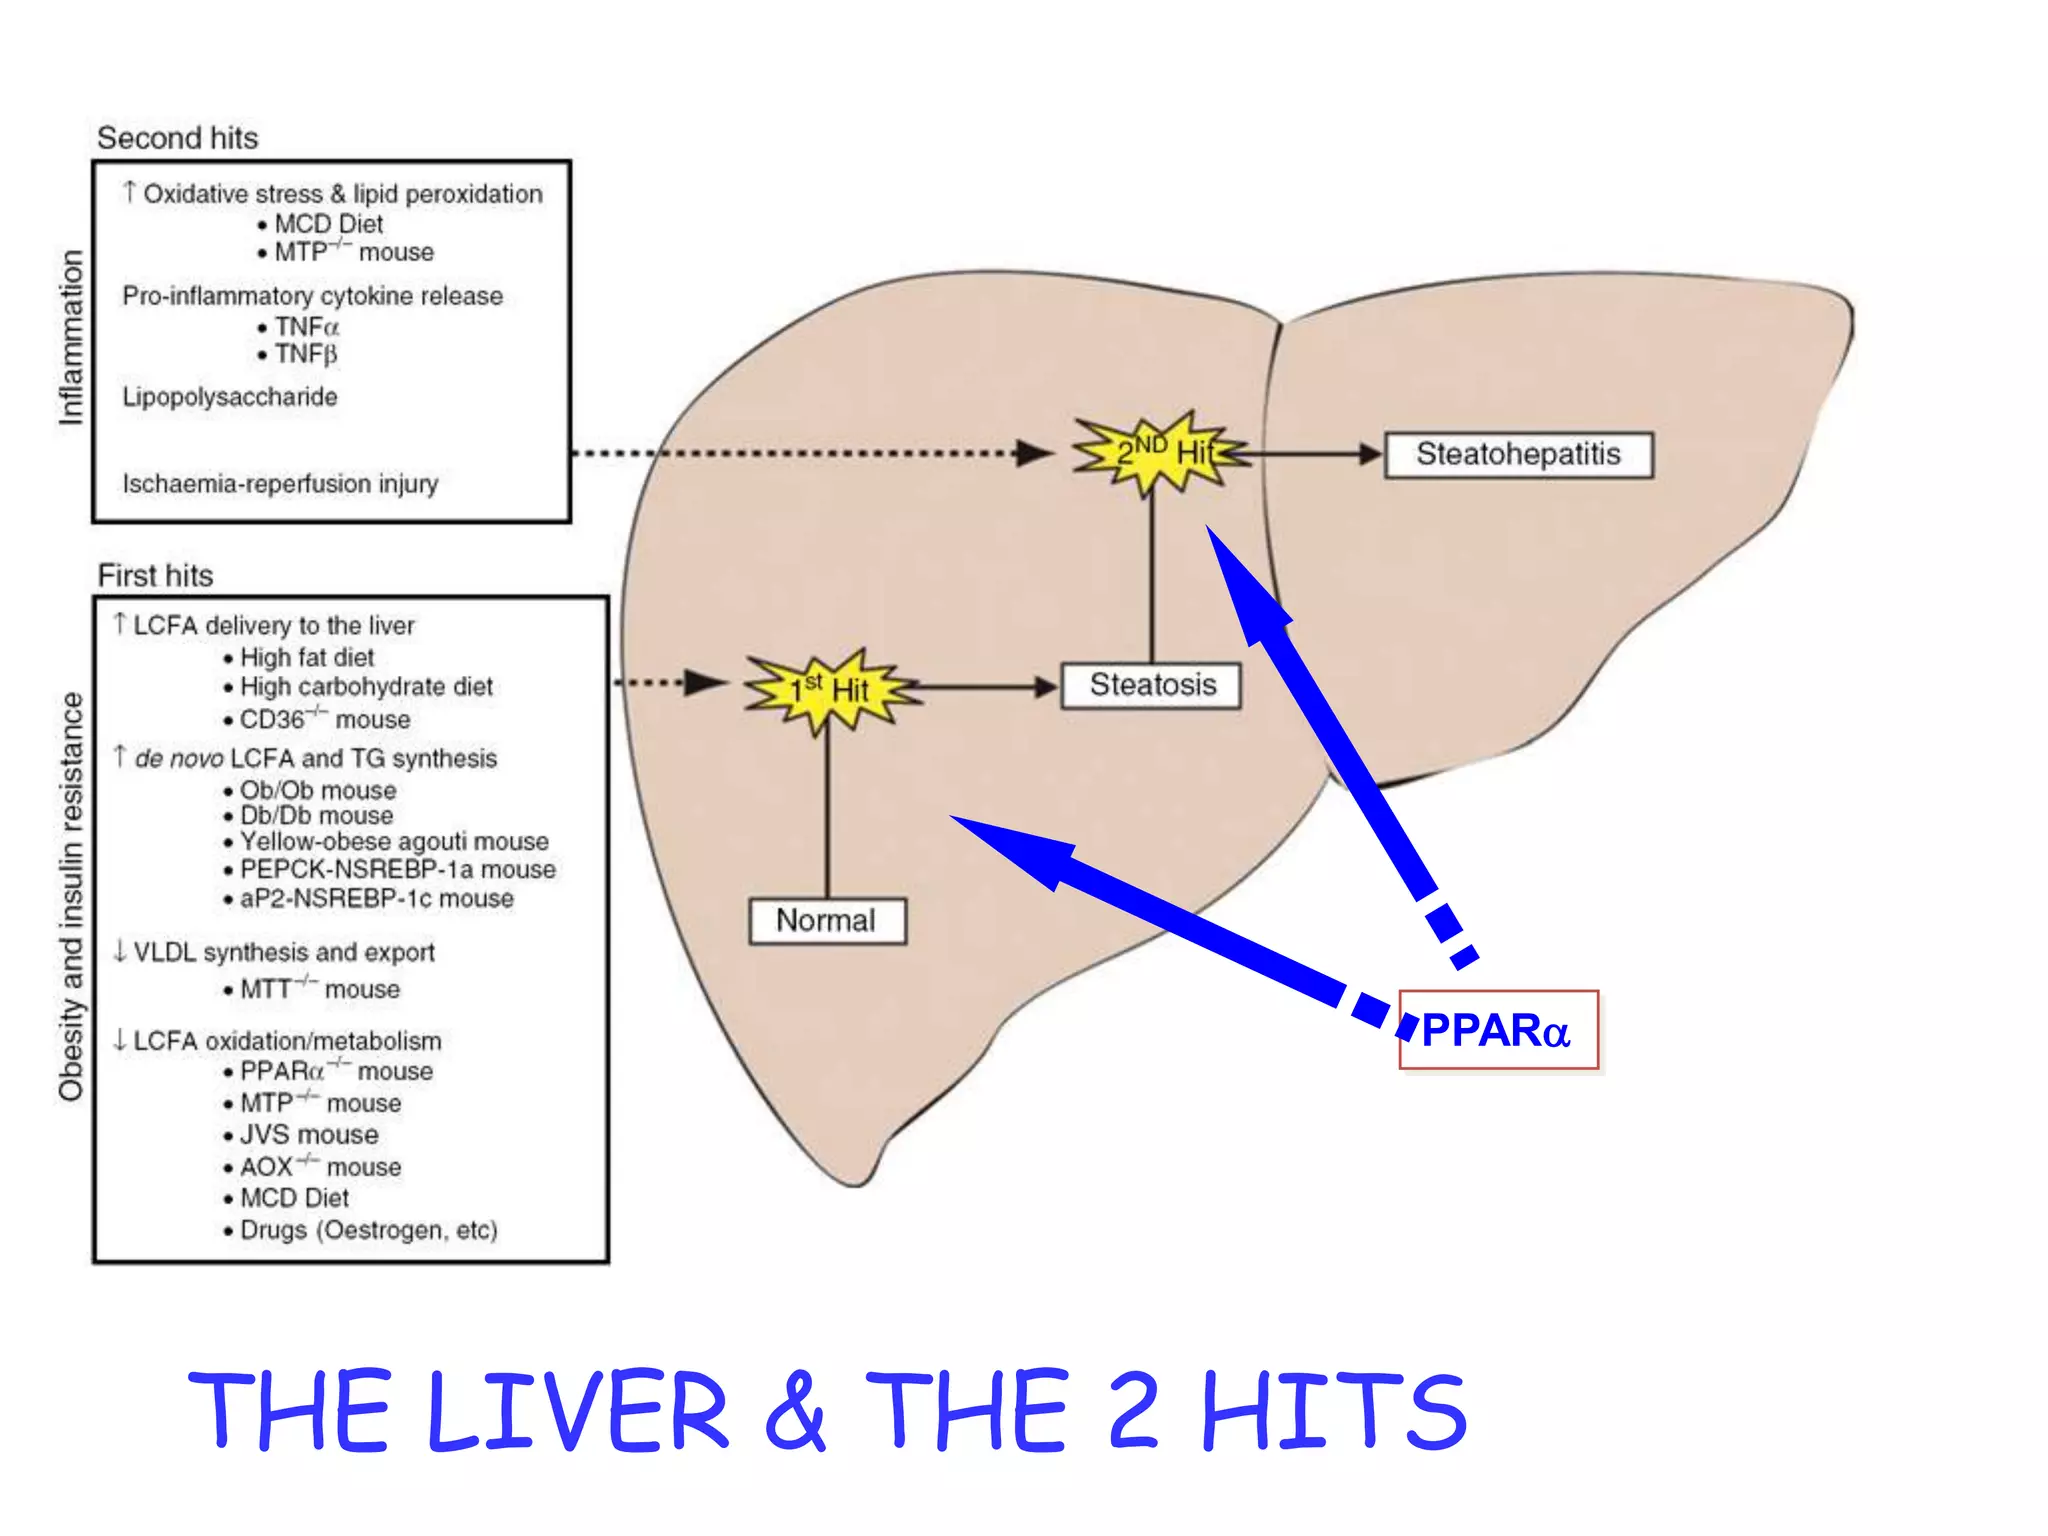
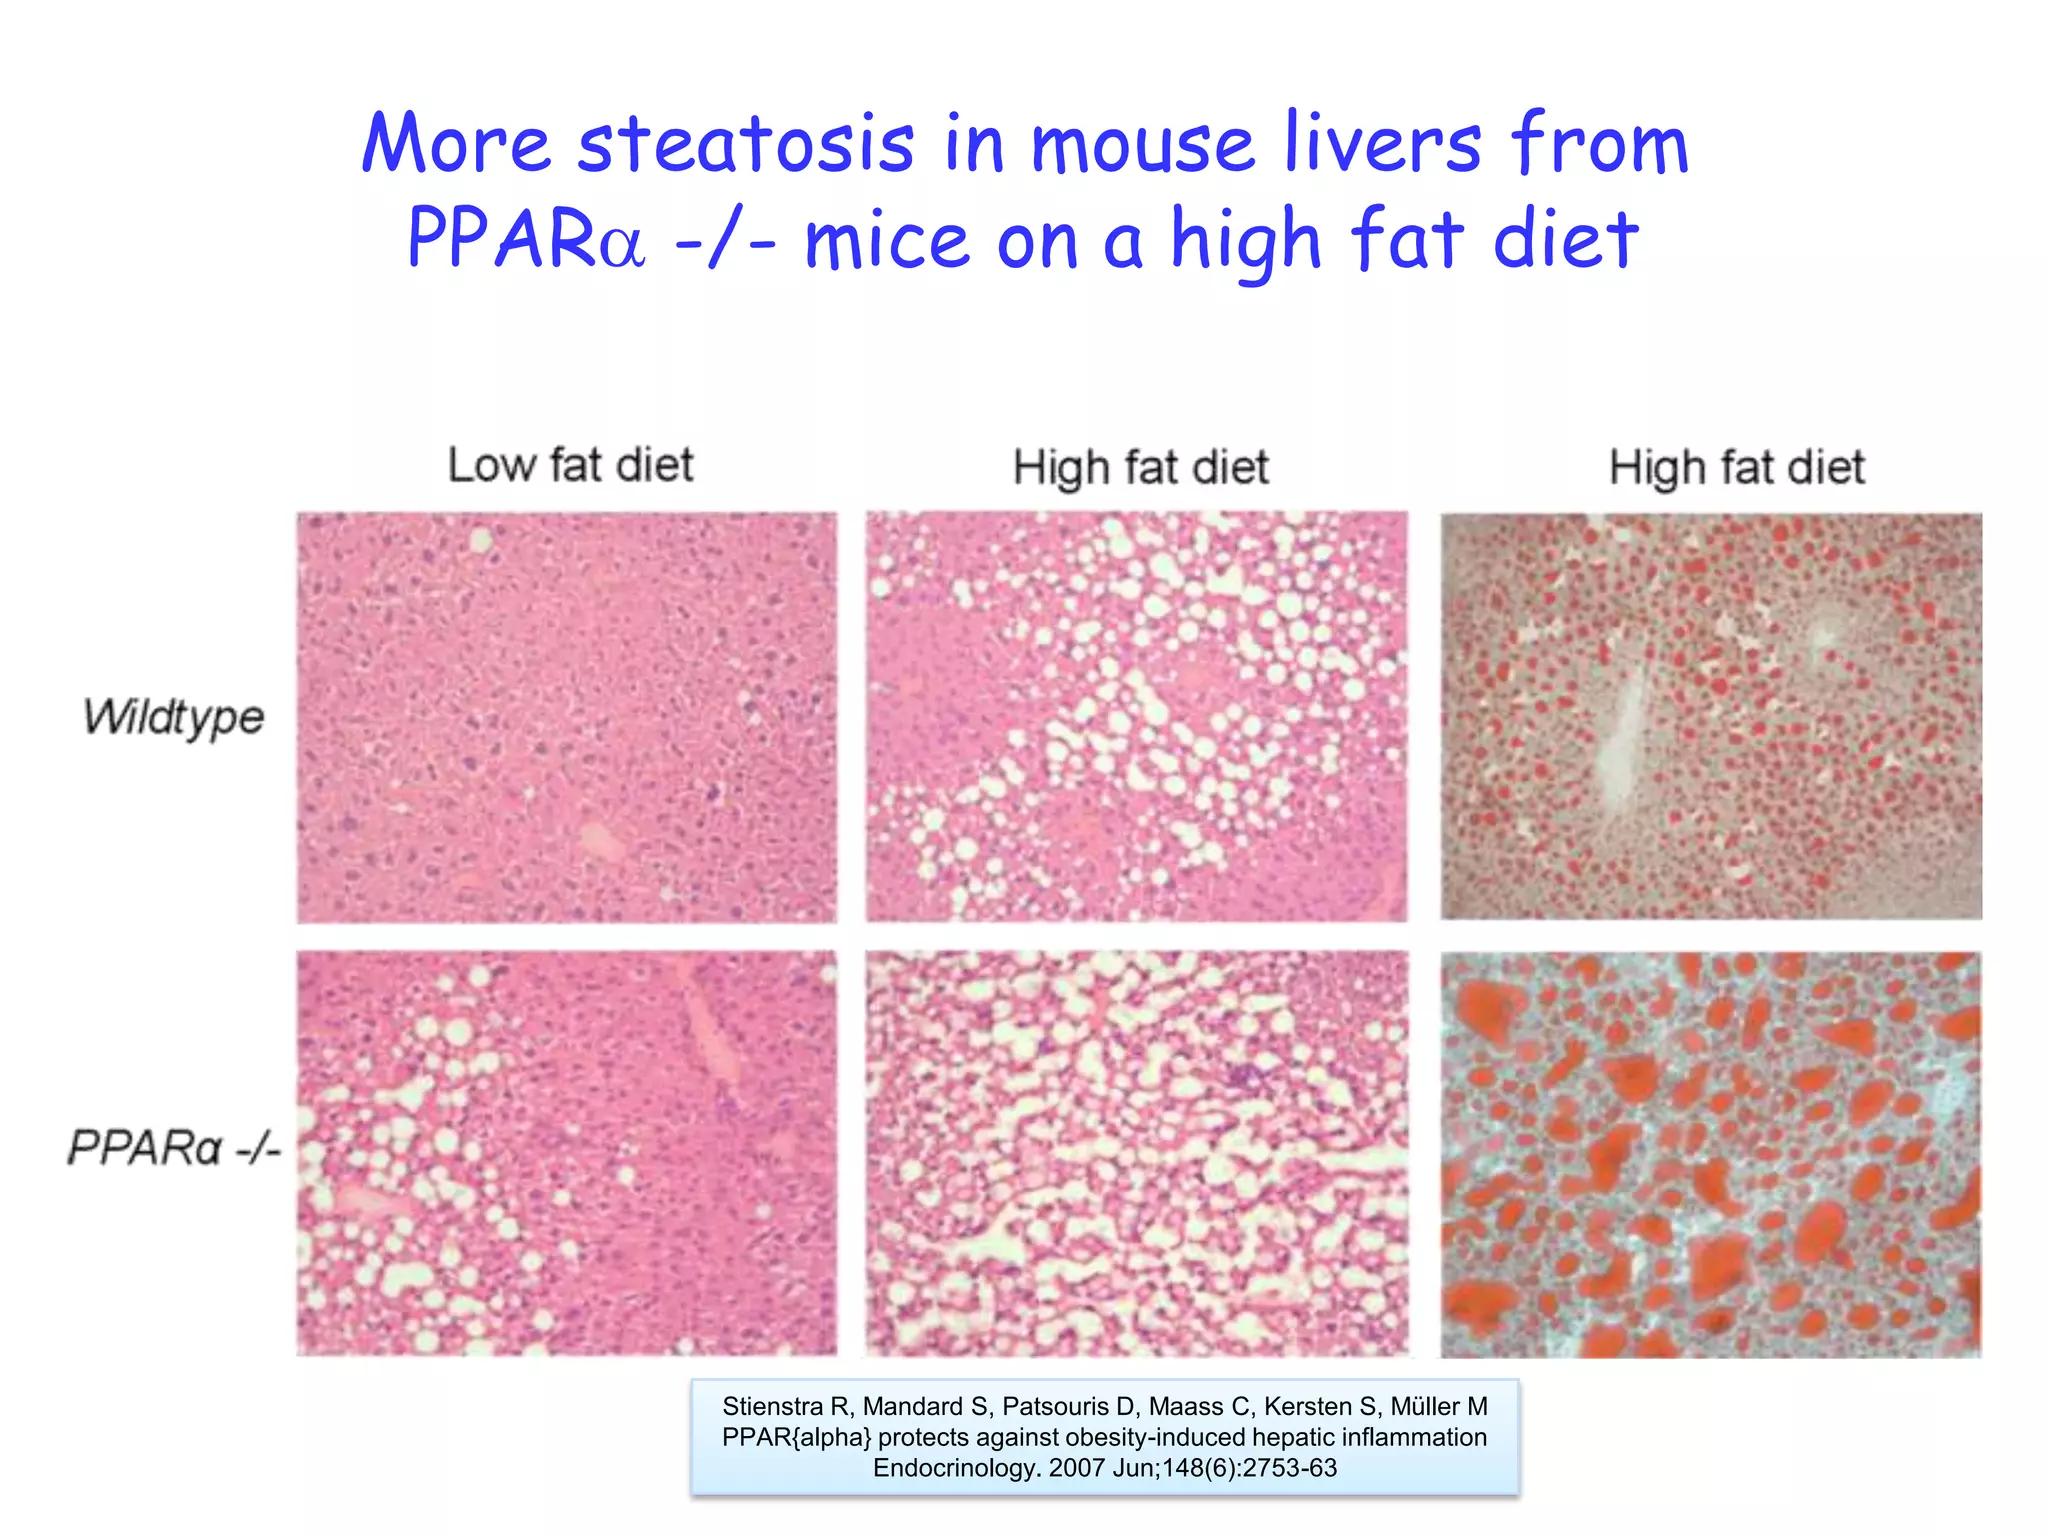
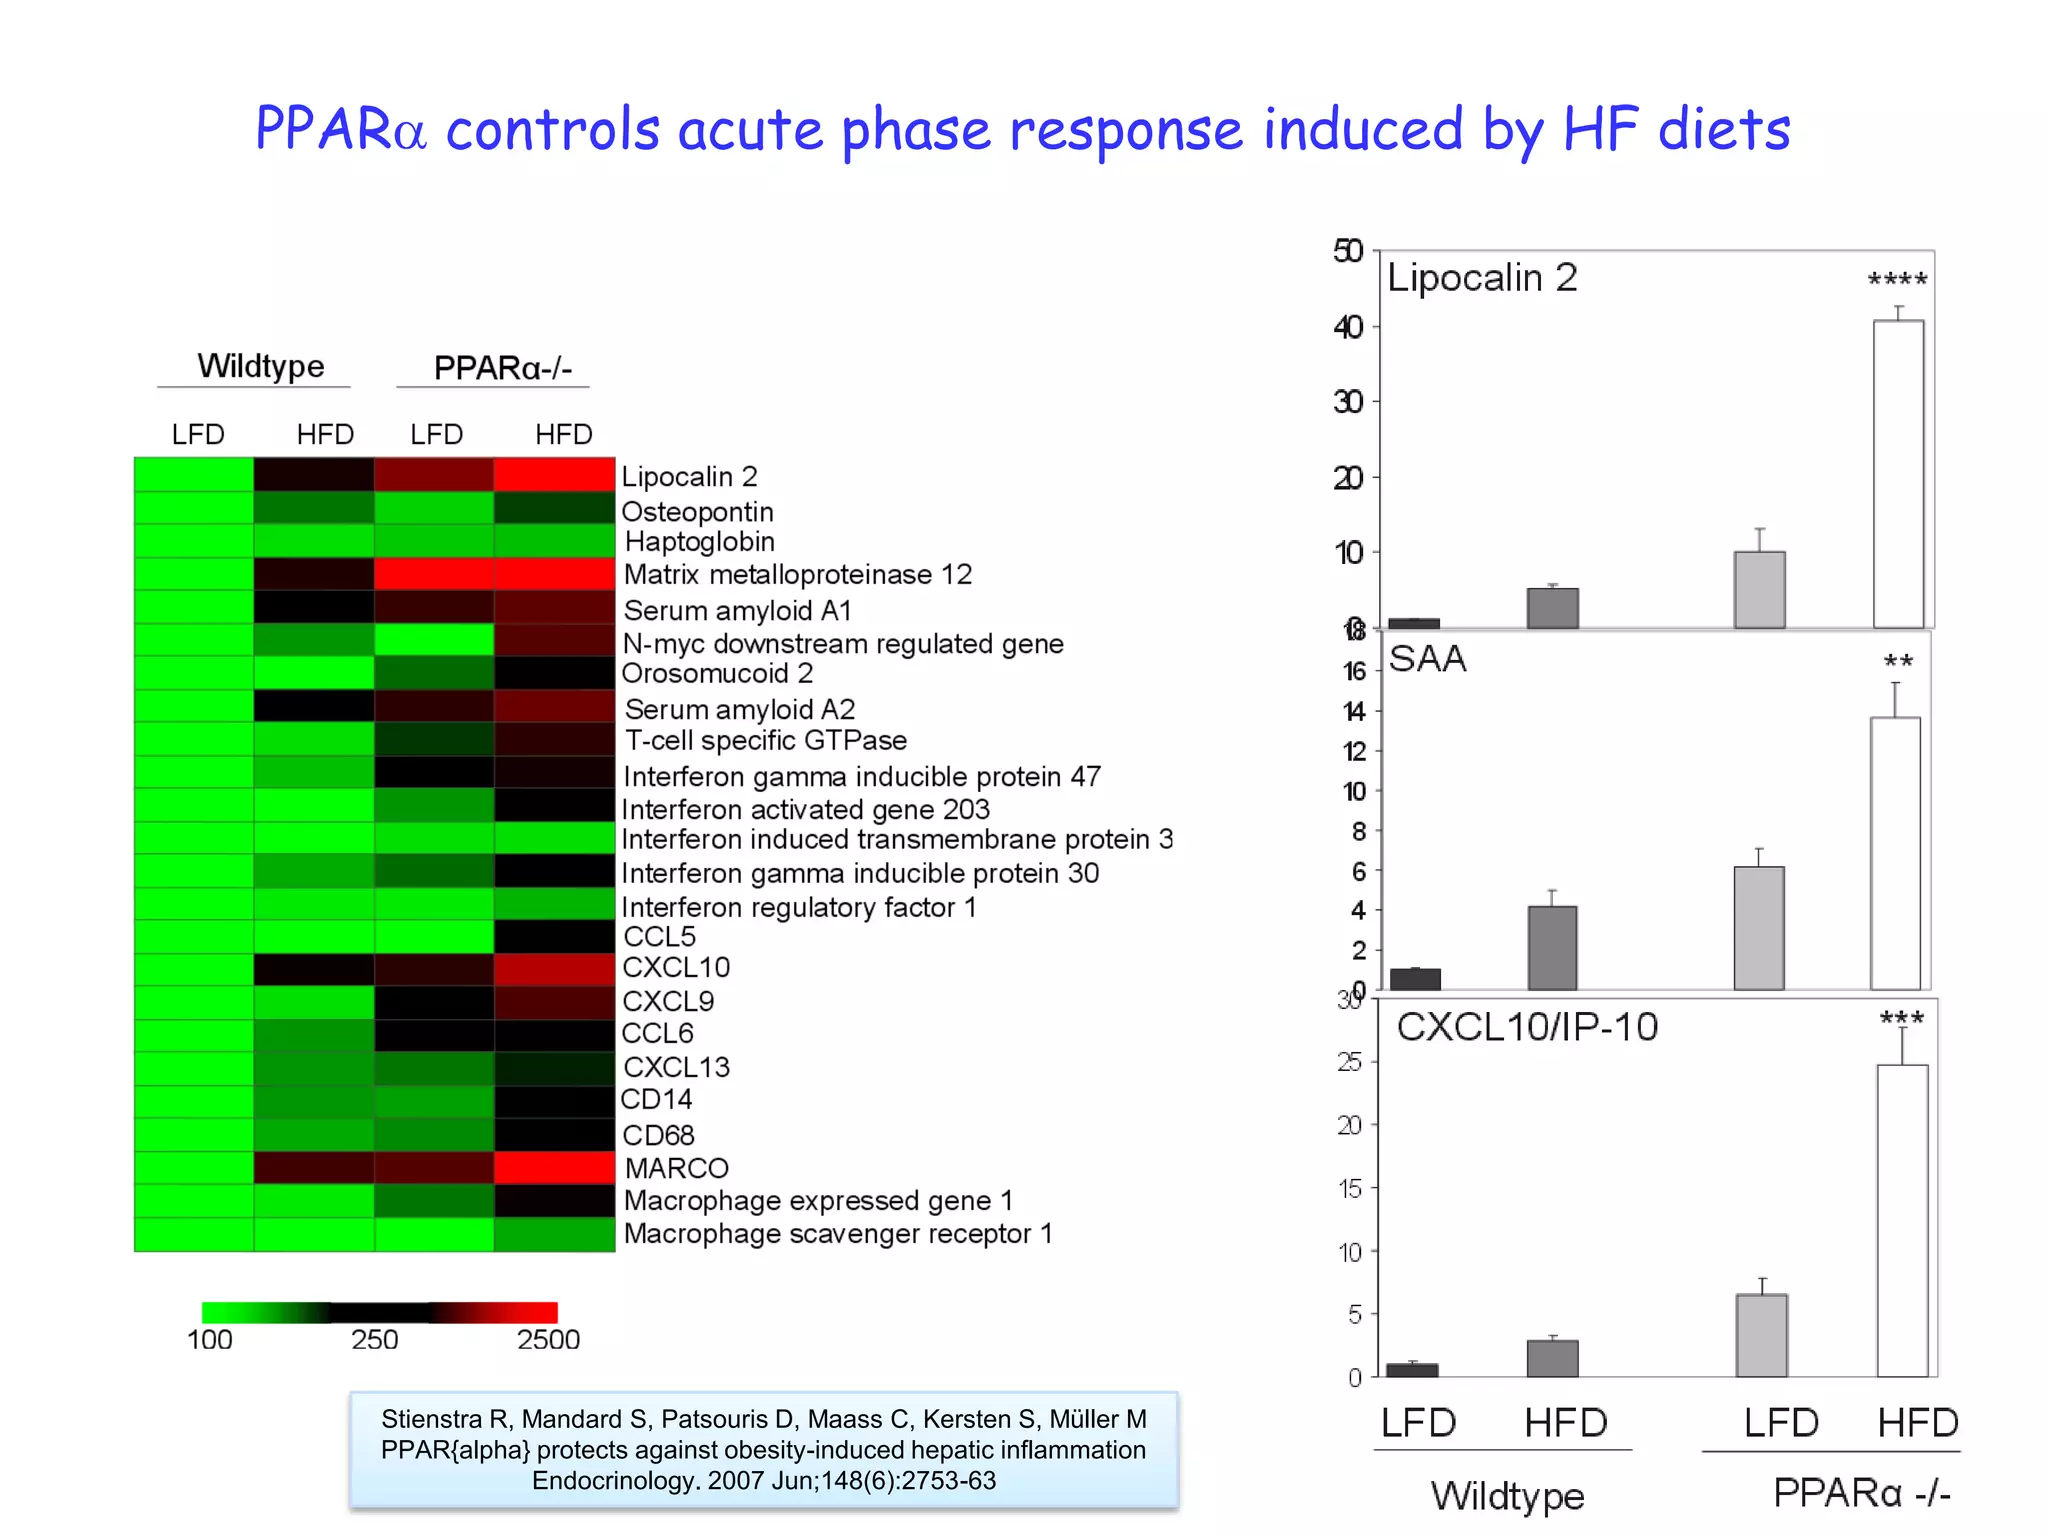
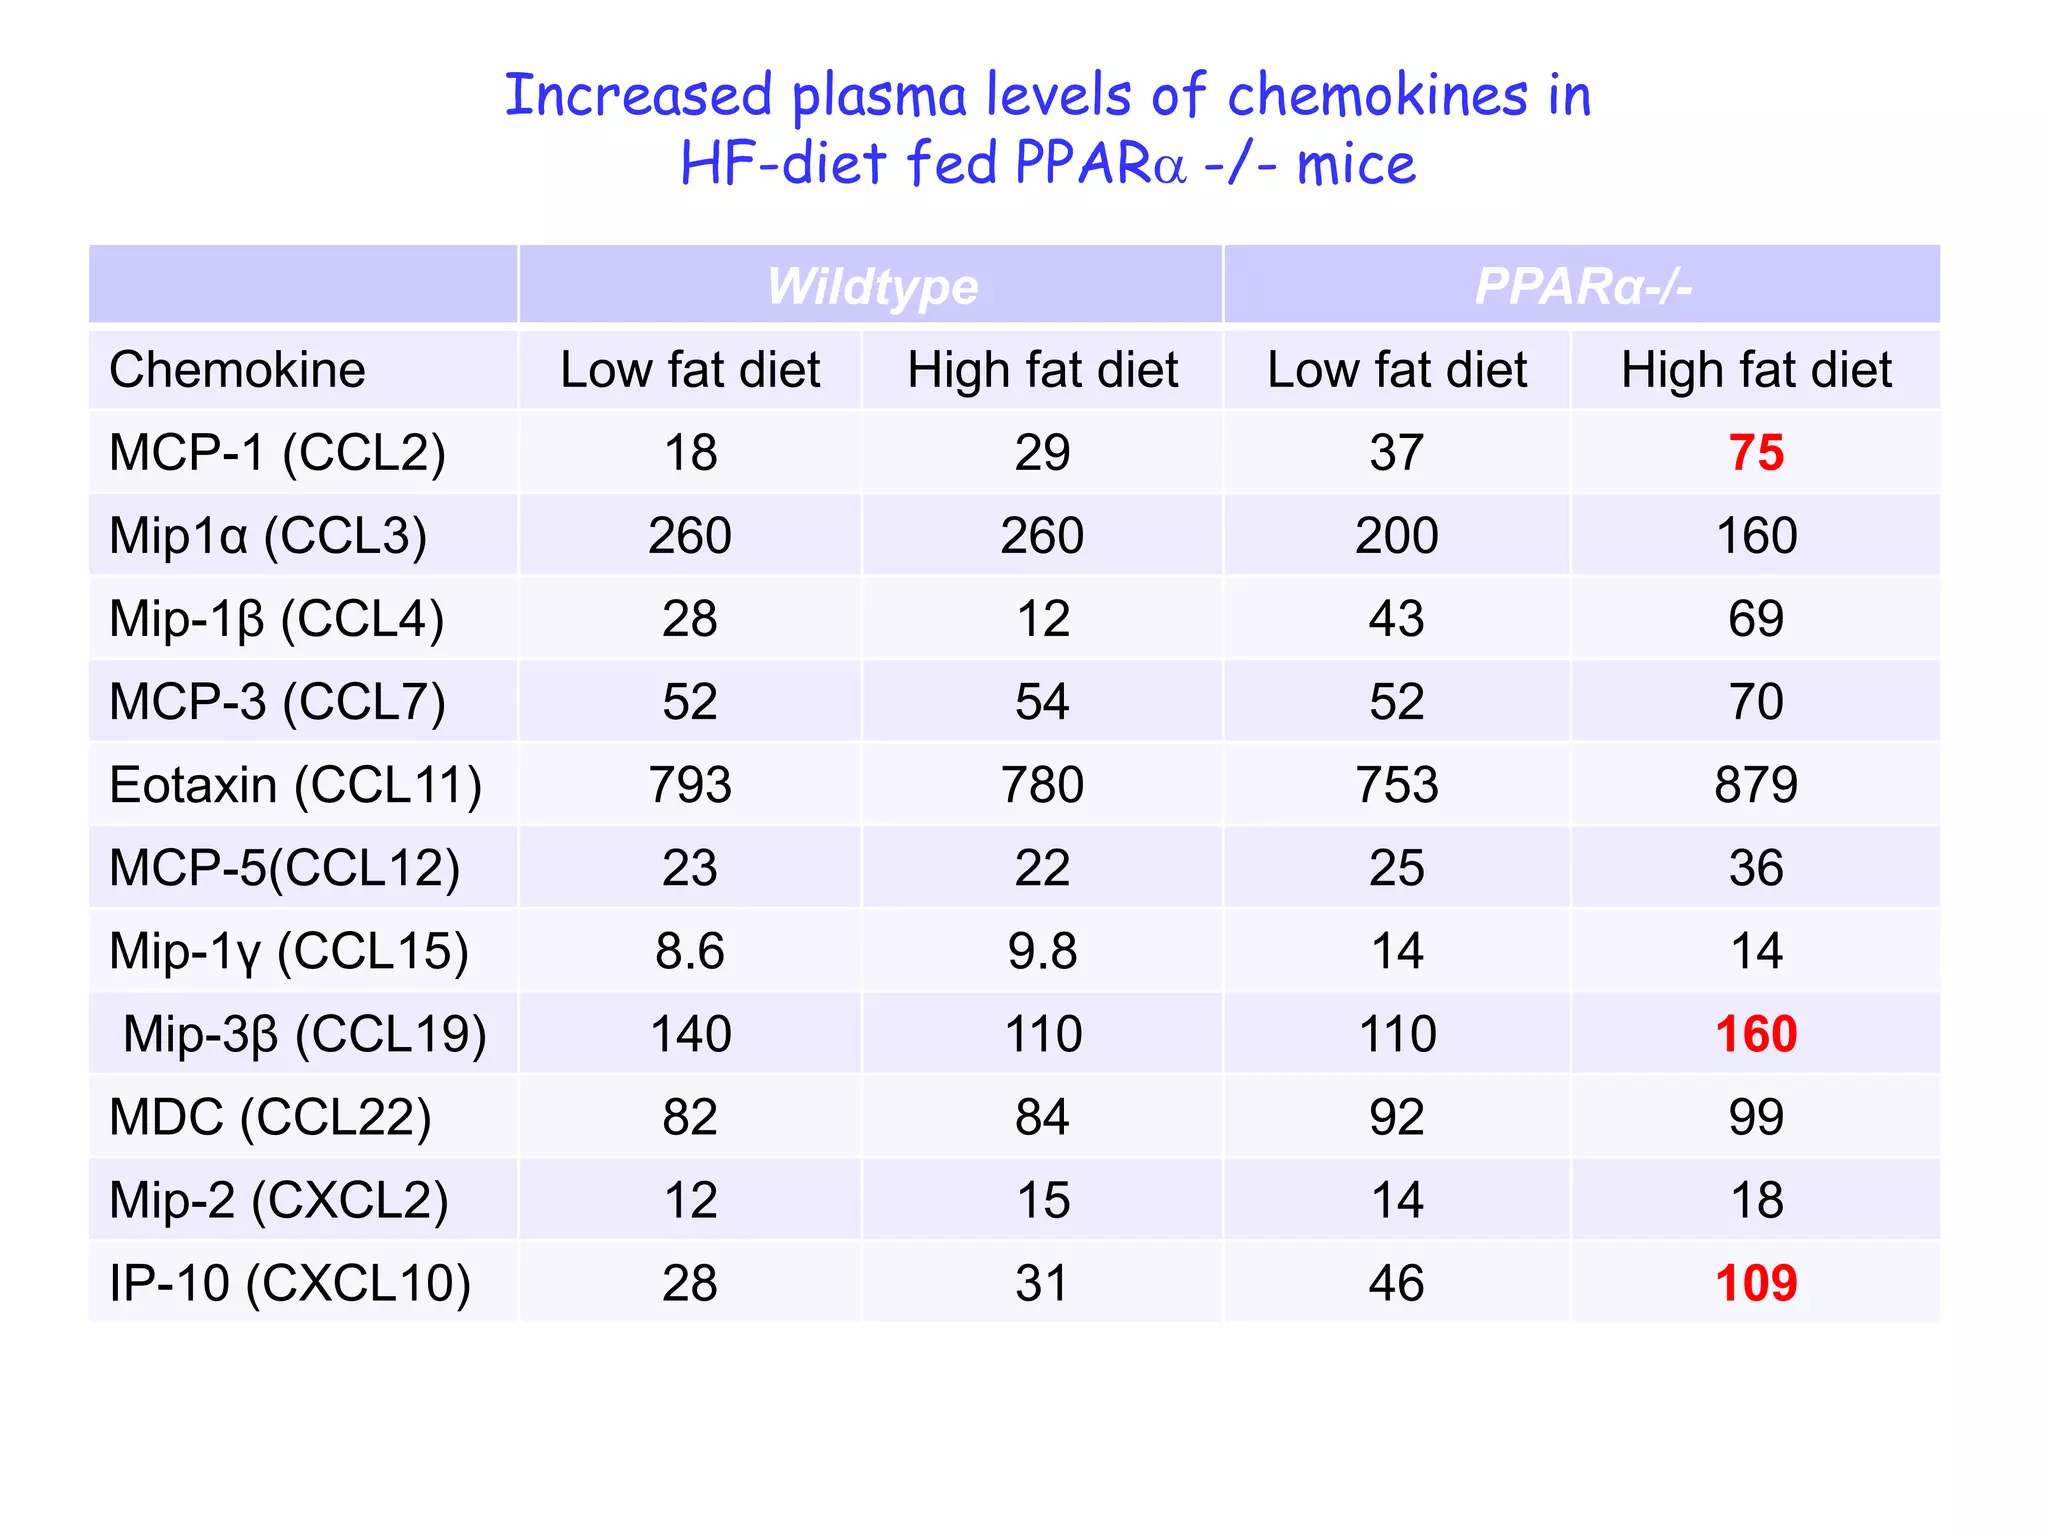
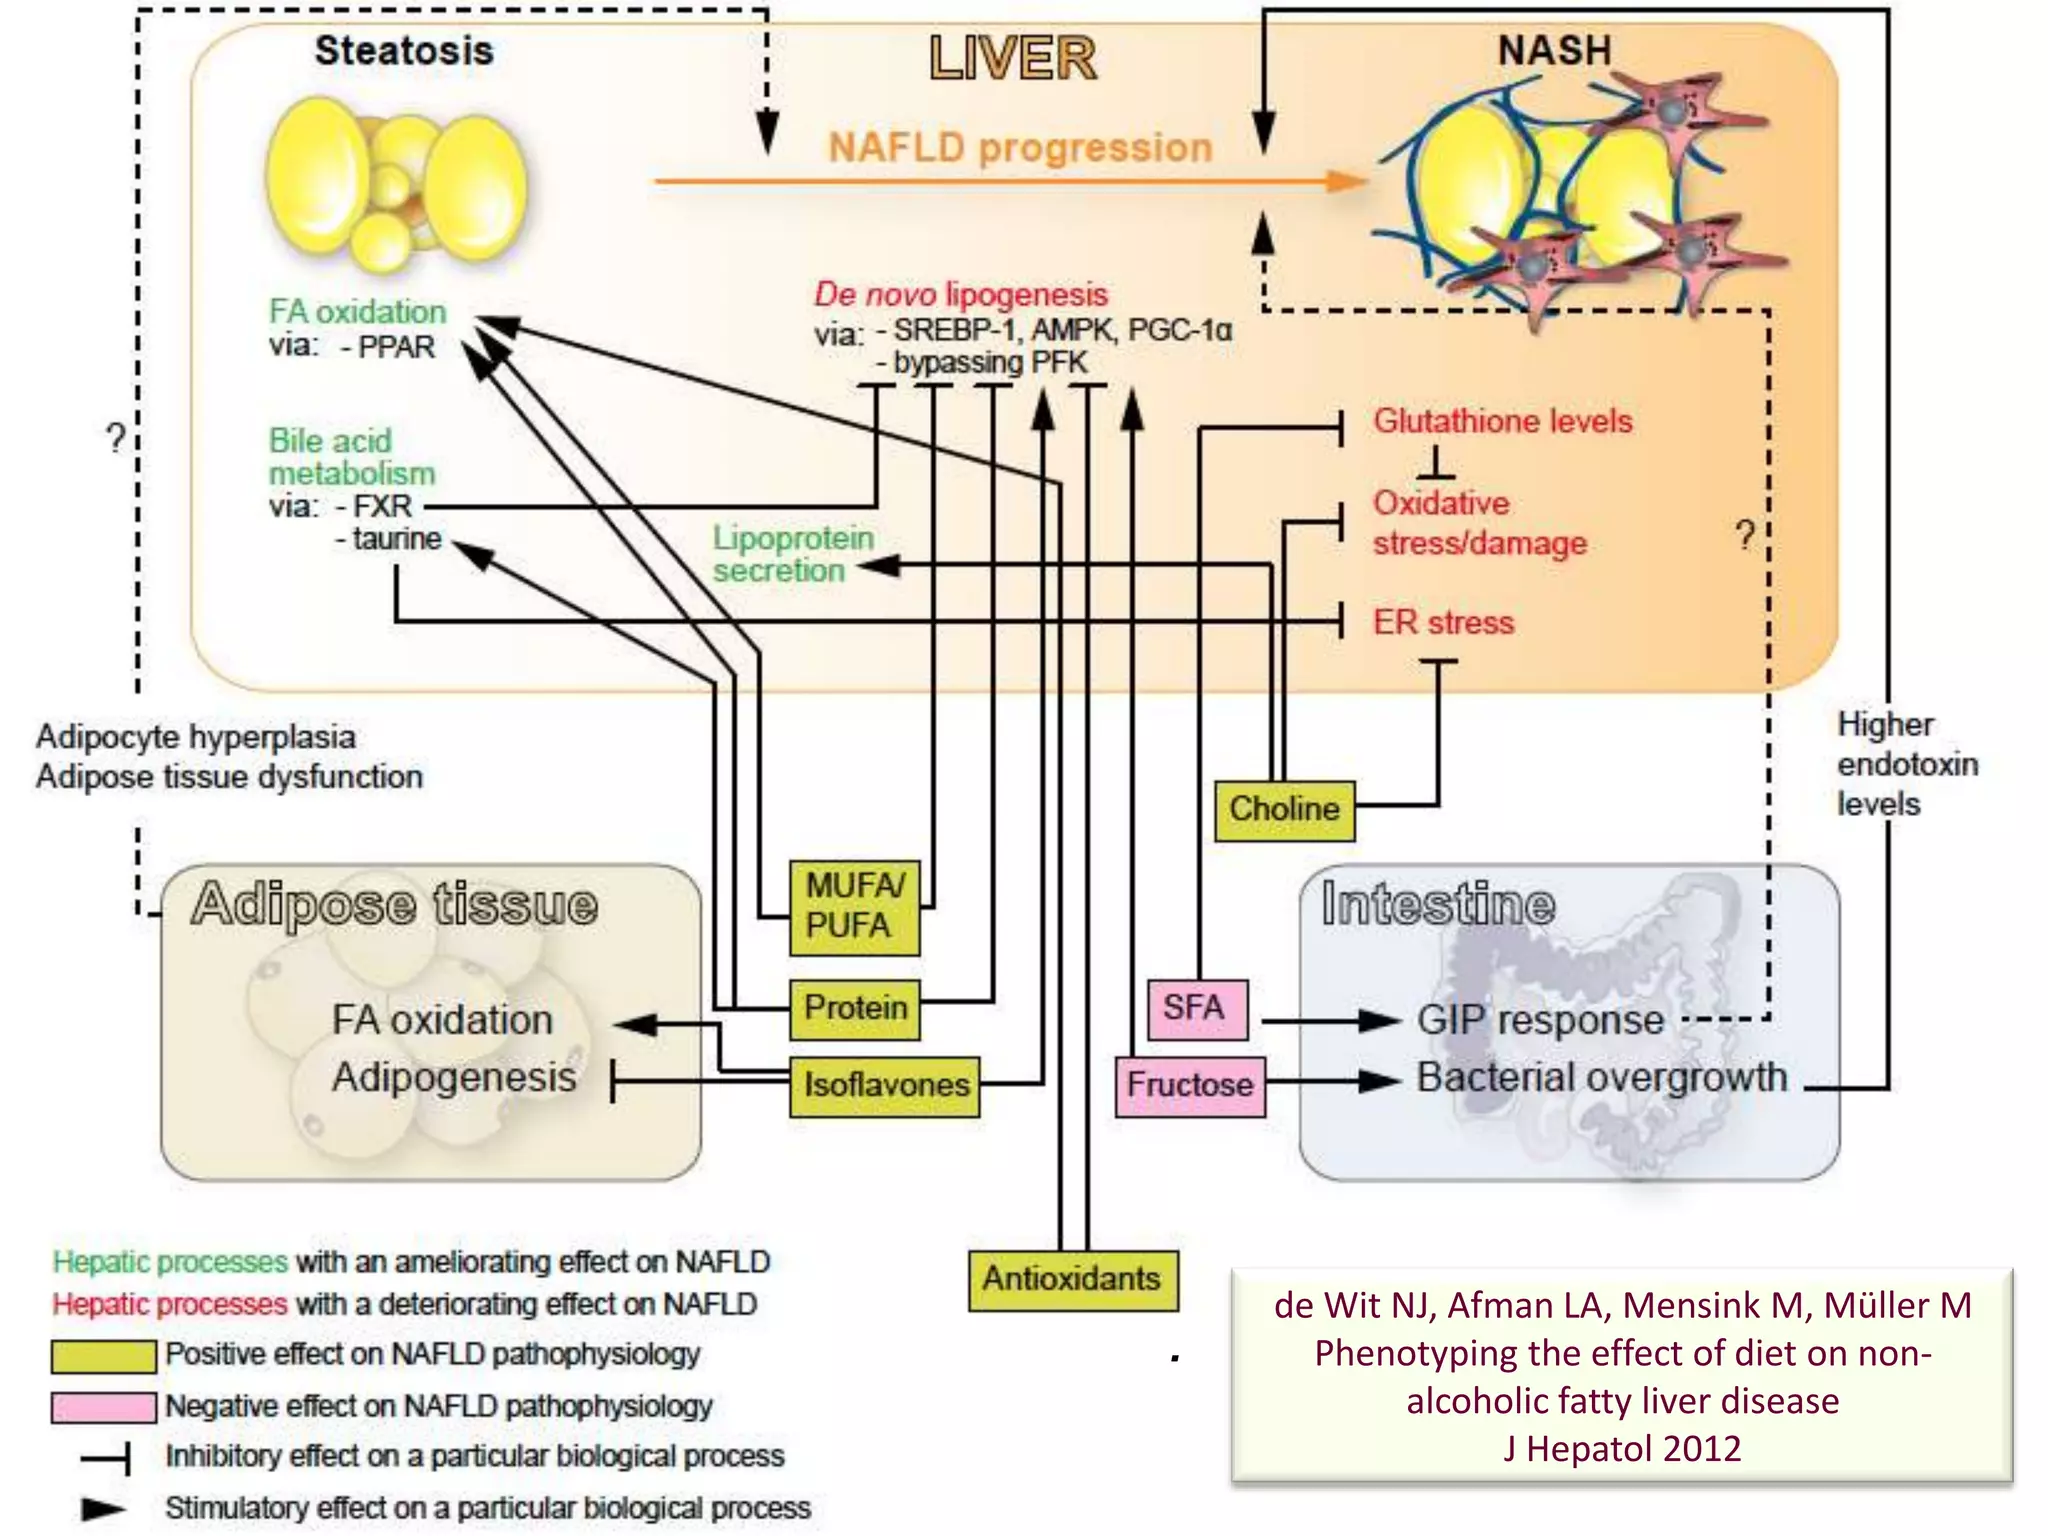
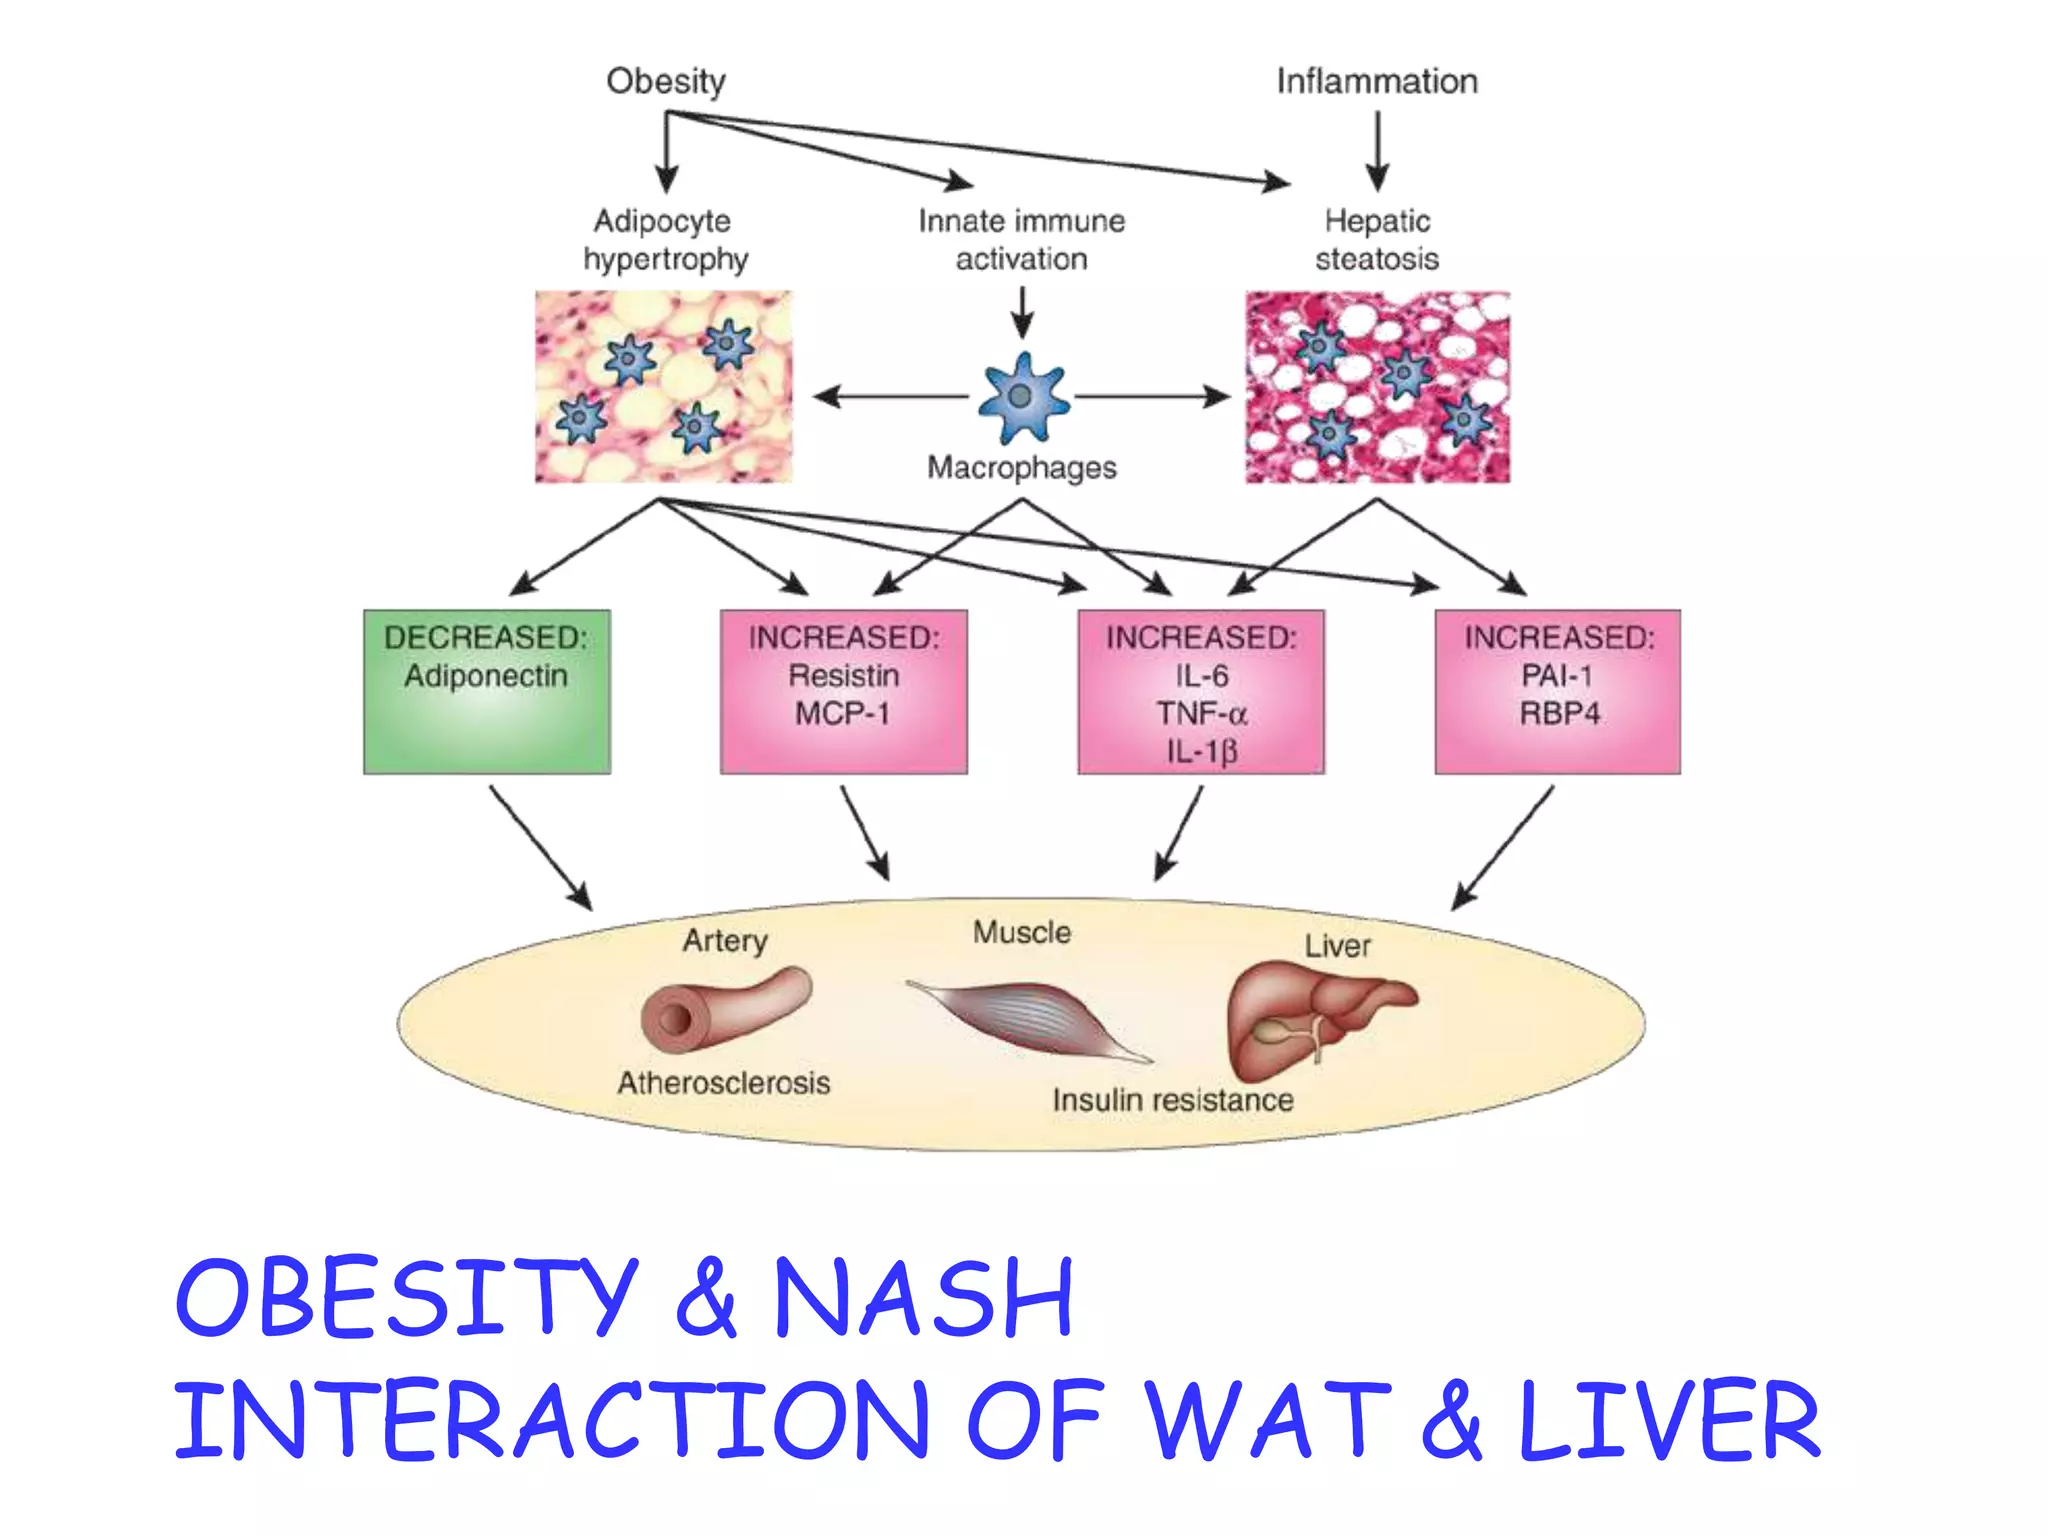
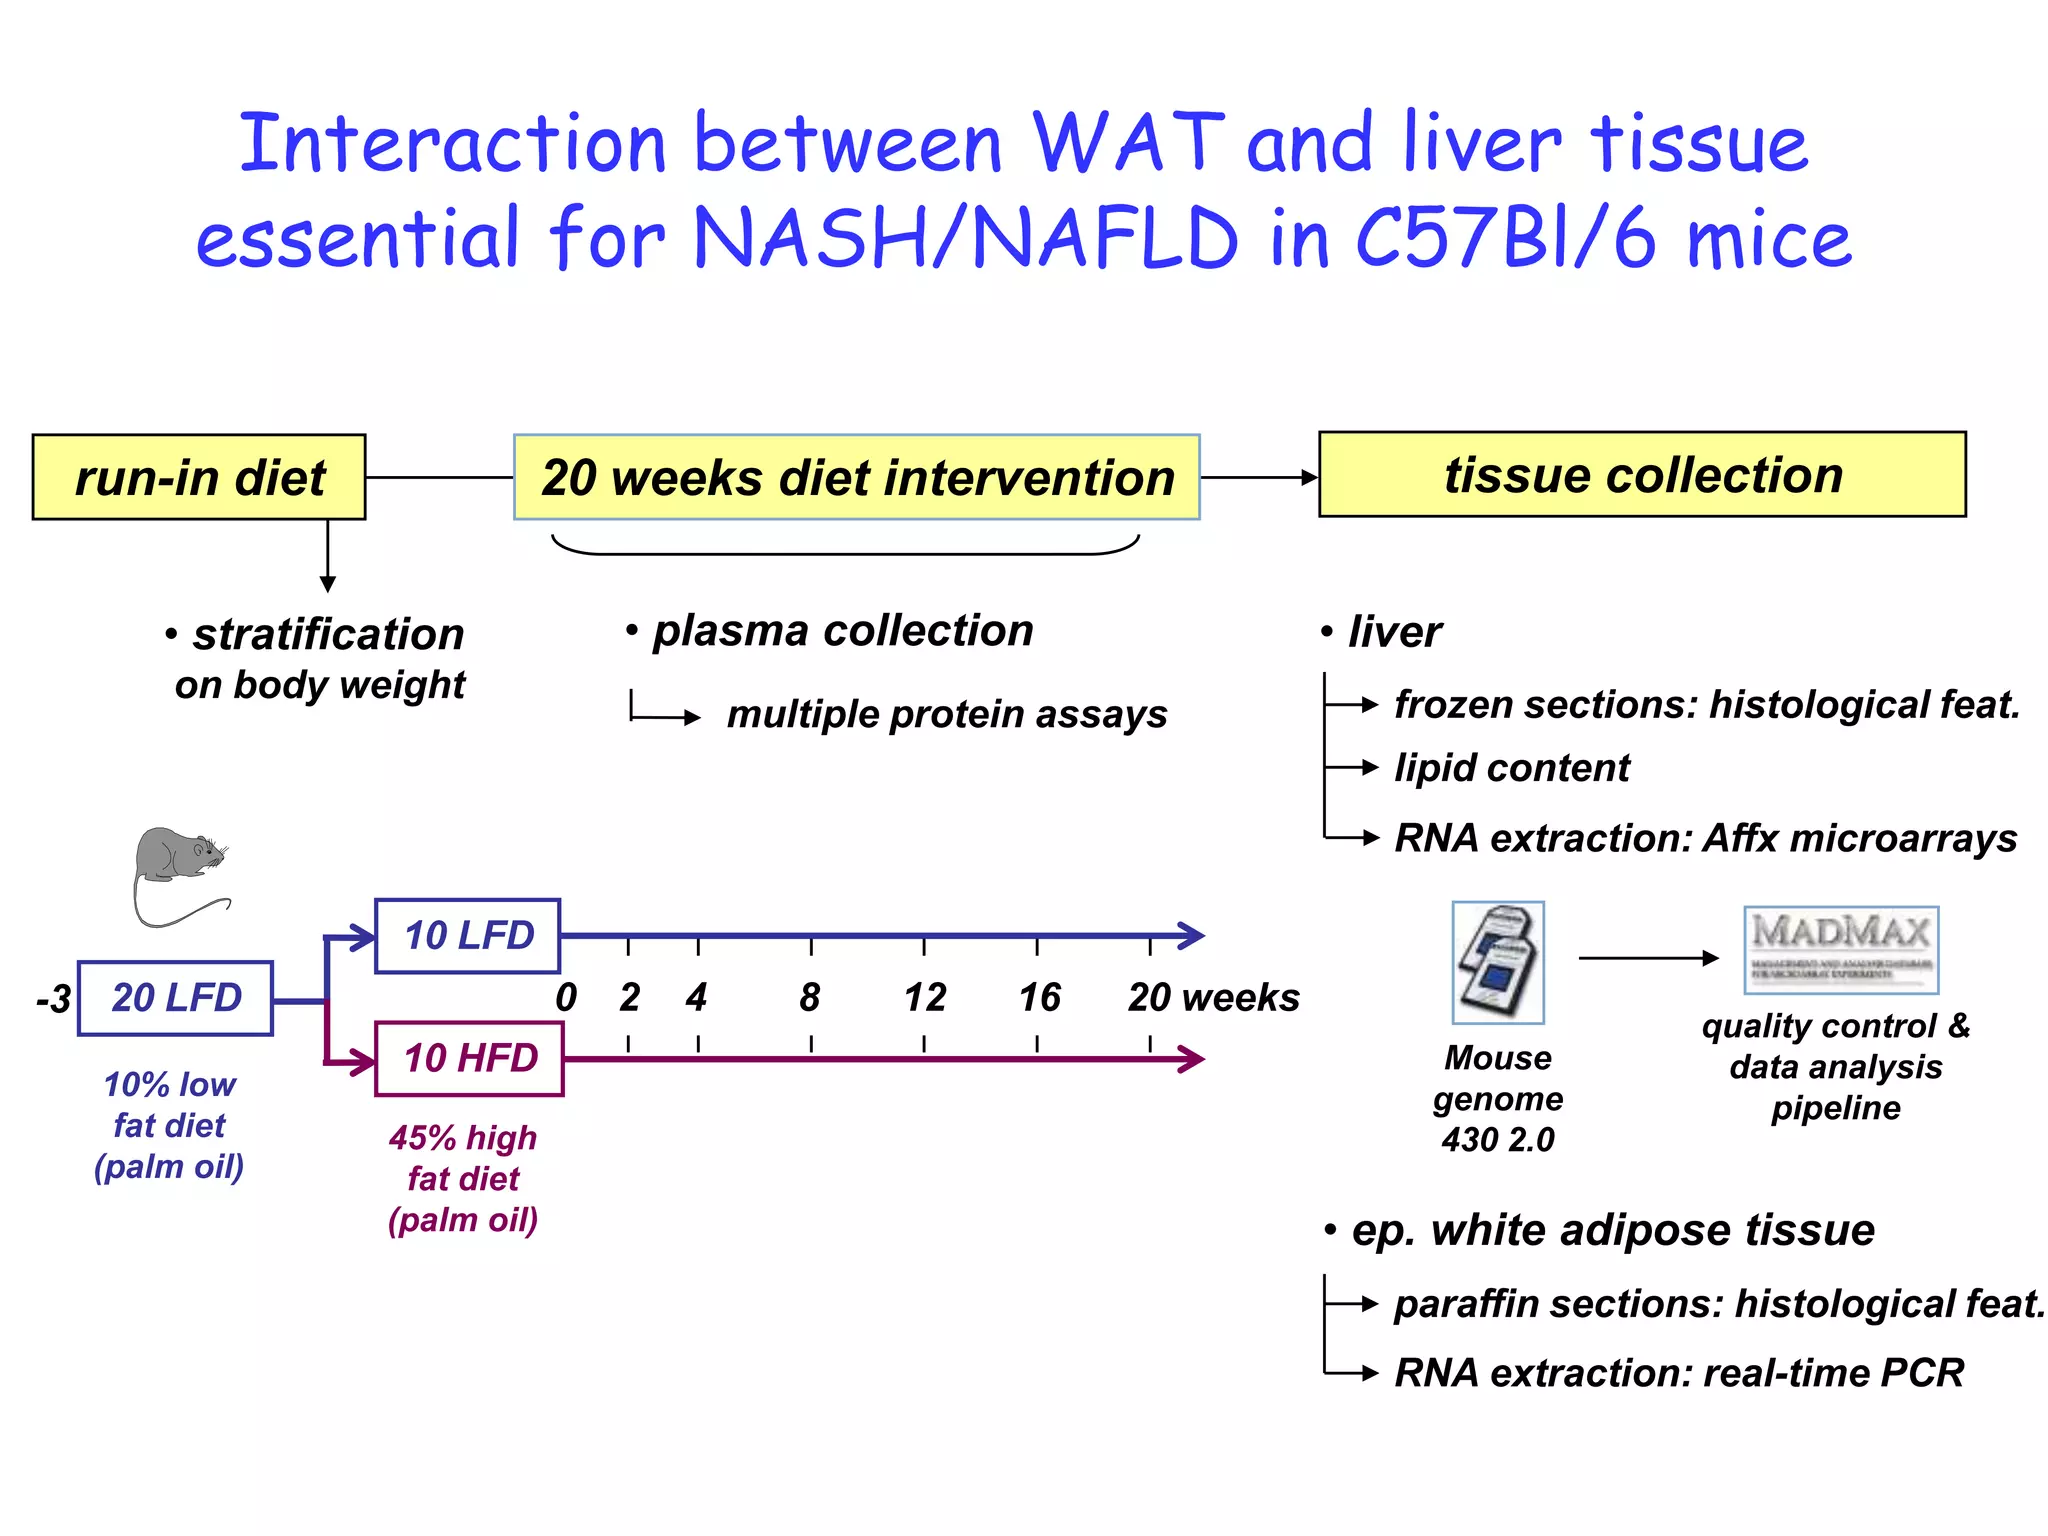
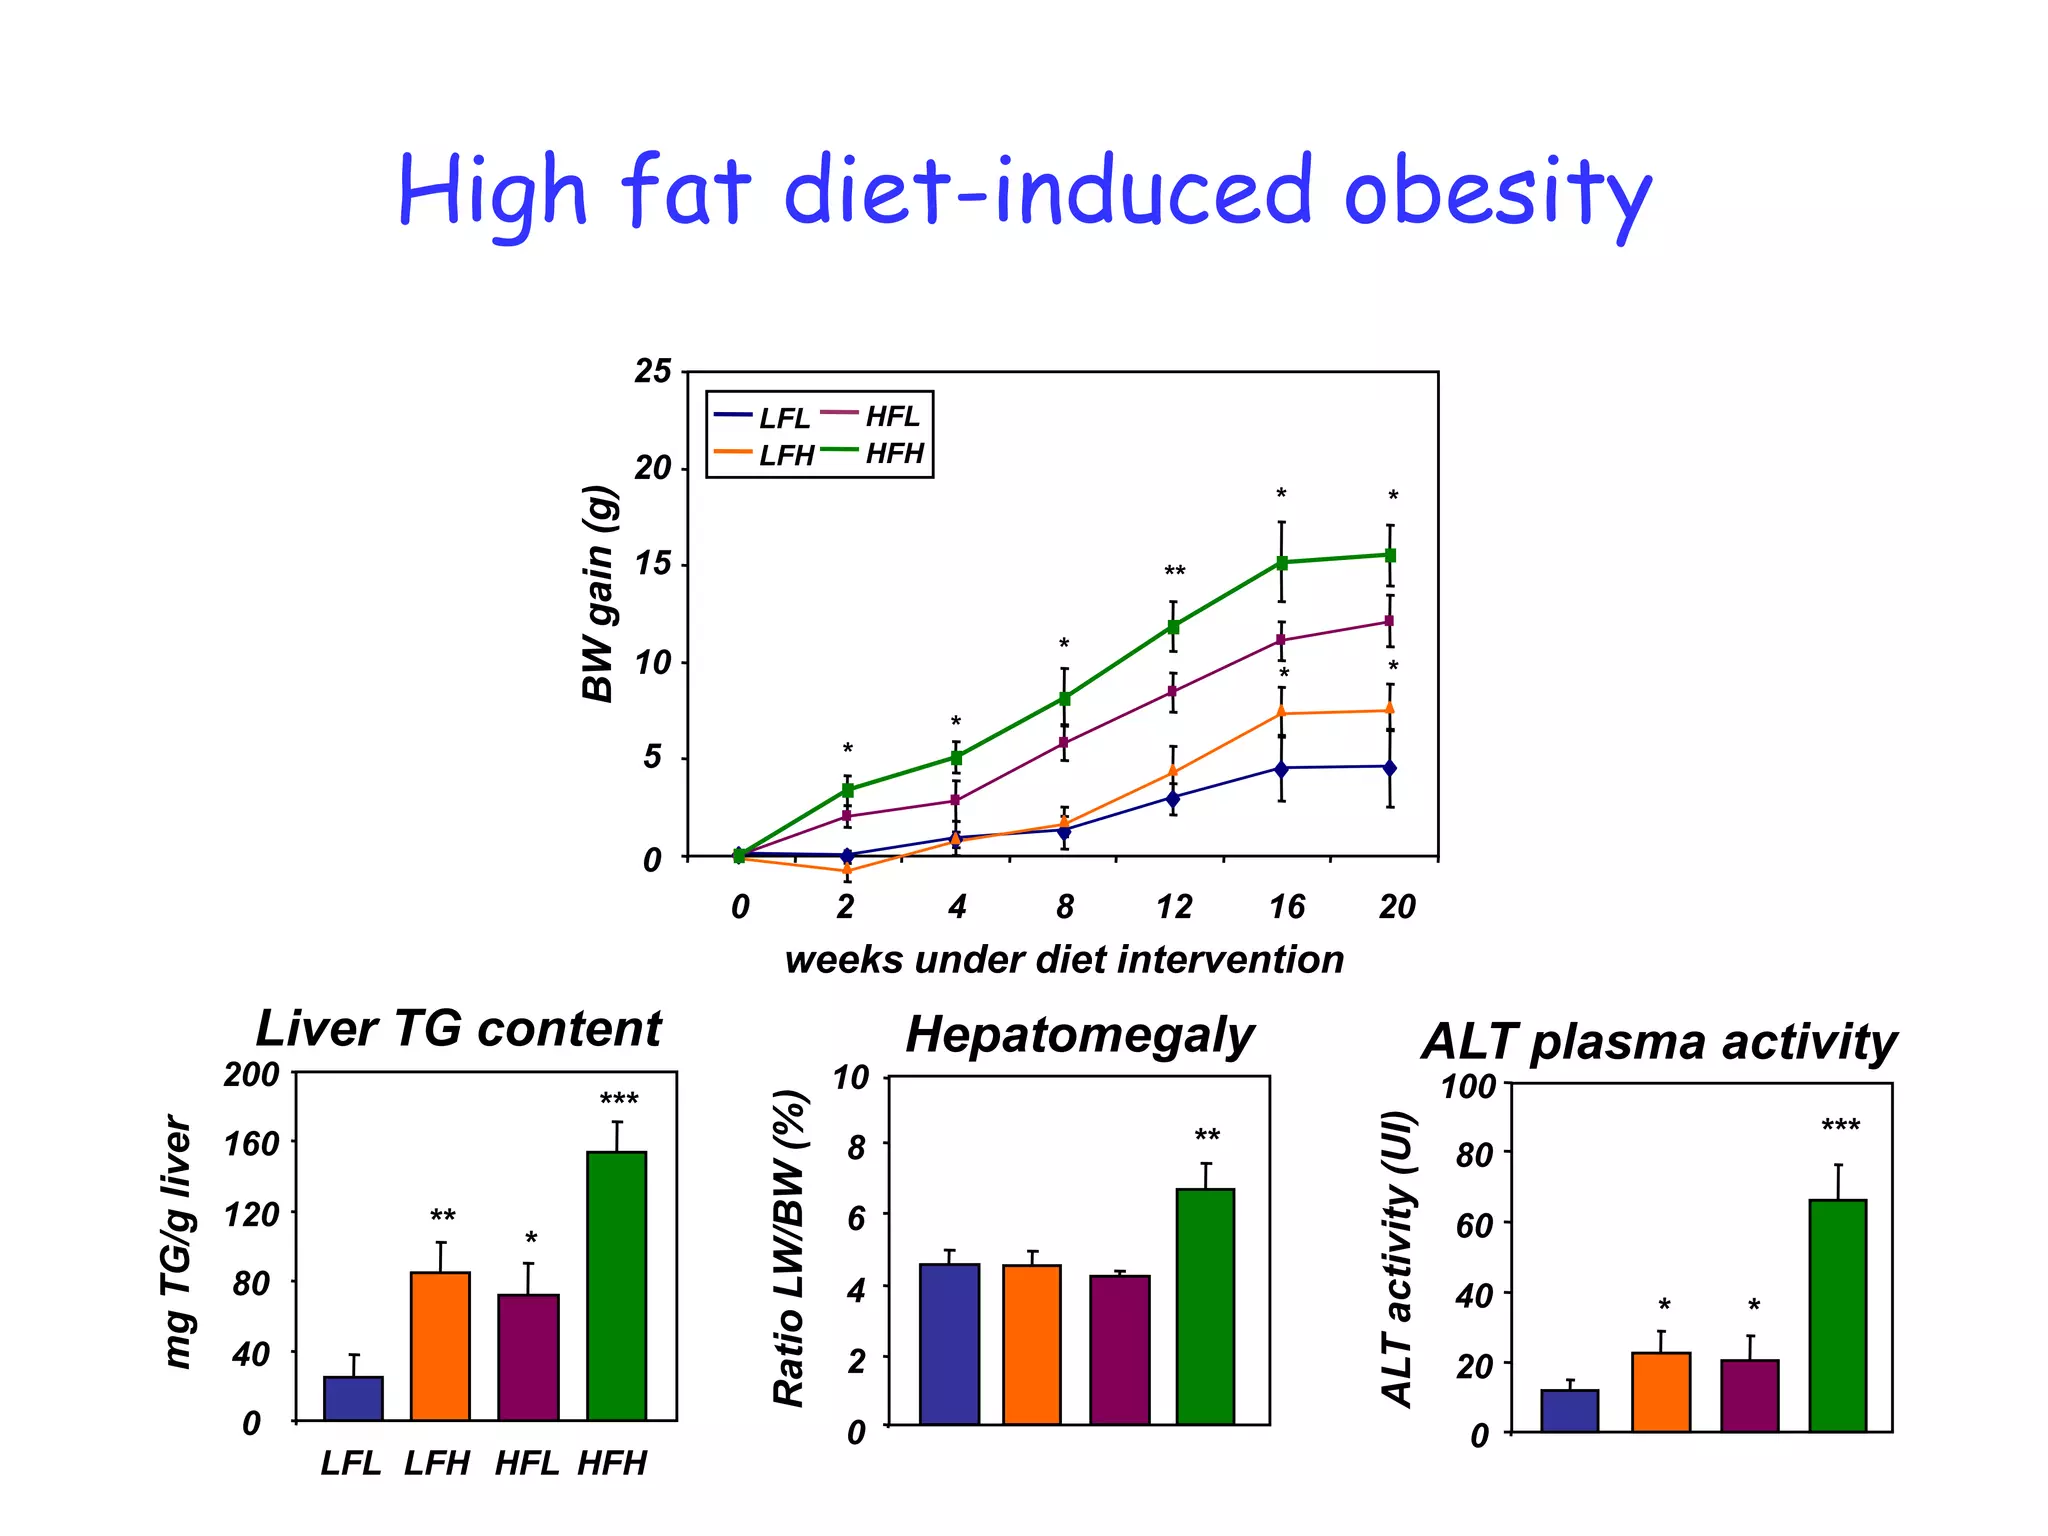
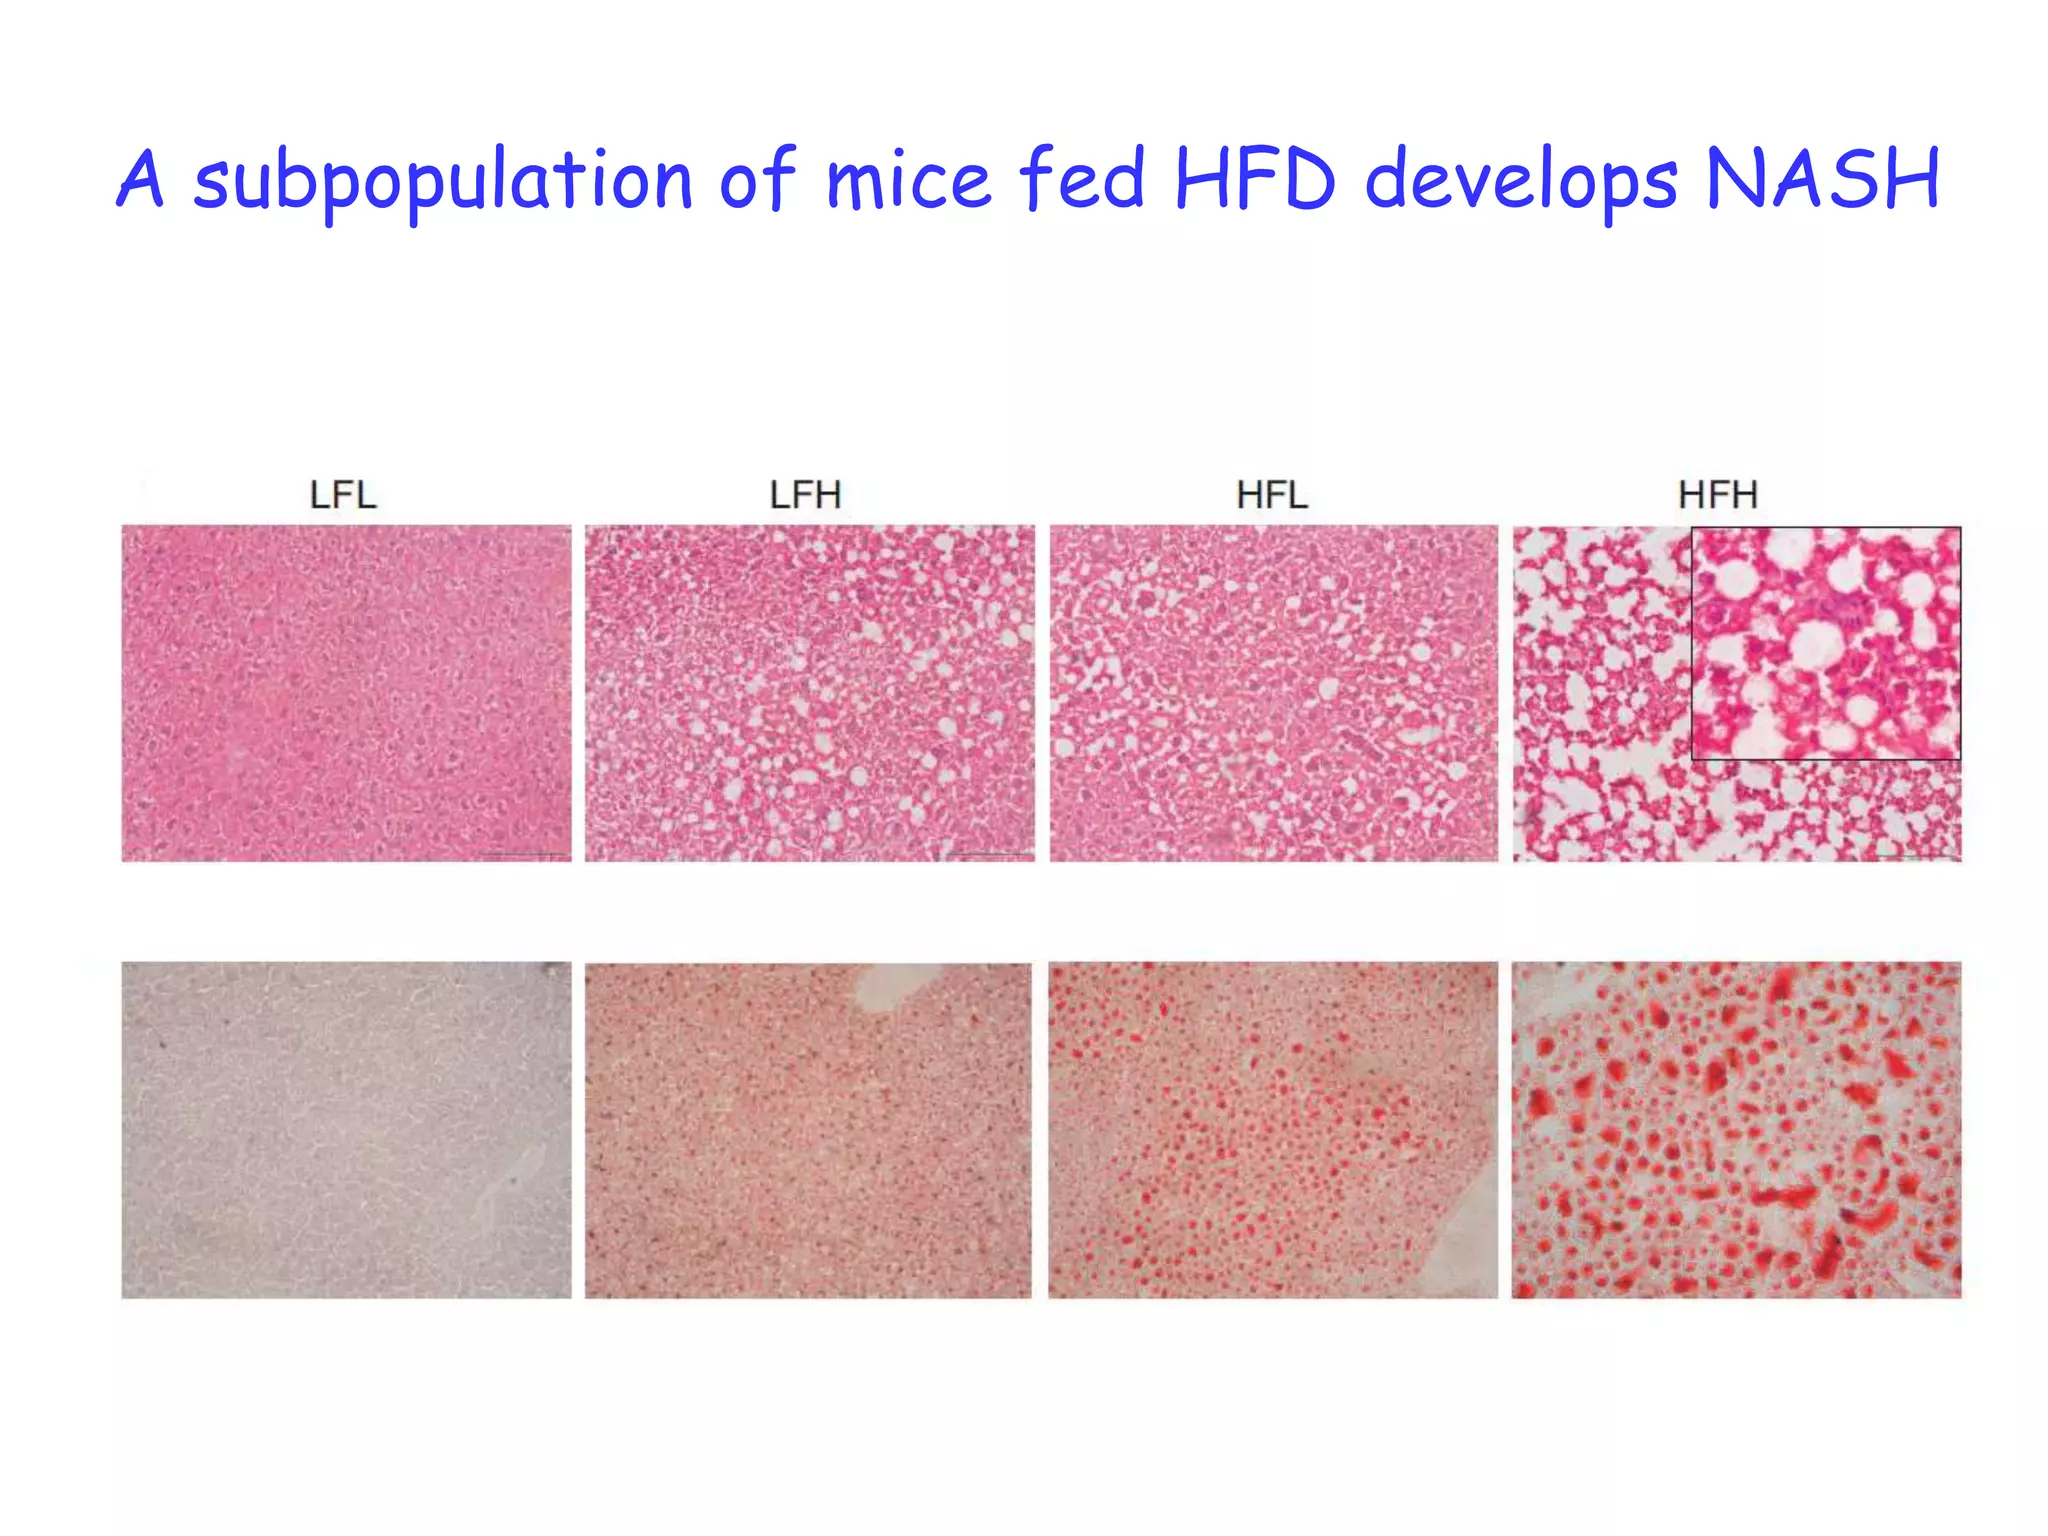
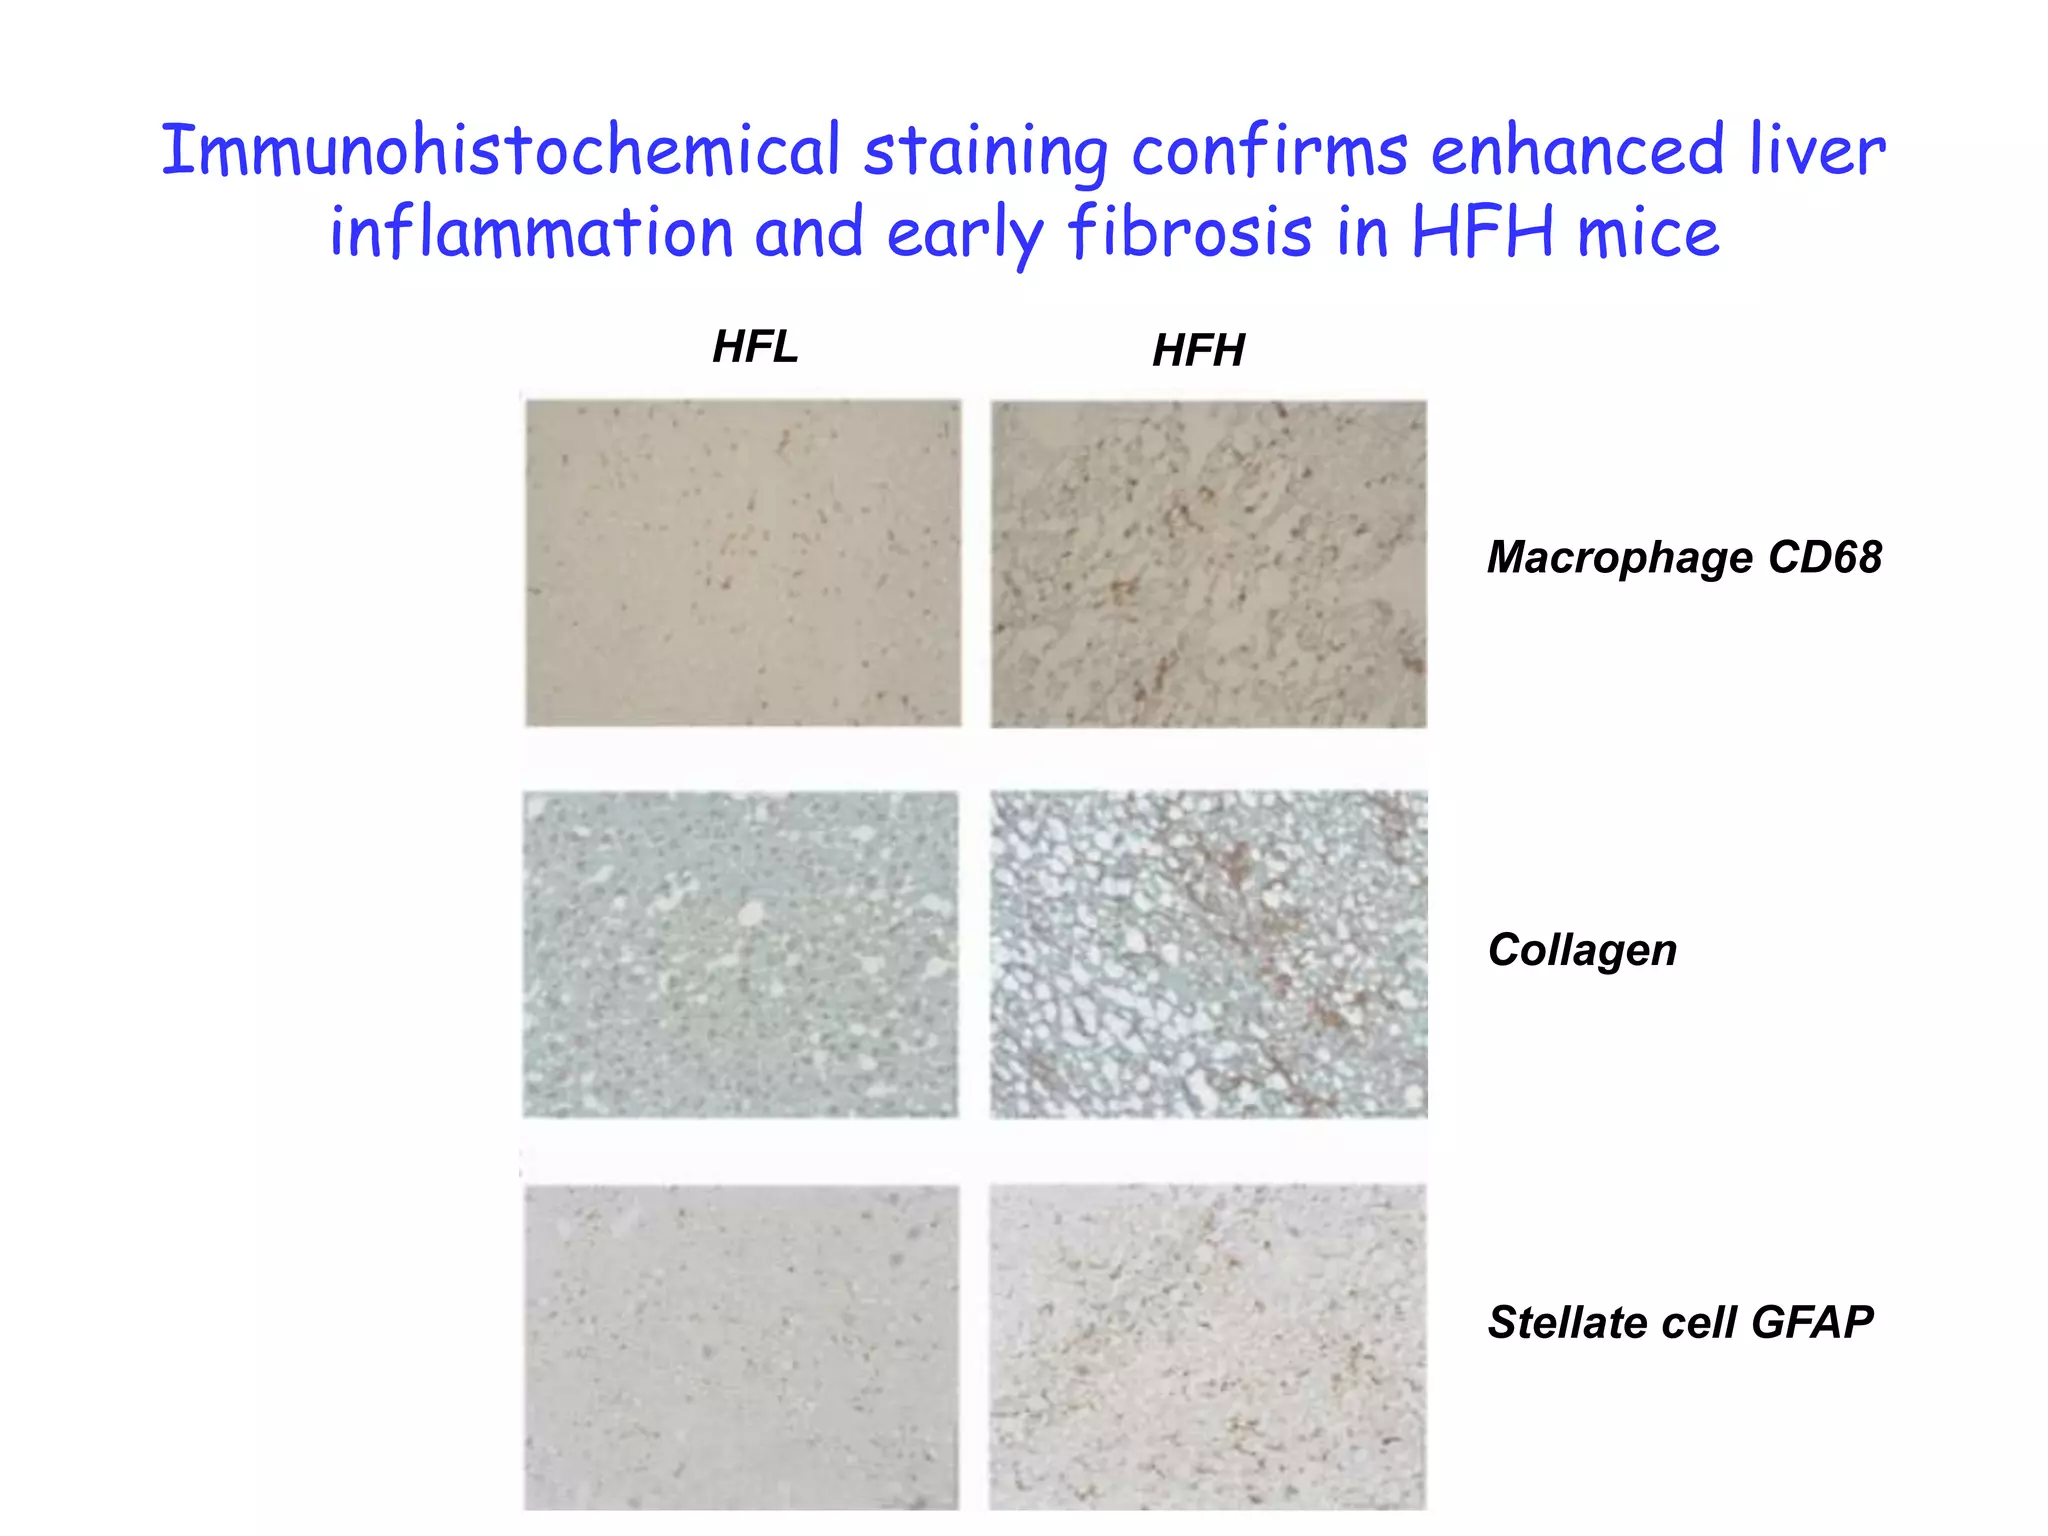
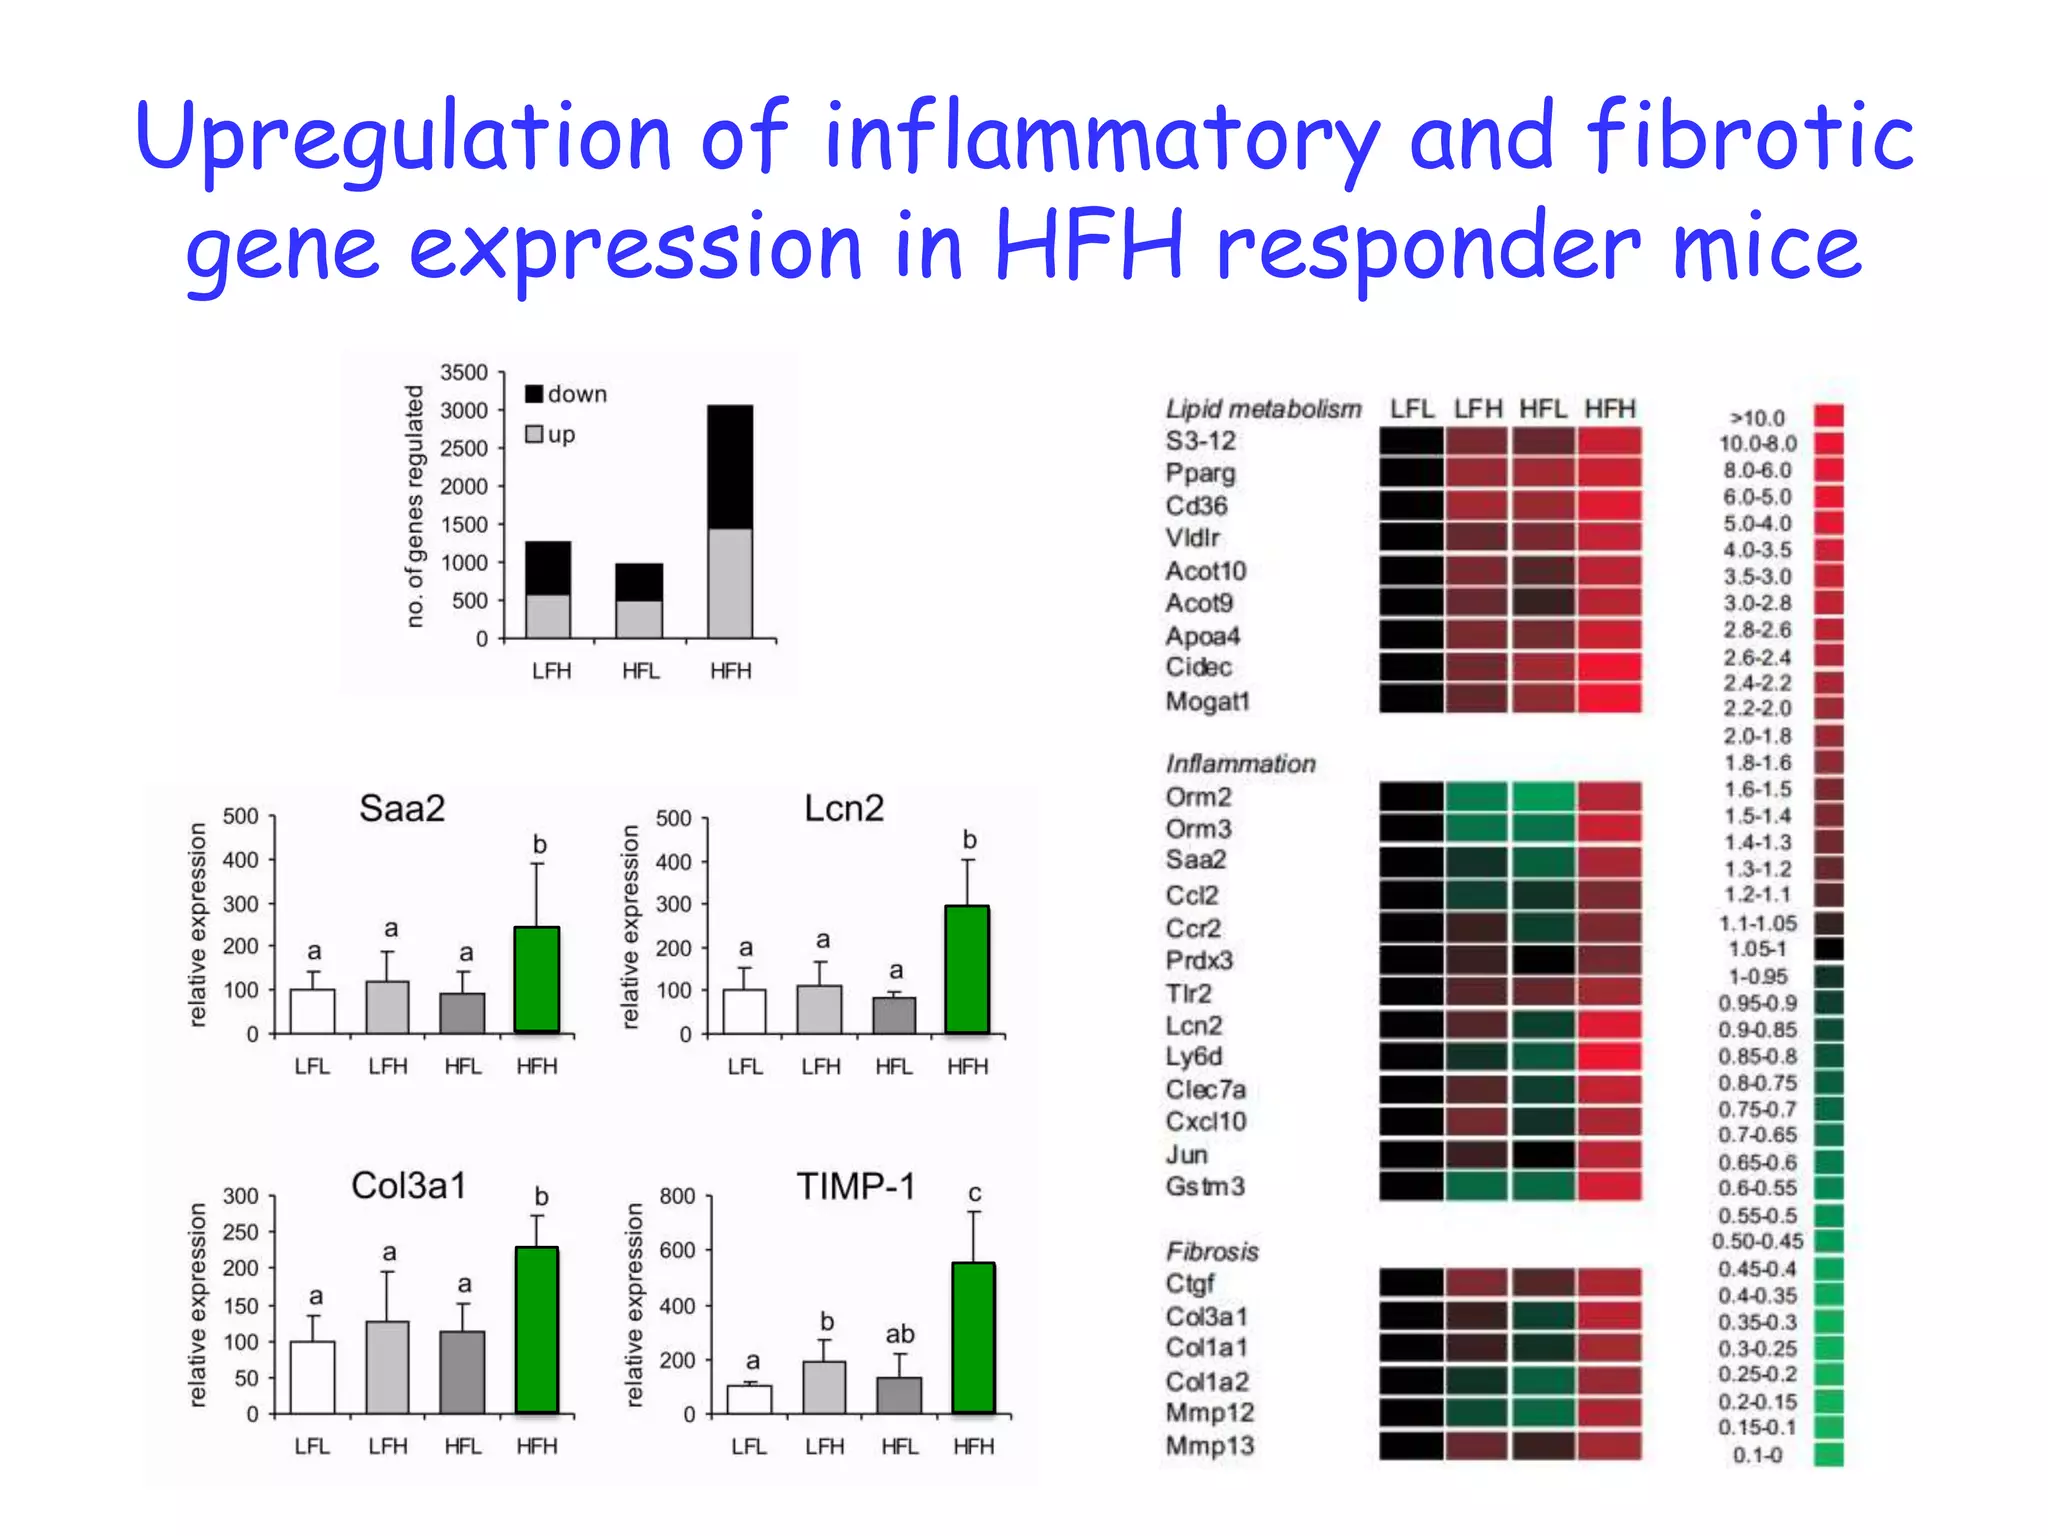
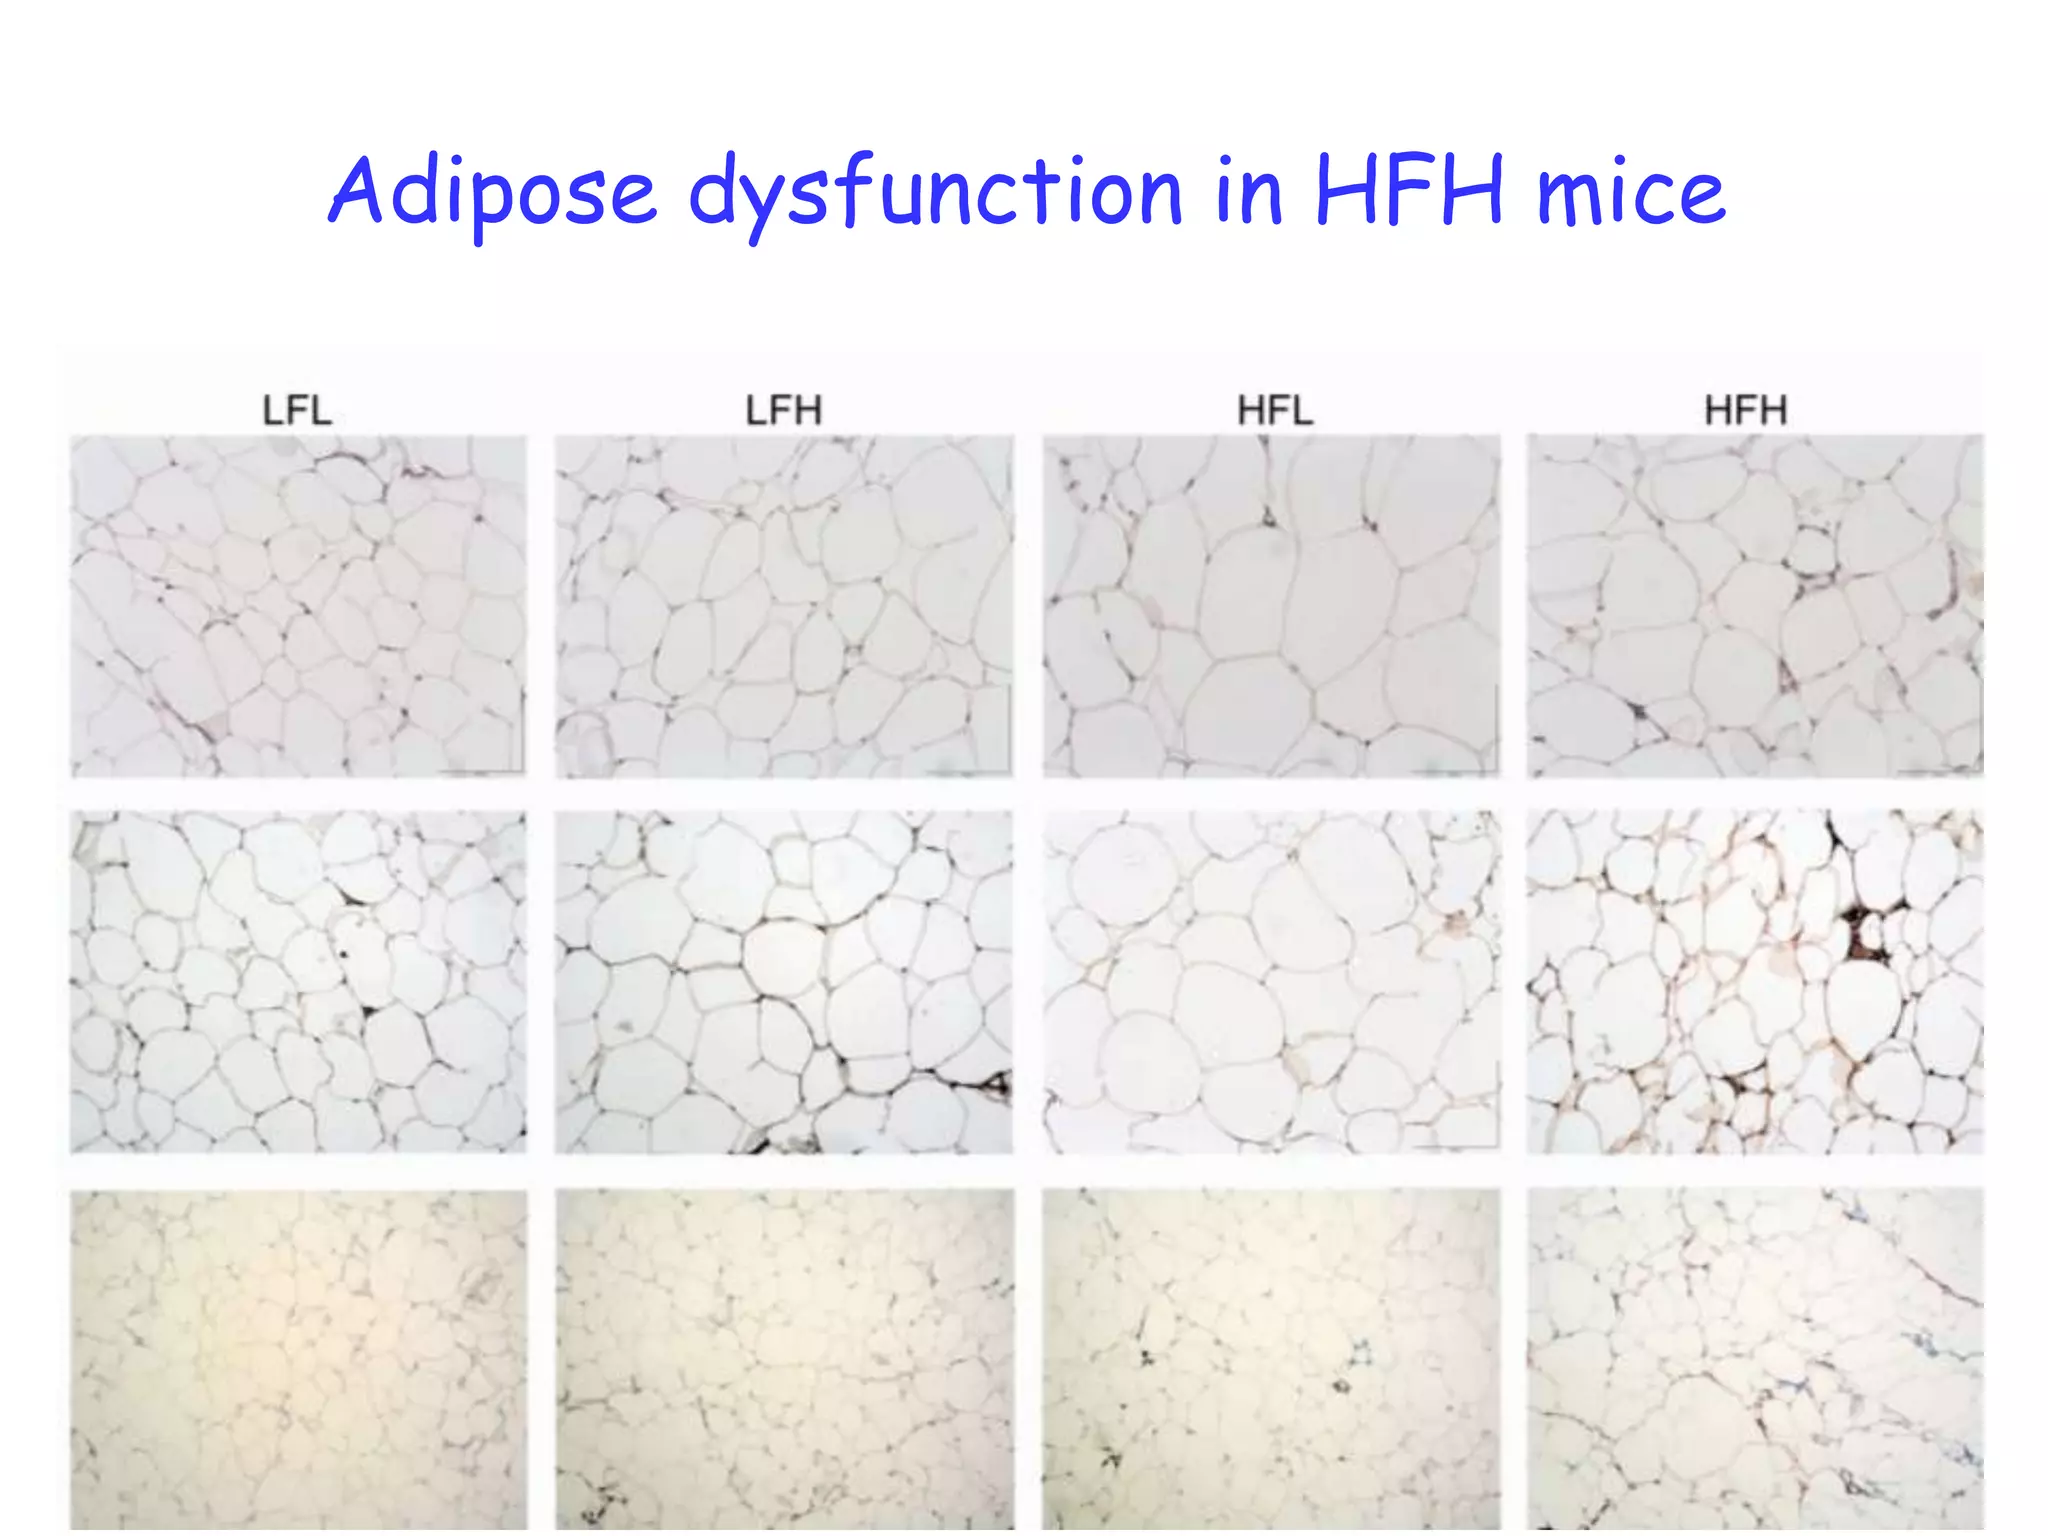
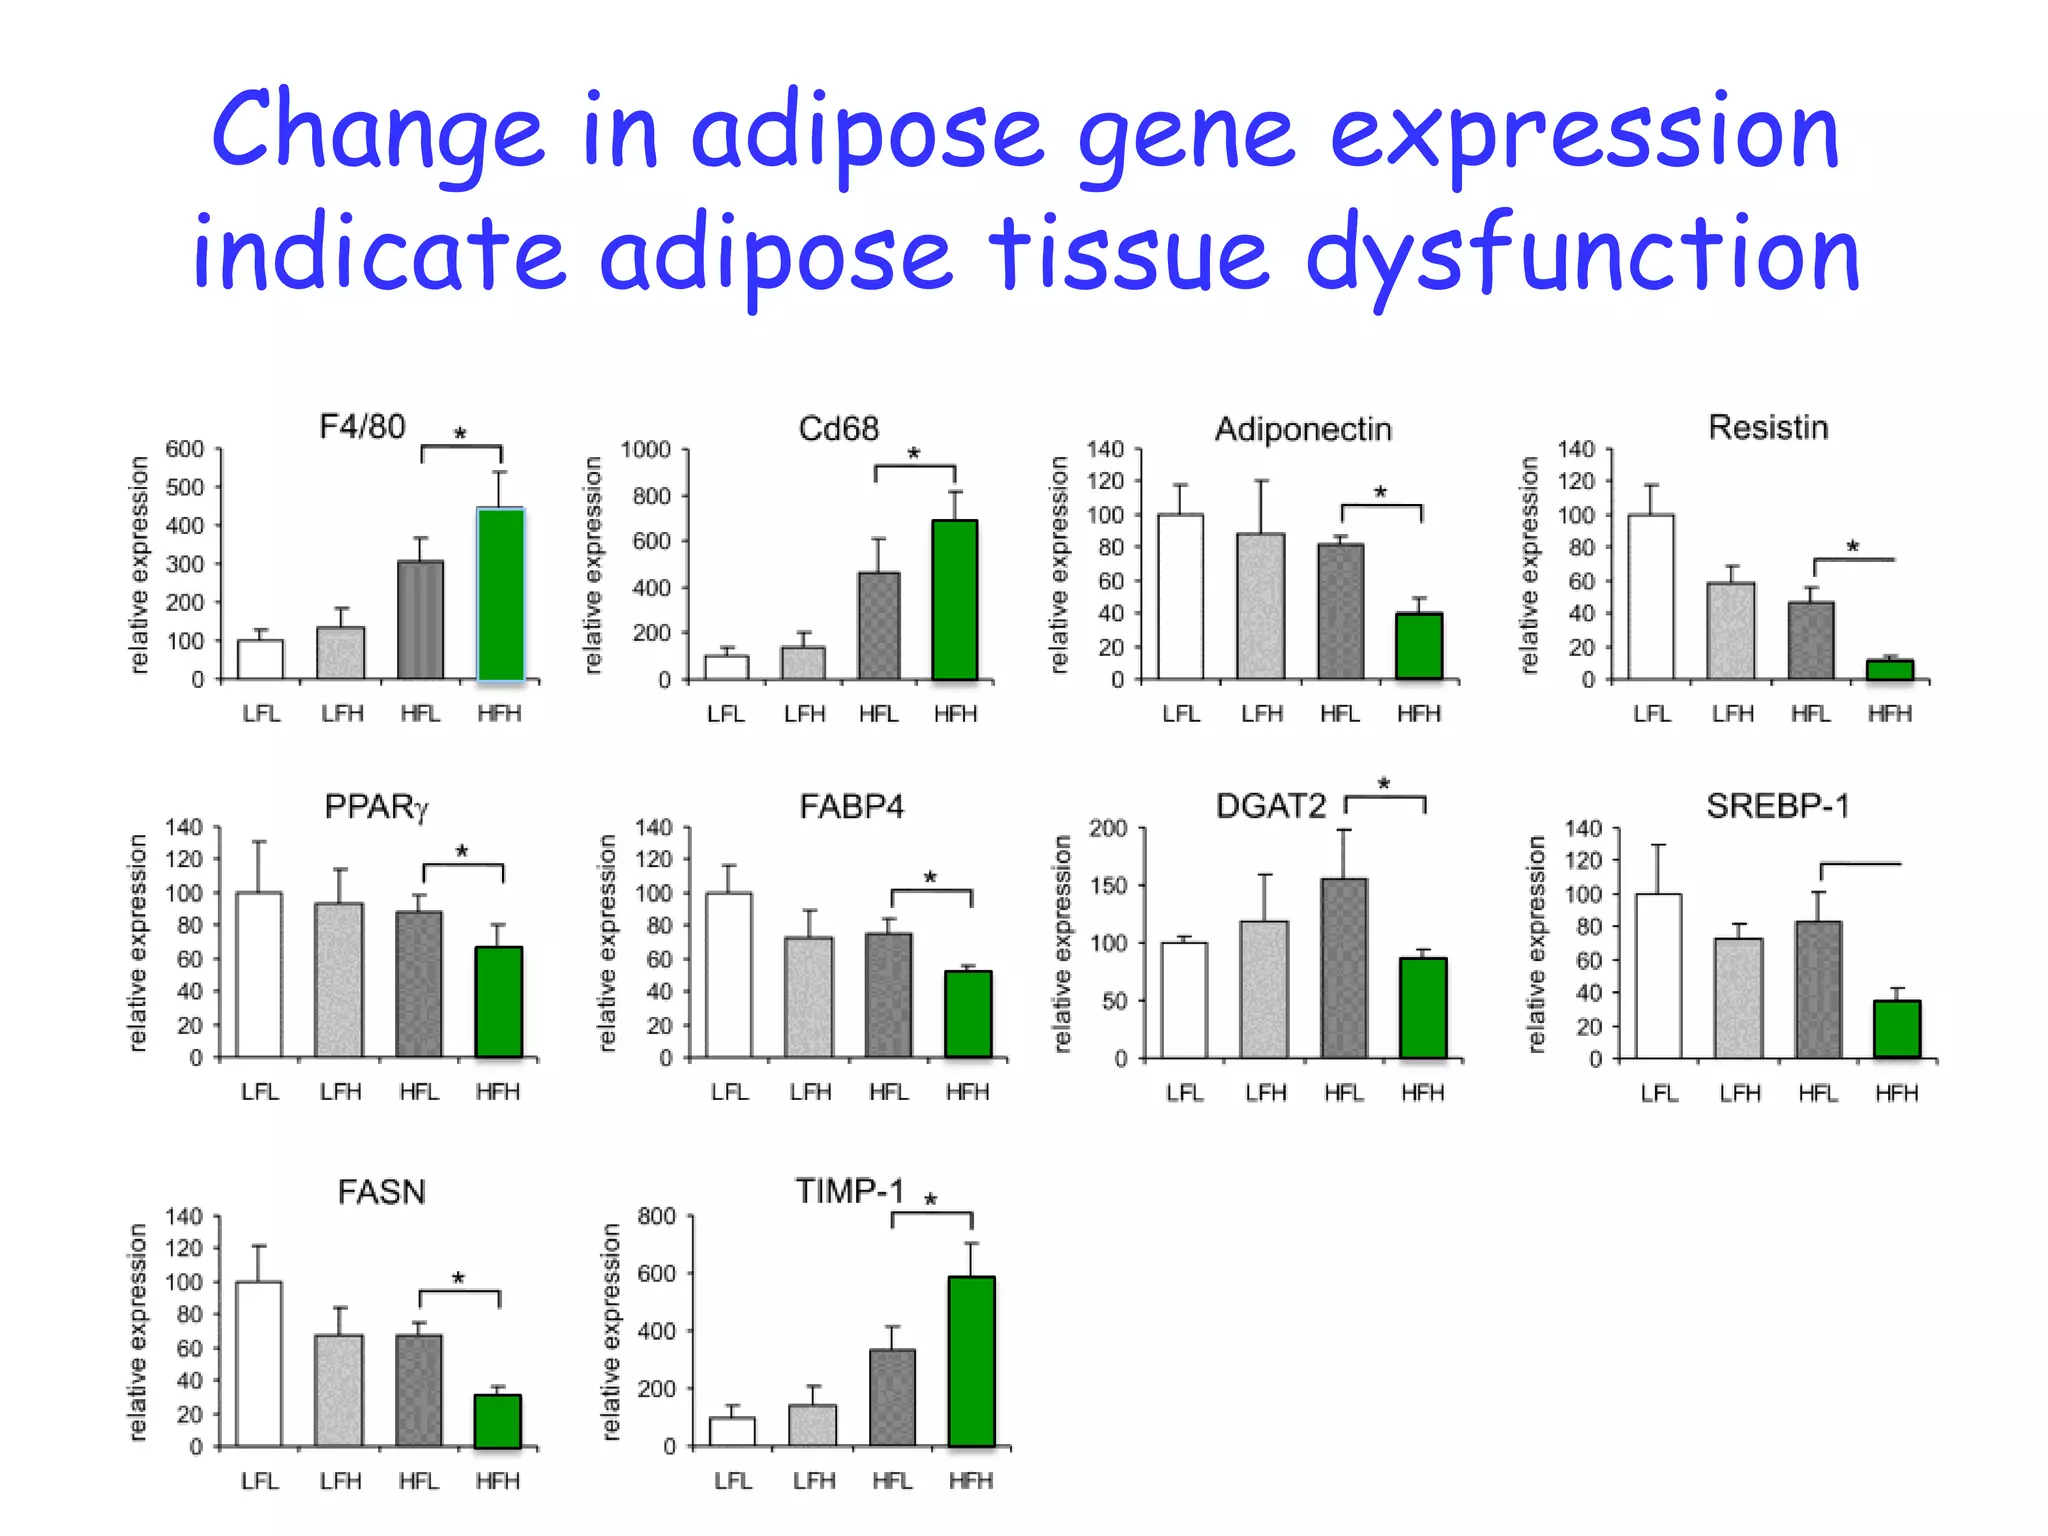
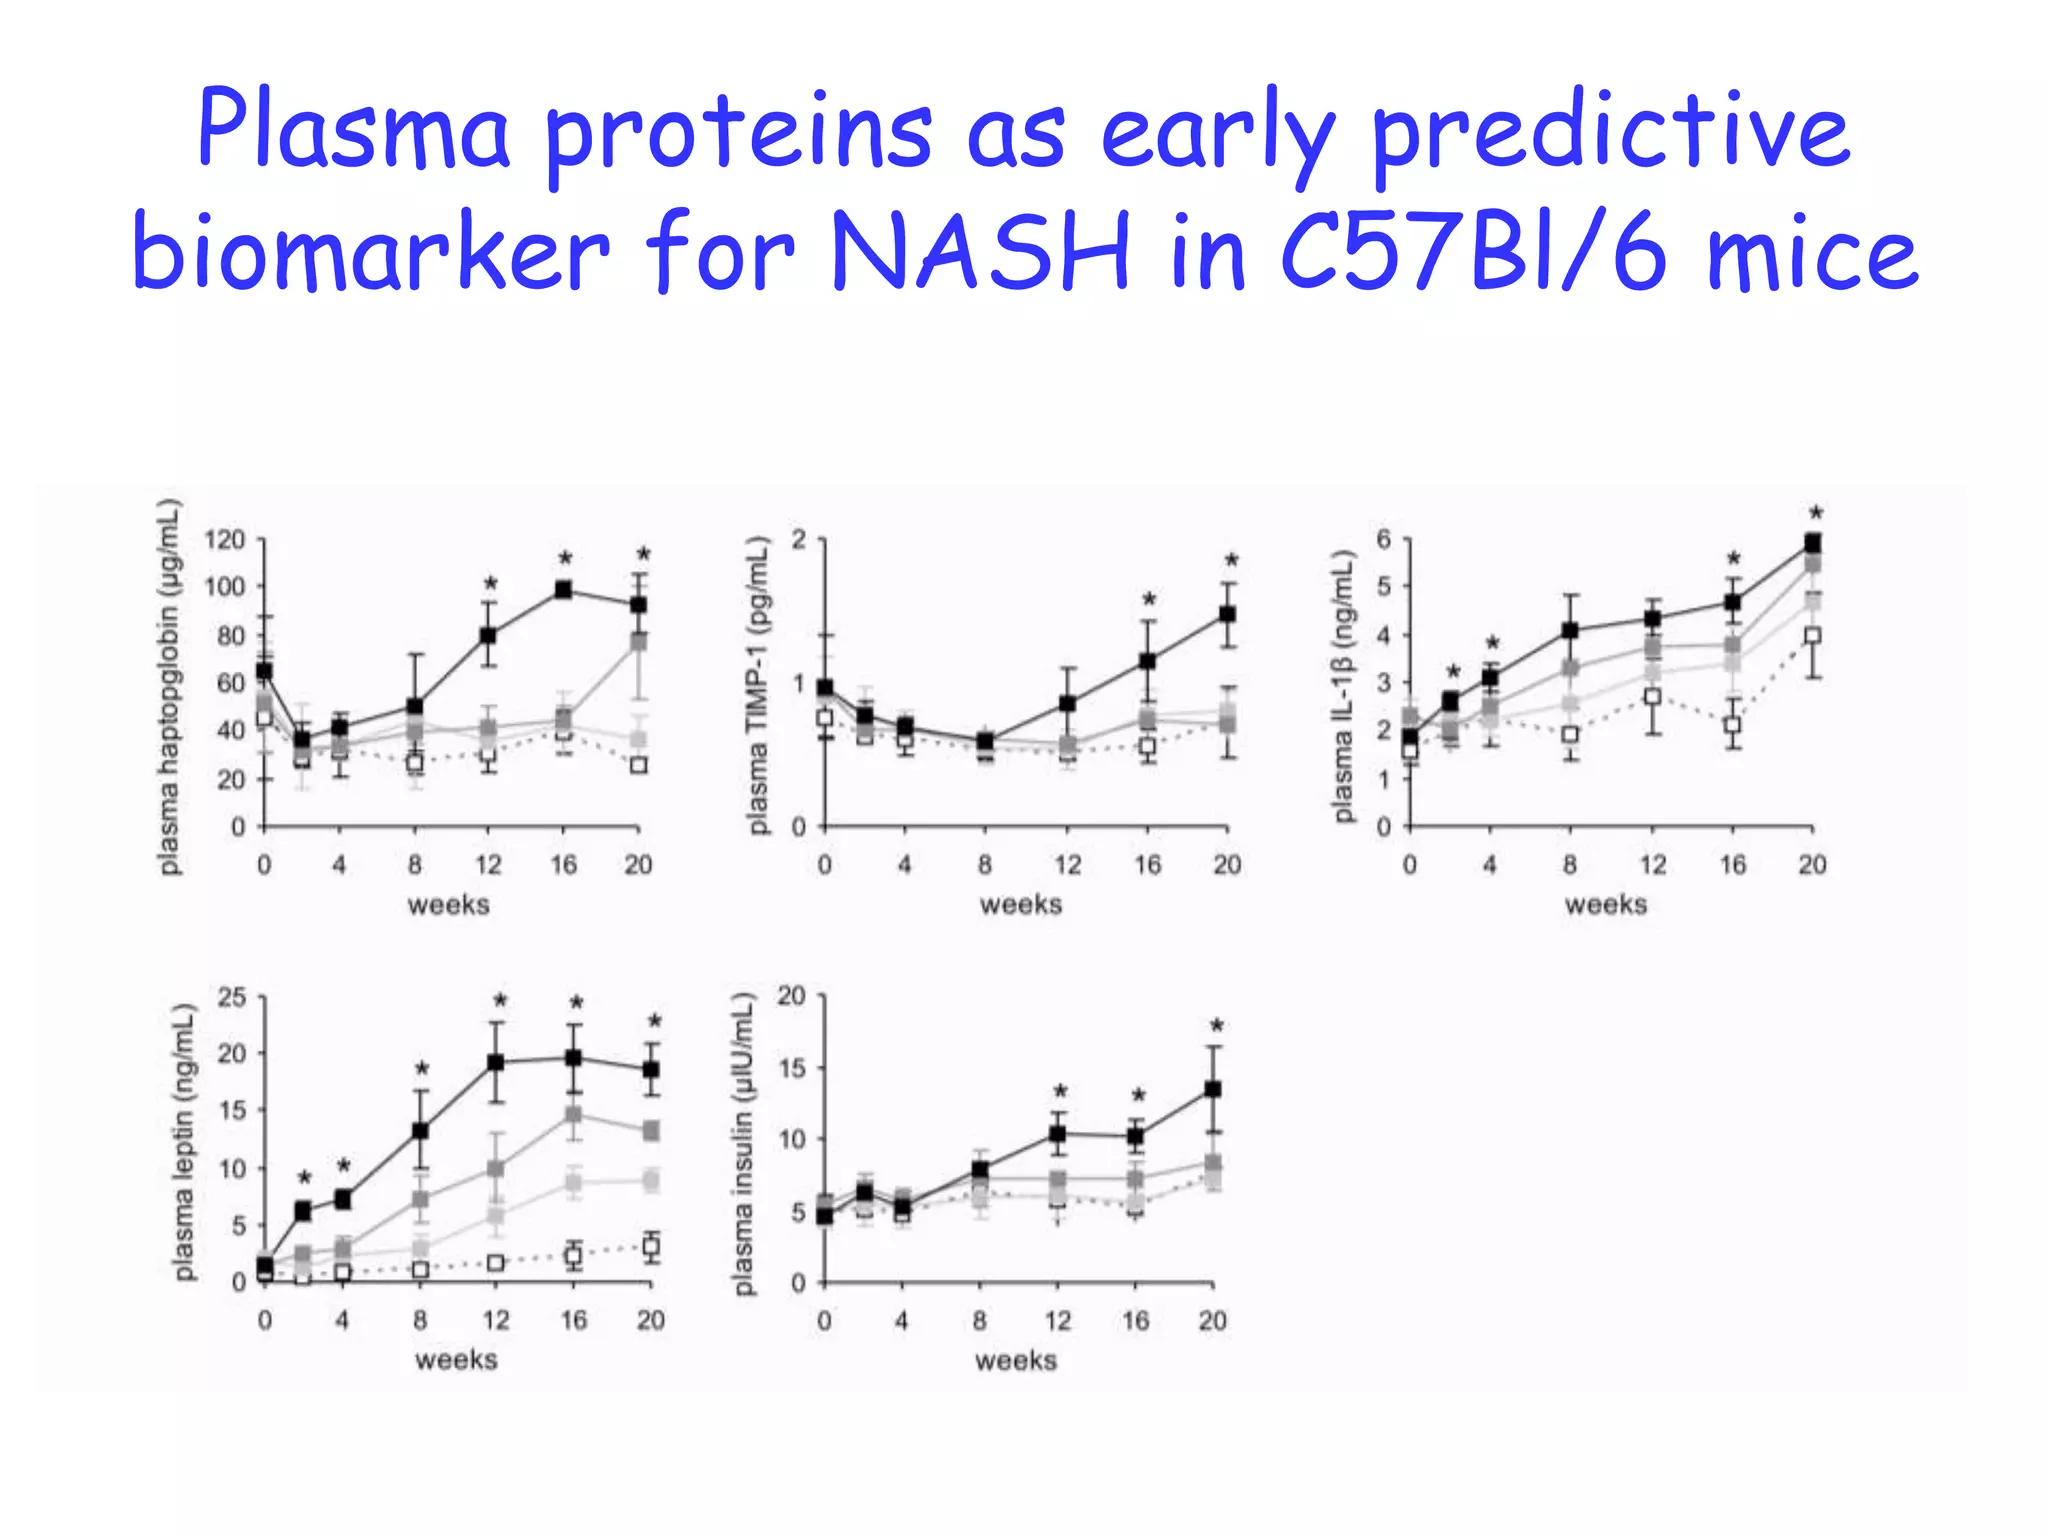
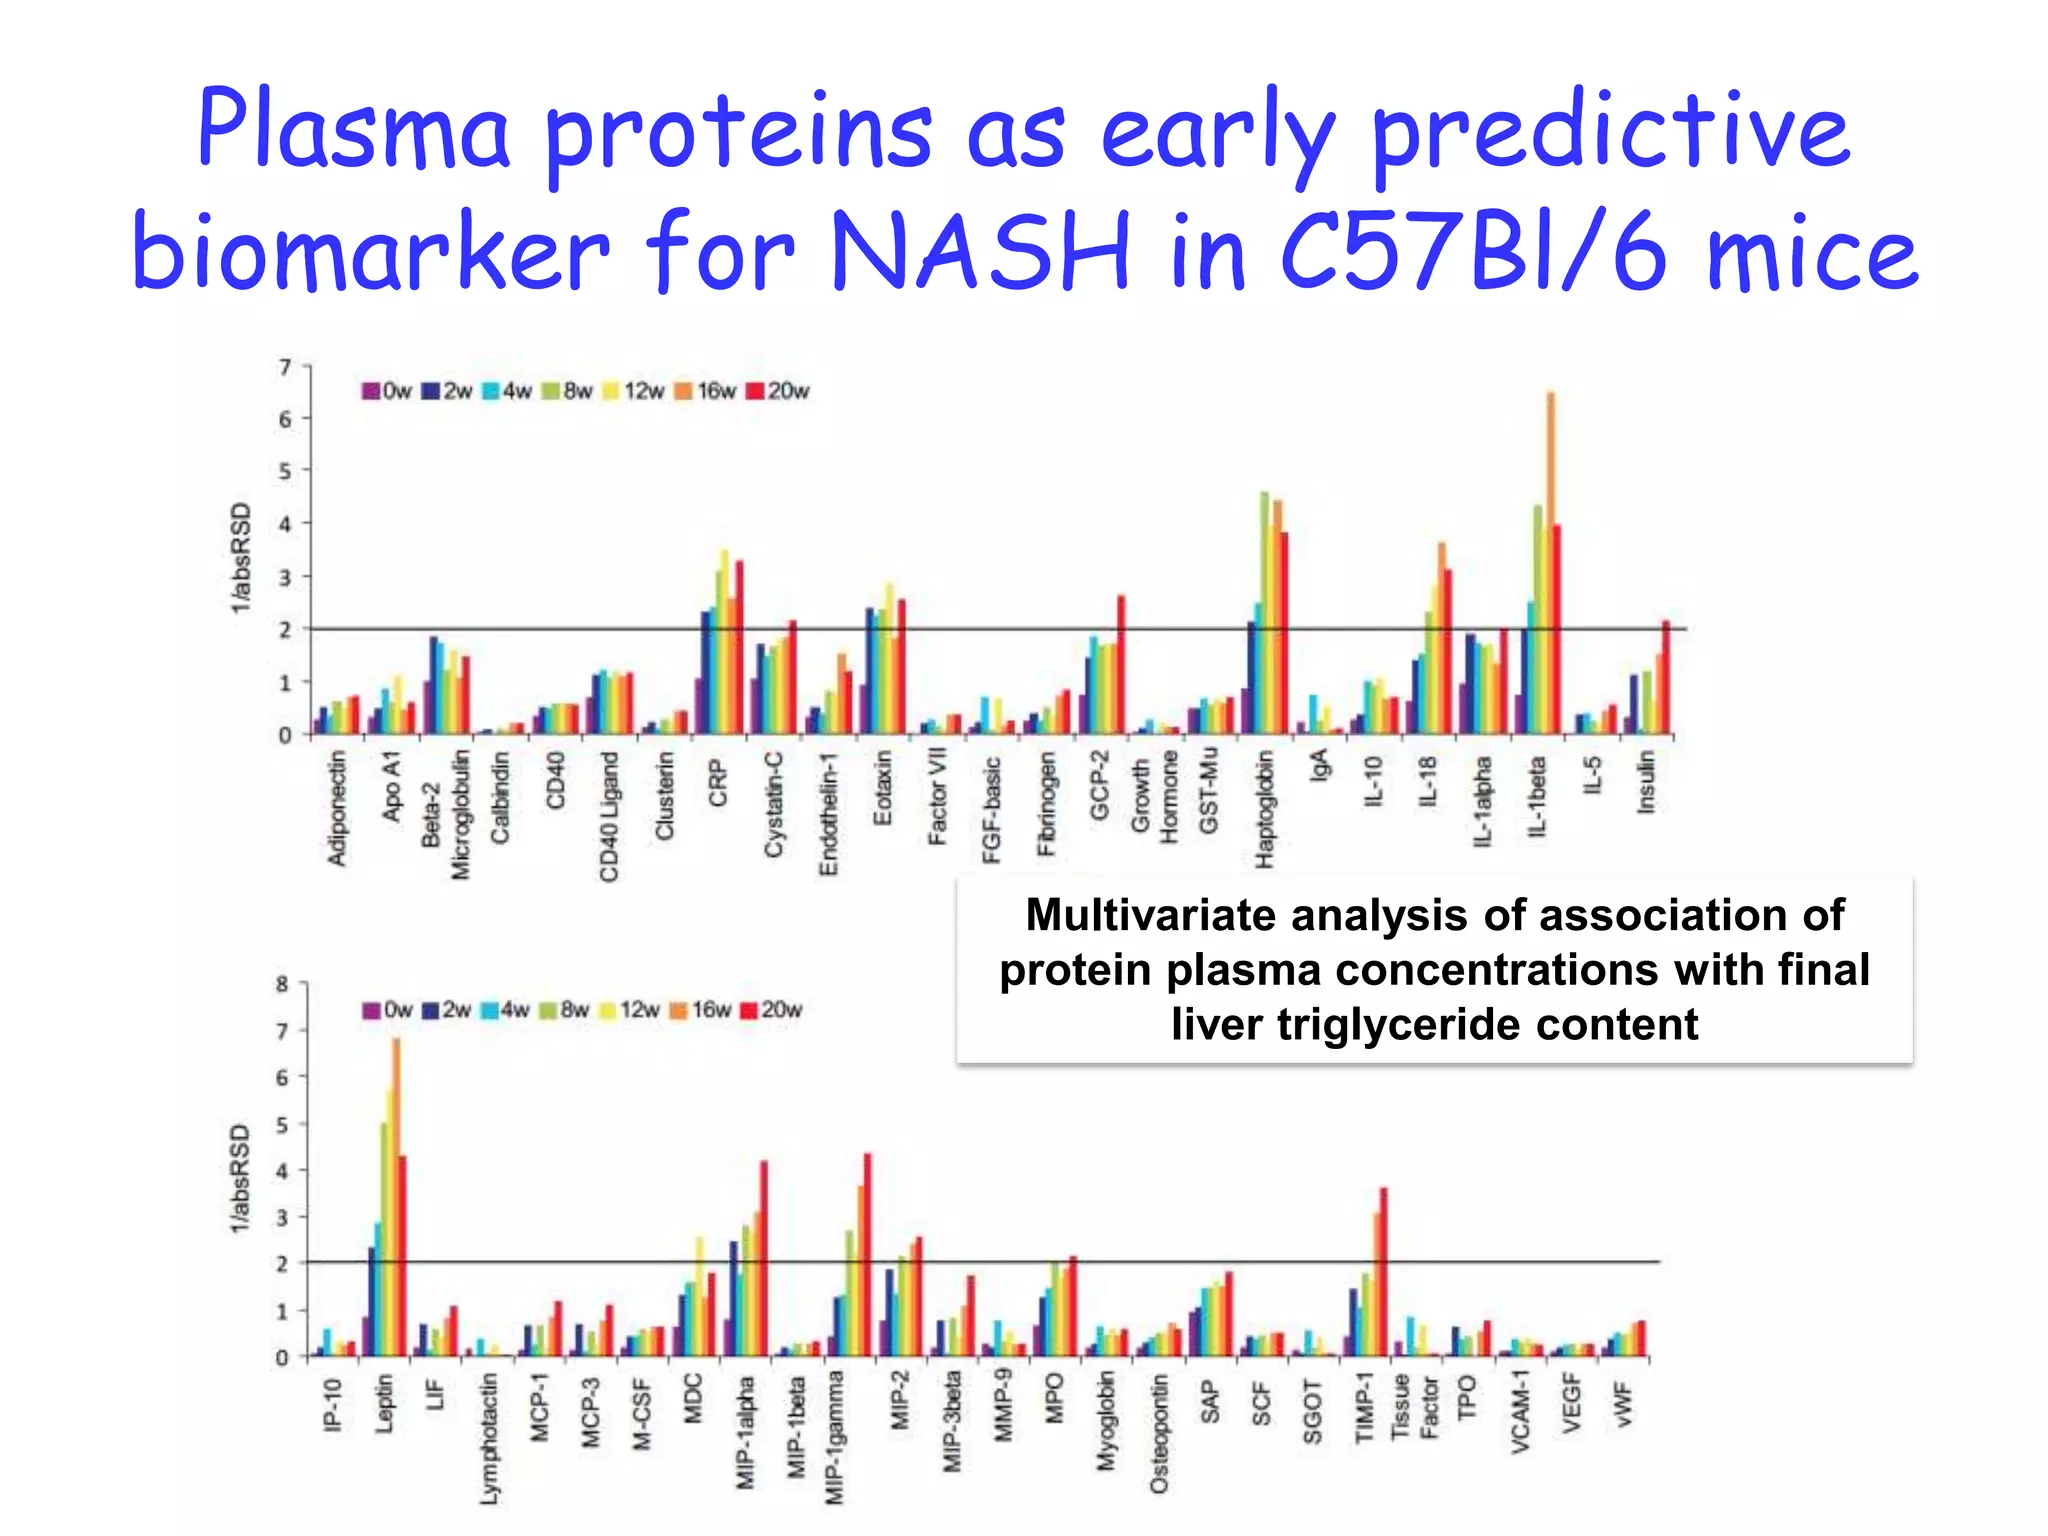
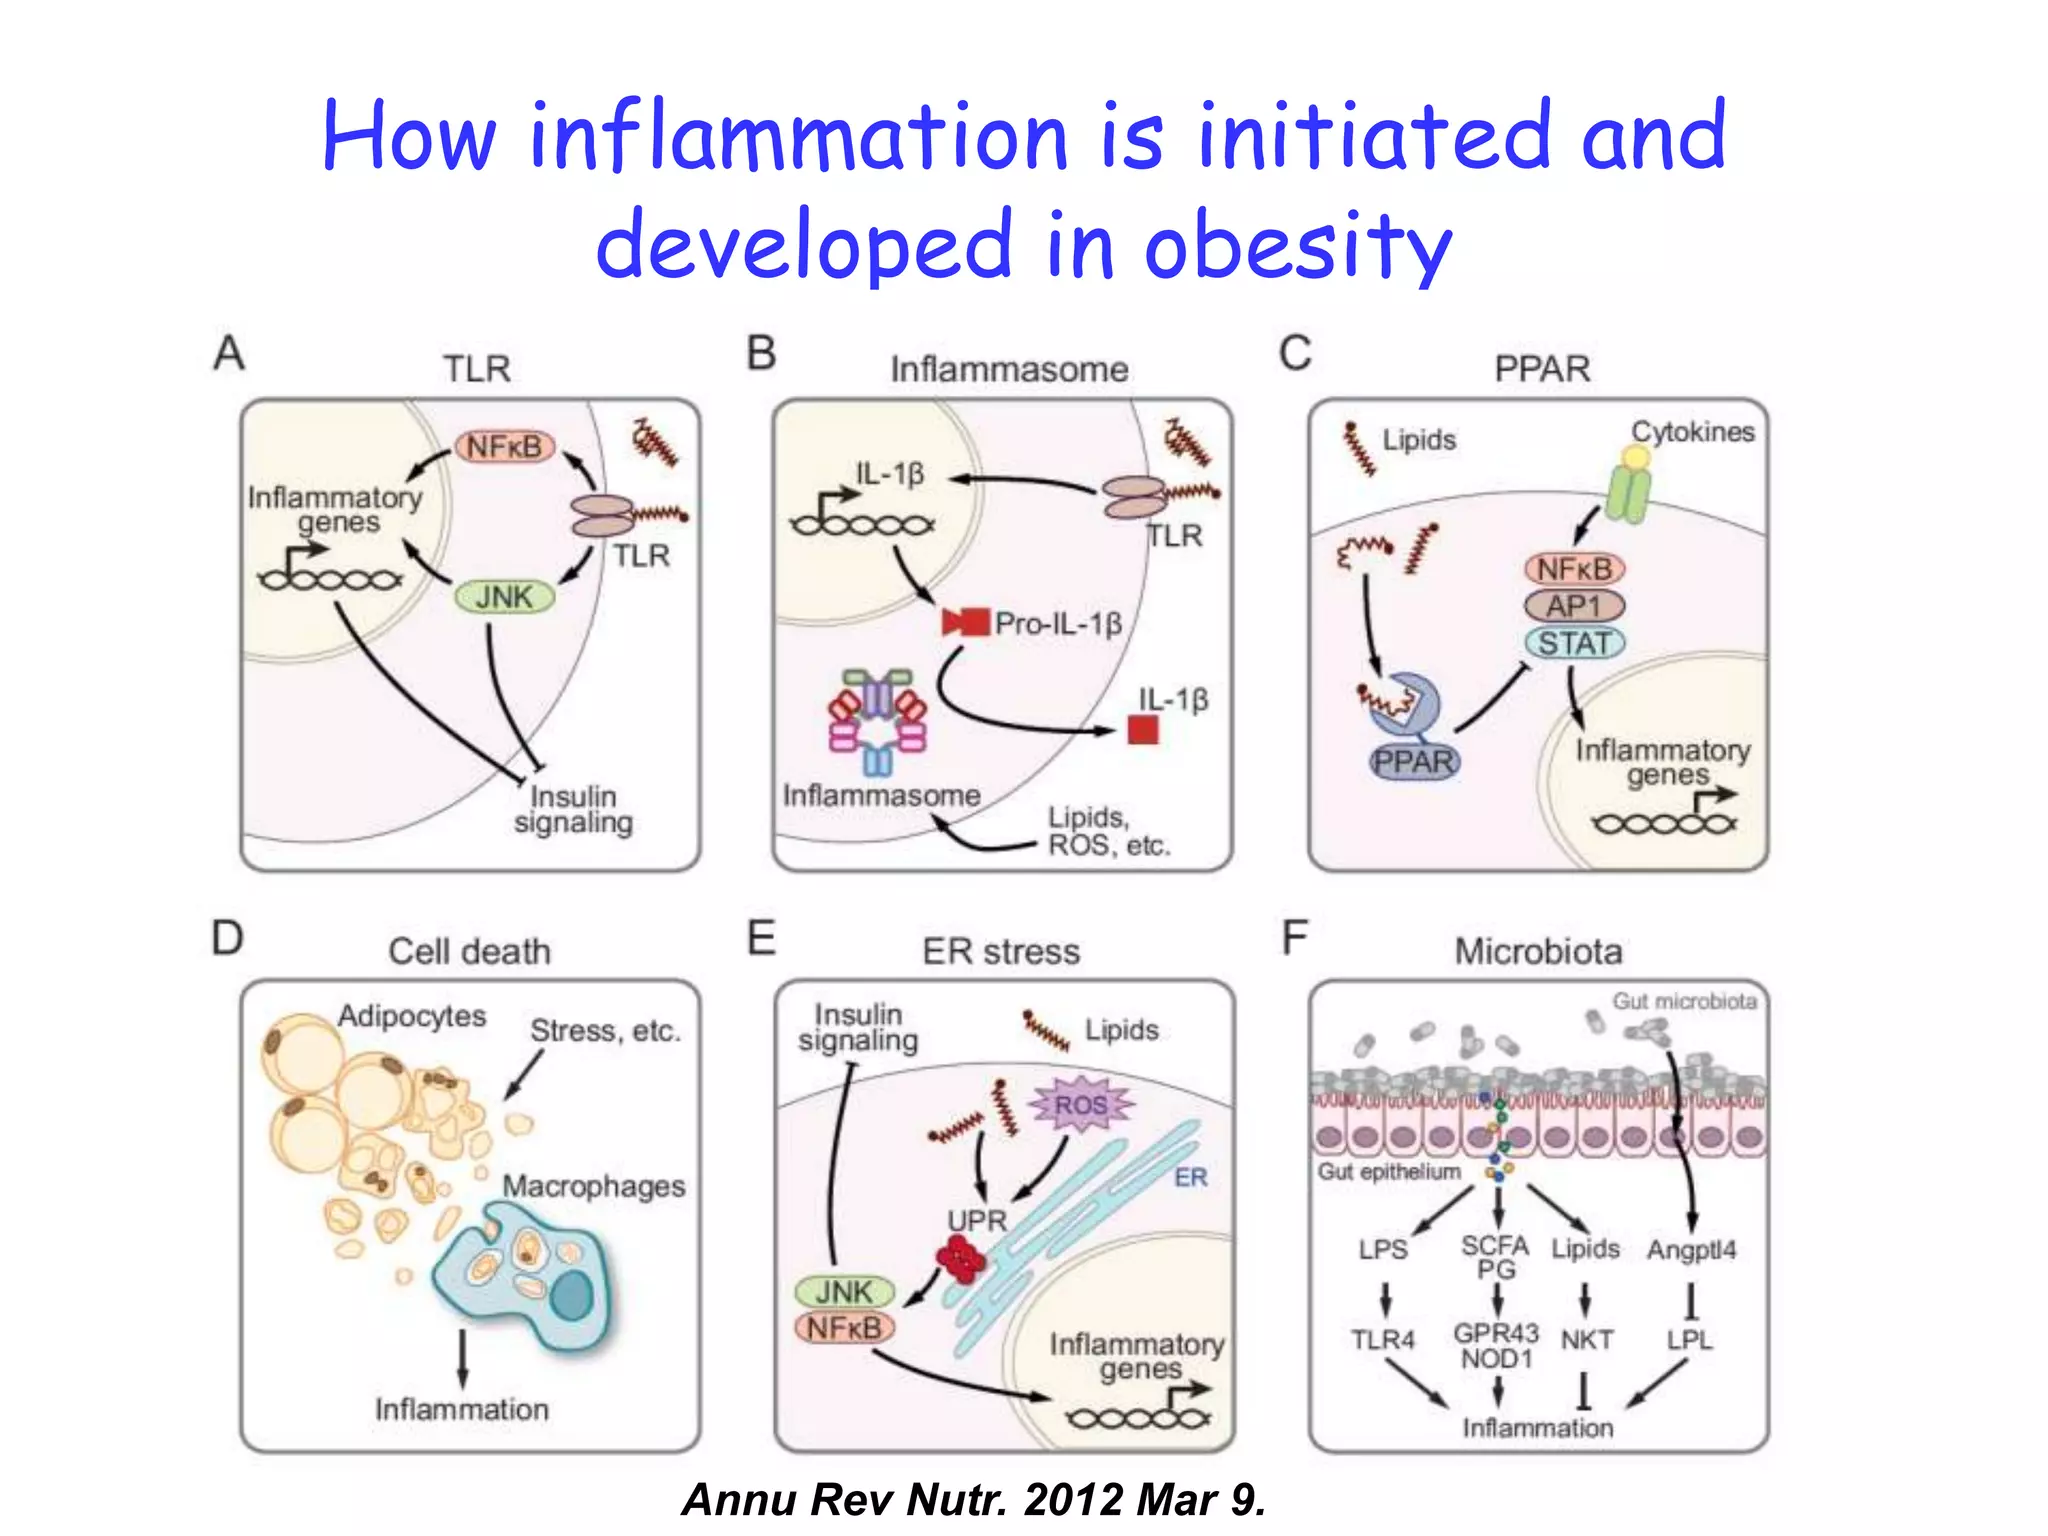
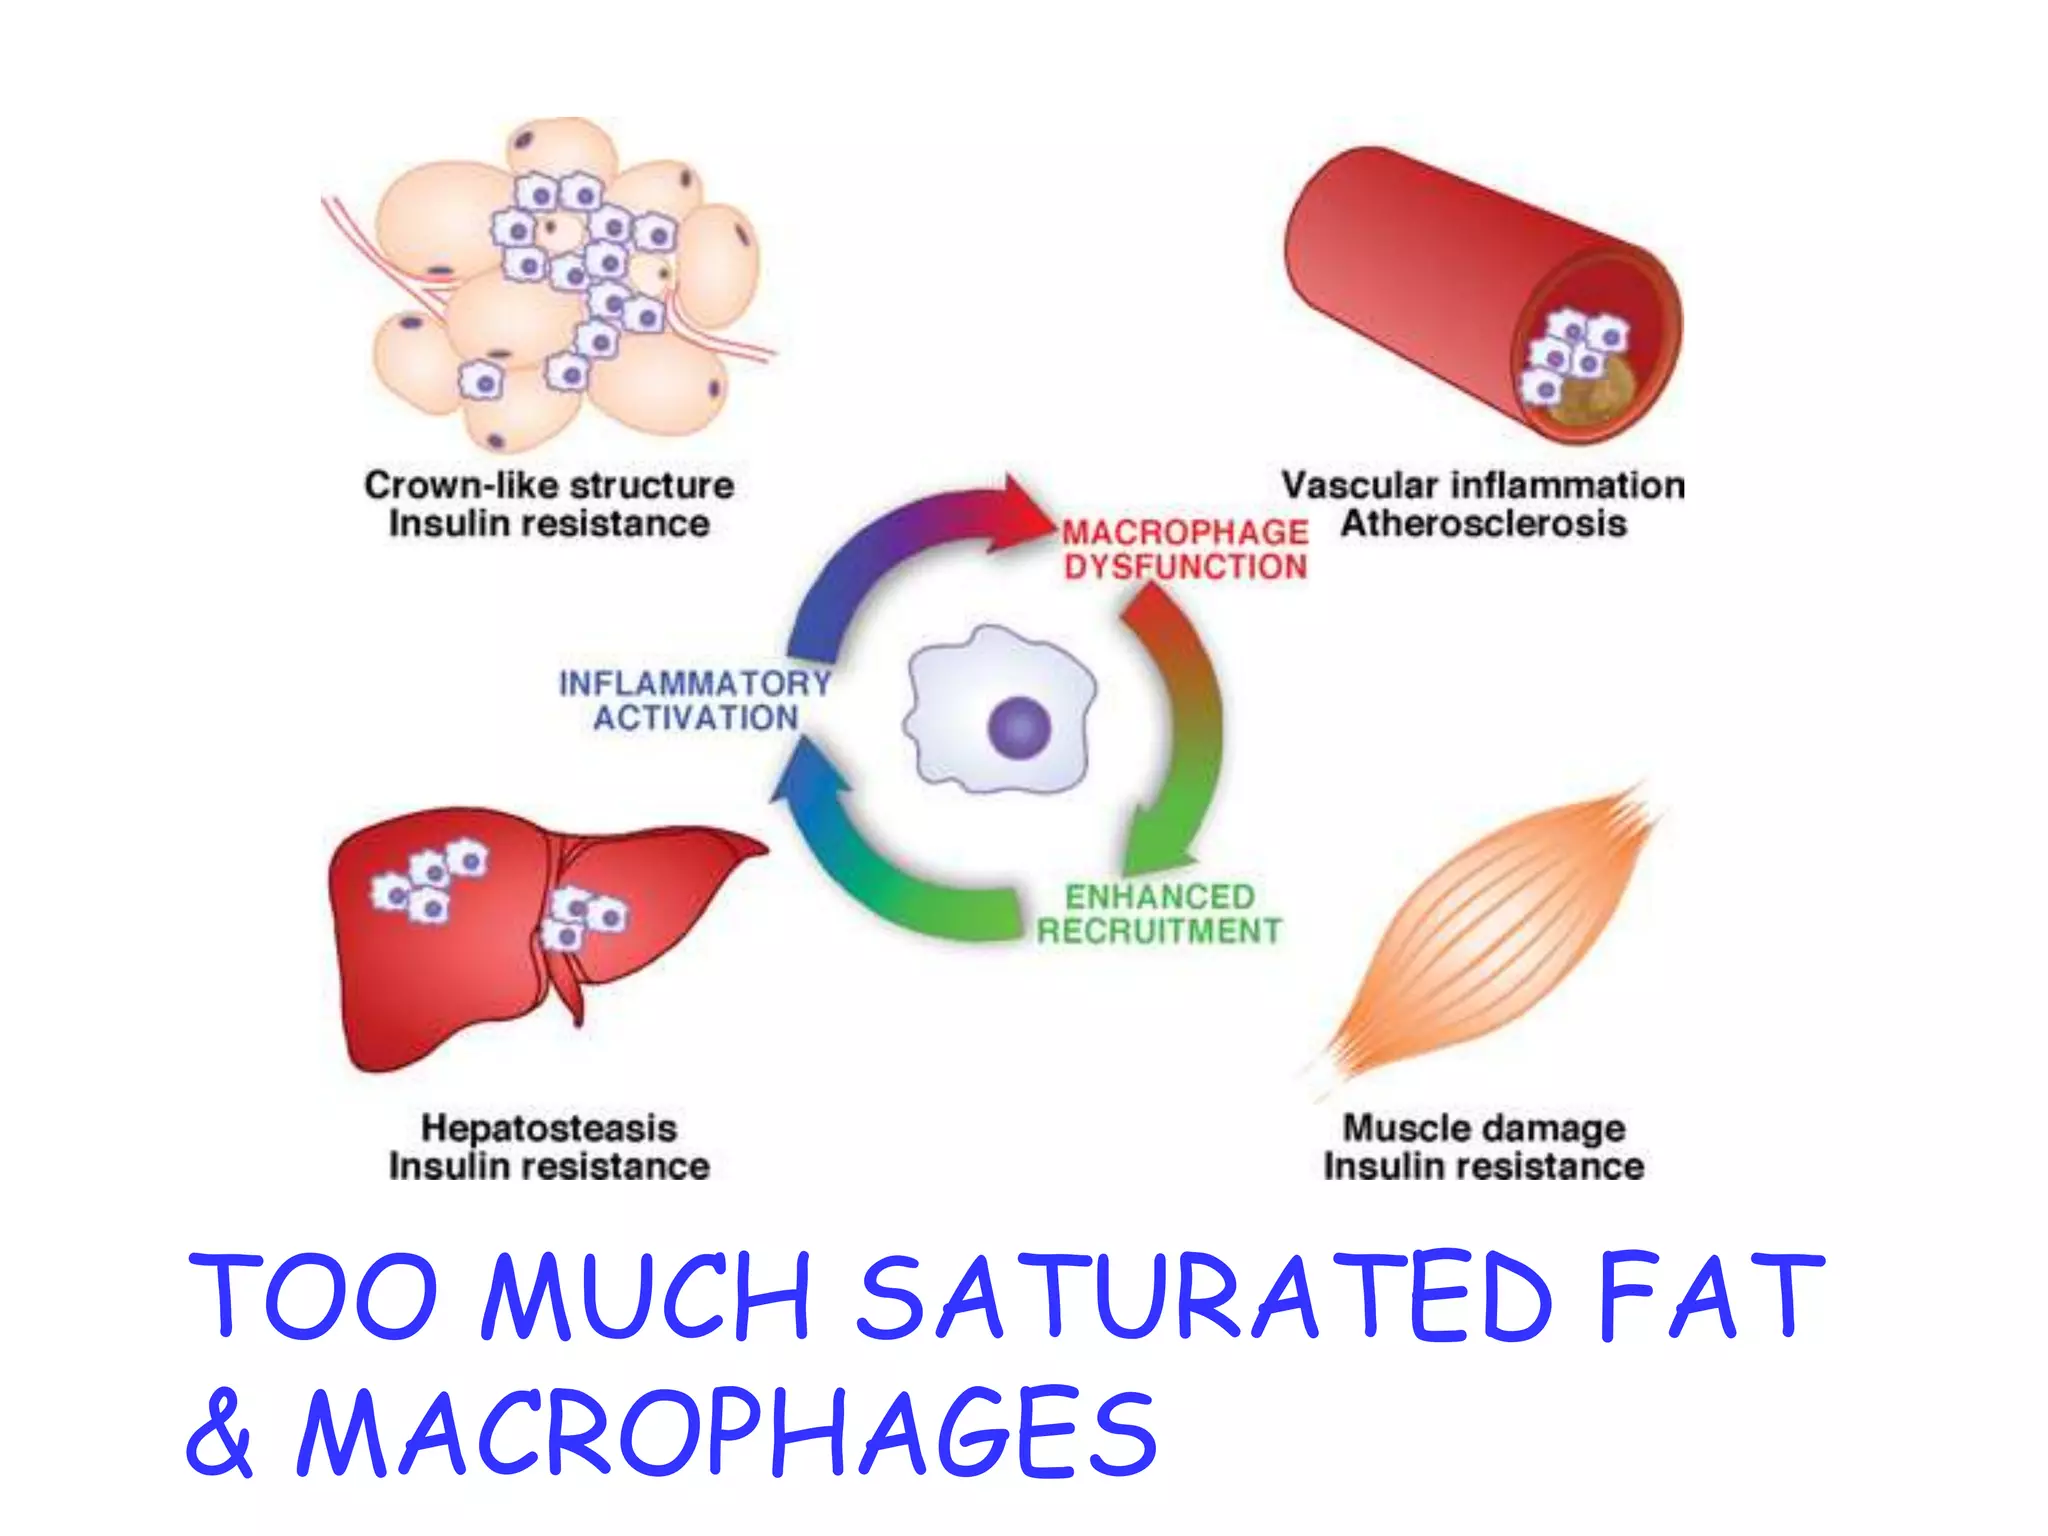
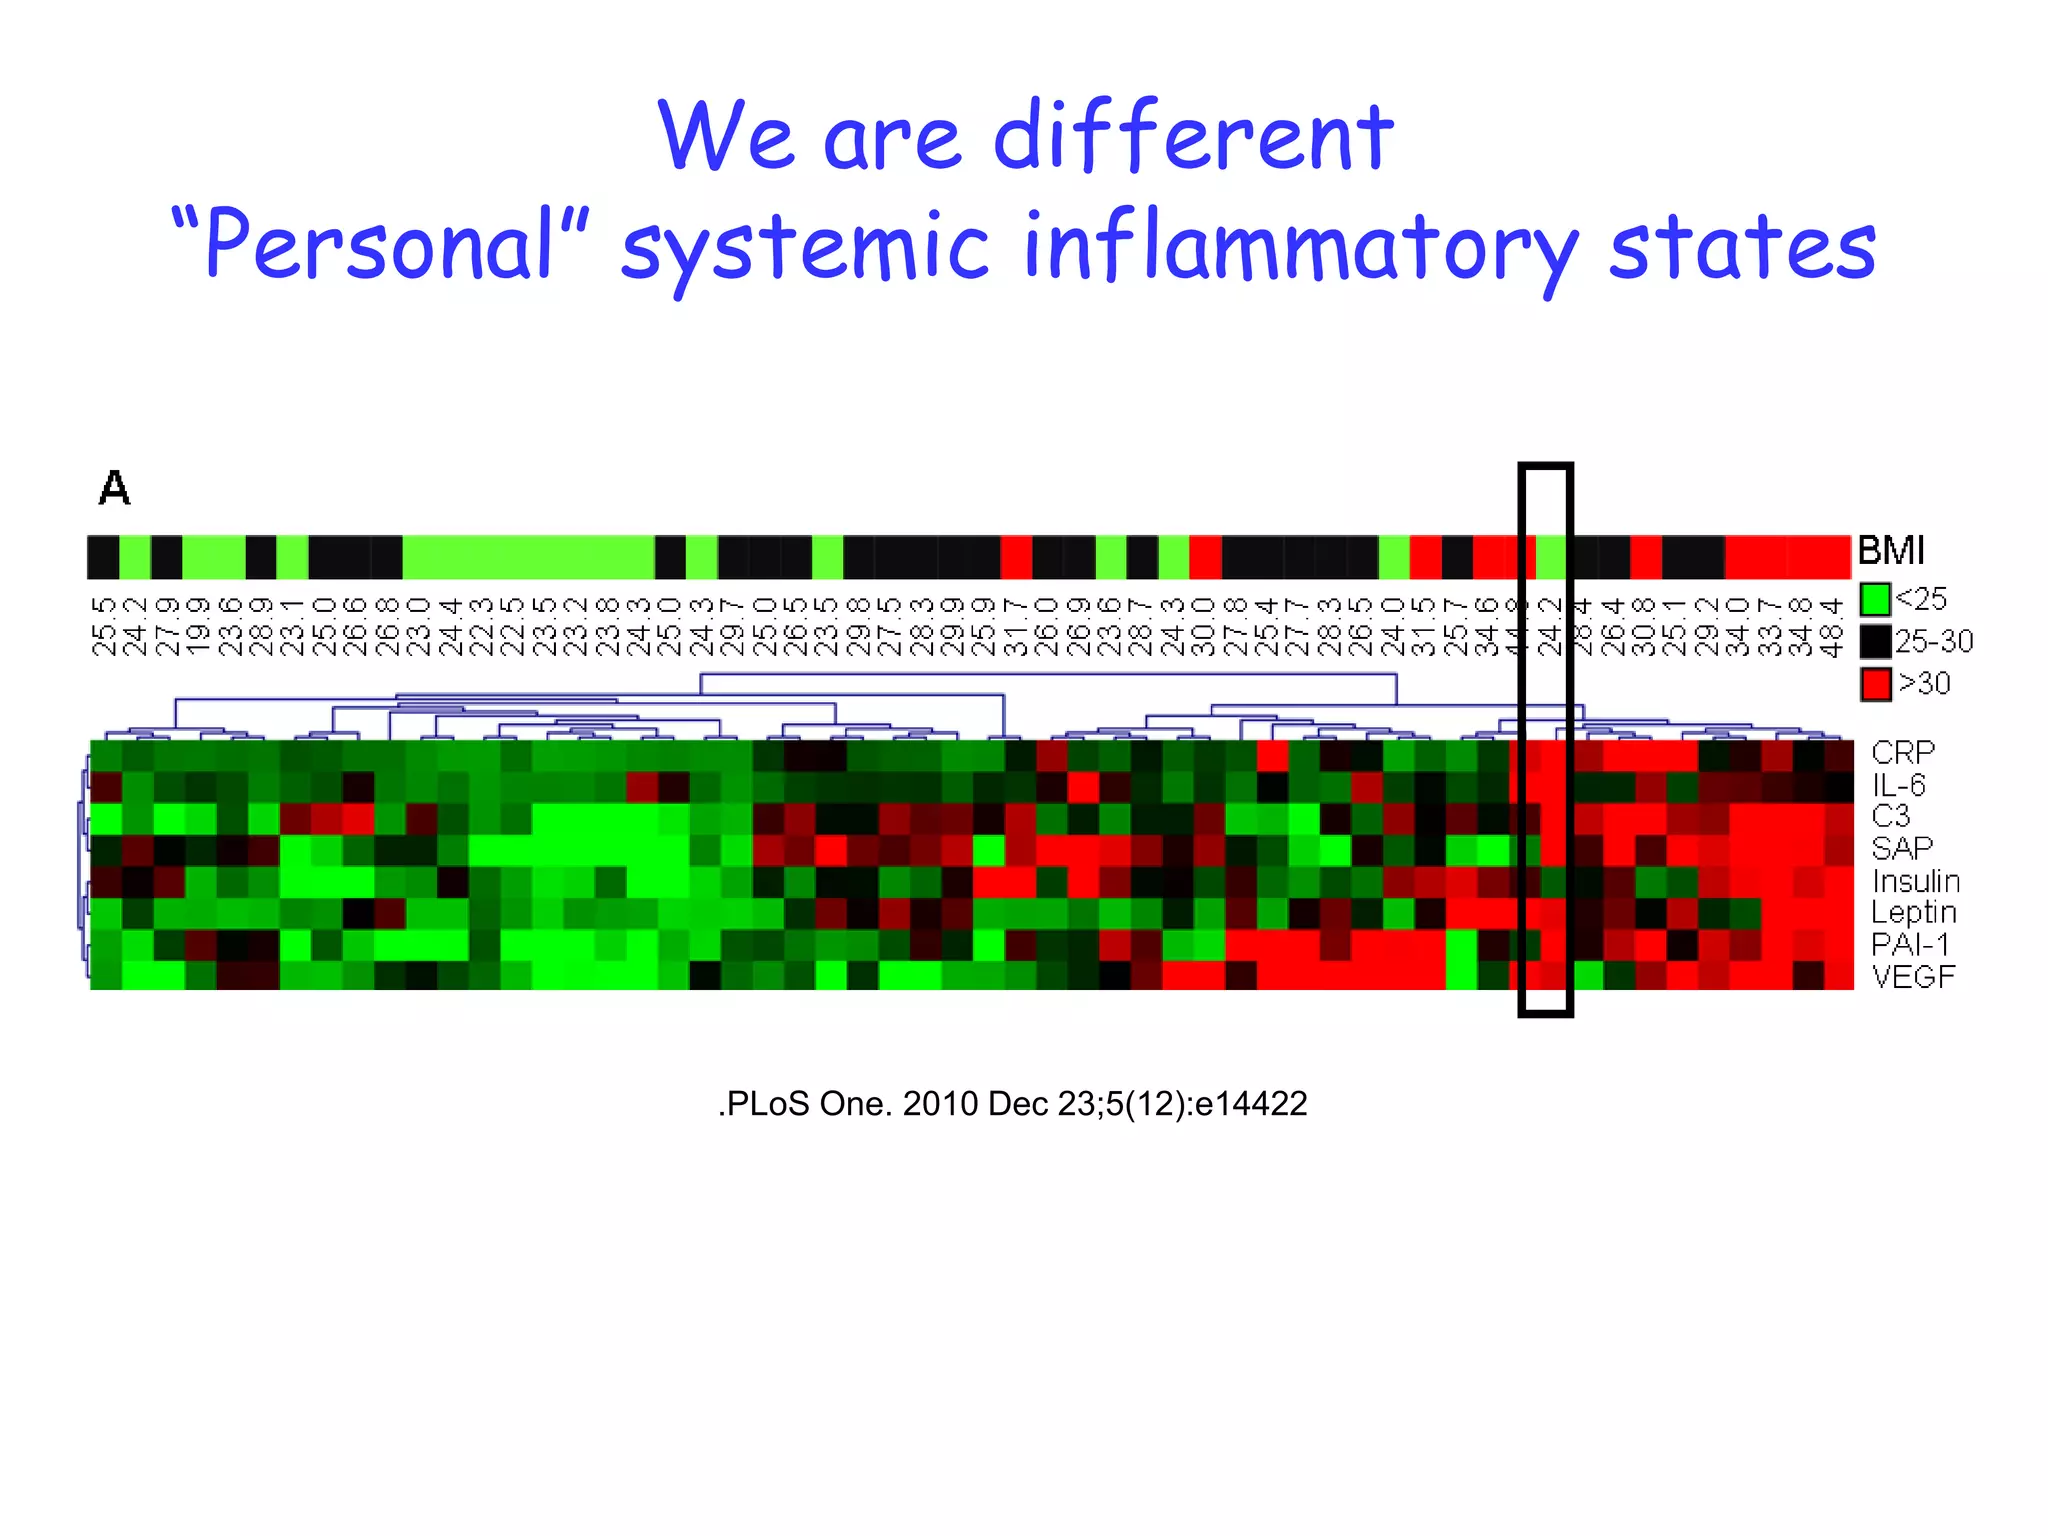
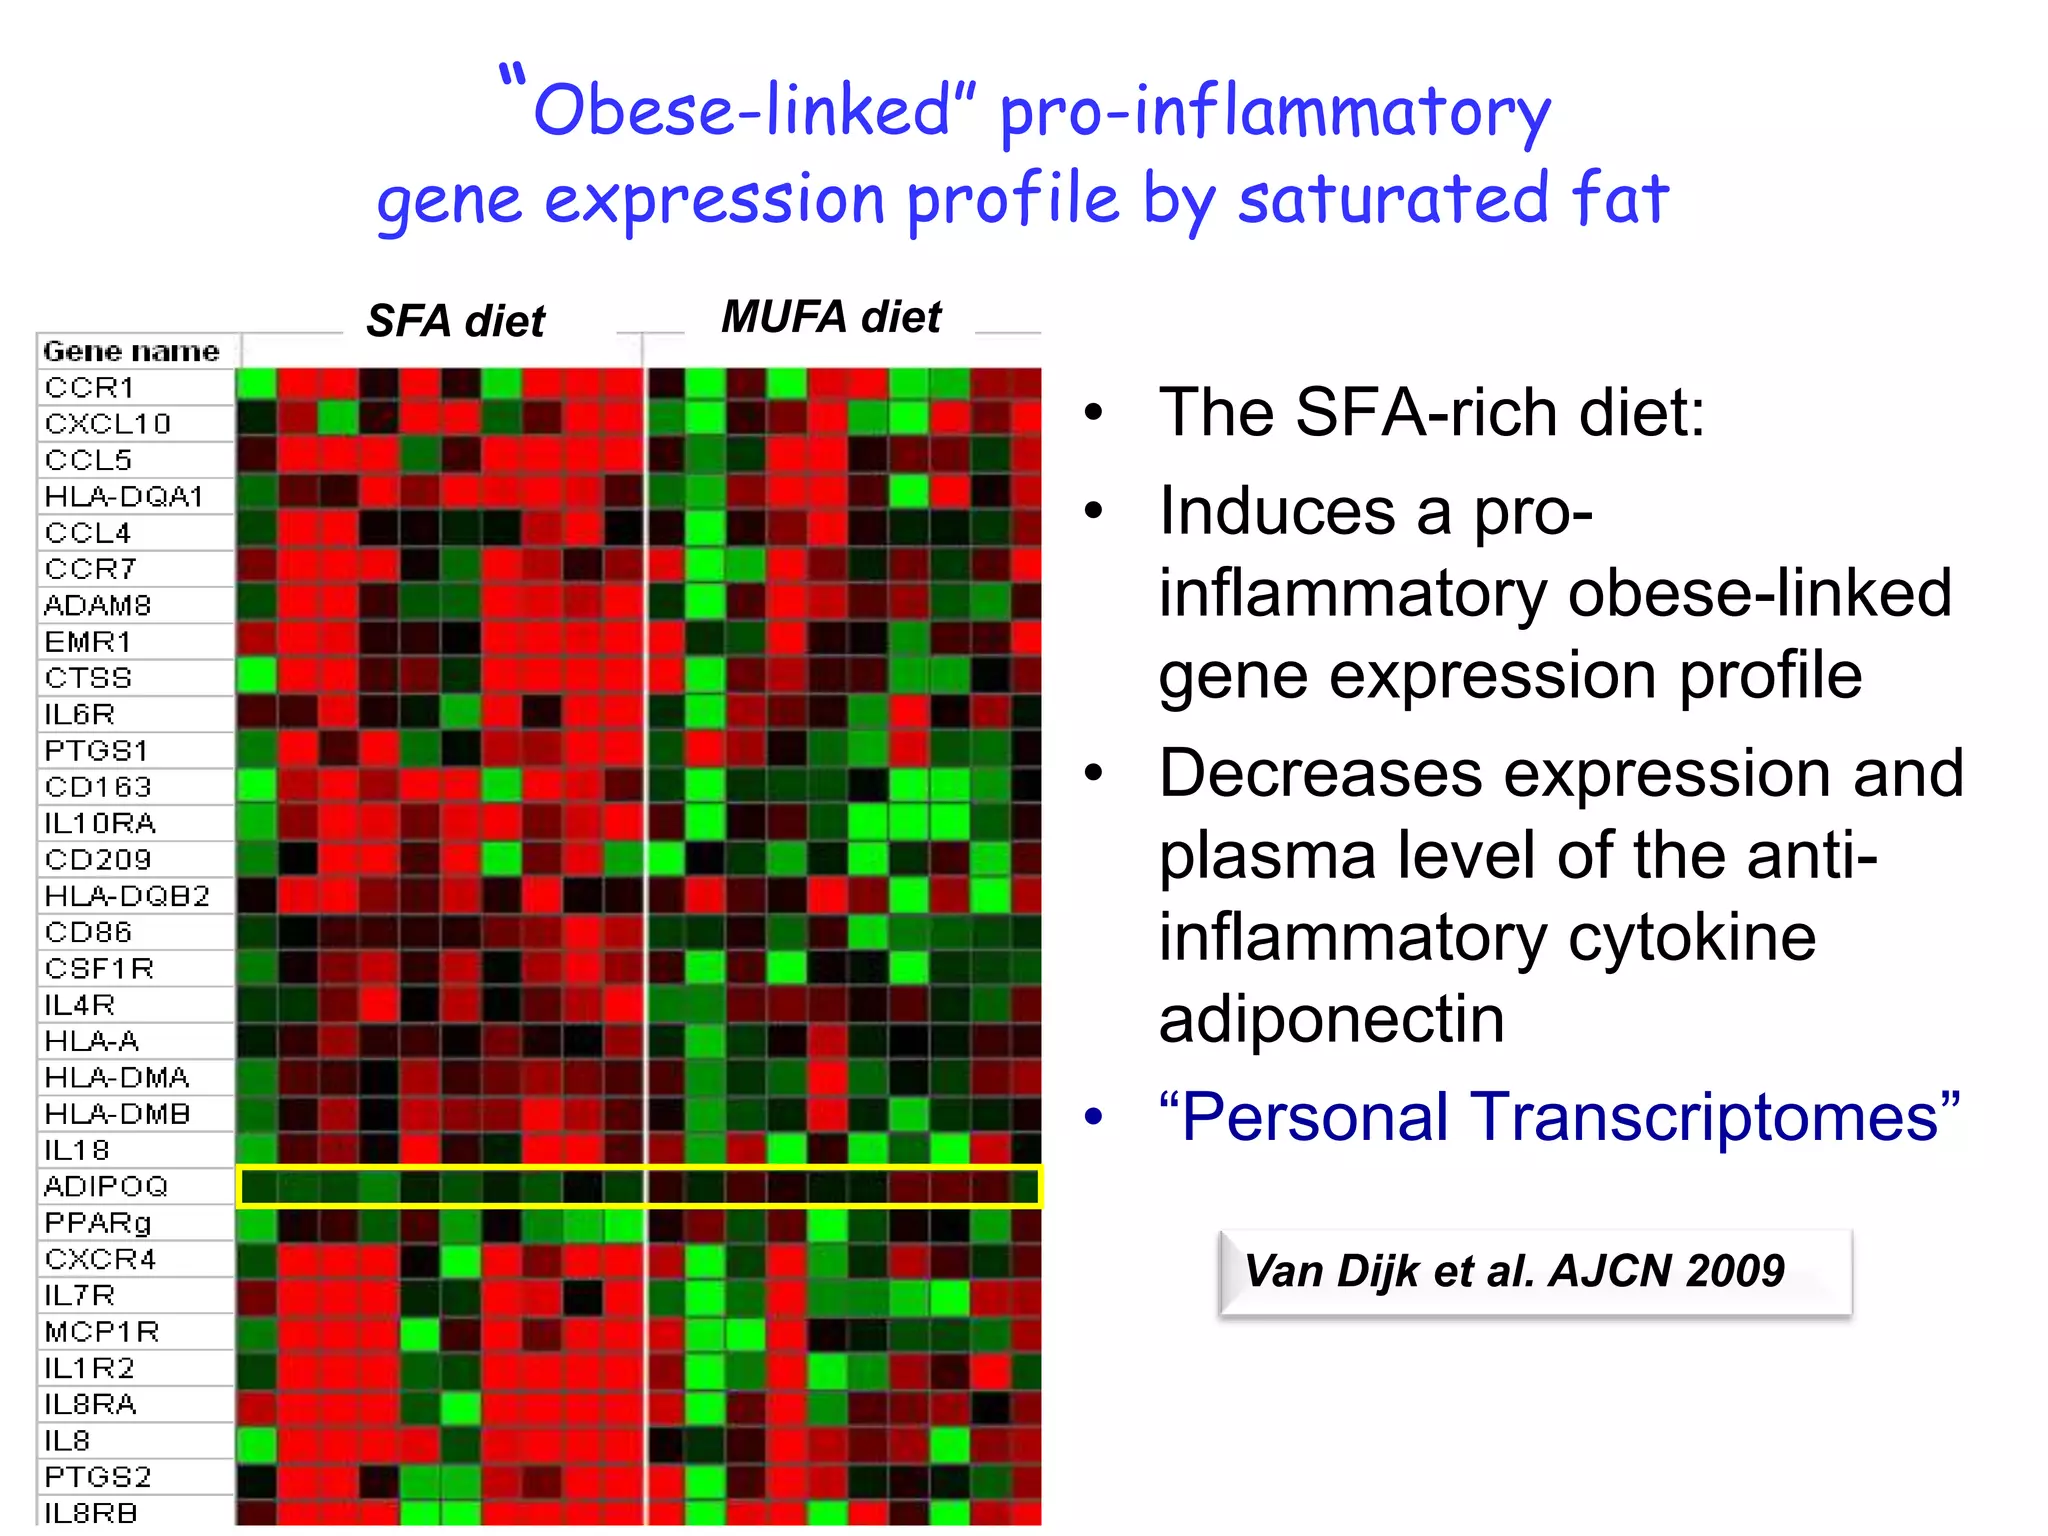
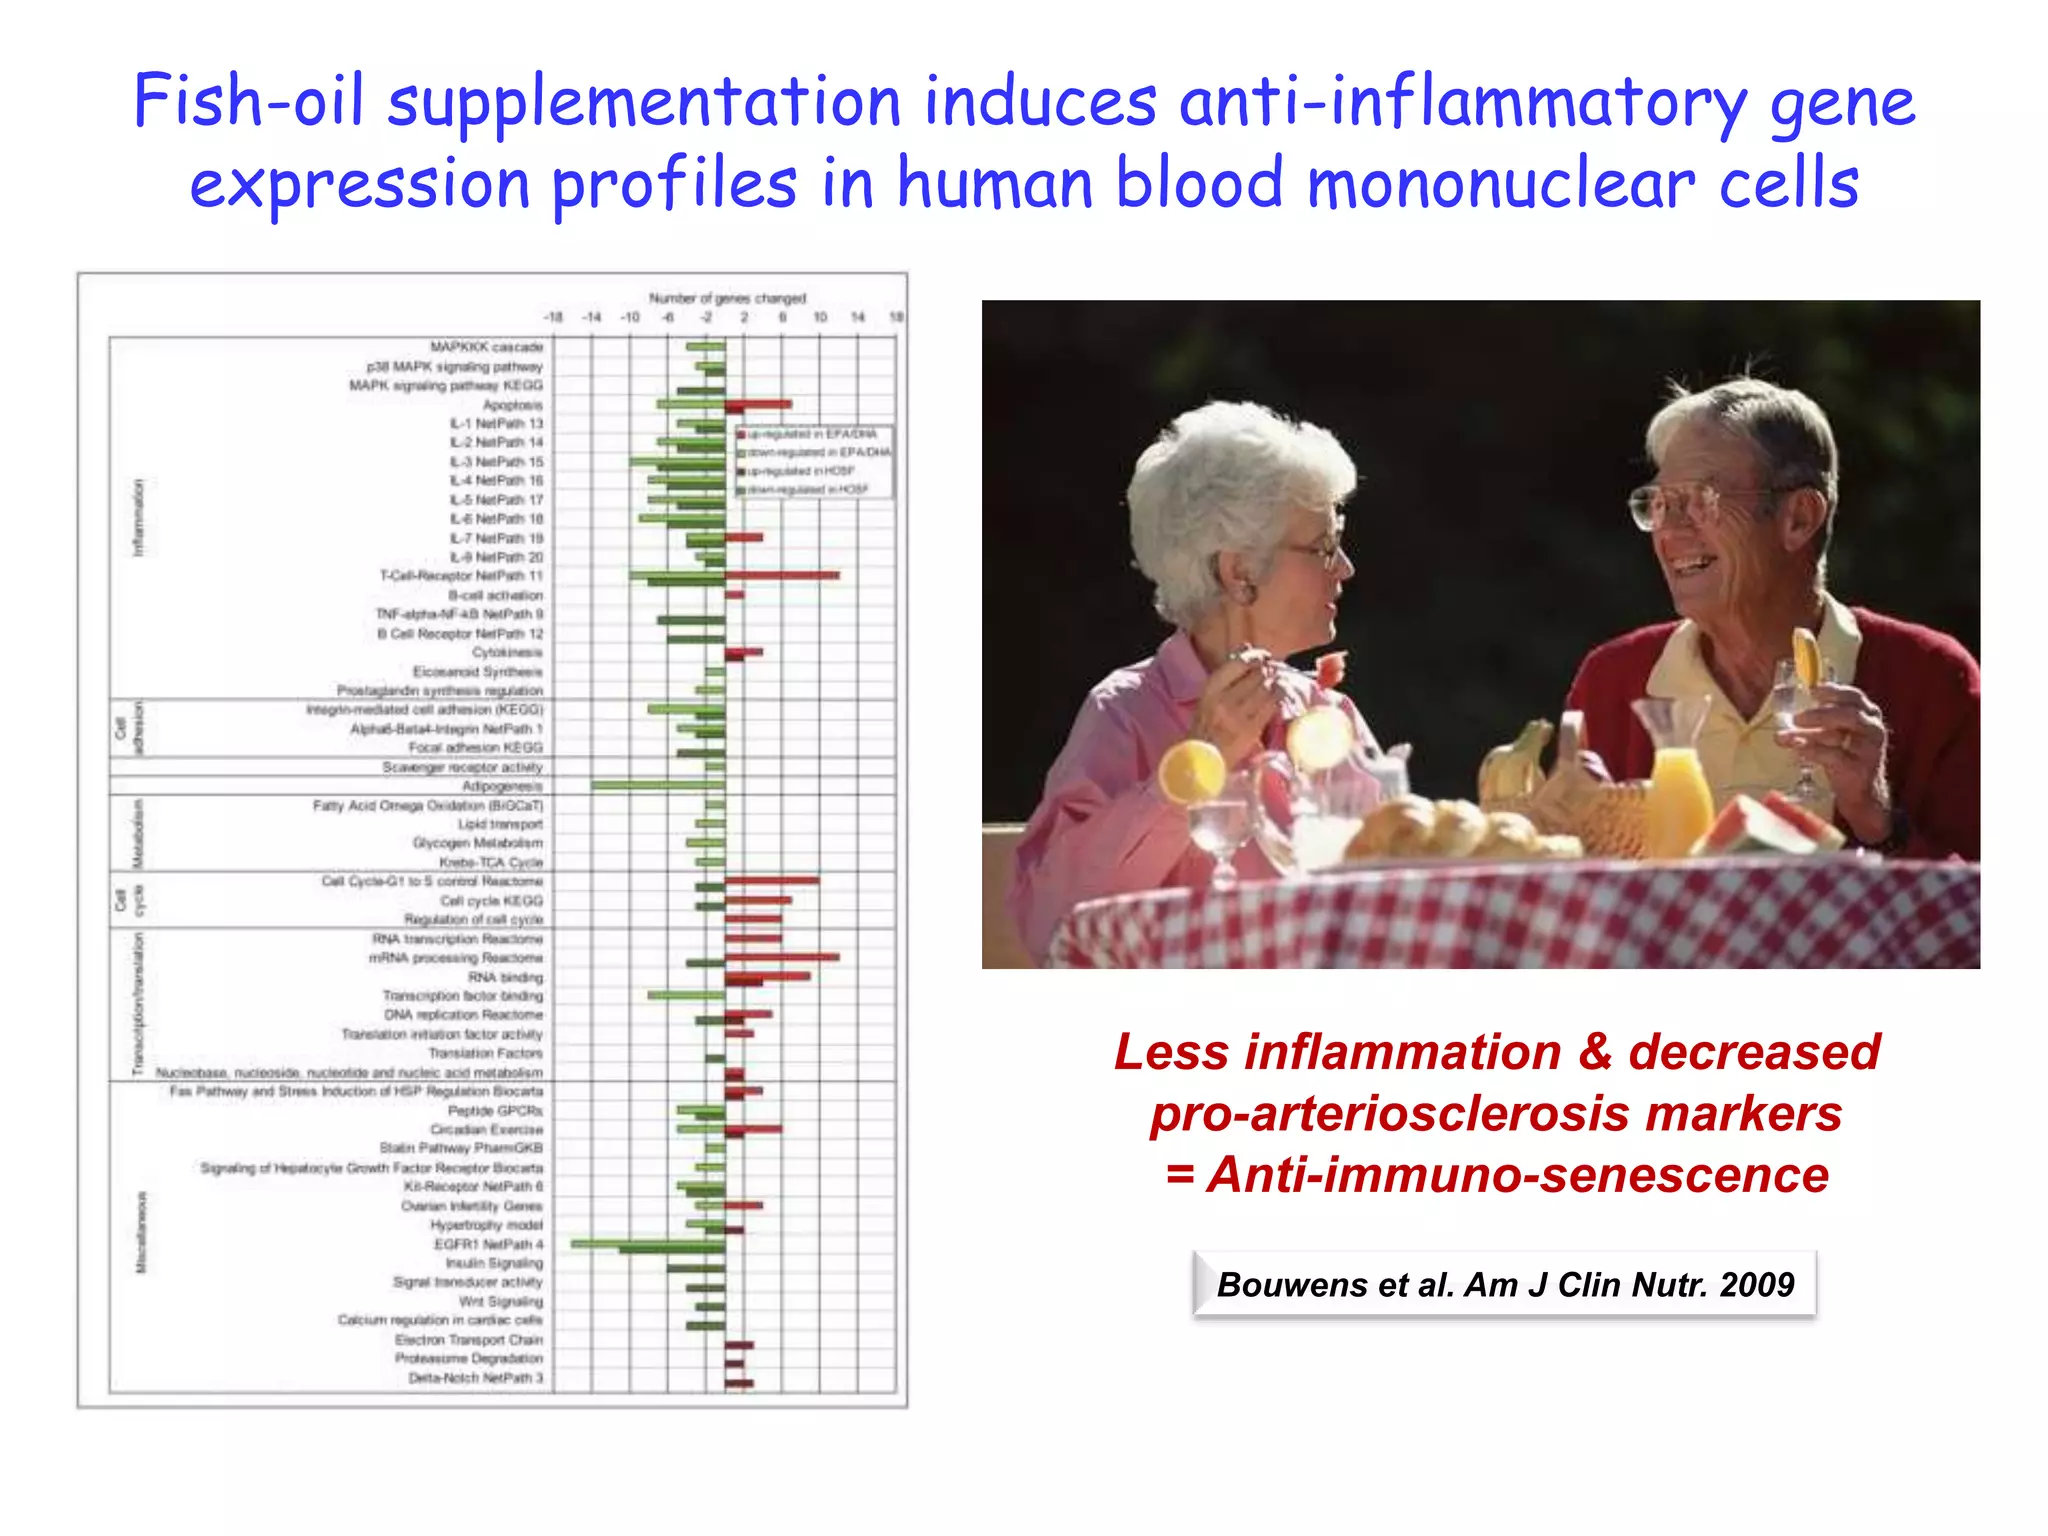
Nutrigenomics of the two hits: non-resolving
  metabolic and pro-inflammatory stress

                 Michael Müller
                    Netherlands Nutrigenomics Centre
              & Nutrition, Metabolism and Genomics Group
           Division of Human Nutrition, Wageningen University


                      @nutrigenomics
I will not talk about
Anti-inflammatory foods
Content

 The two hits:
  Non-resolving metabolic & pro-inflammatory stress
 The liver & the two hits
 Obesity & NASH - Interaction of the white adipose
  tissue & the liver
 Too much saturated fat & macrophages
 Human Nutrigenomics examples
 Conclusions
A consideration of biomarkers to be used for evaluation of inflammation in human
           nutritional studies ILSI working group BJN 2012 submitted
The two hits
Non-resolving metabolic & proinflammatory stress


                      2003
“2 hits” in Metabolic Syndrome
Too much metabolic & inflammatory stress


                  2012
PPARa


THE LIVER & THE 2 HITS
More steatosis in mouse livers from
 PPARa -/- mice on a high fat diet


         Stienstra R, Mandard S, Patsouris D, Maass C, Kersten S, Müller M
         PPAR{alpha} protects against obesity-induced hepatic inflammation
                      Endocrinology. 2007 Jun;148(6):2753-63
PPARa controls acute phase response induced by HF diets


    Stienstra R, Mandard S, Patsouris D, Maass C, Kersten S, Müller M
    PPAR{alpha} protects against obesity-induced hepatic inflammation
                 Endocrinology. 2007 Jun;148(6):2753-63
Increased plasma levels of chemokines in
                           HF-diet fed PPARa -/- mice

                                   Wildtype                                  PPARα-/-
Chemokine               Low fat diet       High fat diet       Low fat diet       High fat diet
MCP-1 (CCL2)                  18                 29                  37                 75
Mip1α (CCL3)                 260                260                 200                 160
Mip-1β (CCL4)                 28                 12                  43                 69
MCP-3 (CCL7)                  52                 54                  52                 70
Eotaxin (CCL11)              793                780                 753                 879
MCP-5(CCL12)                  23                 22                  25                 36
Mip-1γ (CCL15)               8.6                 9.8                 14                 14
Mip-3β (CCL19)               140                110                 110                 160
MDC (CCL22) plasma (n=5) was used for determining the concentration of multiple chemokines
 Pooled mouse          82                  84                 92                   99
   (Rules Based Medicine). pg/ml plasma, except for Mip-1γ (ng/ml plasma).
Mip-2 (CXCL2)                 12                 15                  14                 18
IP-10 (CXCL10)                28                 31                  46                 109
de Wit NJ, Afman LA, Mensink M, Müller M
.     Phenotyping the effect of diet on non-
            alcoholic fatty liver disease
                  J Hepatol 2012
OBESITY & NASH
INTERACTION OF WAT & LIVER
Interaction between WAT and liver tissue
        essential for NASH/NAFLD in C57Bl/6 mice

 run-in diet                  20 weeks diet intervention                           tissue collection


      • stratification            • plasma collection                    • liver
       on body weight                                                        frozen sections: histological feat.
                                          multiple protein assays
                                                                             lipid content
                                                                             RNA extraction: Affx microarrays

                  10 LFD
-3 20 LFD                     0   2   4      8     12    16   20 weeks
                                                                                              quality control &
                  10 HFD                                                        Mouse          data analysis
   10% low                                                                     genome             pipeline
    fat diet     45% high                                                      430 2.0
  (palm oil)      fat diet
                 (palm oil)                                              • ep. white adipose tissue
                                                                             paraffin sections: histological feat.
                                                                             RNA extraction: real-time PCR
High fat diet-induced obesity
                                                 25
                                                          LFL                   HFL
                                                          LFH                   HFH
                                                 20


                                   BW gain (g)
                                                                                                        *      *

                                                 15                                           **

                                                                                          *
                                                 10                                                     *      *
                                                                                      *
                                                 5                          *


                                                 0
                                                      0                     2         4   8   12        16   20
                                                              weeks under diet intervention
                 Liver TG content                                                Hepatomegaly                                    ALT plasma activity
                200                                                         10                                                   100
                                                          Ratio LW/BW (%)


                                       ***


                                                                                                             ALT activity (UI)
mg TG/g liver


                160                                                         8                      **                                             ***
                                                                                                                                  80
                120       **                                                6                                                     60
                               *
                80                                                          4                                                     40      *   *
                40                                                          2                                                     20
                 0                                                          0                                                     0
                      LFL LFH HFL HFH
A subpopulation of mice fed HFD develops NASH
Immunohistochemical staining confirms enhanced liver
    inflammation and early fibrosis in HFH mice
                HFL          HFH


                                       Macrophage CD68


                                       Collagen


                                       Stellate cell GFAP
Upregulation of inflammatory and fibrotic
 gene expression in HFH responder mice
Adipose dysfunction in HFH mice
Change in adipose gene expression
indicate adipose tissue dysfunction
Plasma proteins as early predictive
biomarker for NASH in C57Bl/6 mice
Plasma proteins as early predictive
biomarker for NASH in C57Bl/6 mice


                  Multivariate analysis of association of
                 protein plasma concentrations with final
                         liver triglyceride content
Conclusions

• The data support the existence of a
  tight relationship between adipose
  tissue dysfunction and NASH
  pathogenesis.


             Duval et al. Diabetes 2010
How inflammation is initiated and
      developed in obesity


        Annu Rev Nutr. 2012 Mar 9.
TOO MUCH SATURATED FAT
& MACROPHAGES
Chylomicron


          CE   /TG


                           Angptl4
                     LPL


                                     CE/TG
                 FFA
                                       Chylomicron
                                       remnant
Examination of the role of Angptl4 under
      conditions of lipid overload

                                 Low fat


Angptl4 +/+                      High fat


                                 Low fat


Angptl4 -/-                      High fat
Angptl4-- mice on HFD become very ill
Systemic inflammation in Angptl4-/- mice fed HFD


                                             Angptl4+/+
                                             Angptl4-/-
Inflammatory response independent of microbiota
No effect of medium chain or PUFA TGs
Massive enlargement of mesenteric lymph
   nodes in Angptl4-/- mice fed HFD
Angptl4 protects against lipolysis and
  subsequent foam cell formation
Angptl4 protects against lipolysis and
  subsequent foam cell formation
Conclusion

• A high saturated fat diet causes massive inflammation in
  Angptl4-/- mice originating in mesenteric lymph nodes.
• In the absence of this protective mechanism, feeding a
  diet rich in saturated fat rapidly leads to enhanced lipid
  uptake into MLN-resident macrophages, triggering foam
  cell formation and a massive inflammatory response.


                       Lichtenstein et al. Cell Metab. 2010
Nutritional regulation of immune capacity


              Veldhoen M, Brucklacher-Waldert V.
            Dietary influences on intestinal immunity.
            Nat Rev Immunol. 2012; 12 (10):696-708
Human study:
        Plasma Protein Profiling Reveals
  Protein Clusters Related to BMI and Insulin
  Levels in Middle-Aged Overweight Subjects


  AIM
• Associate plasma protein profiles with BMI
• Identify potential marker profile of early
  disease state

              . PLoS One. 2010 Dec 23;5(12):e14422
We are different
“Personal” systemic inflammatory states


            .PLoS One. 2010 Dec 23;5(12):e14422
Human nutrigenomics study
Dietary fat and inflammation in adipose tissue


                                                                      ?
                                                                               Change in
                                                                                 diet
                                                                              composition


                                                                     Van Dijk et al. AJCN 2009
     de Luca, C and Olefsky JM, Nature Medicine 12, 41 - 42 (2006)
Design of the SFA vs MUFA-rich
                 intervention study
T=0 wks          T=2 wks                                             T=10 wks

     Run-in                   SFA-rich diet (n=10)
  SFA-rich diet
    (n=20)
                            MUFA-rich diet (n=10)

          Baseline                                        After intervention
          - Clamp                                         - Clamp
          - Adipose tissue biopsy                         - Adipose tissue biopsy
          - Blood sampling                                - Blood sampling


                              Van Dijk et al. AJCN 2009
“Obese-linked” pro-inflammatory
gene expression profile by saturated fat
SFA diet   MUFA diet

                       • The SFA-rich diet:
                       • Induces a pro-
                         inflammatory obese-linked
                         gene expression profile
                       • Decreases expression and
                         plasma level of the anti-
                         inflammatory cytokine
                         adiponectin
                       • “Personal Transcriptomes”

                           Van Dijk et al. AJCN 2009
Fish-oil supplementation induces anti-inflammatory gene
  expression profiles in human blood mononuclear cells


                              Less inflammation & decreased
                               pro-arteriosclerosis markers
                                = Anti-immuno-senescence

                                 Bouwens et al. Am J Clin Nutr. 2009
General conclusions
• (Over)nutrition and inflammation are intimately linked =>
  non-resolving metabolic and pro-inflammatory stress (the
  two hits).
• It will be essential to get a better understanding of the very
  early events that lead to non-resolving organ inflammation
  and the precise role of nutrition (causal or preventive) in
  this pathophysiological development.
• We need biomarkers specifically for organ function (“2 hit
  state”) to be able to specifically target and modulate.
• The challenge will be the translation of the findings from
  mice studies to the human situation (“individual” health).
Sander Kersten
Rinke Stienstra
Lydia Afman
Guido Hooiveld
Mark Boekschoten
Laetitia Lichtenstein
Caroline Duval
& NMG group

Christian Trautwein
Folkert Kuipers
Ben van Ommen
& many more

Nutrigenomics of the two hits: non-resolving metabolic and pro-inflammatory stress

  • 1.
    Nutrigenomics of thetwo hits: non-resolving metabolic and pro-inflammatory stress Michael Müller Netherlands Nutrigenomics Centre & Nutrition, Metabolism and Genomics Group Division of Human Nutrition, Wageningen University @nutrigenomics
  • 2.
    I will nottalk about Anti-inflammatory foods
  • 3.
    Content  The twohits: Non-resolving metabolic & pro-inflammatory stress  The liver & the two hits  Obesity & NASH - Interaction of the white adipose tissue & the liver  Too much saturated fat & macrophages  Human Nutrigenomics examples  Conclusions
  • 4.
    A consideration ofbiomarkers to be used for evaluation of inflammation in human nutritional studies ILSI working group BJN 2012 submitted
  • 5.
    The two hits Non-resolvingmetabolic & proinflammatory stress 2003
  • 6.
    “2 hits” inMetabolic Syndrome Too much metabolic & inflammatory stress 2012
  • 7.
  • 8.
    More steatosis inmouse livers from PPARa -/- mice on a high fat diet Stienstra R, Mandard S, Patsouris D, Maass C, Kersten S, Müller M PPAR{alpha} protects against obesity-induced hepatic inflammation Endocrinology. 2007 Jun;148(6):2753-63
  • 9.
    PPARa controls acutephase response induced by HF diets Stienstra R, Mandard S, Patsouris D, Maass C, Kersten S, Müller M PPAR{alpha} protects against obesity-induced hepatic inflammation Endocrinology. 2007 Jun;148(6):2753-63
  • 10.
    Increased plasma levelsof chemokines in HF-diet fed PPARa -/- mice Wildtype PPARα-/- Chemokine Low fat diet High fat diet Low fat diet High fat diet MCP-1 (CCL2) 18 29 37 75 Mip1α (CCL3) 260 260 200 160 Mip-1β (CCL4) 28 12 43 69 MCP-3 (CCL7) 52 54 52 70 Eotaxin (CCL11) 793 780 753 879 MCP-5(CCL12) 23 22 25 36 Mip-1γ (CCL15) 8.6 9.8 14 14 Mip-3β (CCL19) 140 110 110 160 MDC (CCL22) plasma (n=5) was used for determining the concentration of multiple chemokines Pooled mouse 82 84 92 99 (Rules Based Medicine). pg/ml plasma, except for Mip-1γ (ng/ml plasma). Mip-2 (CXCL2) 12 15 14 18 IP-10 (CXCL10) 28 31 46 109
  • 11.
    de Wit NJ,Afman LA, Mensink M, Müller M . Phenotyping the effect of diet on non- alcoholic fatty liver disease J Hepatol 2012
  • 12.
  • 13.
    Interaction between WATand liver tissue essential for NASH/NAFLD in C57Bl/6 mice run-in diet 20 weeks diet intervention tissue collection • stratification • plasma collection • liver on body weight frozen sections: histological feat. multiple protein assays lipid content RNA extraction: Affx microarrays 10 LFD -3 20 LFD 0 2 4 8 12 16 20 weeks quality control & 10 HFD Mouse data analysis 10% low genome pipeline fat diet 45% high 430 2.0 (palm oil) fat diet (palm oil) • ep. white adipose tissue paraffin sections: histological feat. RNA extraction: real-time PCR
  • 14.
    High fat diet-inducedobesity 25 LFL HFL LFH HFH 20 BW gain (g) * * 15 ** * 10 * * * 5 * 0 0 2 4 8 12 16 20 weeks under diet intervention Liver TG content Hepatomegaly ALT plasma activity 200 10 100 Ratio LW/BW (%) *** ALT activity (UI) mg TG/g liver 160 8 ** *** 80 120 ** 6 60 * 80 4 40 * * 40 2 20 0 0 0 LFL LFH HFL HFH
  • 15.
    A subpopulation ofmice fed HFD develops NASH
  • 16.
    Immunohistochemical staining confirmsenhanced liver inflammation and early fibrosis in HFH mice HFL HFH Macrophage CD68 Collagen Stellate cell GFAP
  • 17.
    Upregulation of inflammatoryand fibrotic gene expression in HFH responder mice
  • 18.
  • 19.
    Change in adiposegene expression indicate adipose tissue dysfunction
  • 20.
    Plasma proteins asearly predictive biomarker for NASH in C57Bl/6 mice
  • 21.
    Plasma proteins asearly predictive biomarker for NASH in C57Bl/6 mice Multivariate analysis of association of protein plasma concentrations with final liver triglyceride content
  • 22.
    Conclusions • The datasupport the existence of a tight relationship between adipose tissue dysfunction and NASH pathogenesis. Duval et al. Diabetes 2010
  • 23.
    How inflammation isinitiated and developed in obesity Annu Rev Nutr. 2012 Mar 9.
  • 24.
    TOO MUCH SATURATEDFAT & MACROPHAGES
  • 25.
    Chylomicron CE /TG Angptl4 LPL CE/TG FFA Chylomicron remnant
  • 26.
    Examination of therole of Angptl4 under conditions of lipid overload Low fat Angptl4 +/+ High fat Low fat Angptl4 -/- High fat
  • 27.
    Angptl4-- mice onHFD become very ill
  • 28.
    Systemic inflammation inAngptl4-/- mice fed HFD Angptl4+/+ Angptl4-/-
  • 29.
  • 30.
    No effect ofmedium chain or PUFA TGs
  • 31.
    Massive enlargement ofmesenteric lymph nodes in Angptl4-/- mice fed HFD
  • 32.
    Angptl4 protects againstlipolysis and subsequent foam cell formation
  • 33.
    Angptl4 protects againstlipolysis and subsequent foam cell formation
  • 34.
    Conclusion • A highsaturated fat diet causes massive inflammation in Angptl4-/- mice originating in mesenteric lymph nodes. • In the absence of this protective mechanism, feeding a diet rich in saturated fat rapidly leads to enhanced lipid uptake into MLN-resident macrophages, triggering foam cell formation and a massive inflammatory response. Lichtenstein et al. Cell Metab. 2010
  • 35.
    Nutritional regulation ofimmune capacity Veldhoen M, Brucklacher-Waldert V. Dietary influences on intestinal immunity. Nat Rev Immunol. 2012; 12 (10):696-708
  • 36.
    Human study: Plasma Protein Profiling Reveals Protein Clusters Related to BMI and Insulin Levels in Middle-Aged Overweight Subjects AIM • Associate plasma protein profiles with BMI • Identify potential marker profile of early disease state . PLoS One. 2010 Dec 23;5(12):e14422
  • 37.
    We are different “Personal”systemic inflammatory states .PLoS One. 2010 Dec 23;5(12):e14422
  • 39.
    Human nutrigenomics study Dietaryfat and inflammation in adipose tissue ? Change in diet composition Van Dijk et al. AJCN 2009 de Luca, C and Olefsky JM, Nature Medicine 12, 41 - 42 (2006)
  • 40.
    Design of theSFA vs MUFA-rich intervention study T=0 wks T=2 wks T=10 wks Run-in SFA-rich diet (n=10) SFA-rich diet (n=20) MUFA-rich diet (n=10) Baseline After intervention - Clamp - Clamp - Adipose tissue biopsy - Adipose tissue biopsy - Blood sampling - Blood sampling Van Dijk et al. AJCN 2009
  • 41.
    “Obese-linked” pro-inflammatory gene expressionprofile by saturated fat SFA diet MUFA diet • The SFA-rich diet: • Induces a pro- inflammatory obese-linked gene expression profile • Decreases expression and plasma level of the anti- inflammatory cytokine adiponectin • “Personal Transcriptomes” Van Dijk et al. AJCN 2009
  • 42.
    Fish-oil supplementation inducesanti-inflammatory gene expression profiles in human blood mononuclear cells Less inflammation & decreased pro-arteriosclerosis markers = Anti-immuno-senescence Bouwens et al. Am J Clin Nutr. 2009
  • 43.
    General conclusions • (Over)nutritionand inflammation are intimately linked => non-resolving metabolic and pro-inflammatory stress (the two hits). • It will be essential to get a better understanding of the very early events that lead to non-resolving organ inflammation and the precise role of nutrition (causal or preventive) in this pathophysiological development. • We need biomarkers specifically for organ function (“2 hit state”) to be able to specifically target and modulate. • The challenge will be the translation of the findings from mice studies to the human situation (“individual” health).
  • 44.
    Sander Kersten Rinke Stienstra LydiaAfman Guido Hooiveld Mark Boekschoten Laetitia Lichtenstein Caroline Duval & NMG group Christian Trautwein Folkert Kuipers Ben van Ommen & many more

Editor's Notes

  • #16 A subpopulation of mice fed HFD develops NASH. Haematoxylin and eosin staining (D) and oil red O staining (E) of representative liver sections of the 4 subgroups
  • #17  (Immuno)histochemical staining confirms enhanced inflammation and early fibrosis in HFH miceImmunohistochemical staining of macrophage activation in representative liver section of HFL and HFH mice using antibody against the specific macrophagemarker Cd68Collagen staining using fast green FCF/sirius red F3B. Staining of stellate cell activation using antibody against GFAP.
  • #18 - Number of genes up- or down-regulated in the various subgroups in comparison to the LFL mice, as determined by Affymetrix GeneChip analysis. Genes with a p-value below 0.05 were considered significantly regulated. - Heat map showing changes in expression of selected genes involved in lipid metabolism, inflammation and fibrosis in liver. Changes in gene expression of selected genes as determined by real-time quantitative PCR. Mean expression in LFL mice was set at 100%. Error bars reflect standard deviation. Bars with different letters are statistically different (P<0.05 according to Student’s t-test). Number of mice per group: n=4 (LFL, HFL, HFH), n=6 (LFH).
  • #19 Haematoxylin and eosin staining of representative adipose tissue sections. Immunohistochemical staining of macrophages using antibody against Cd68. Collagen staining using fast green FCF/sirius red F3B.
  • #20 Adipose tissue mRNA expression of a selected group of genes was determined by quantitative real-time PCR after 21 weeks of dietary intervention. Mean expression in LFL mice was set at 100%. Error bars reflect standard deviation. * = significantly different from HFL mice according to Student’s t-test (P<0.05). Number of mice per group: n=4 (LFL, HFL, HFH), n=6 (LFH).
  • #21 . A) Plasma concentration of haptoglobin, TIMP-1, IL-1β, leptin and insulin were determined by multiplex assay at specific time points during the 21 weeks of dietary intervention after a 6h fast. White squares: LFL, Light grey squares: LFH, dark grey squares: HFL, black squares: HFH. Error bars reflect standard deviation. * = significantly different from HFL mice according to Student’s t-test (P<0.05). Number of mice per group: n=4 (LFL, HFL, HFH), n=6 (LFH).
  • #22 Graphs illustrating the result of multivariate analysis showing the association of protein plasma concentrations at various time points with final liver triglyceride content. Significant proteins display an inverse RSD value higher than 2 (bold line indicates the inverse RSD threshold value of 2).RSD = Relative standard deviation.