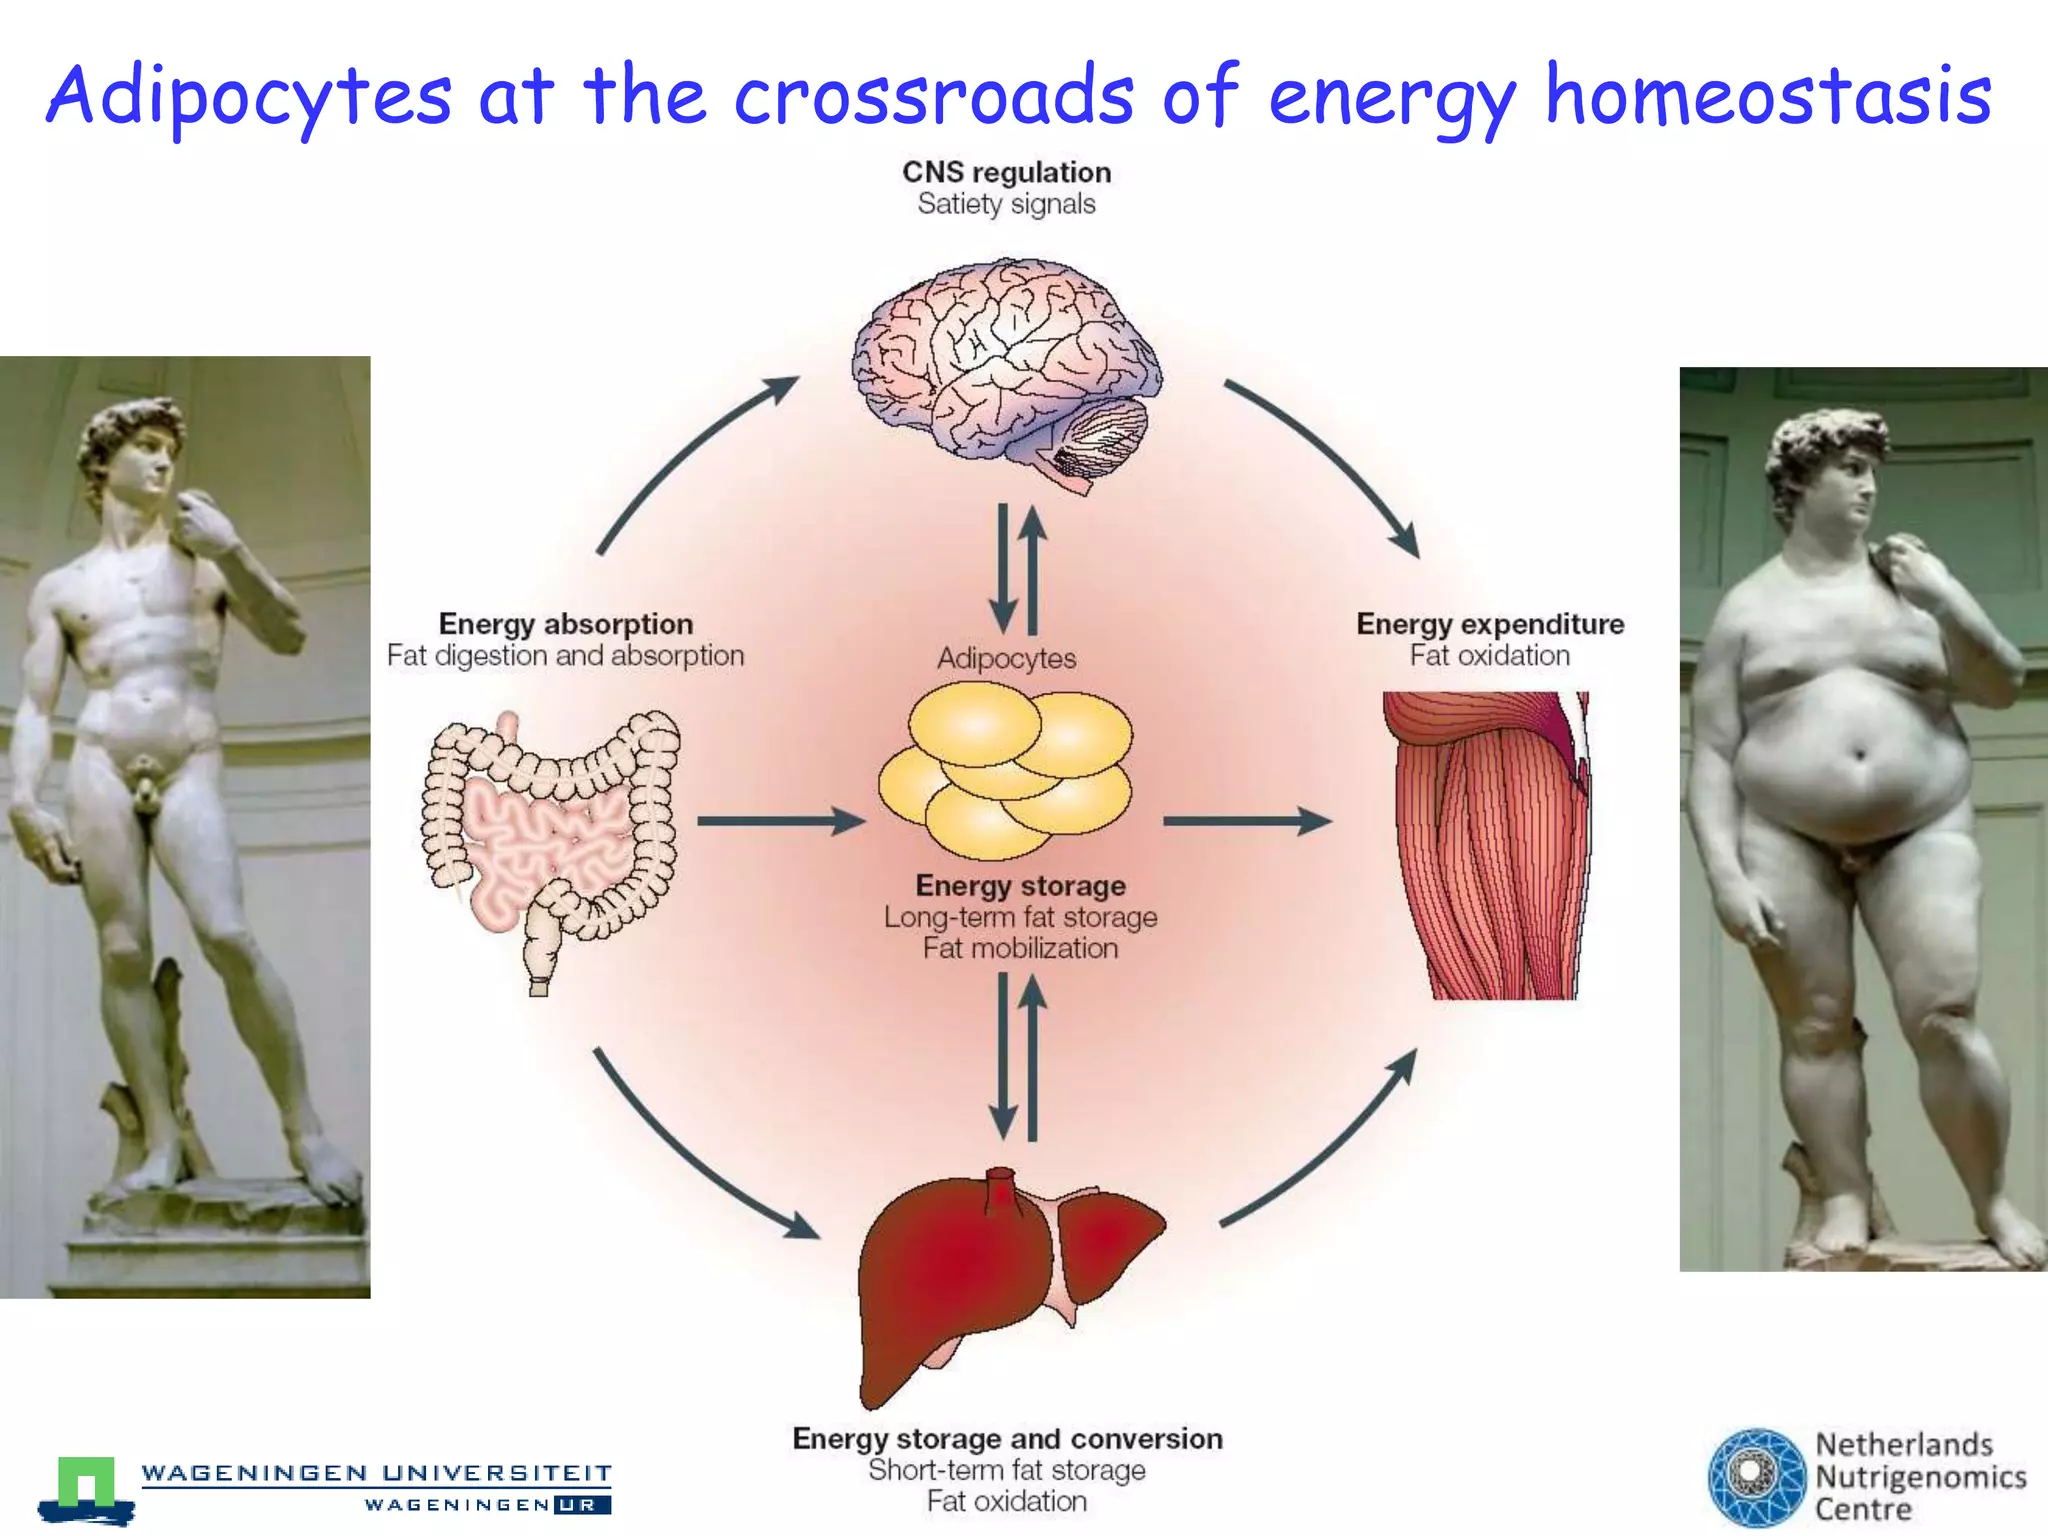
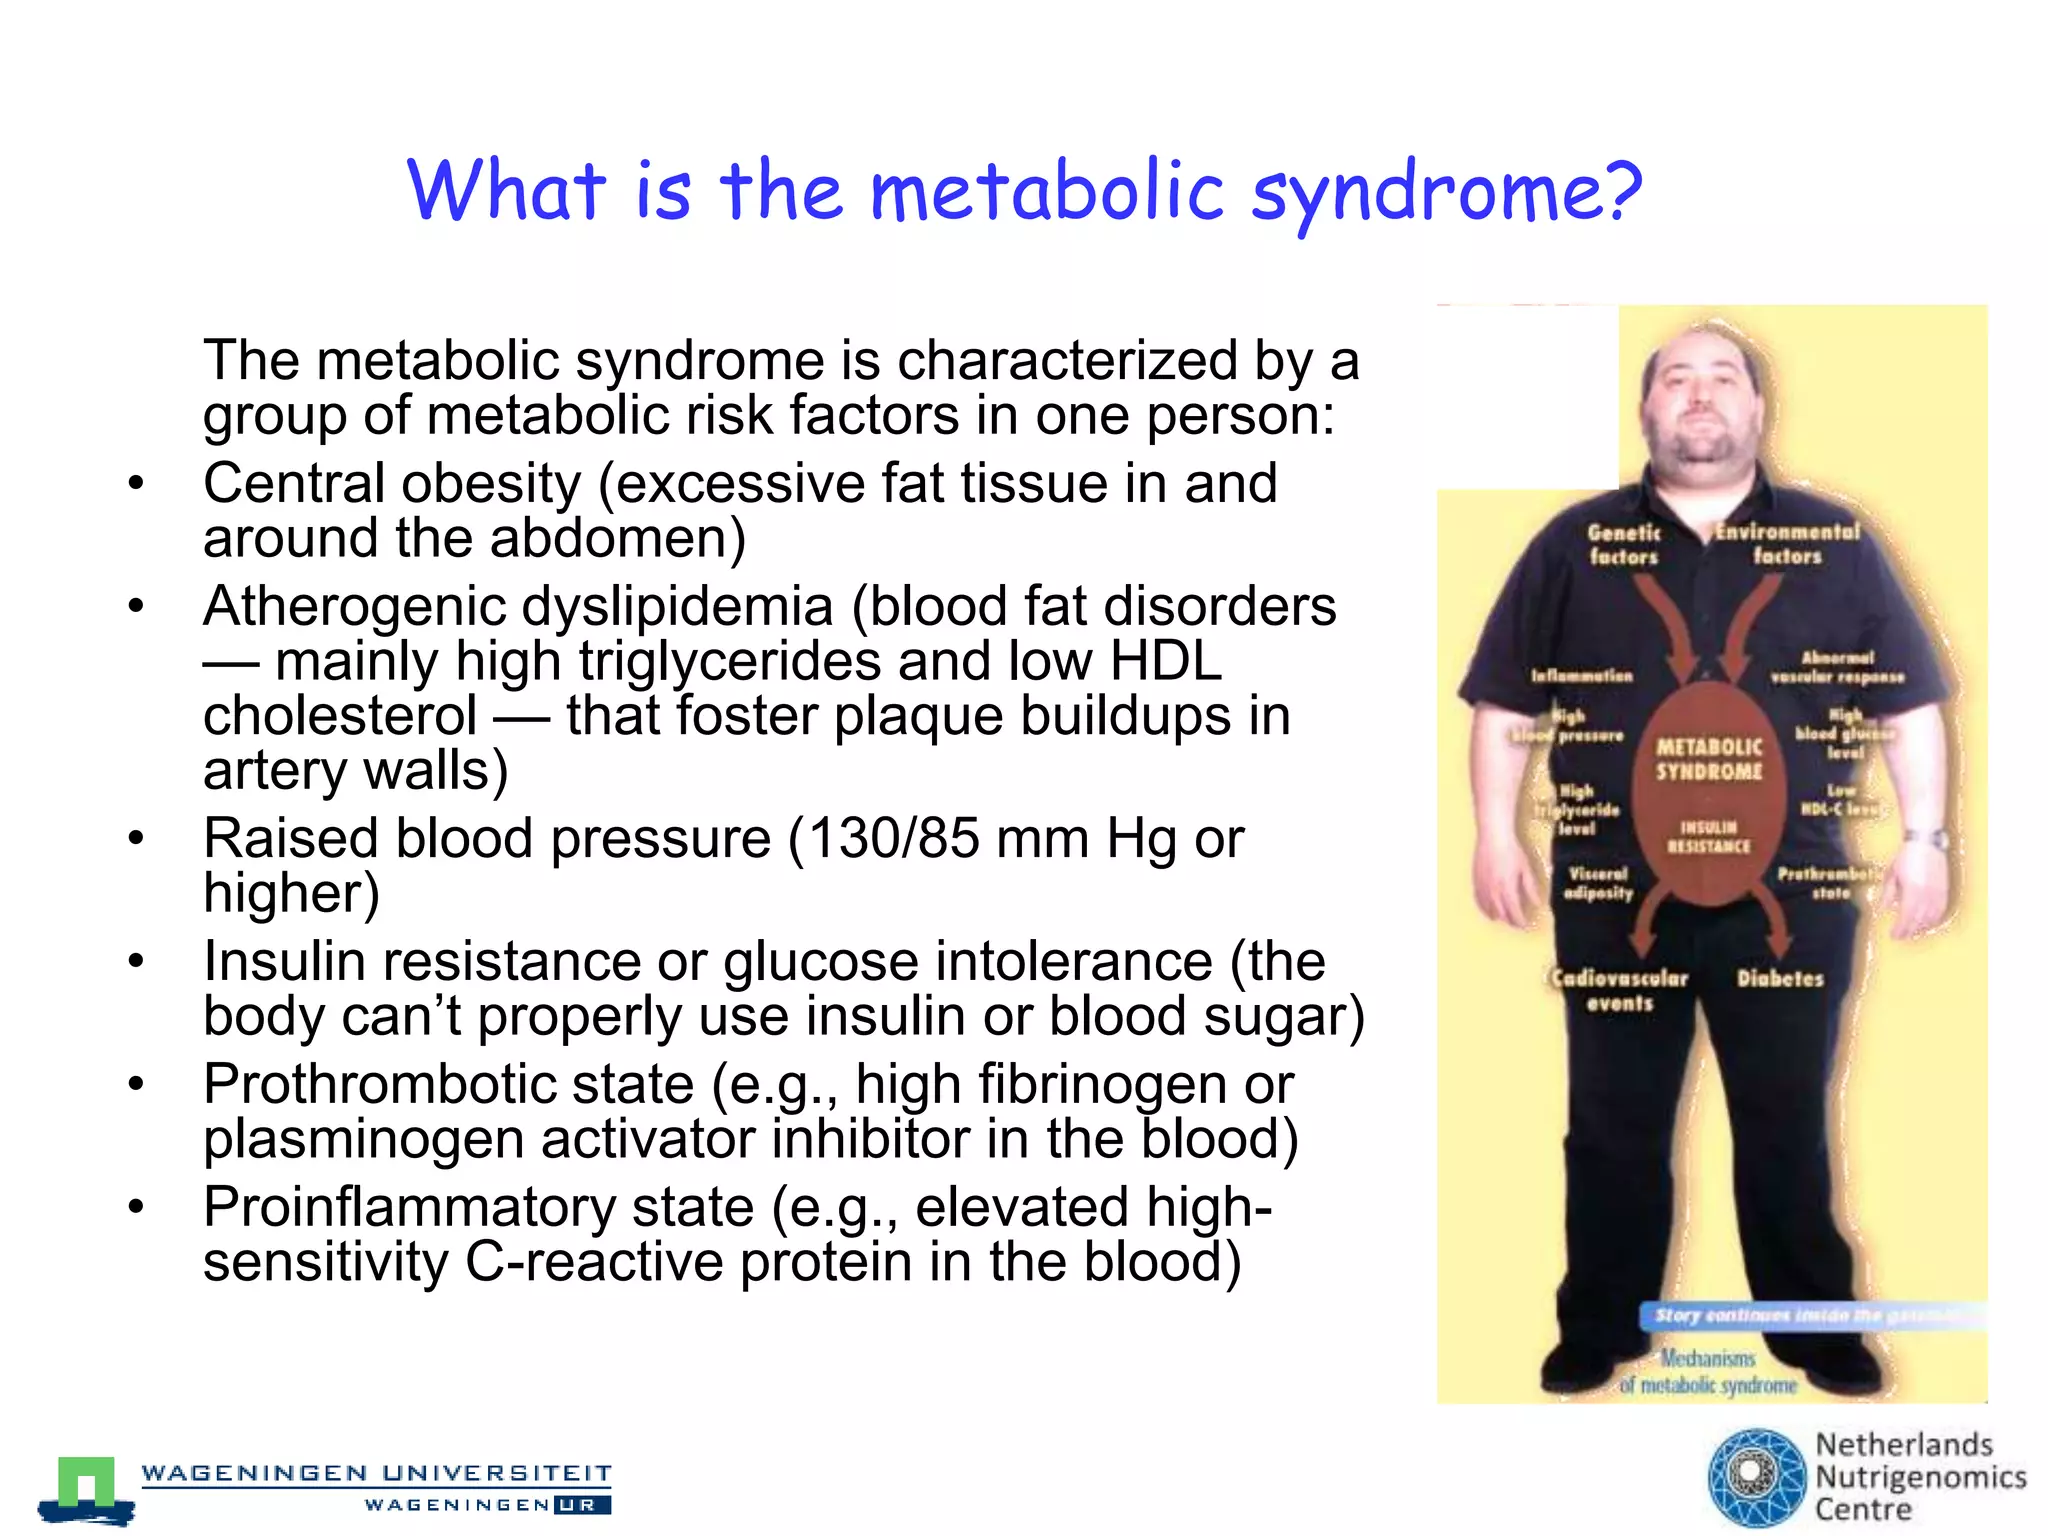
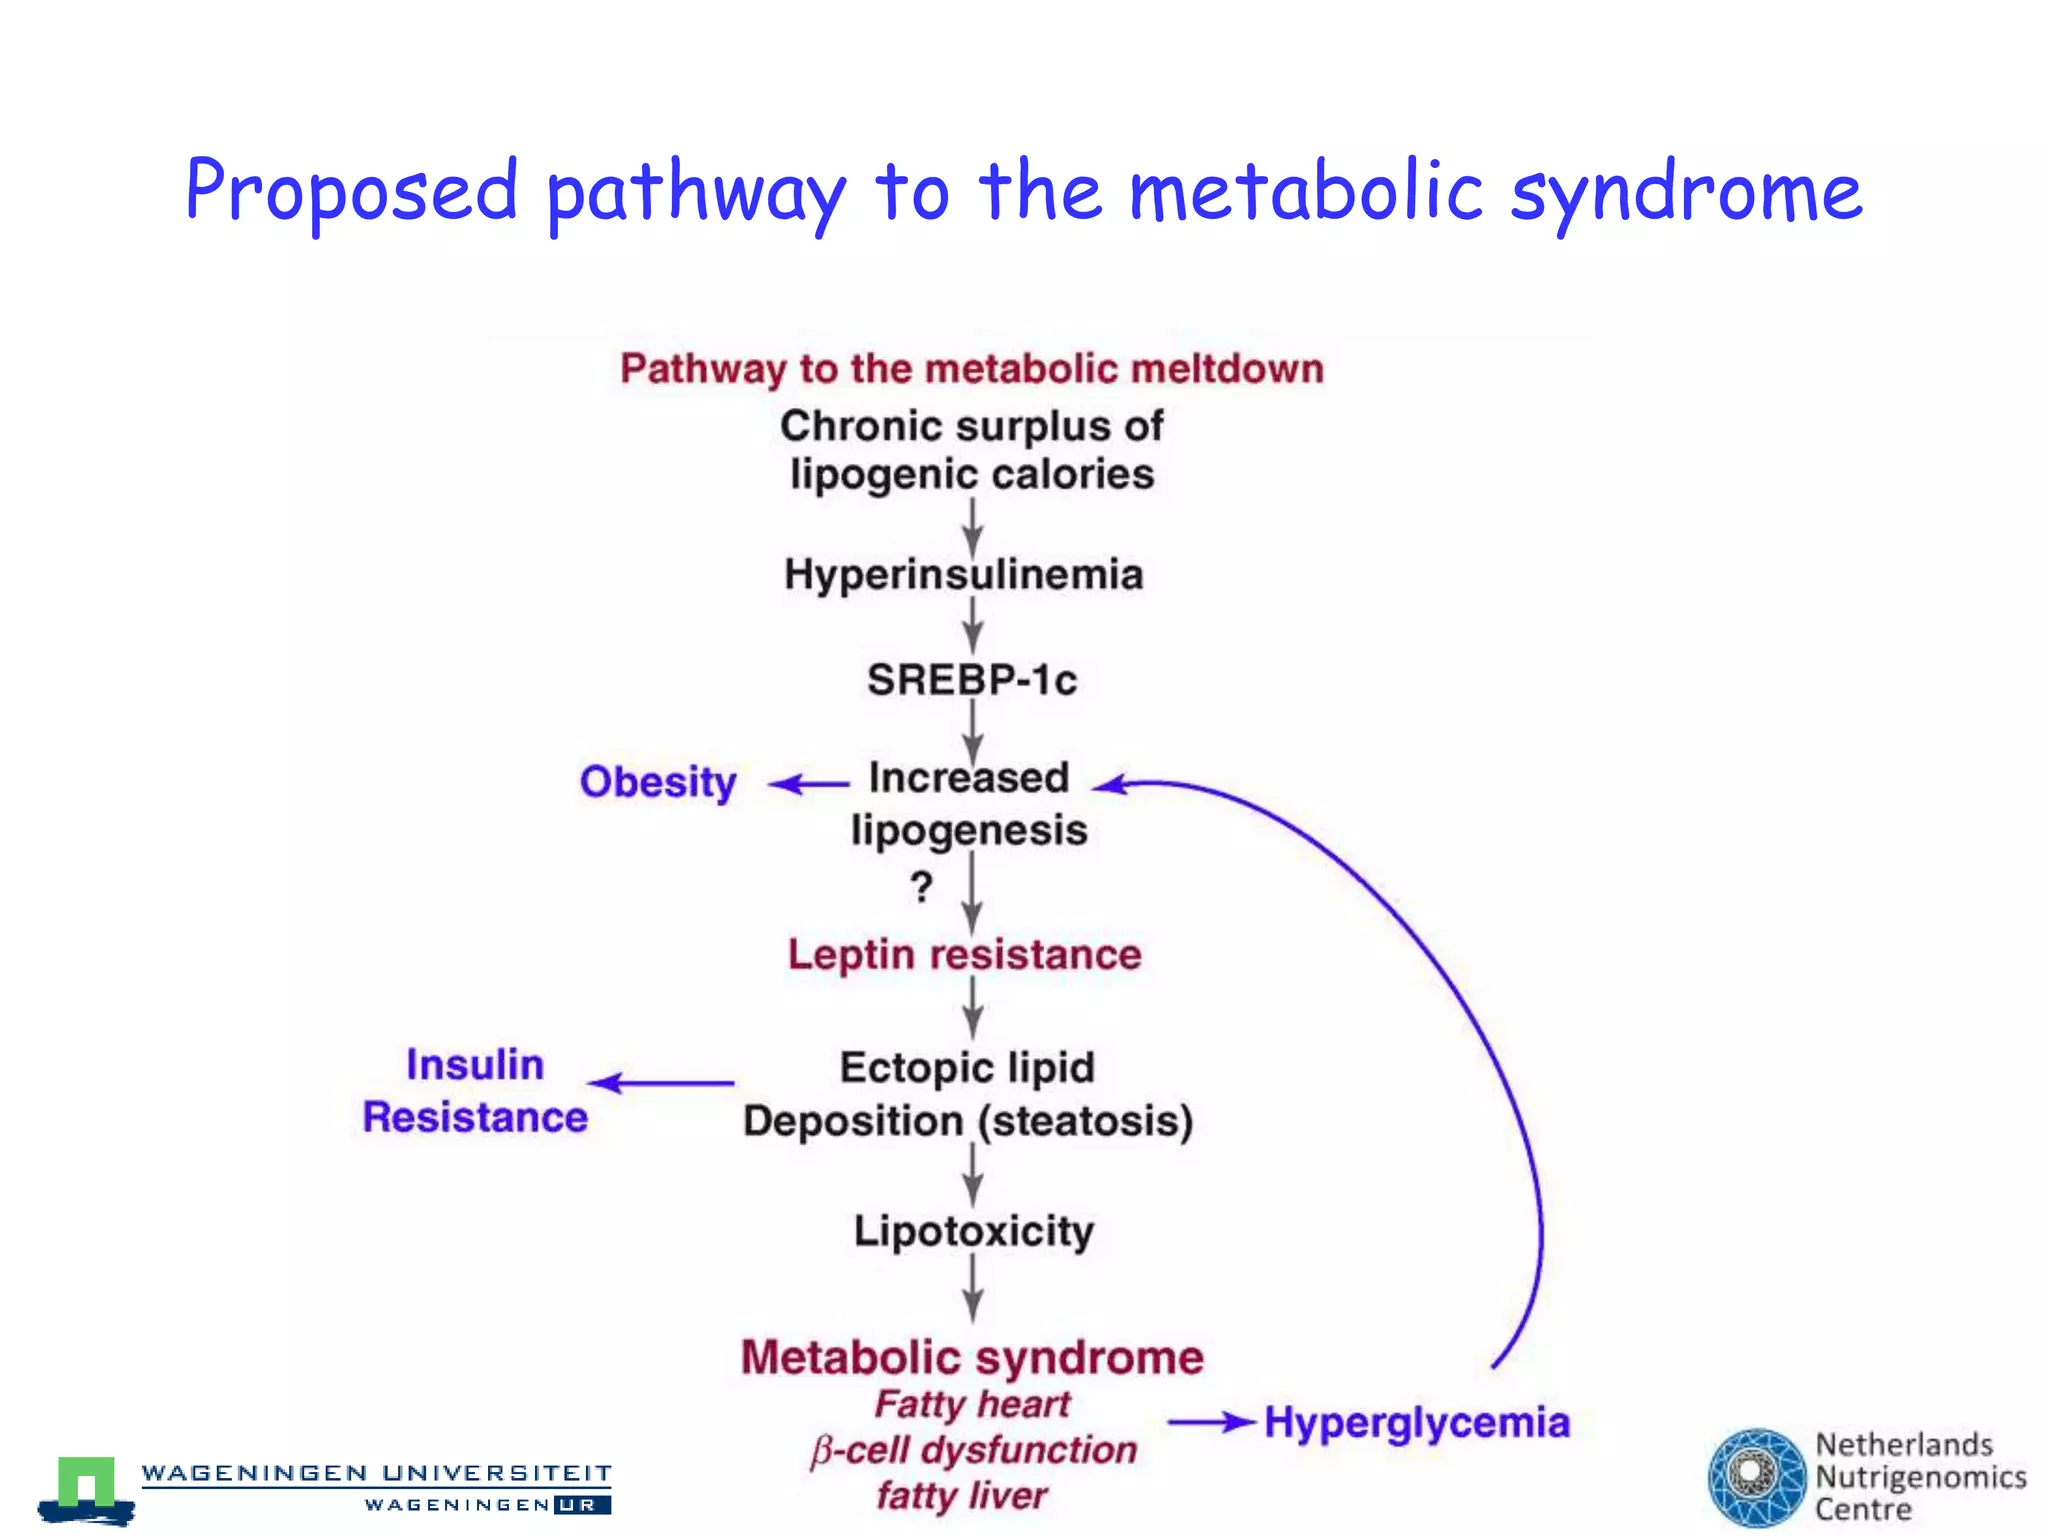
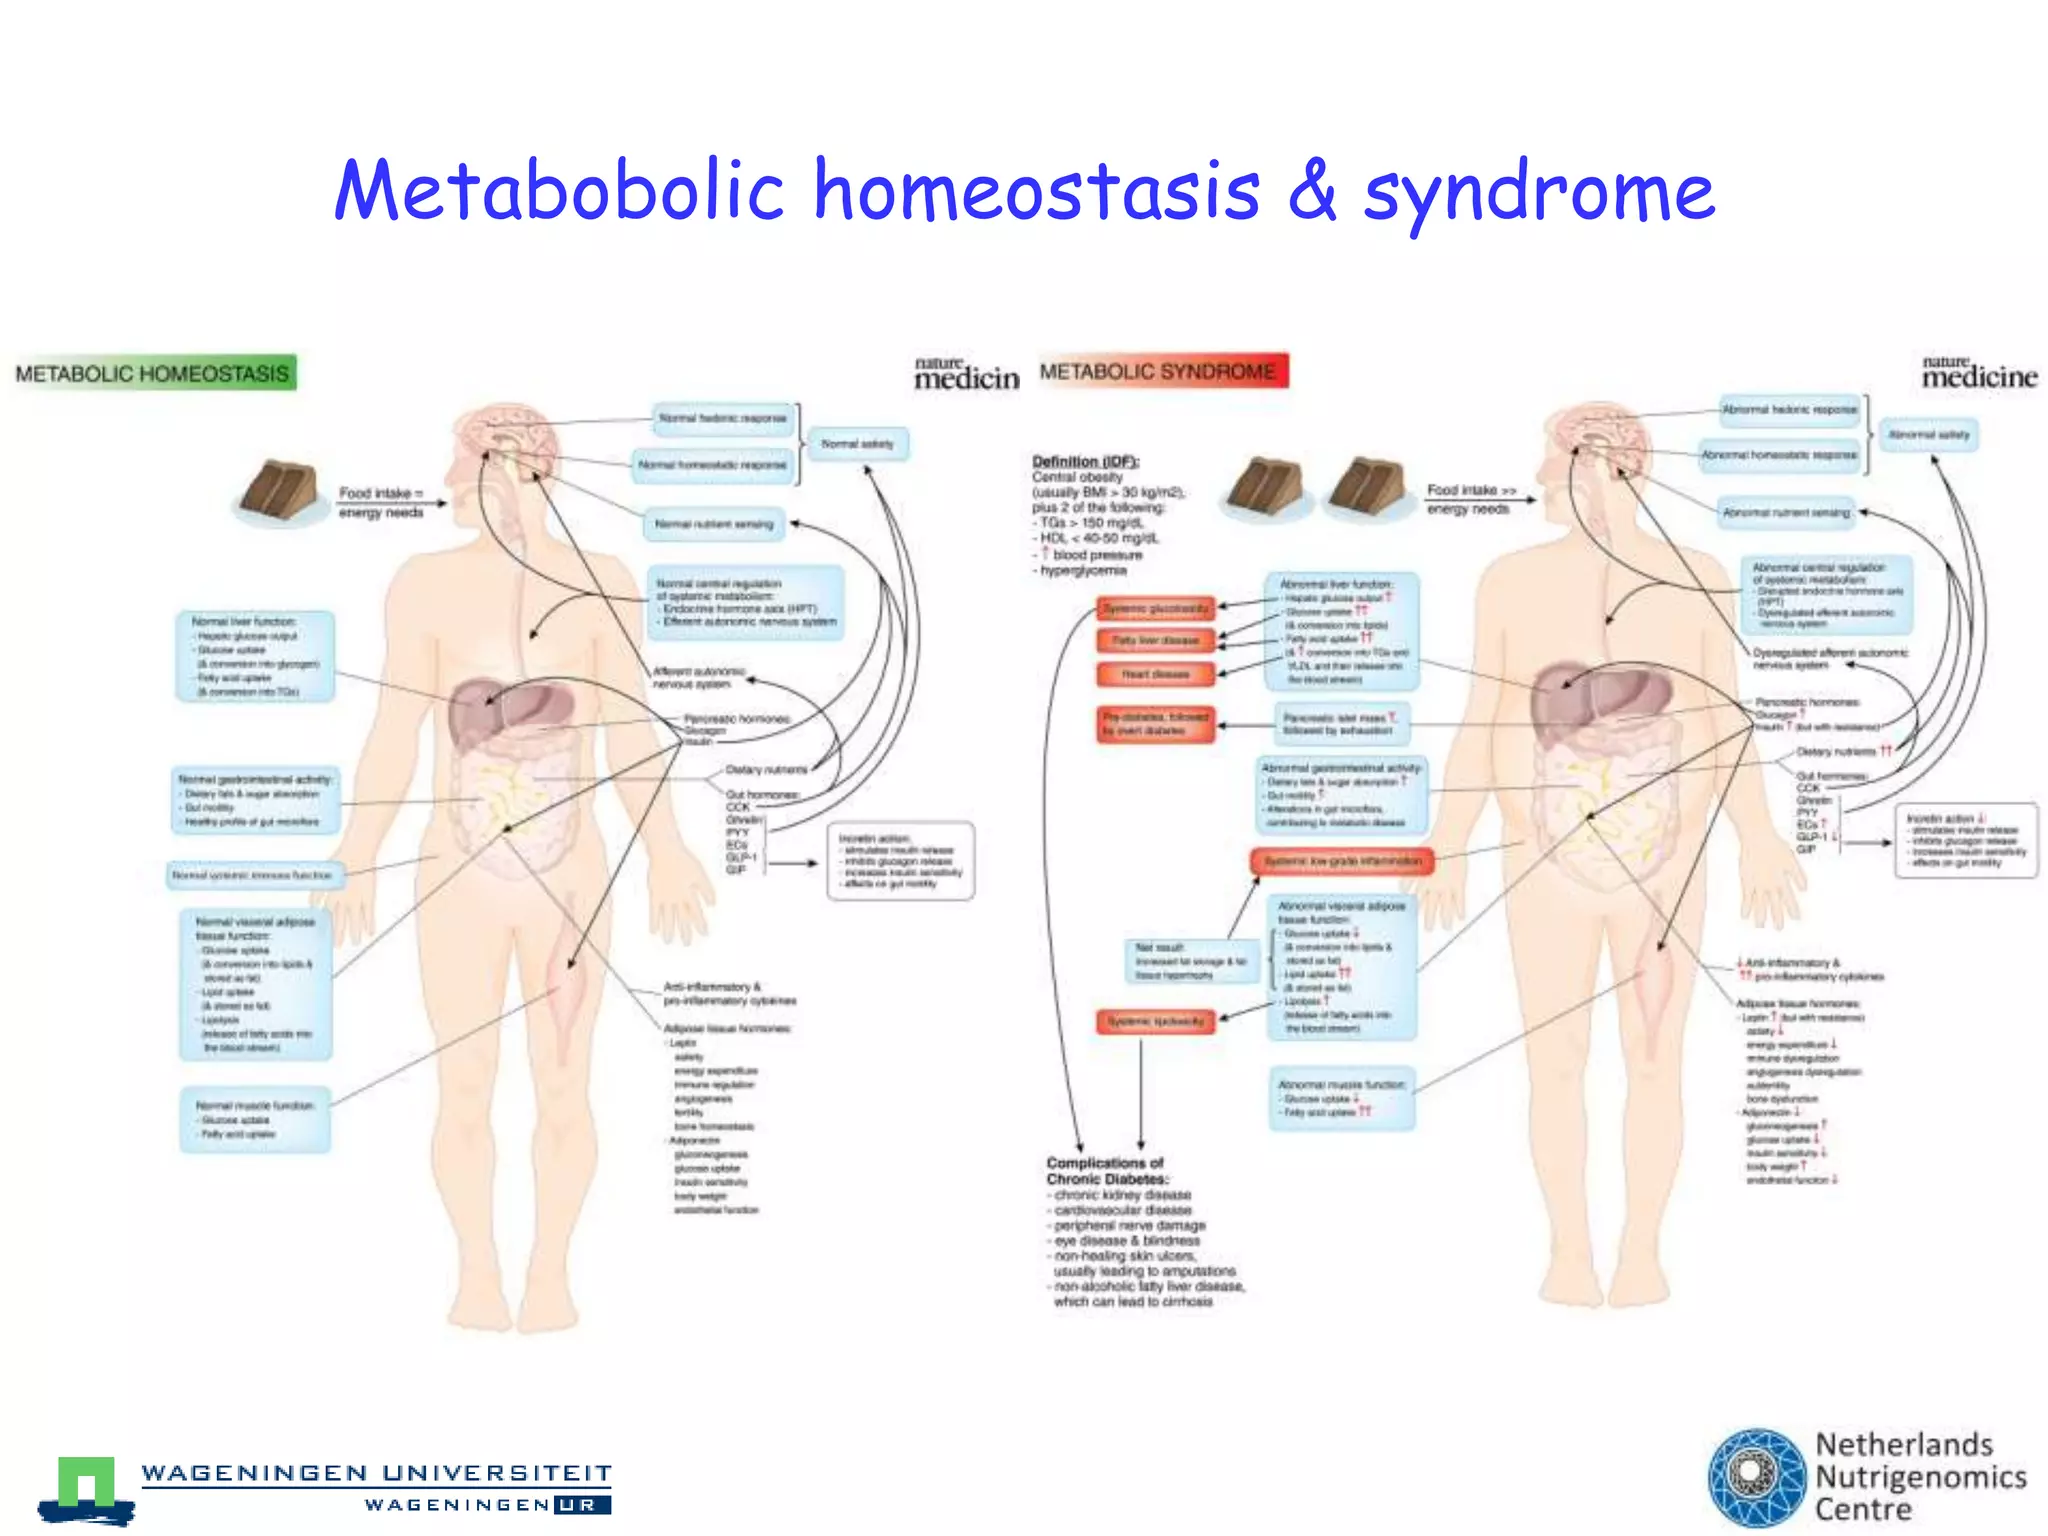
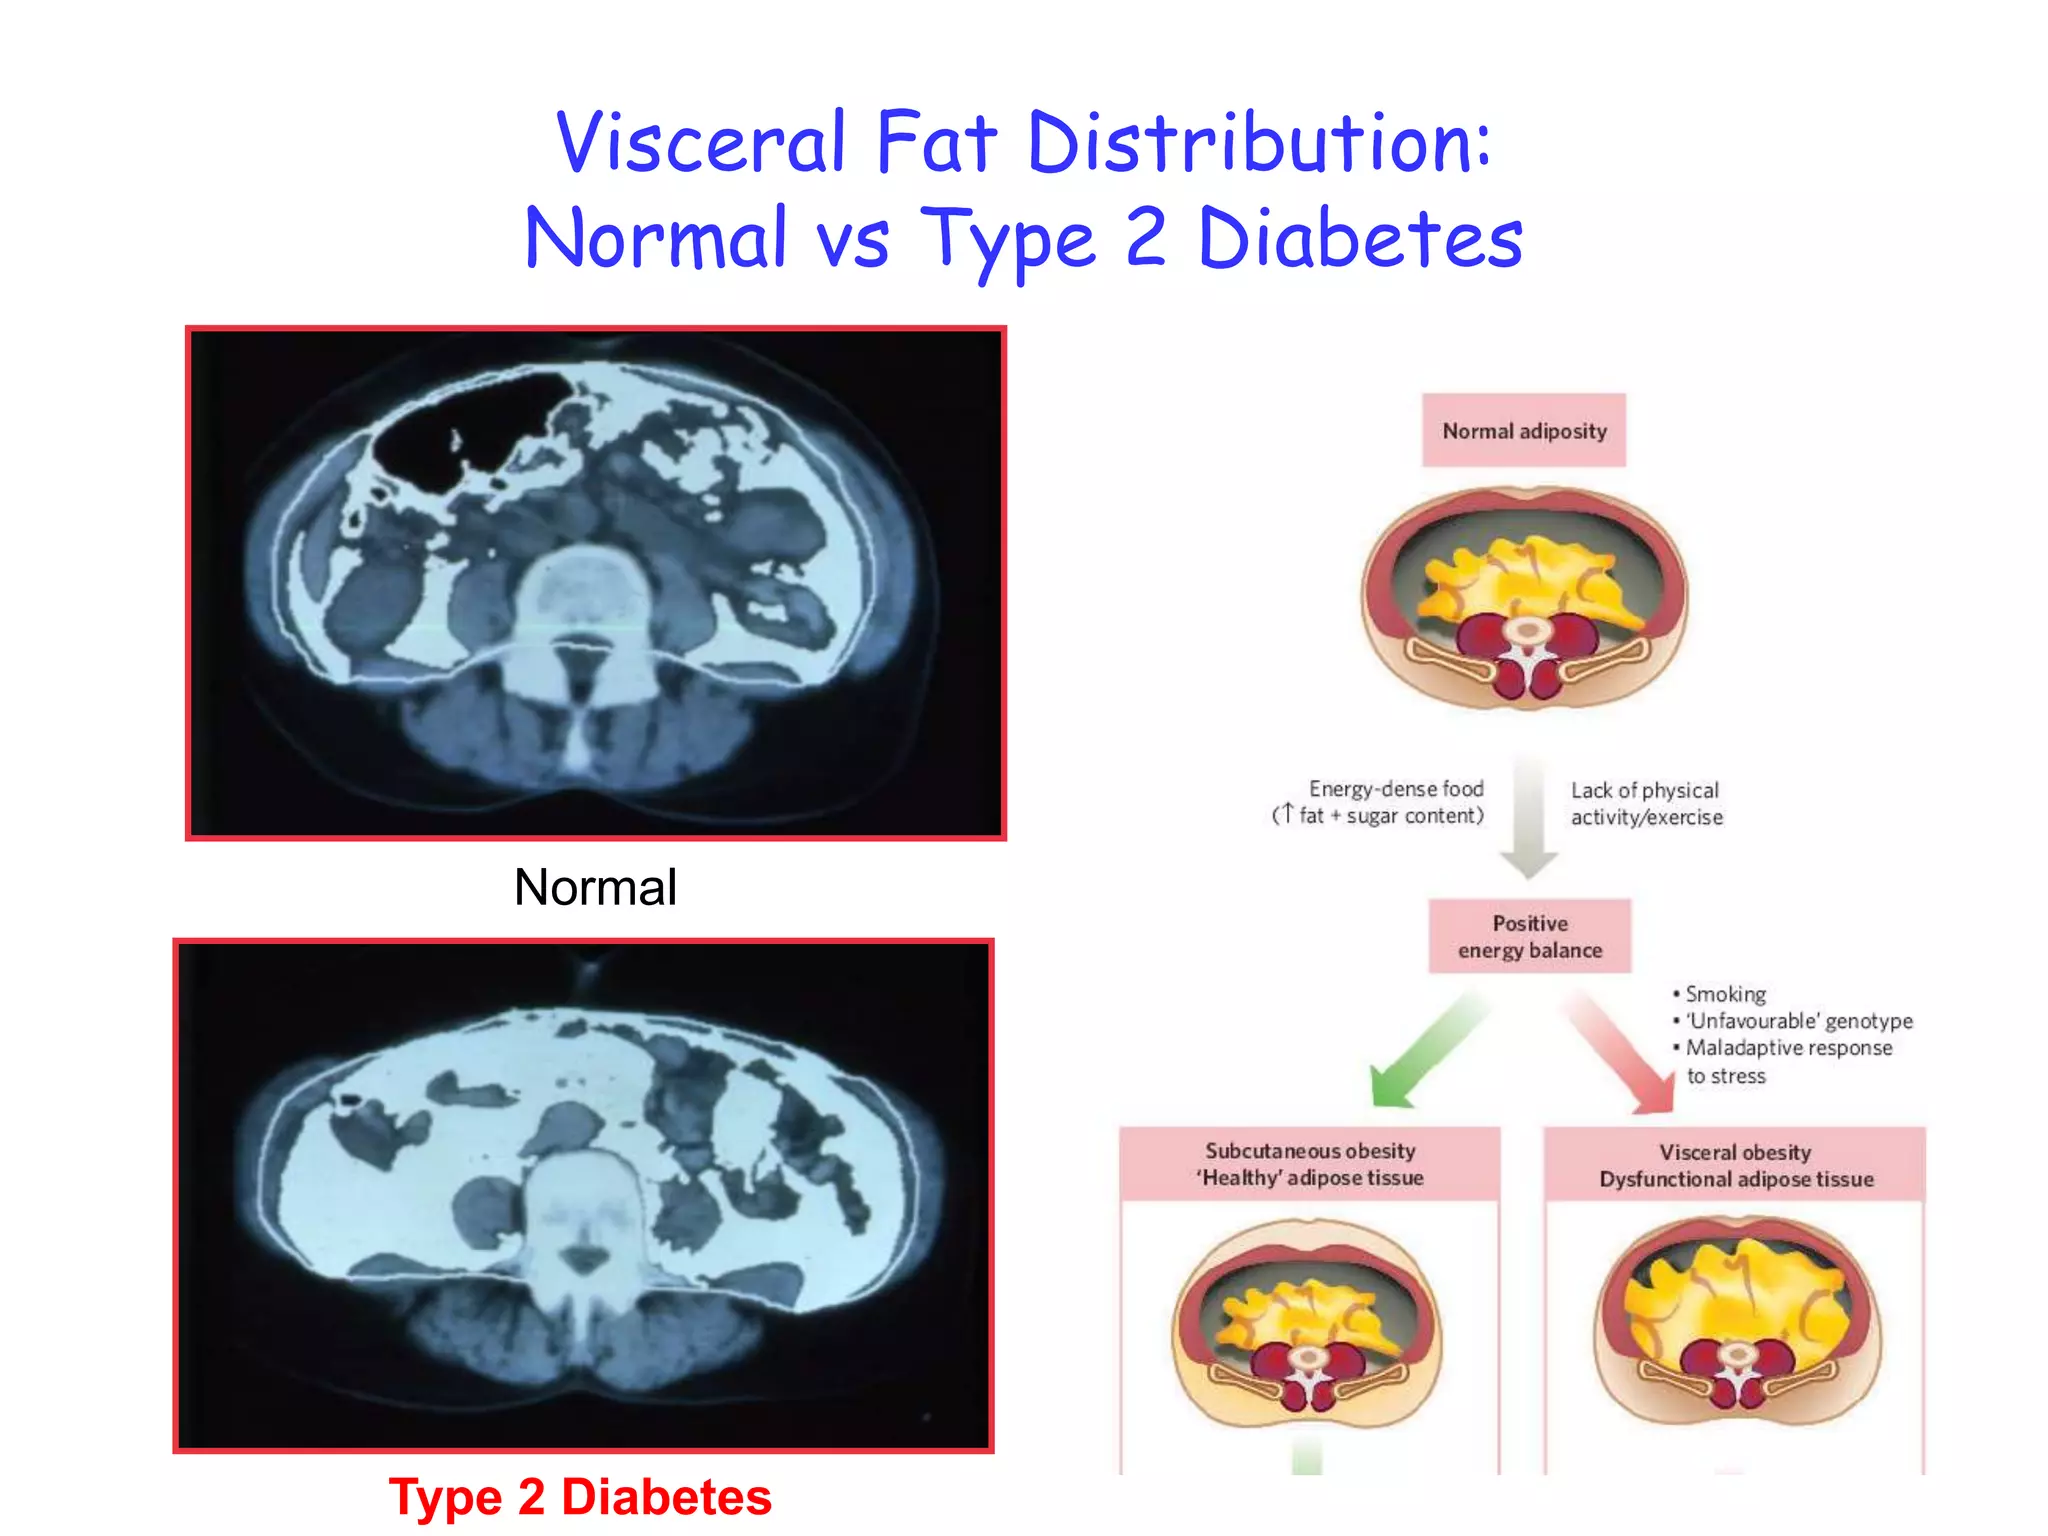
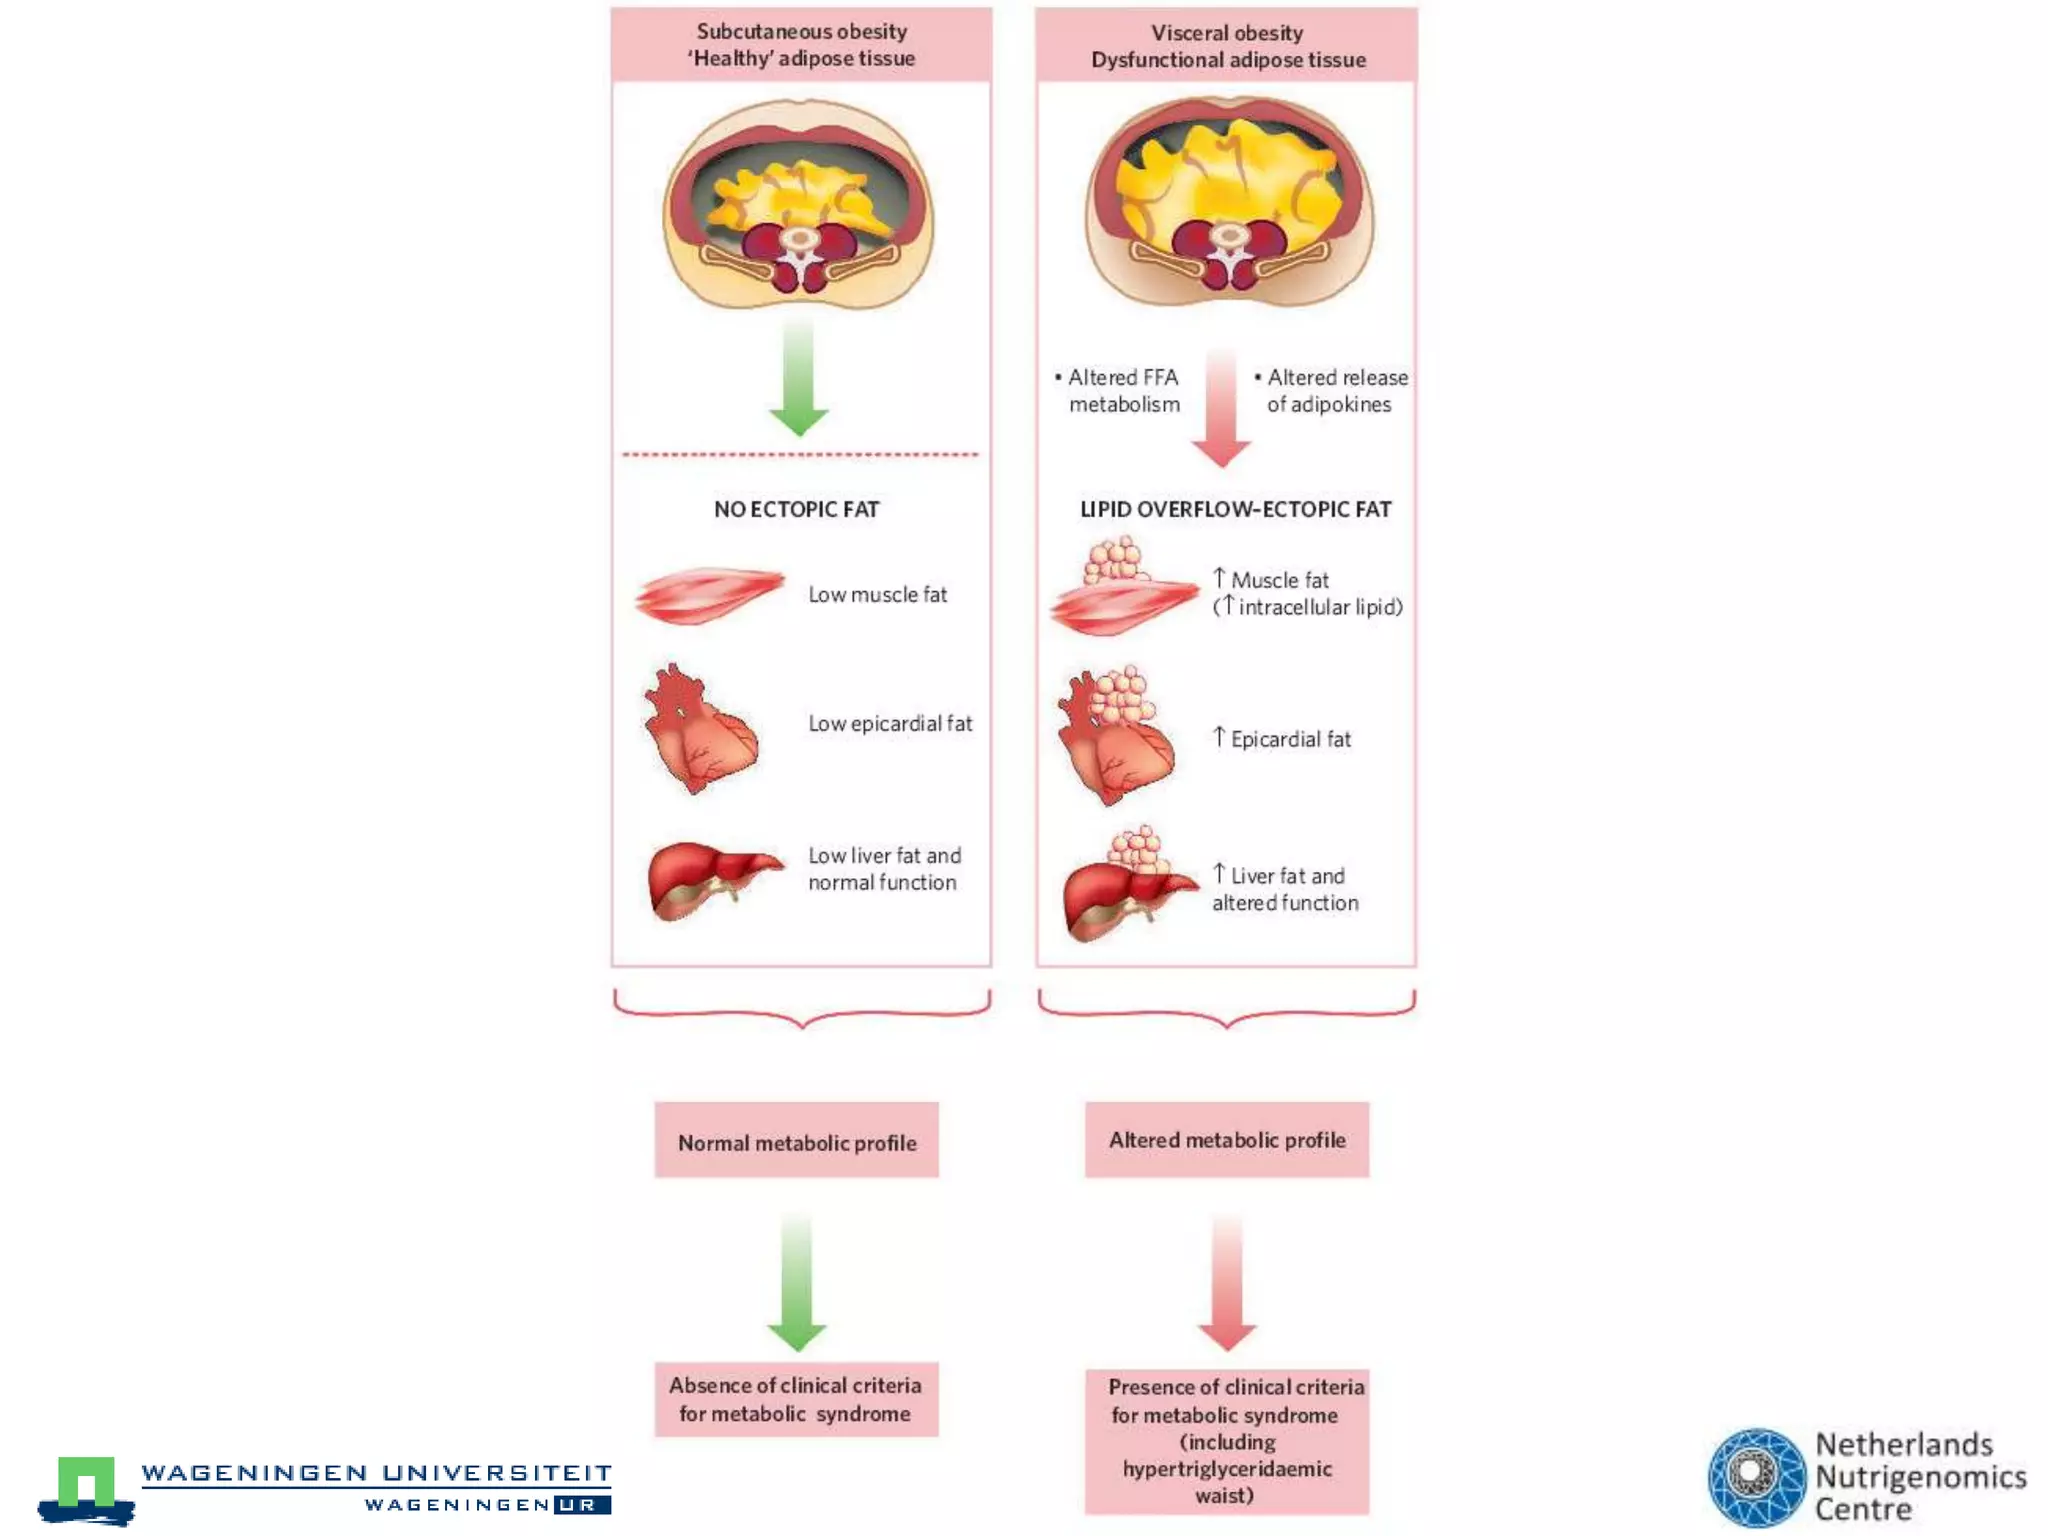
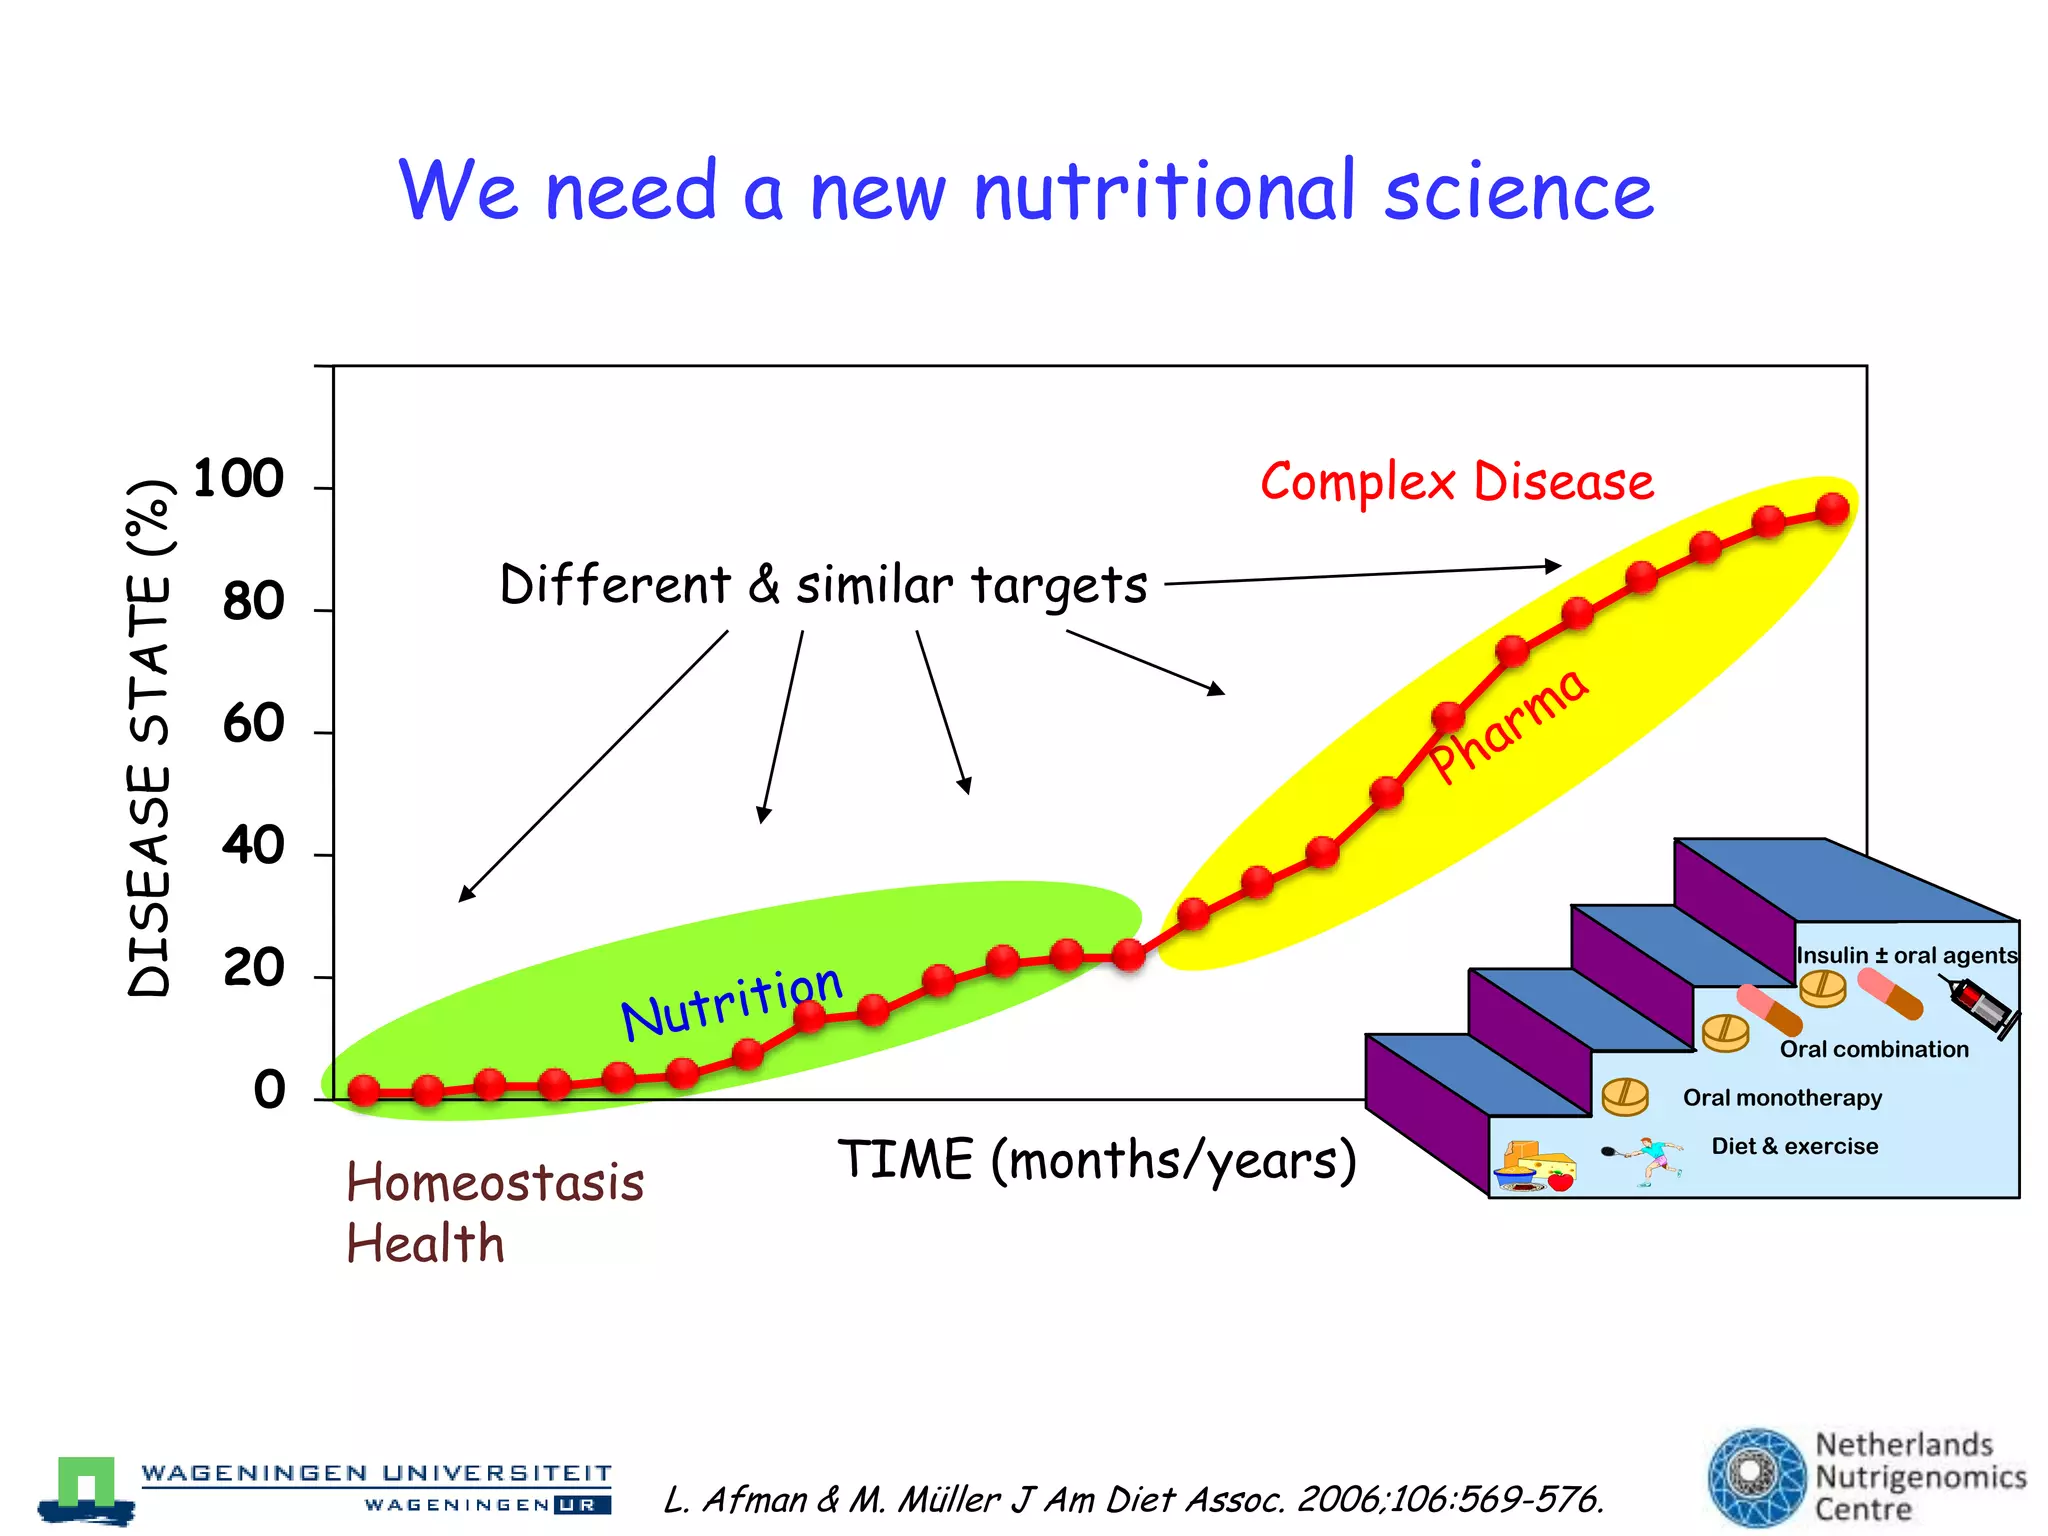
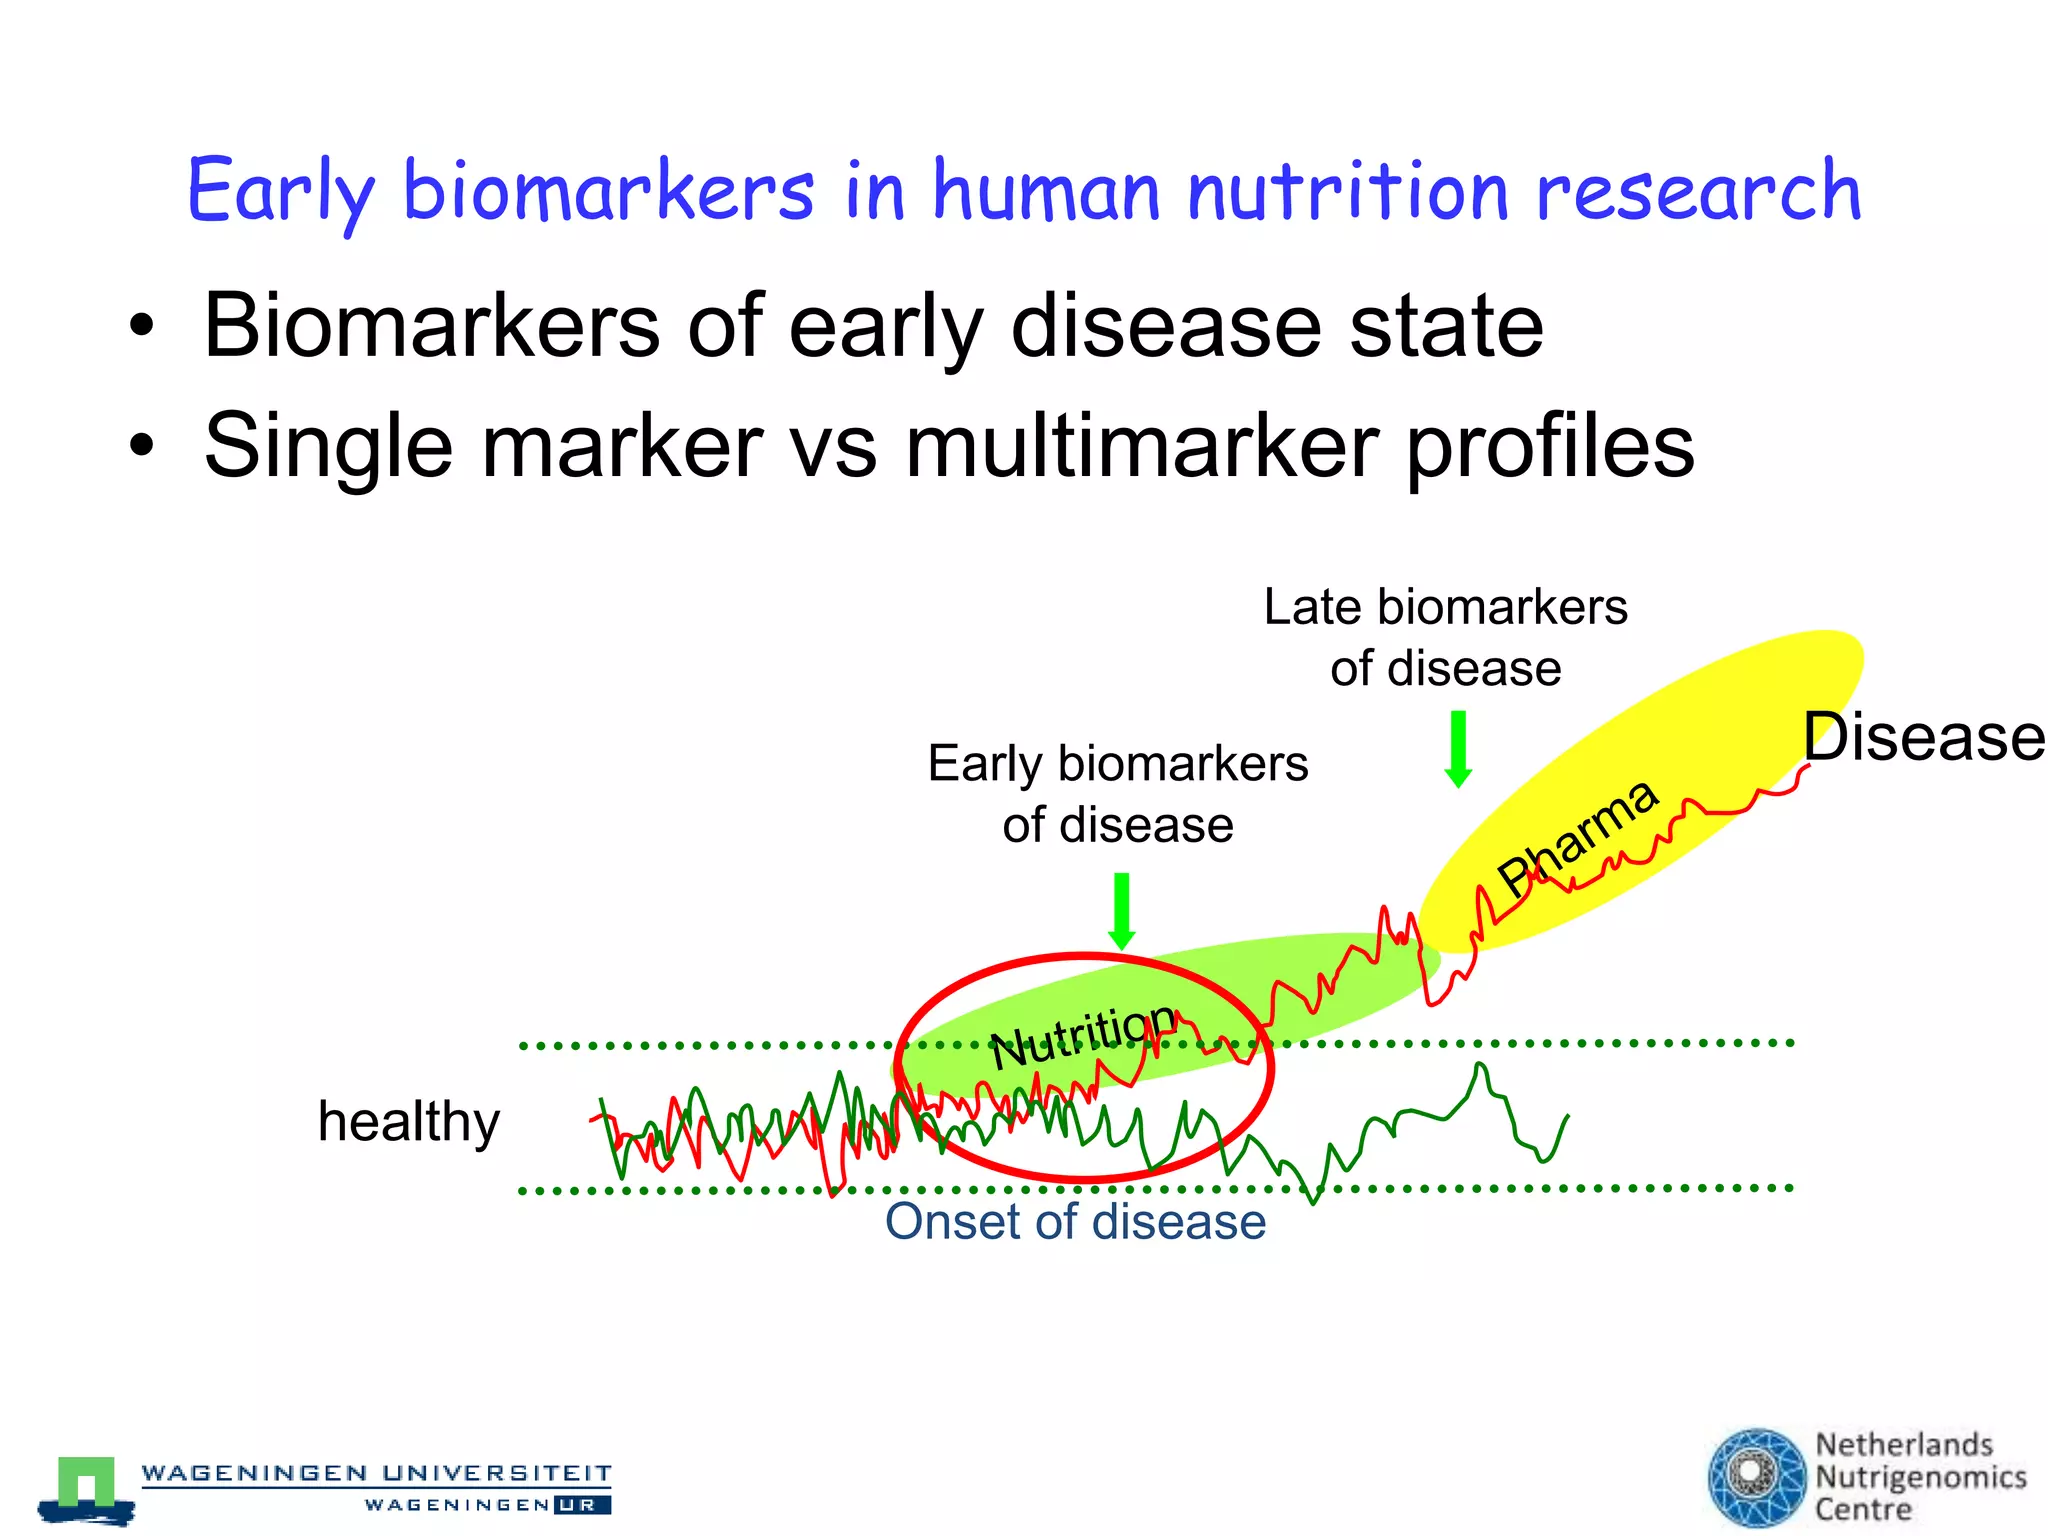
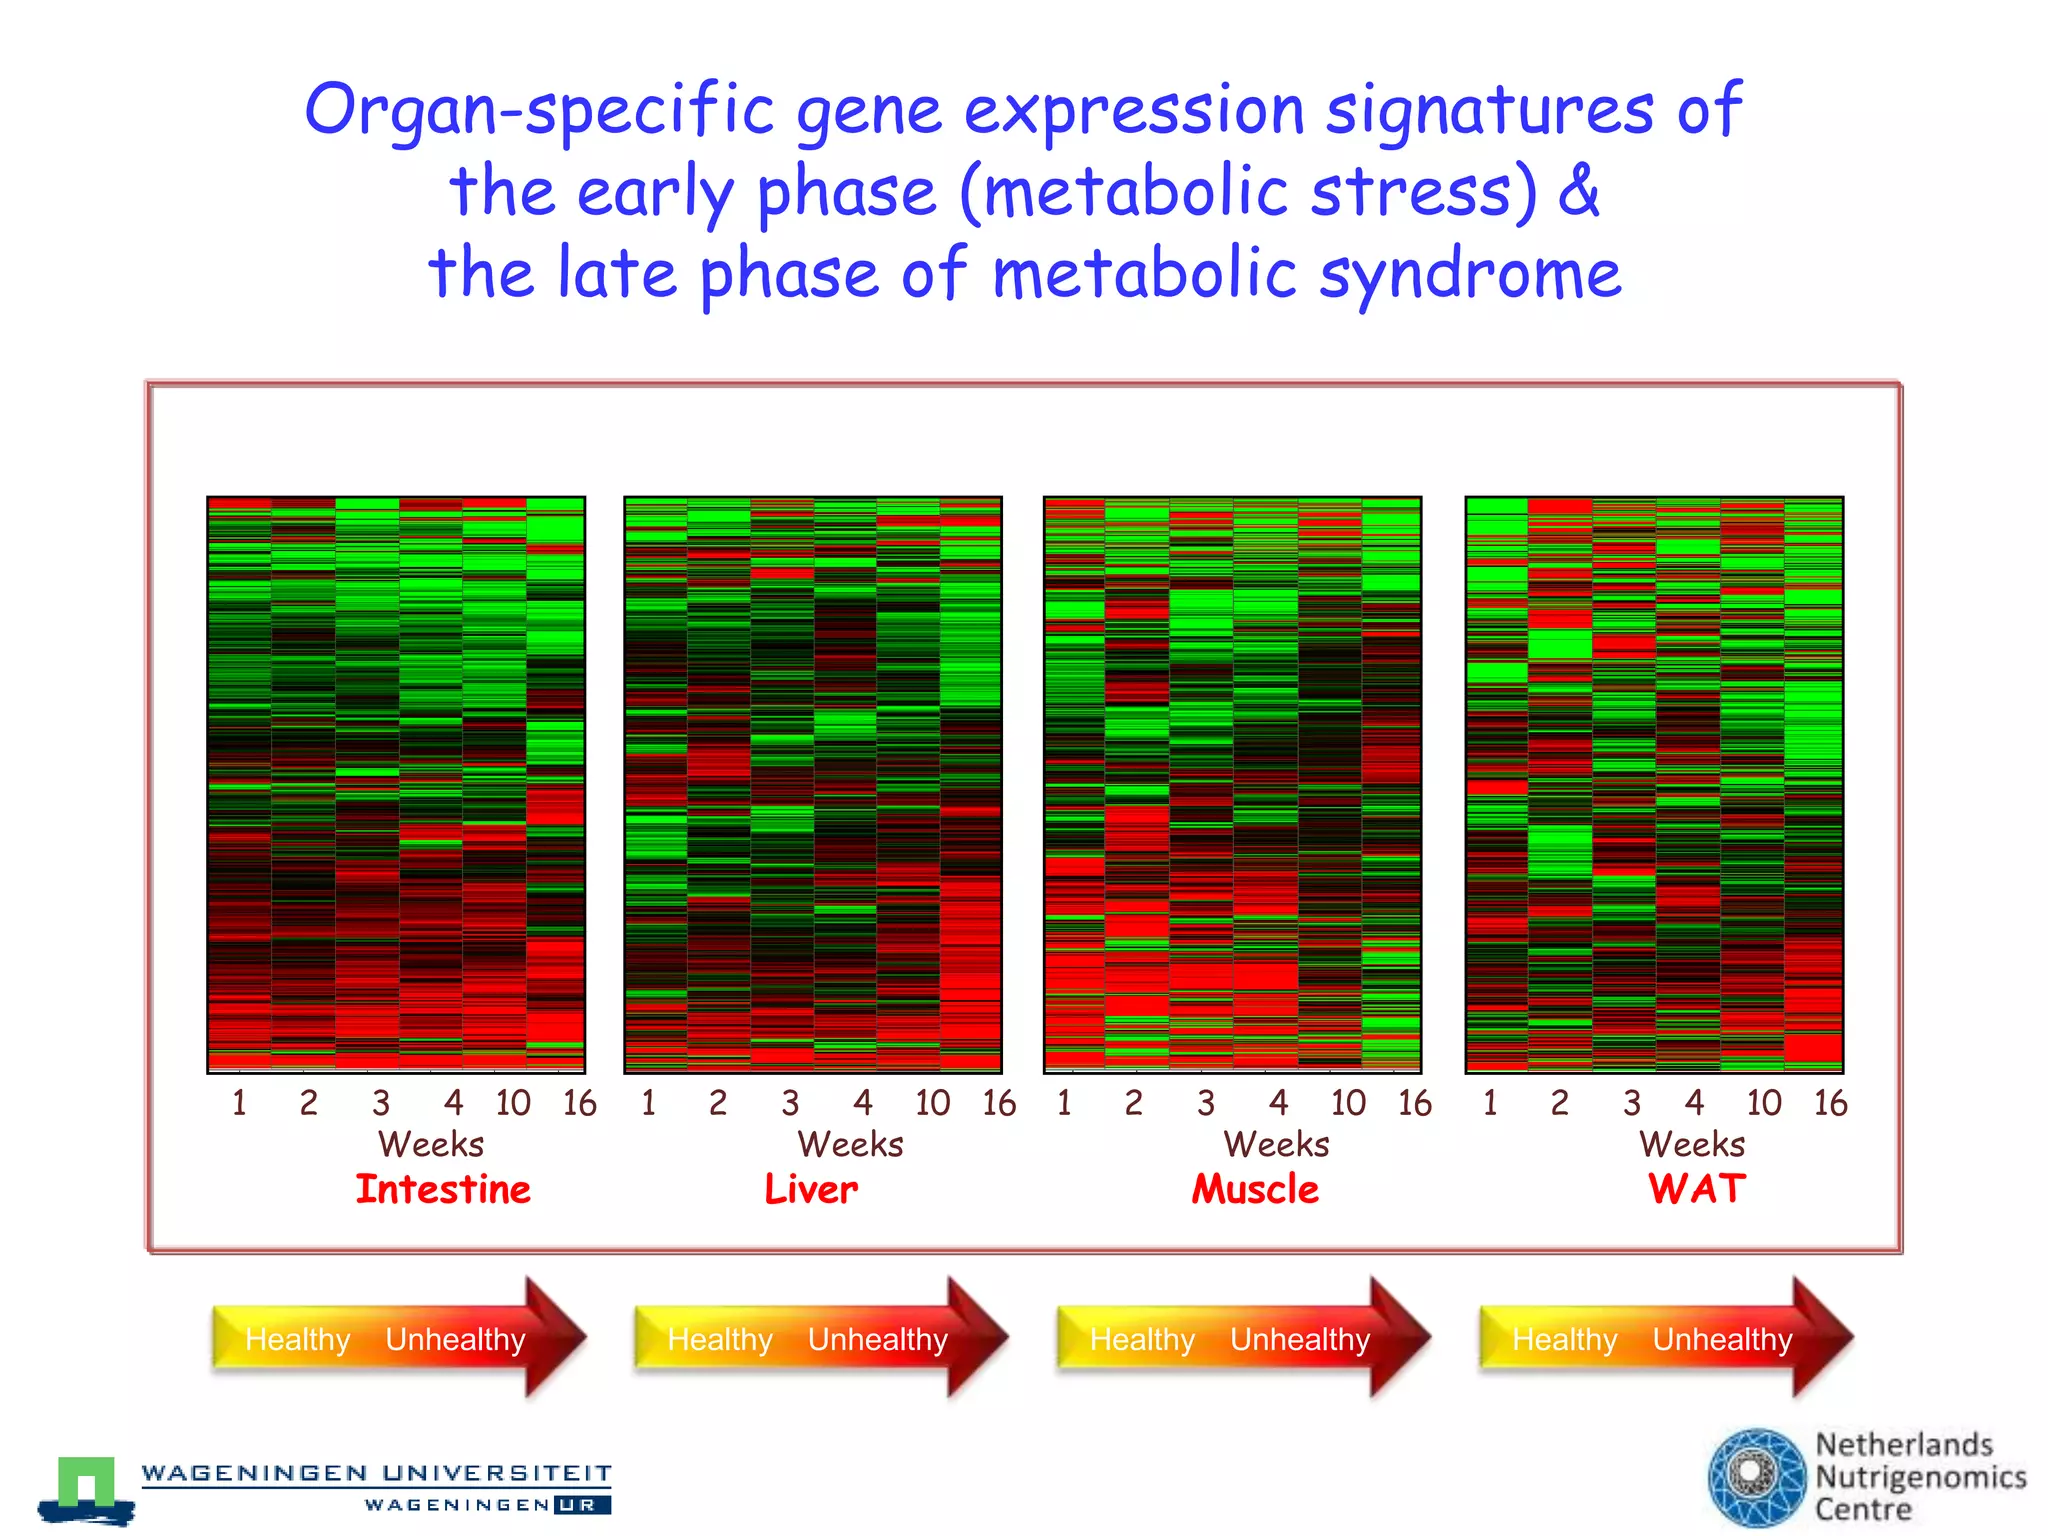
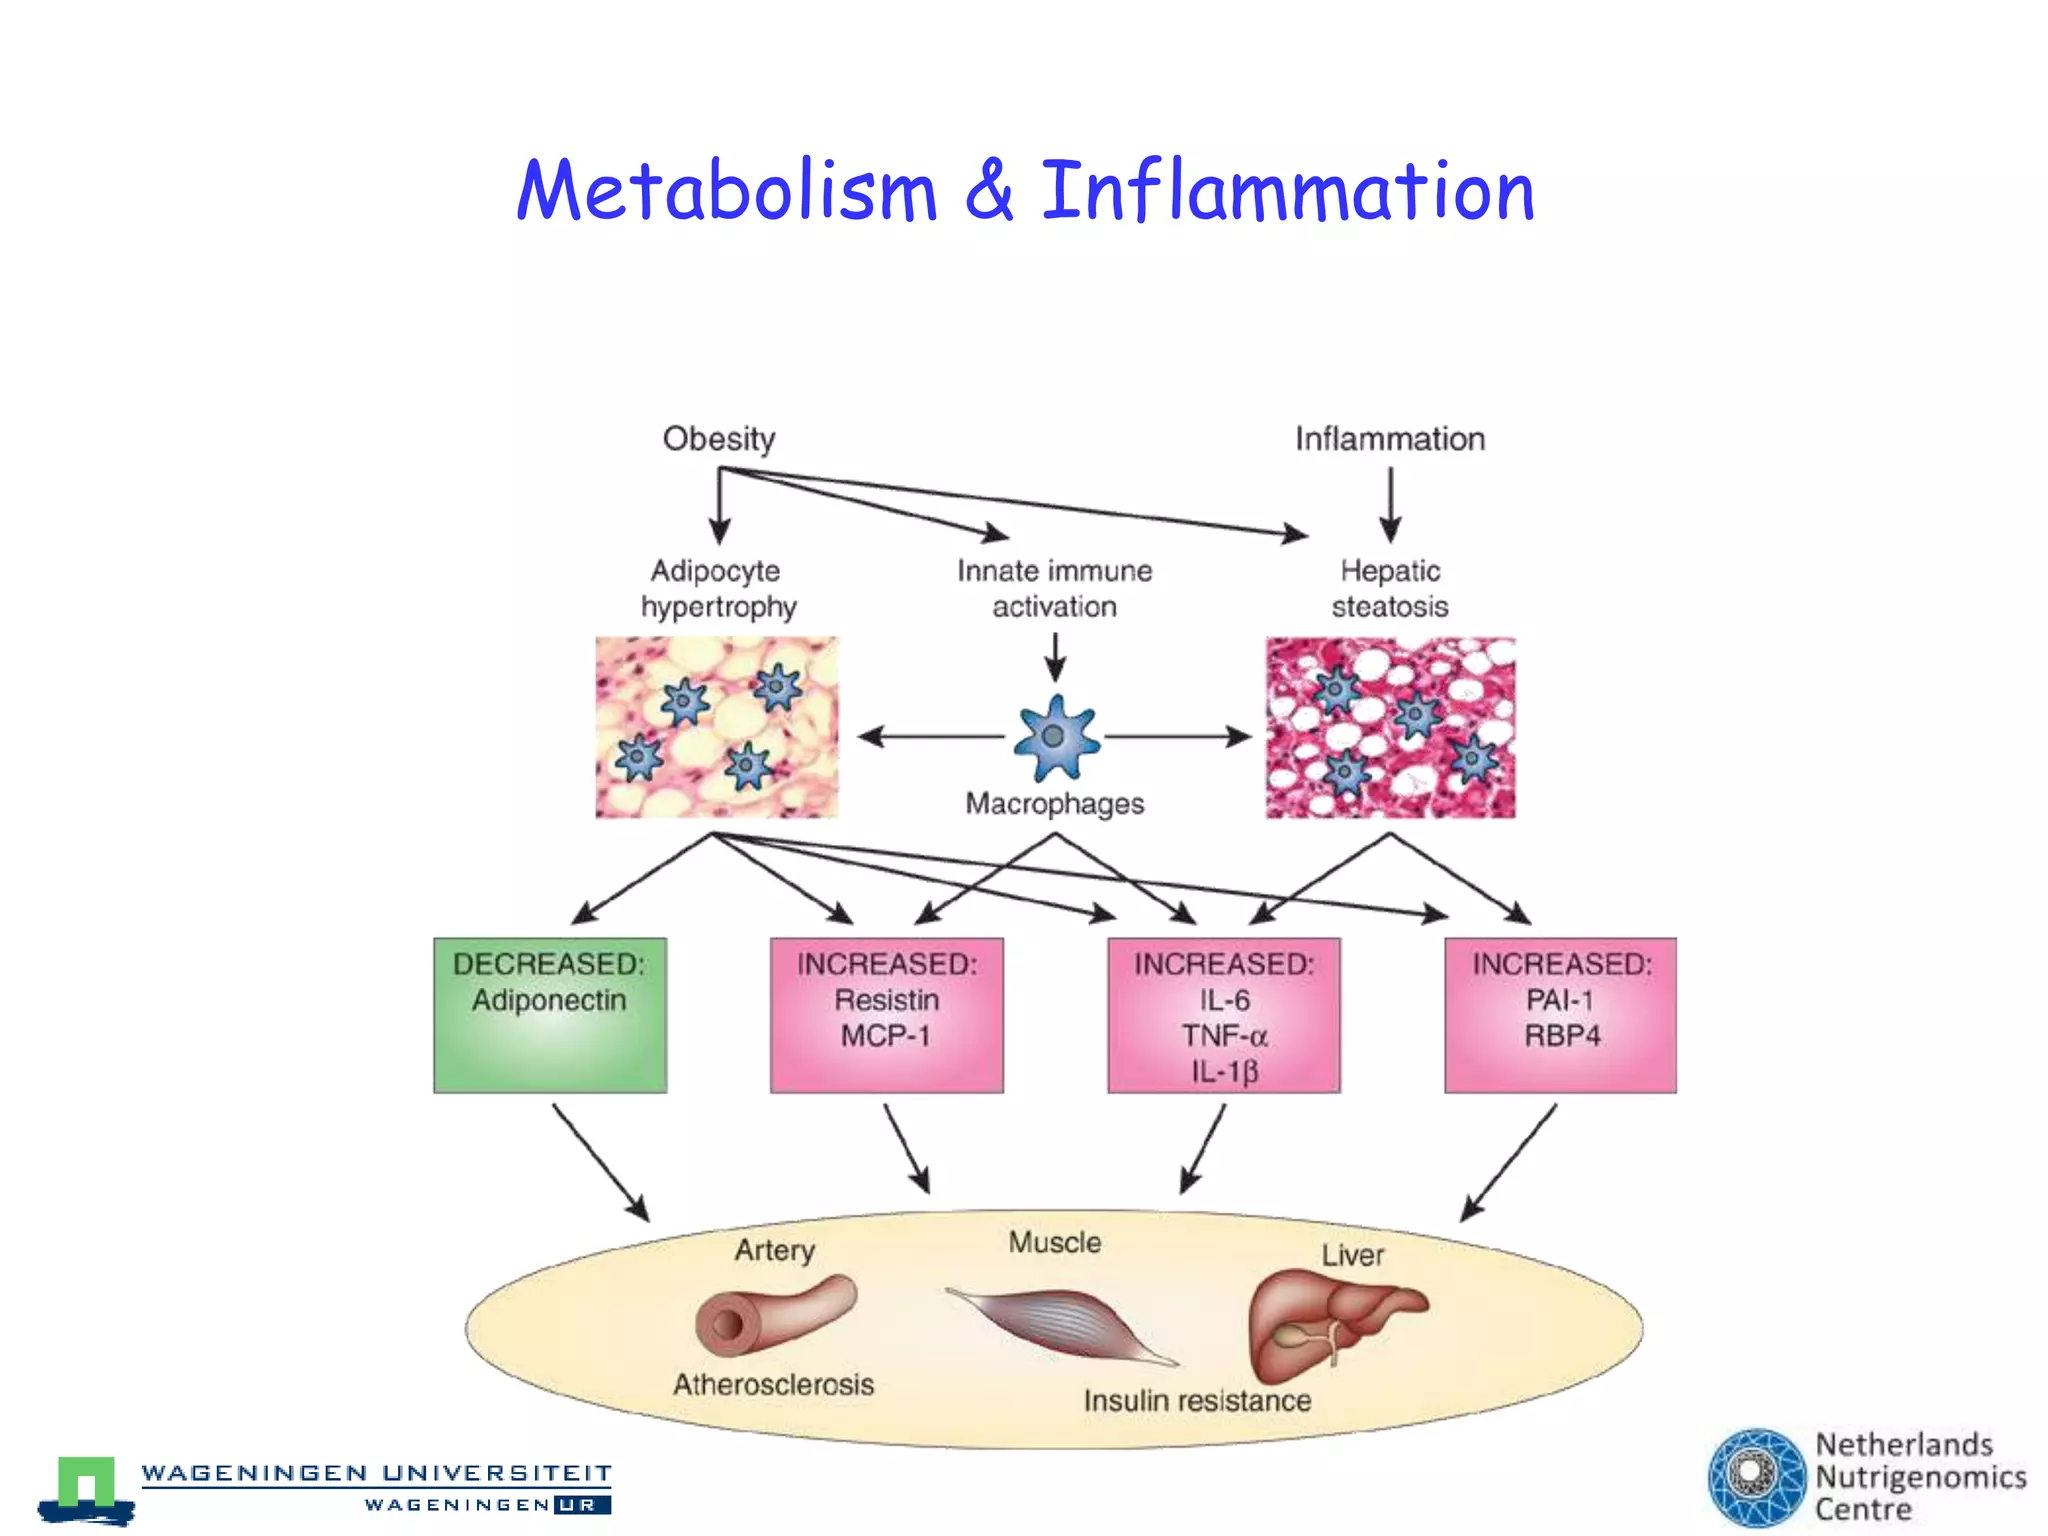
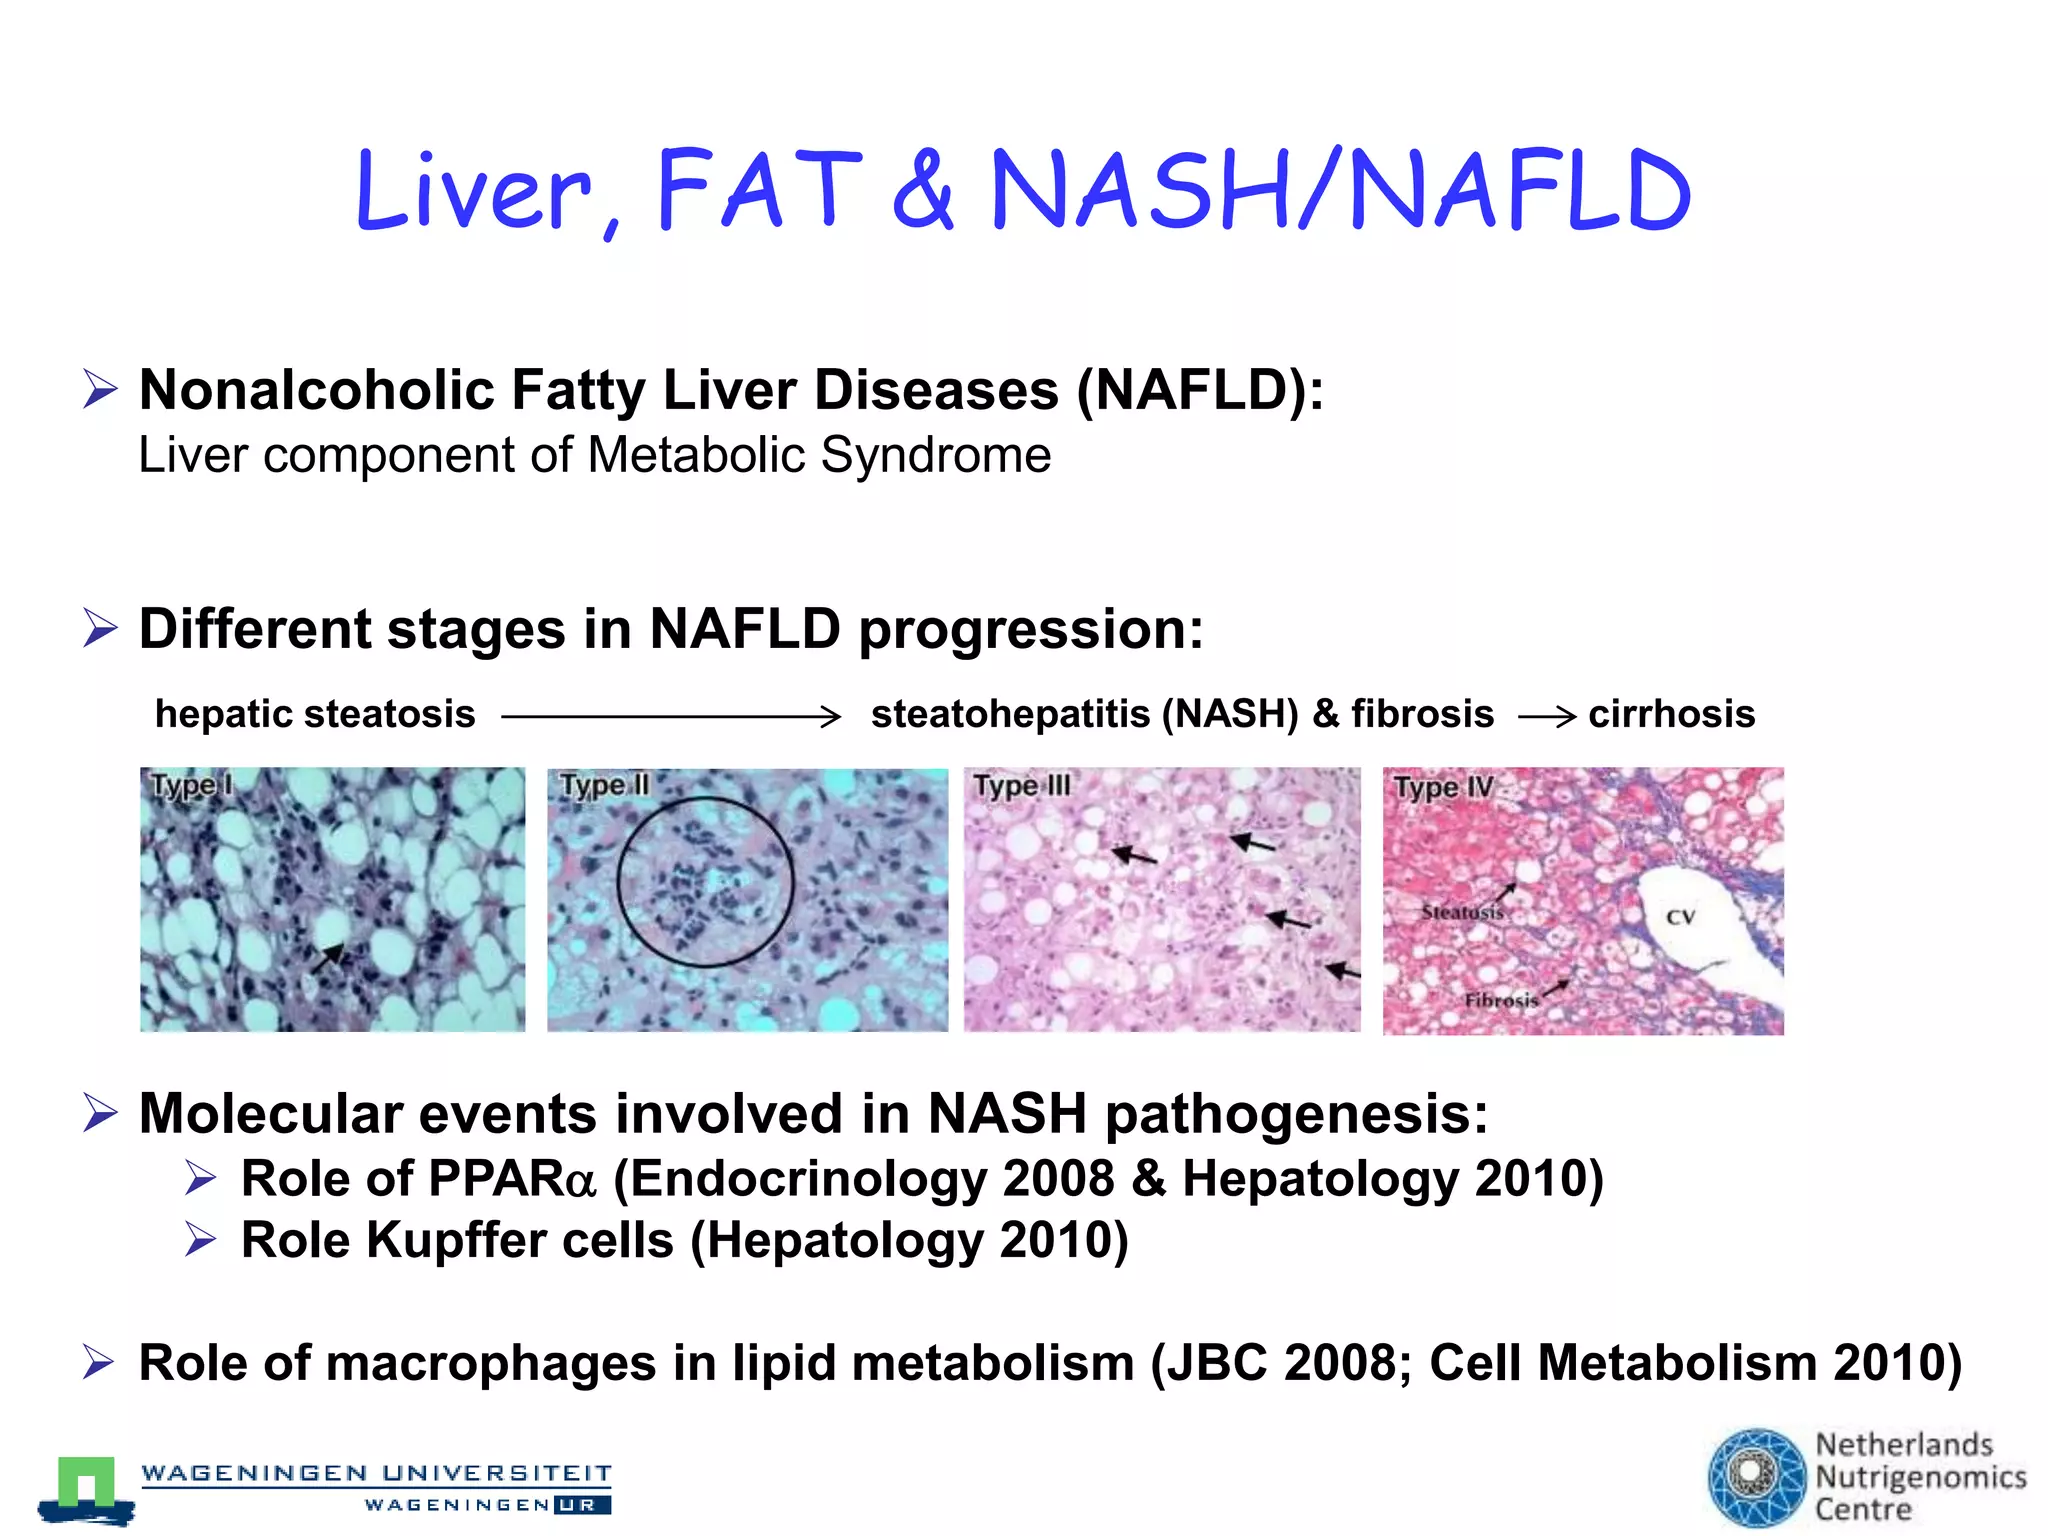
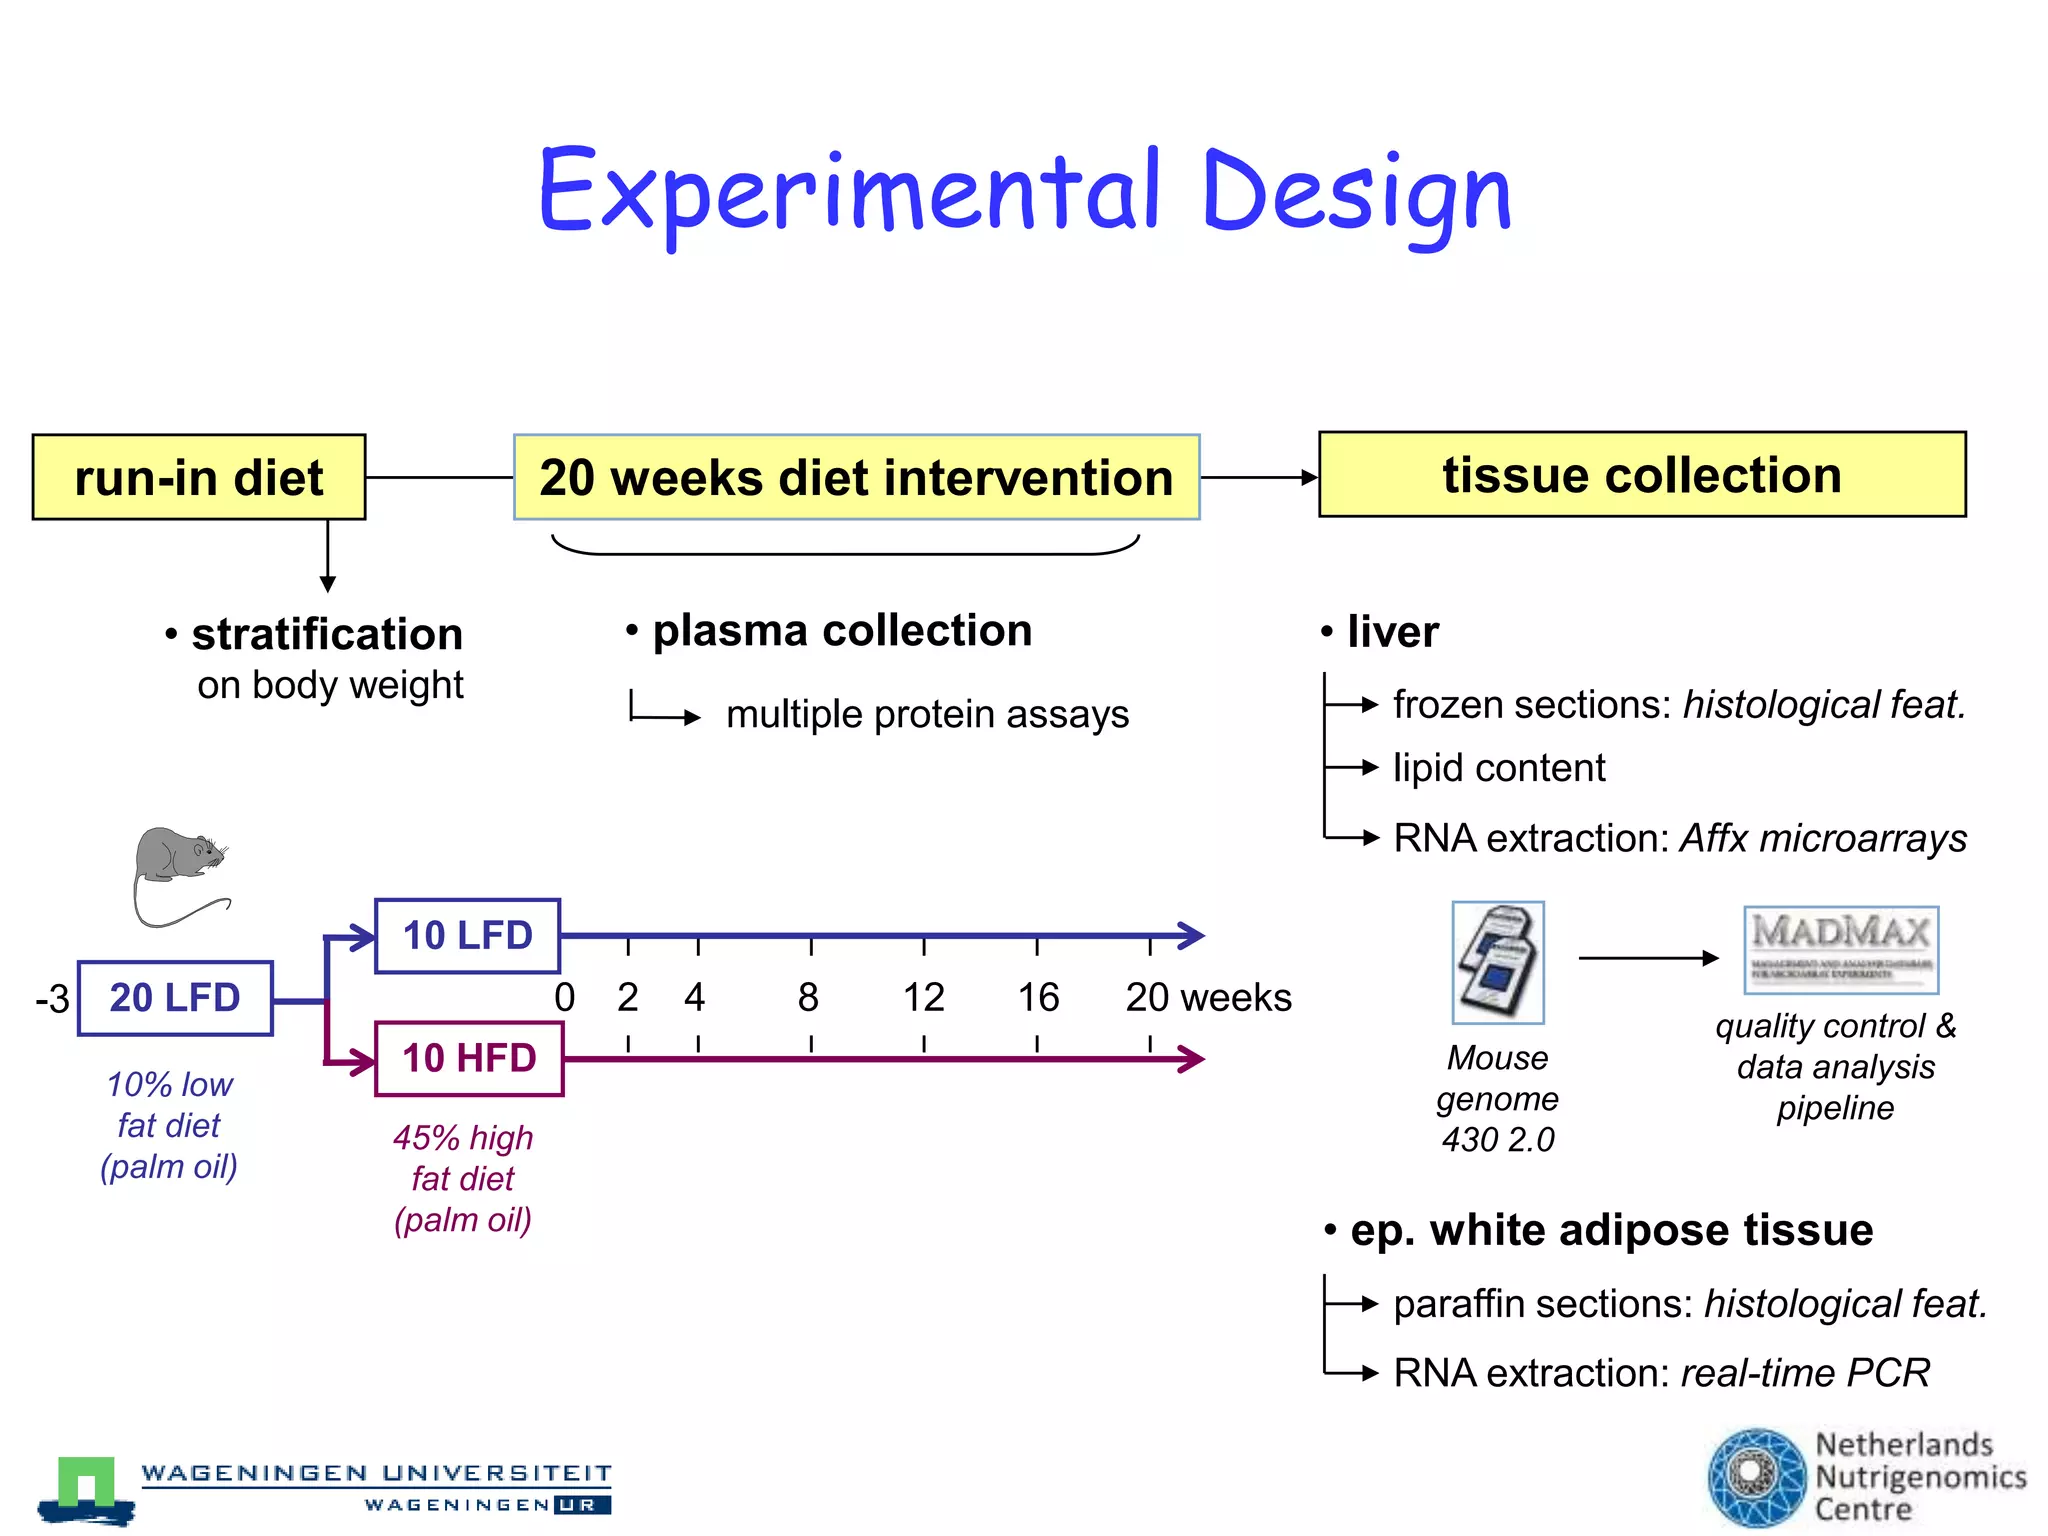
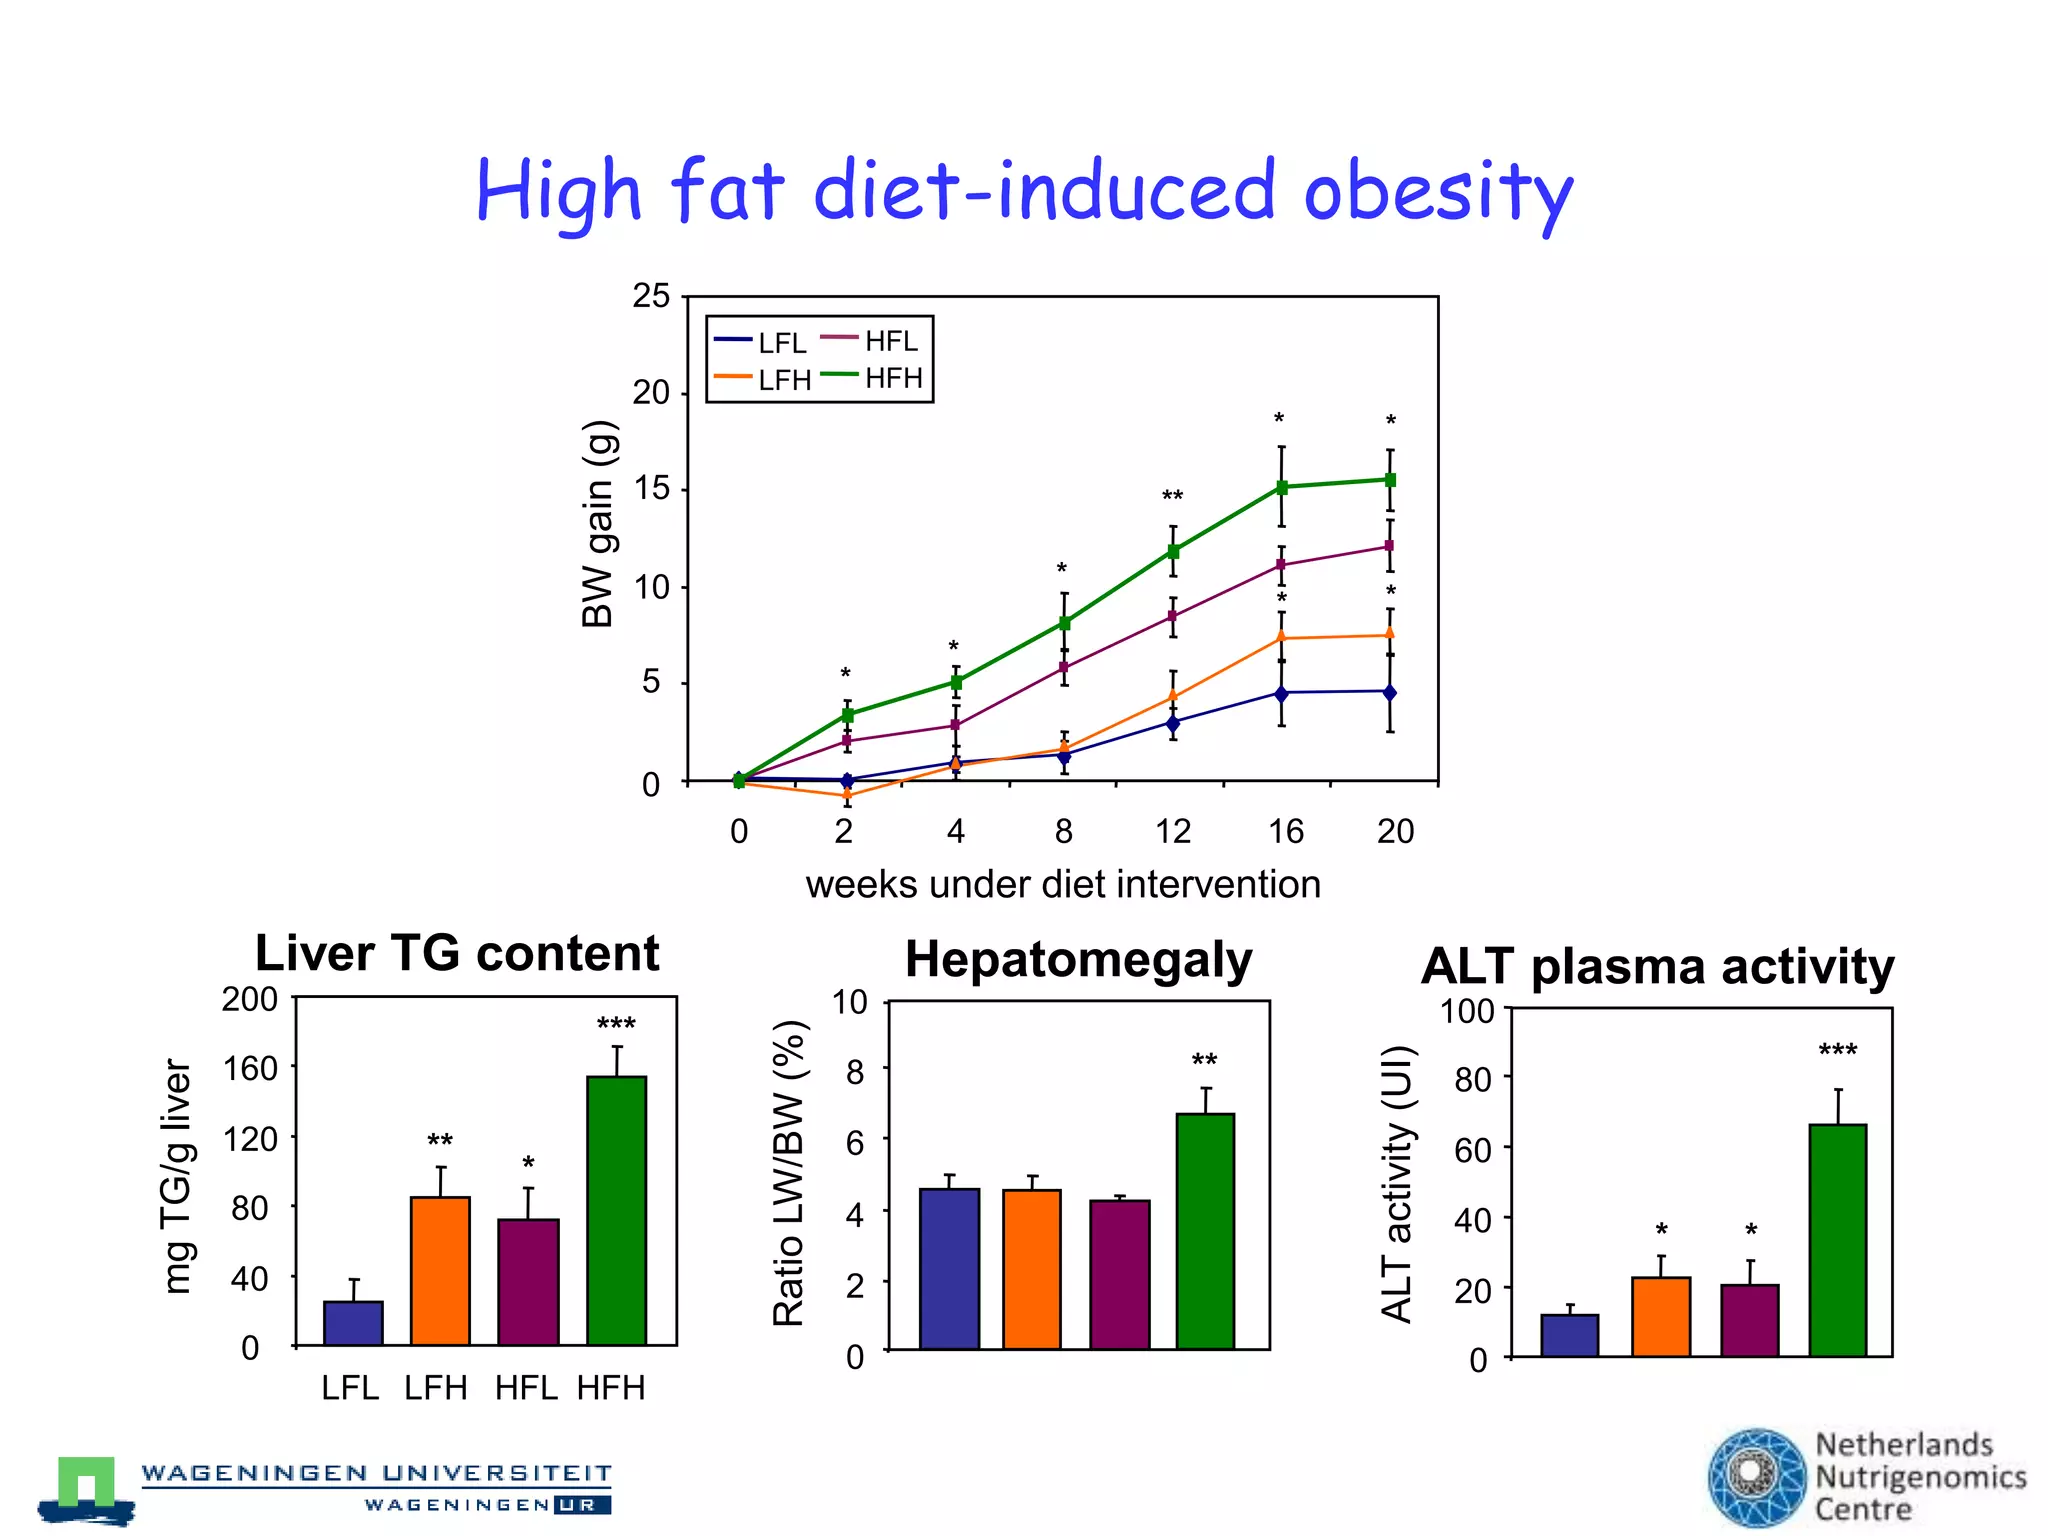
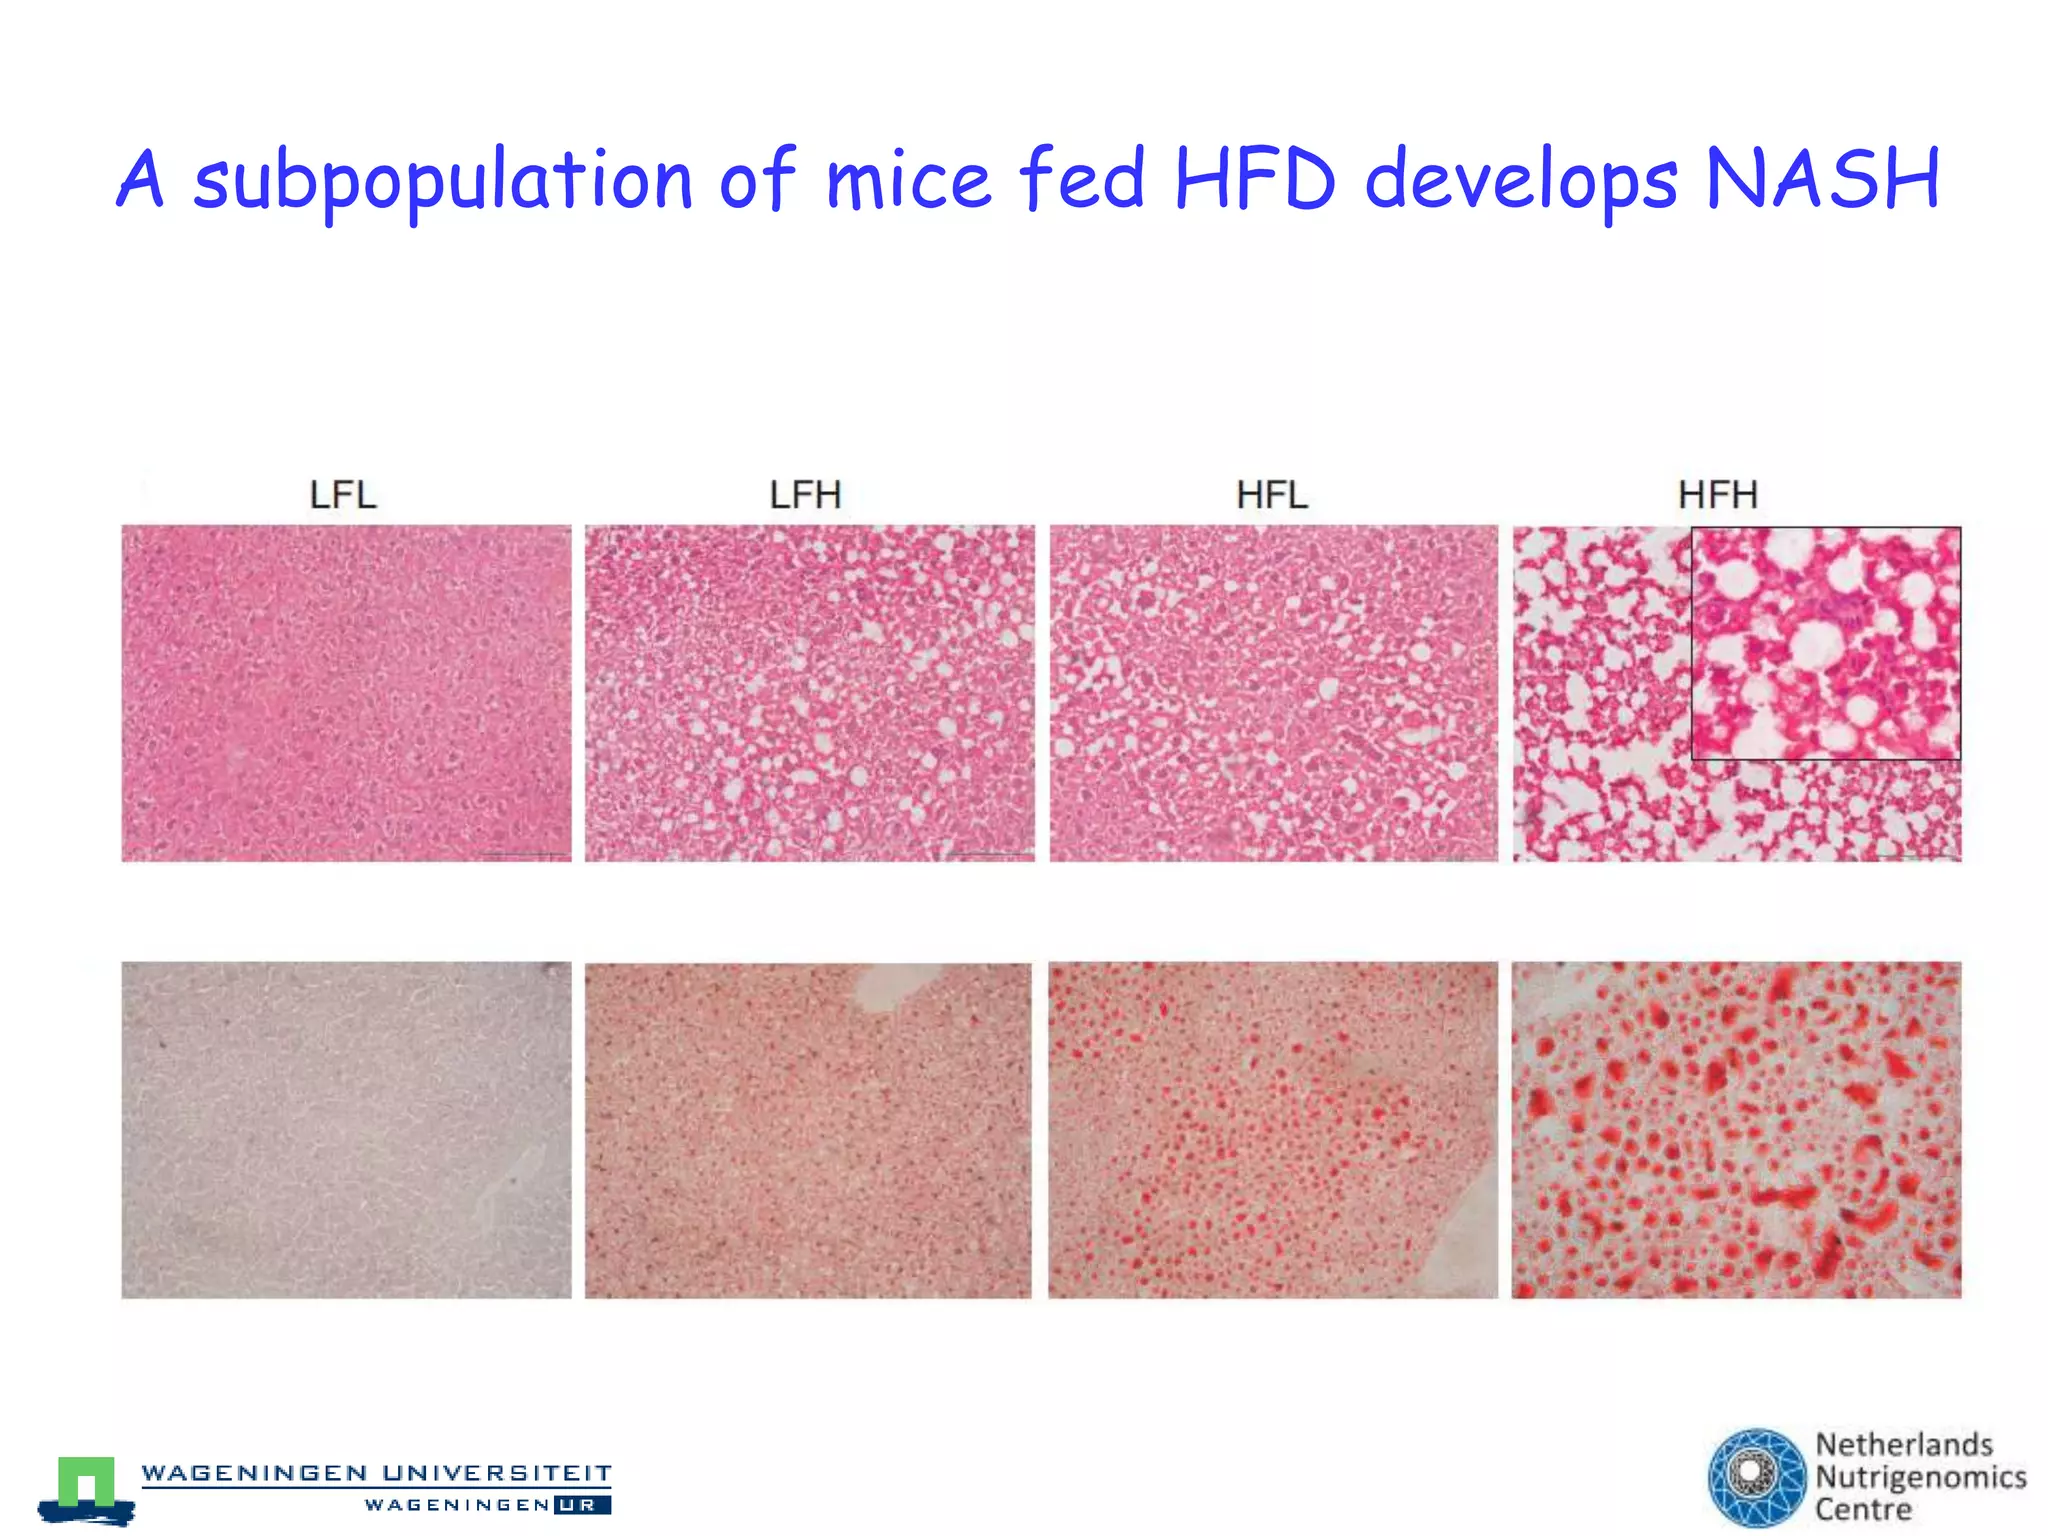
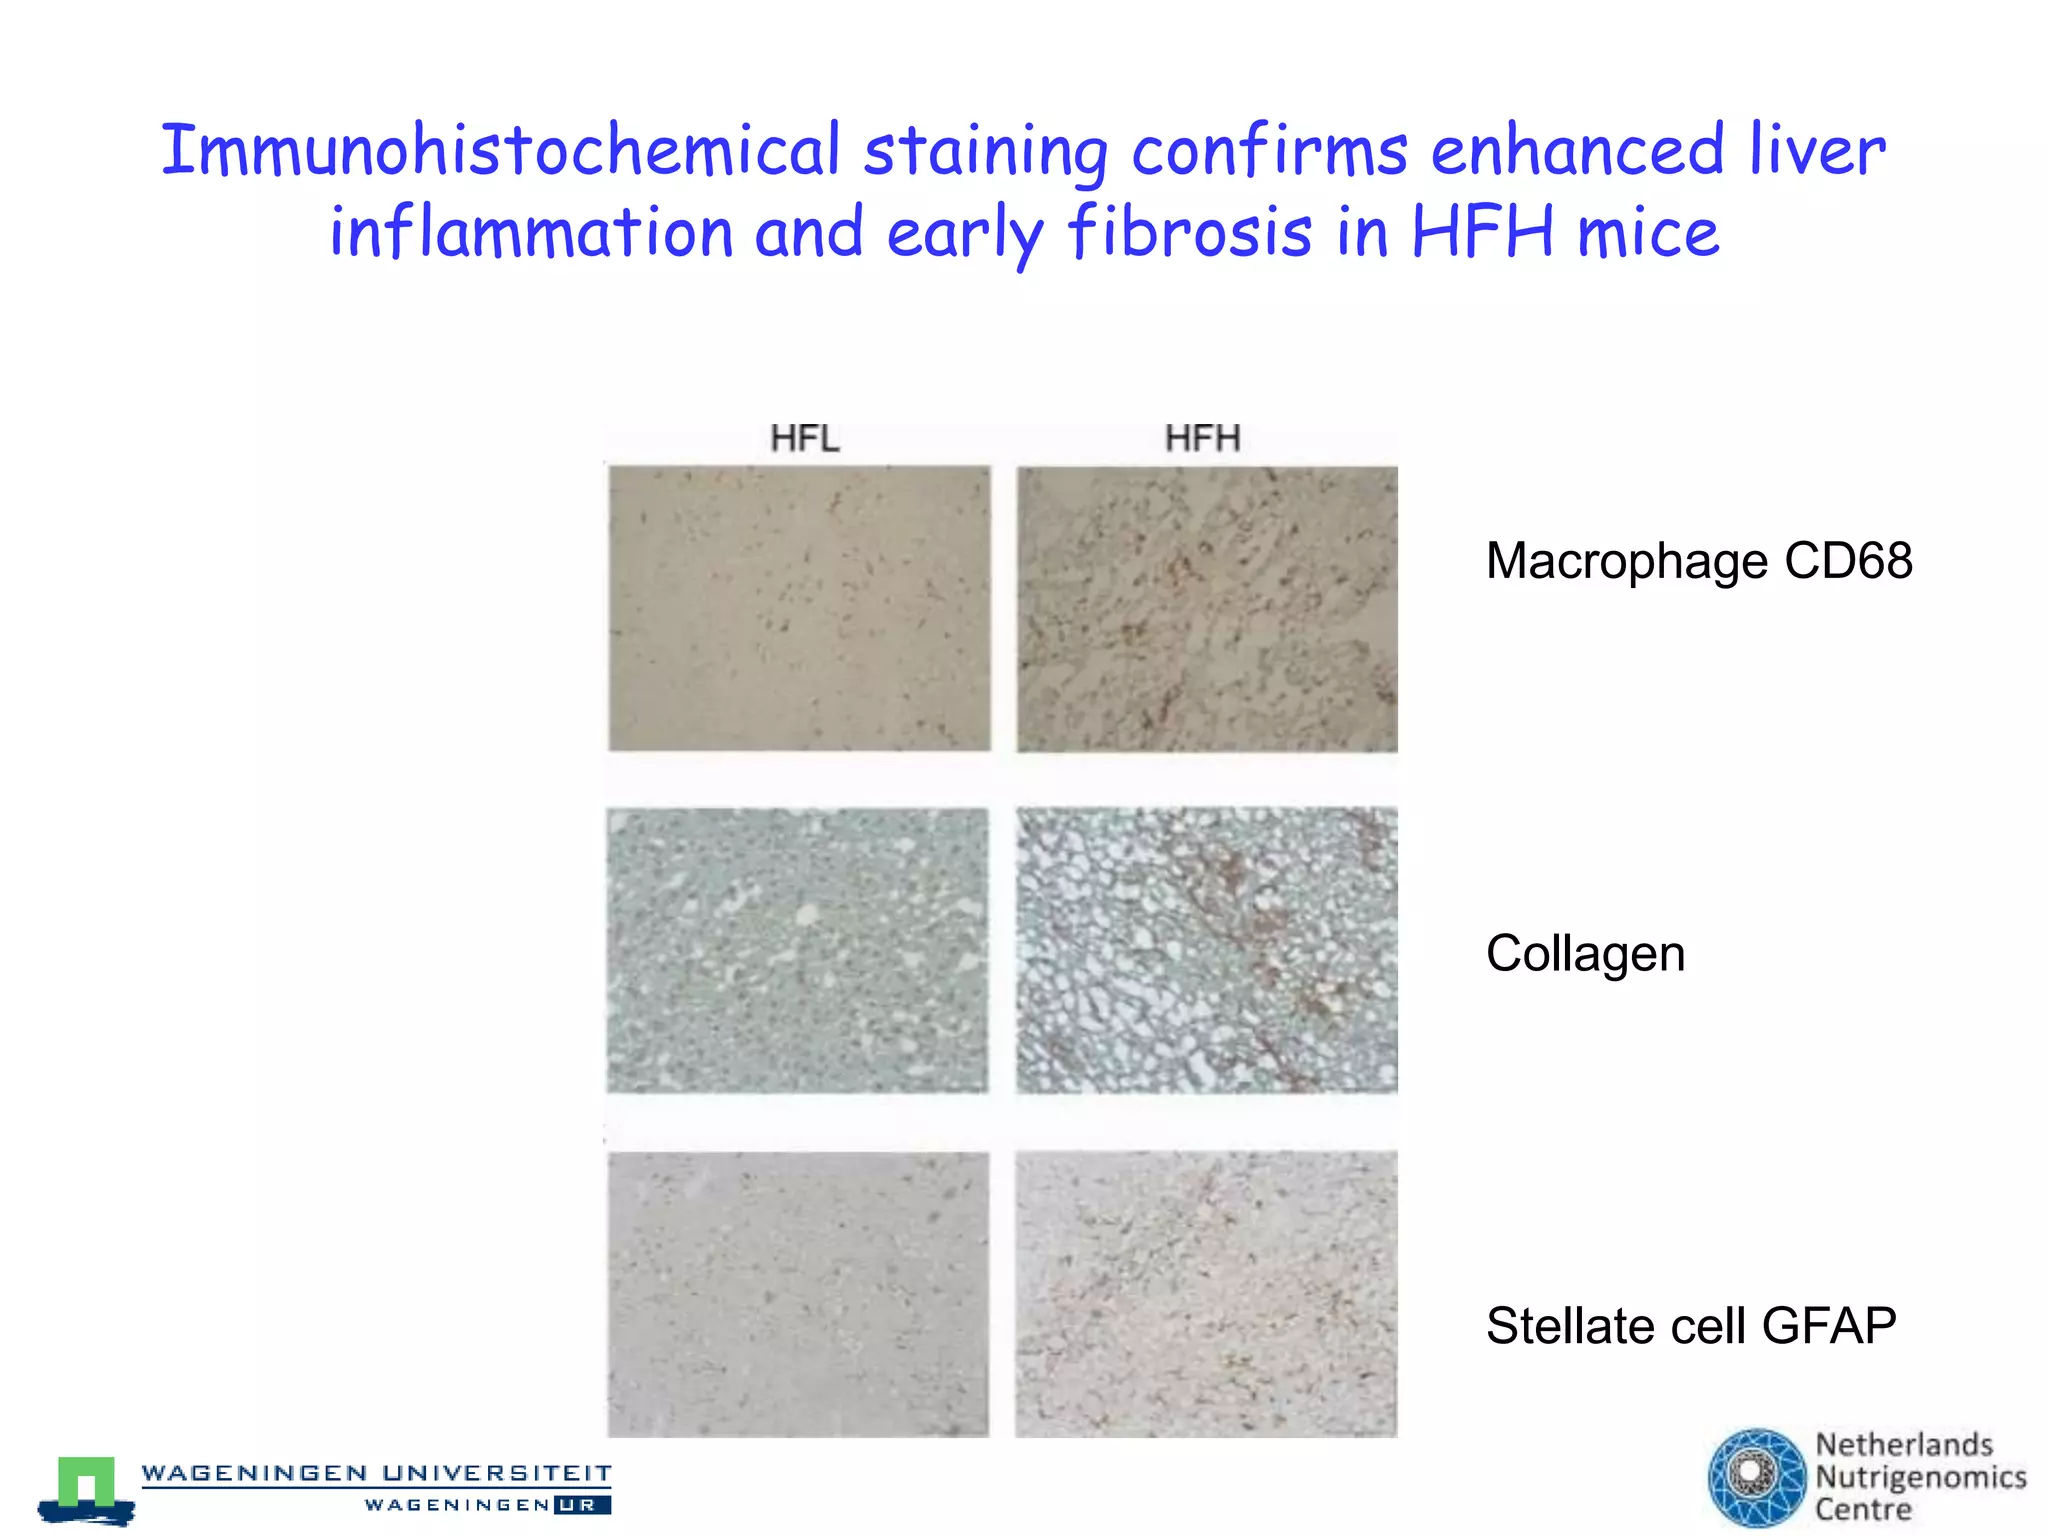
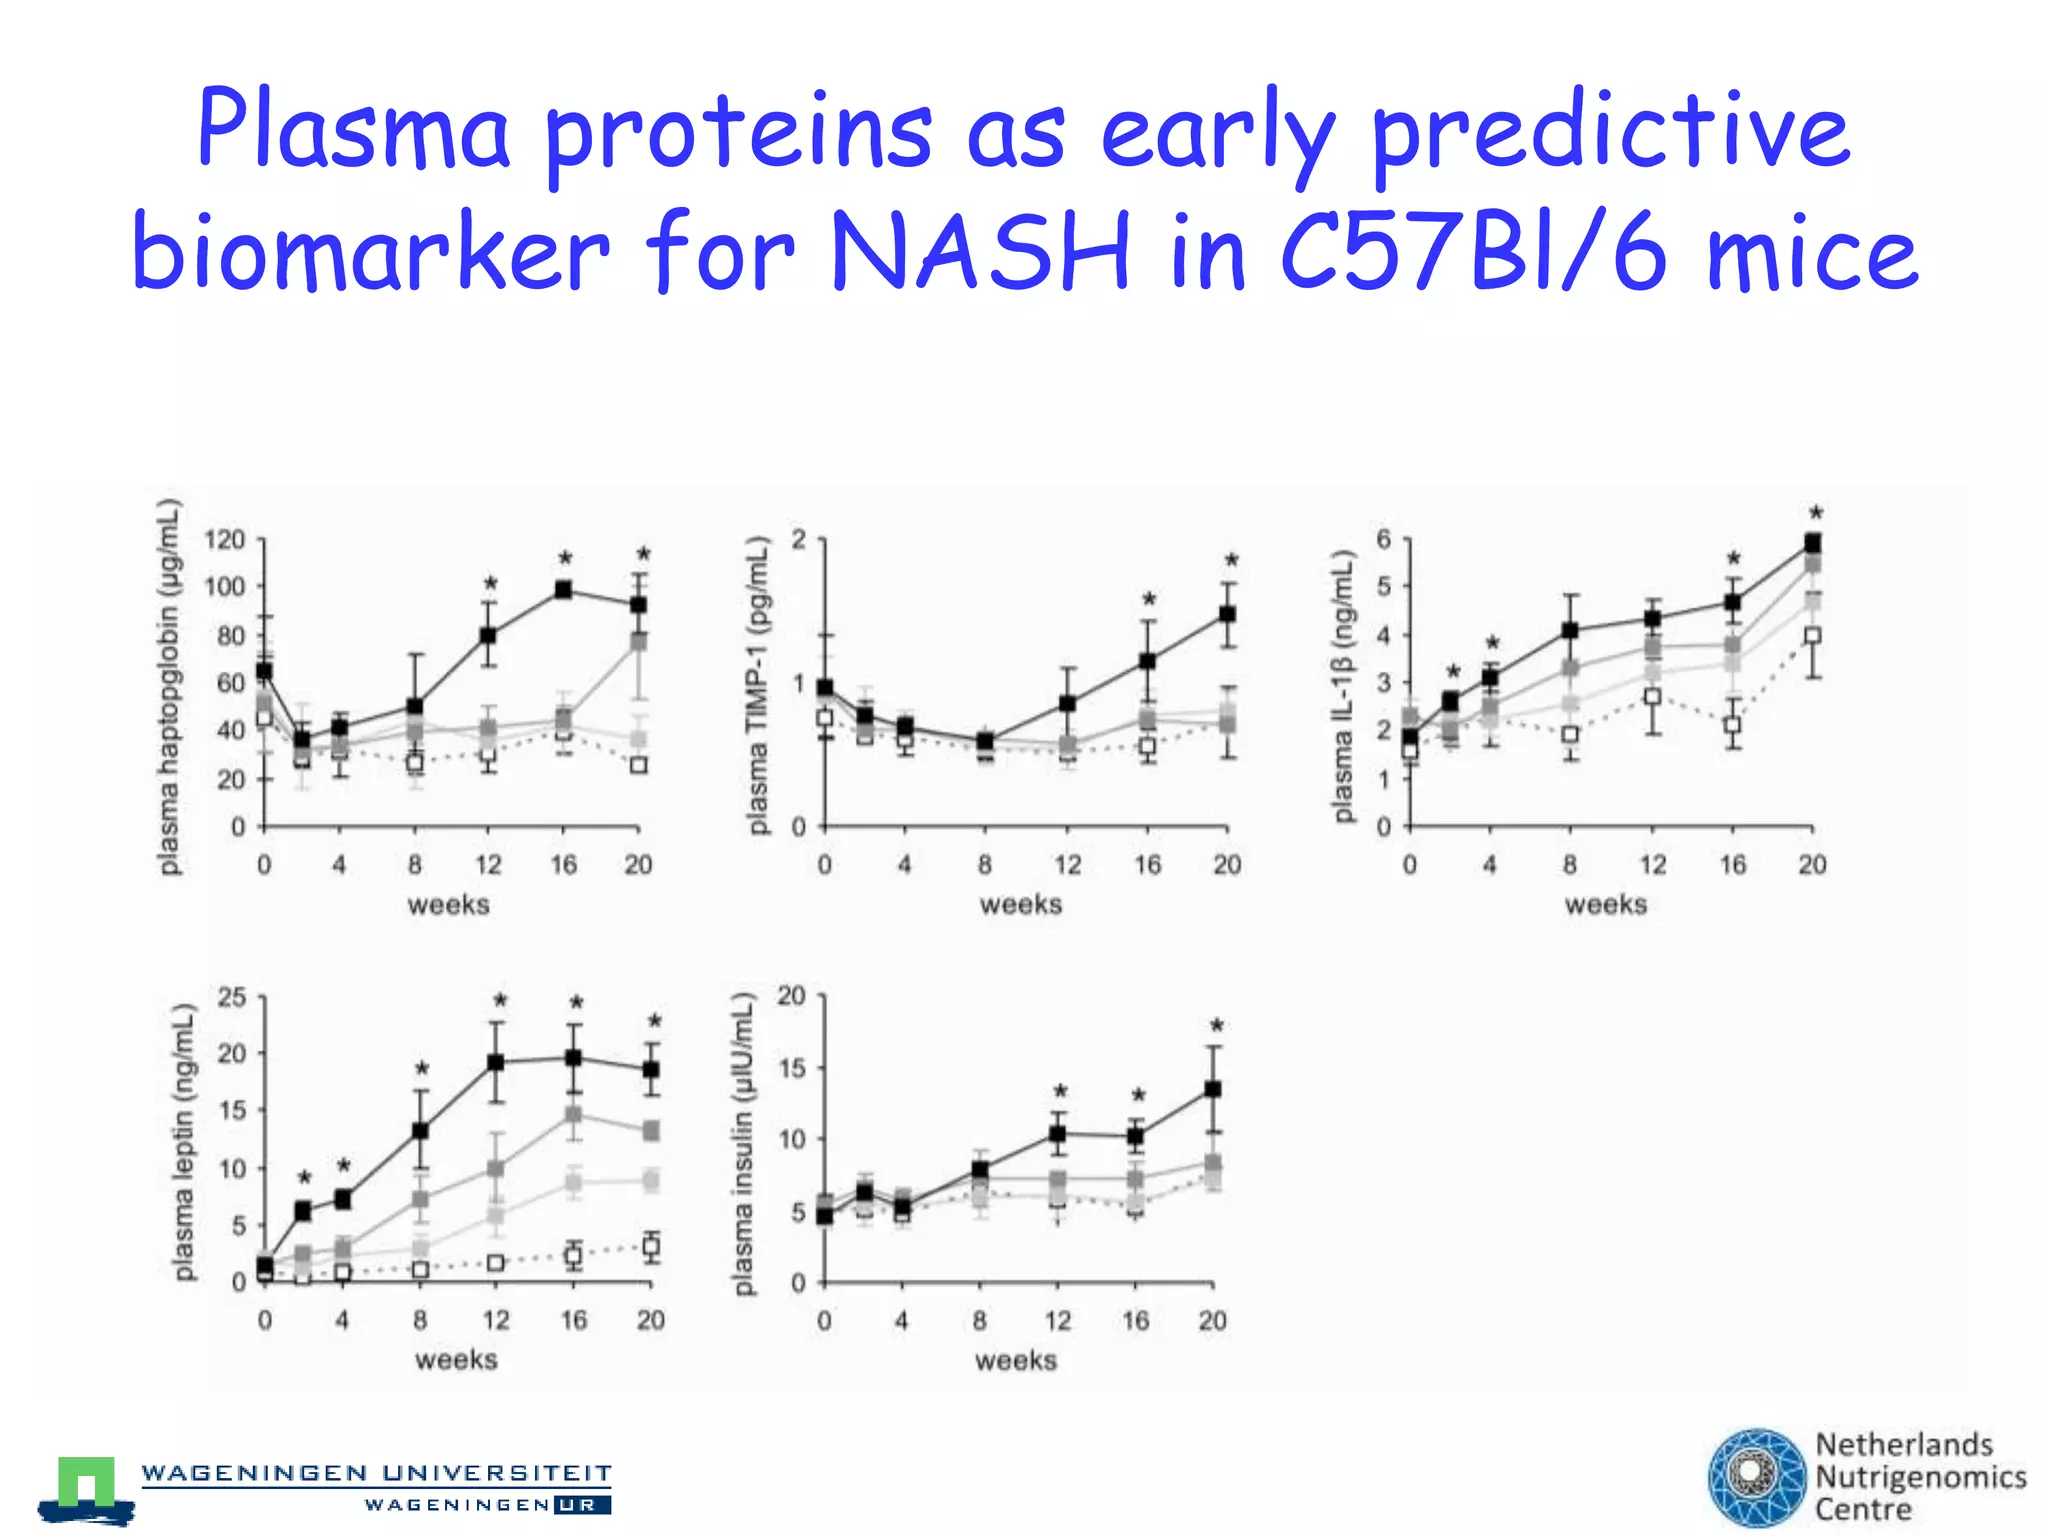
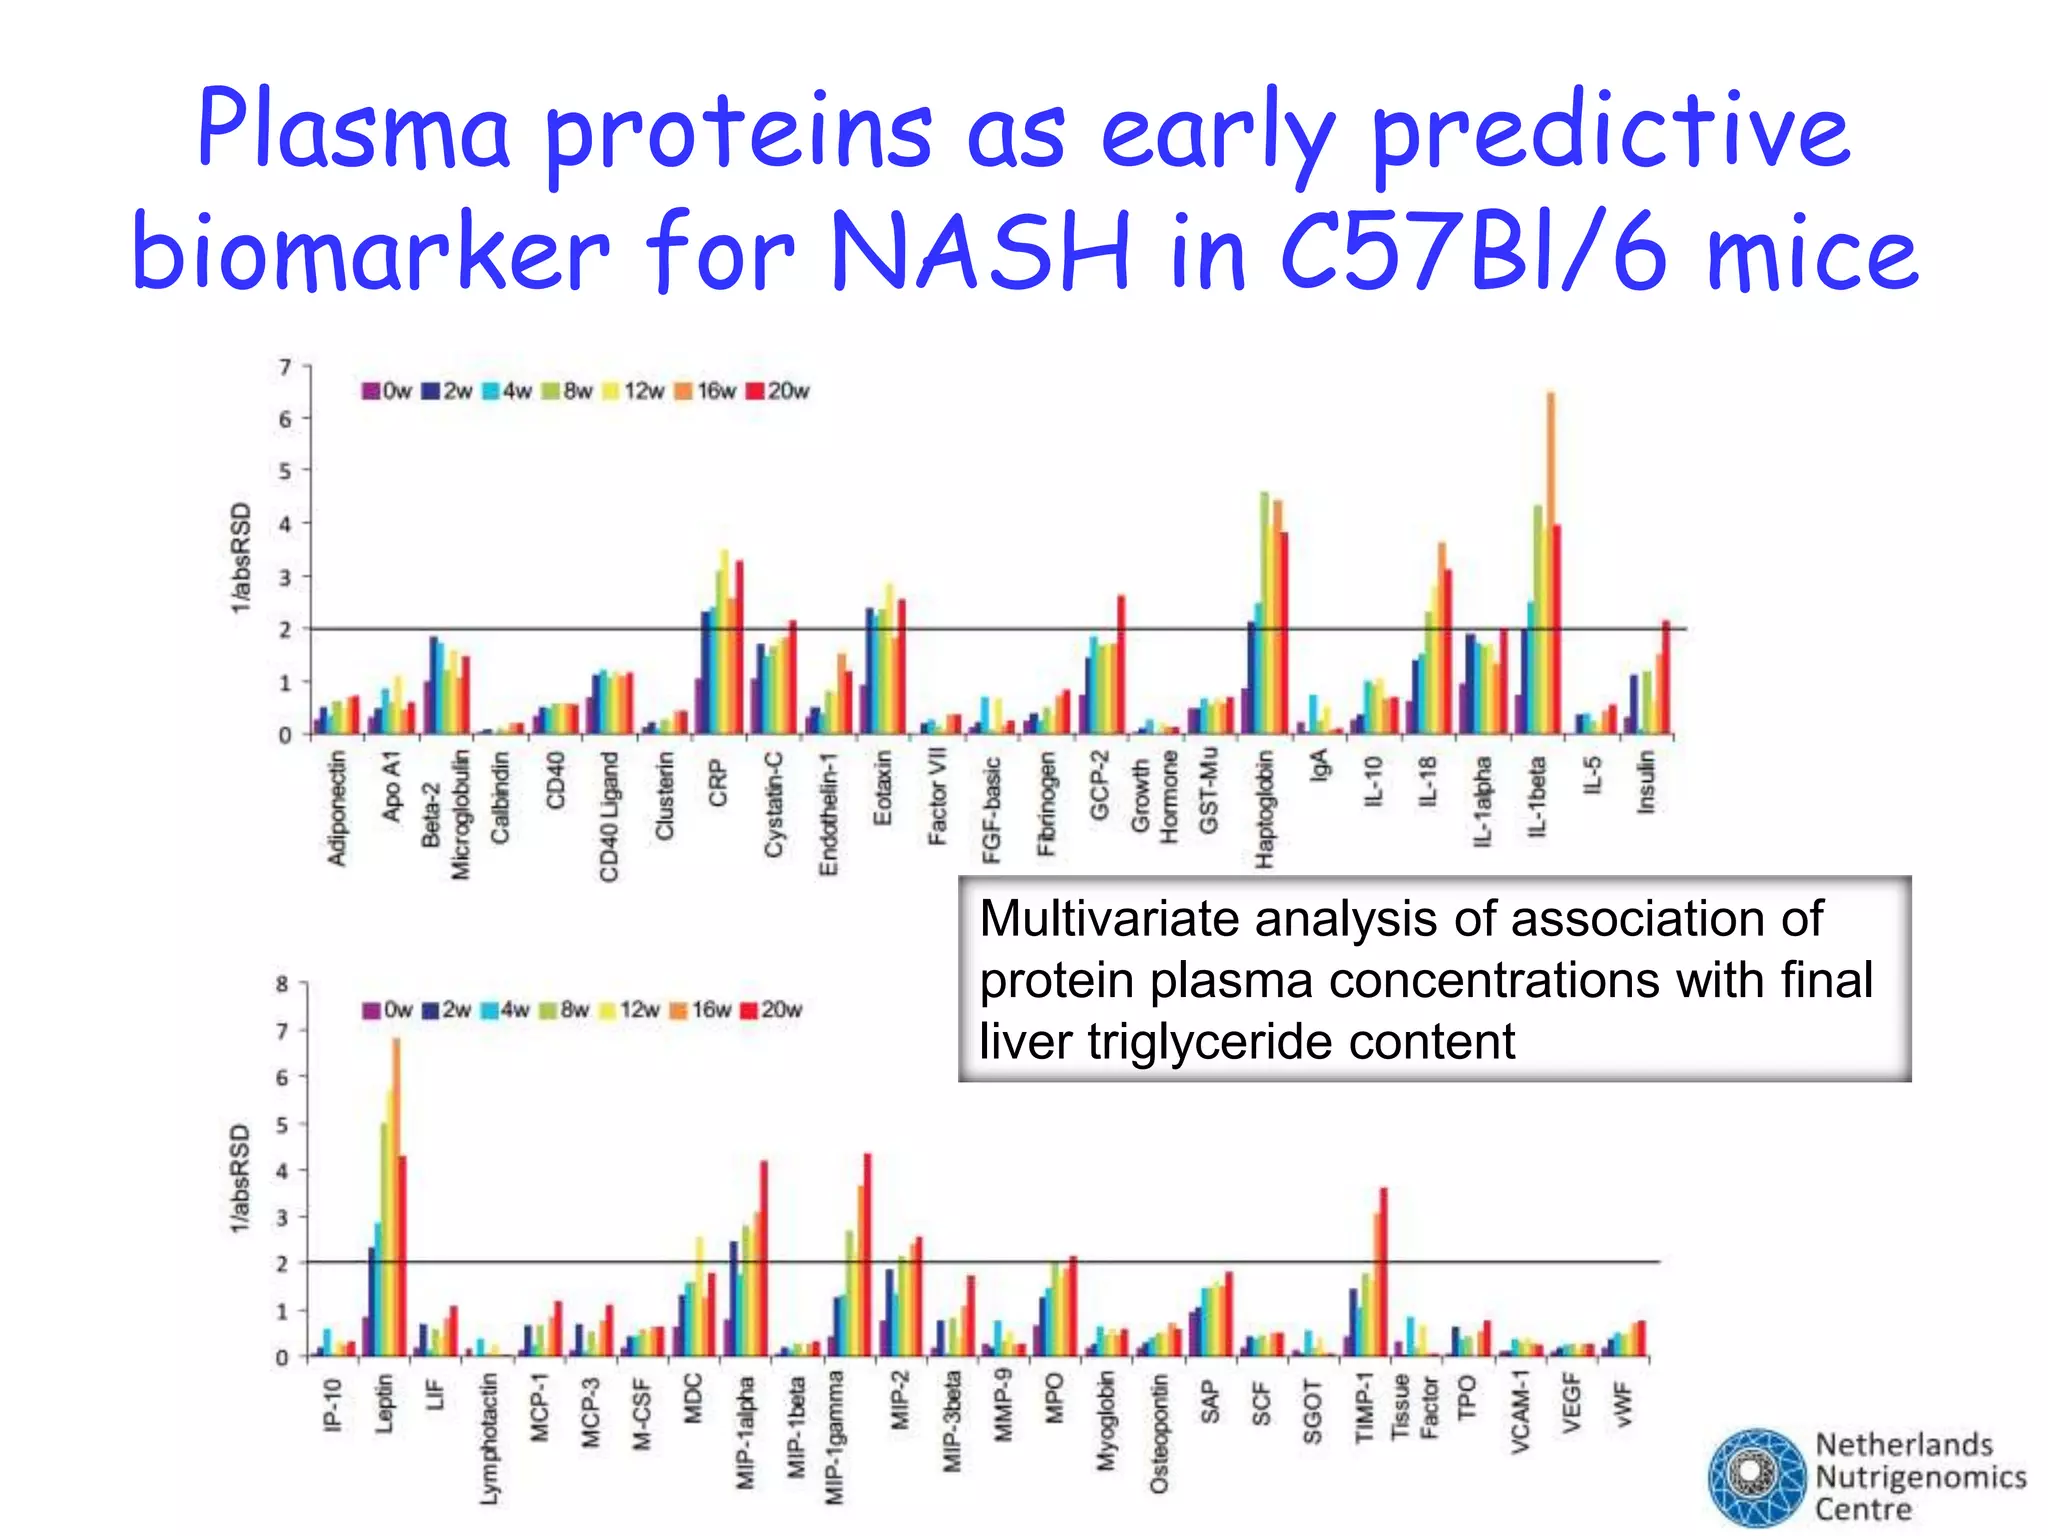
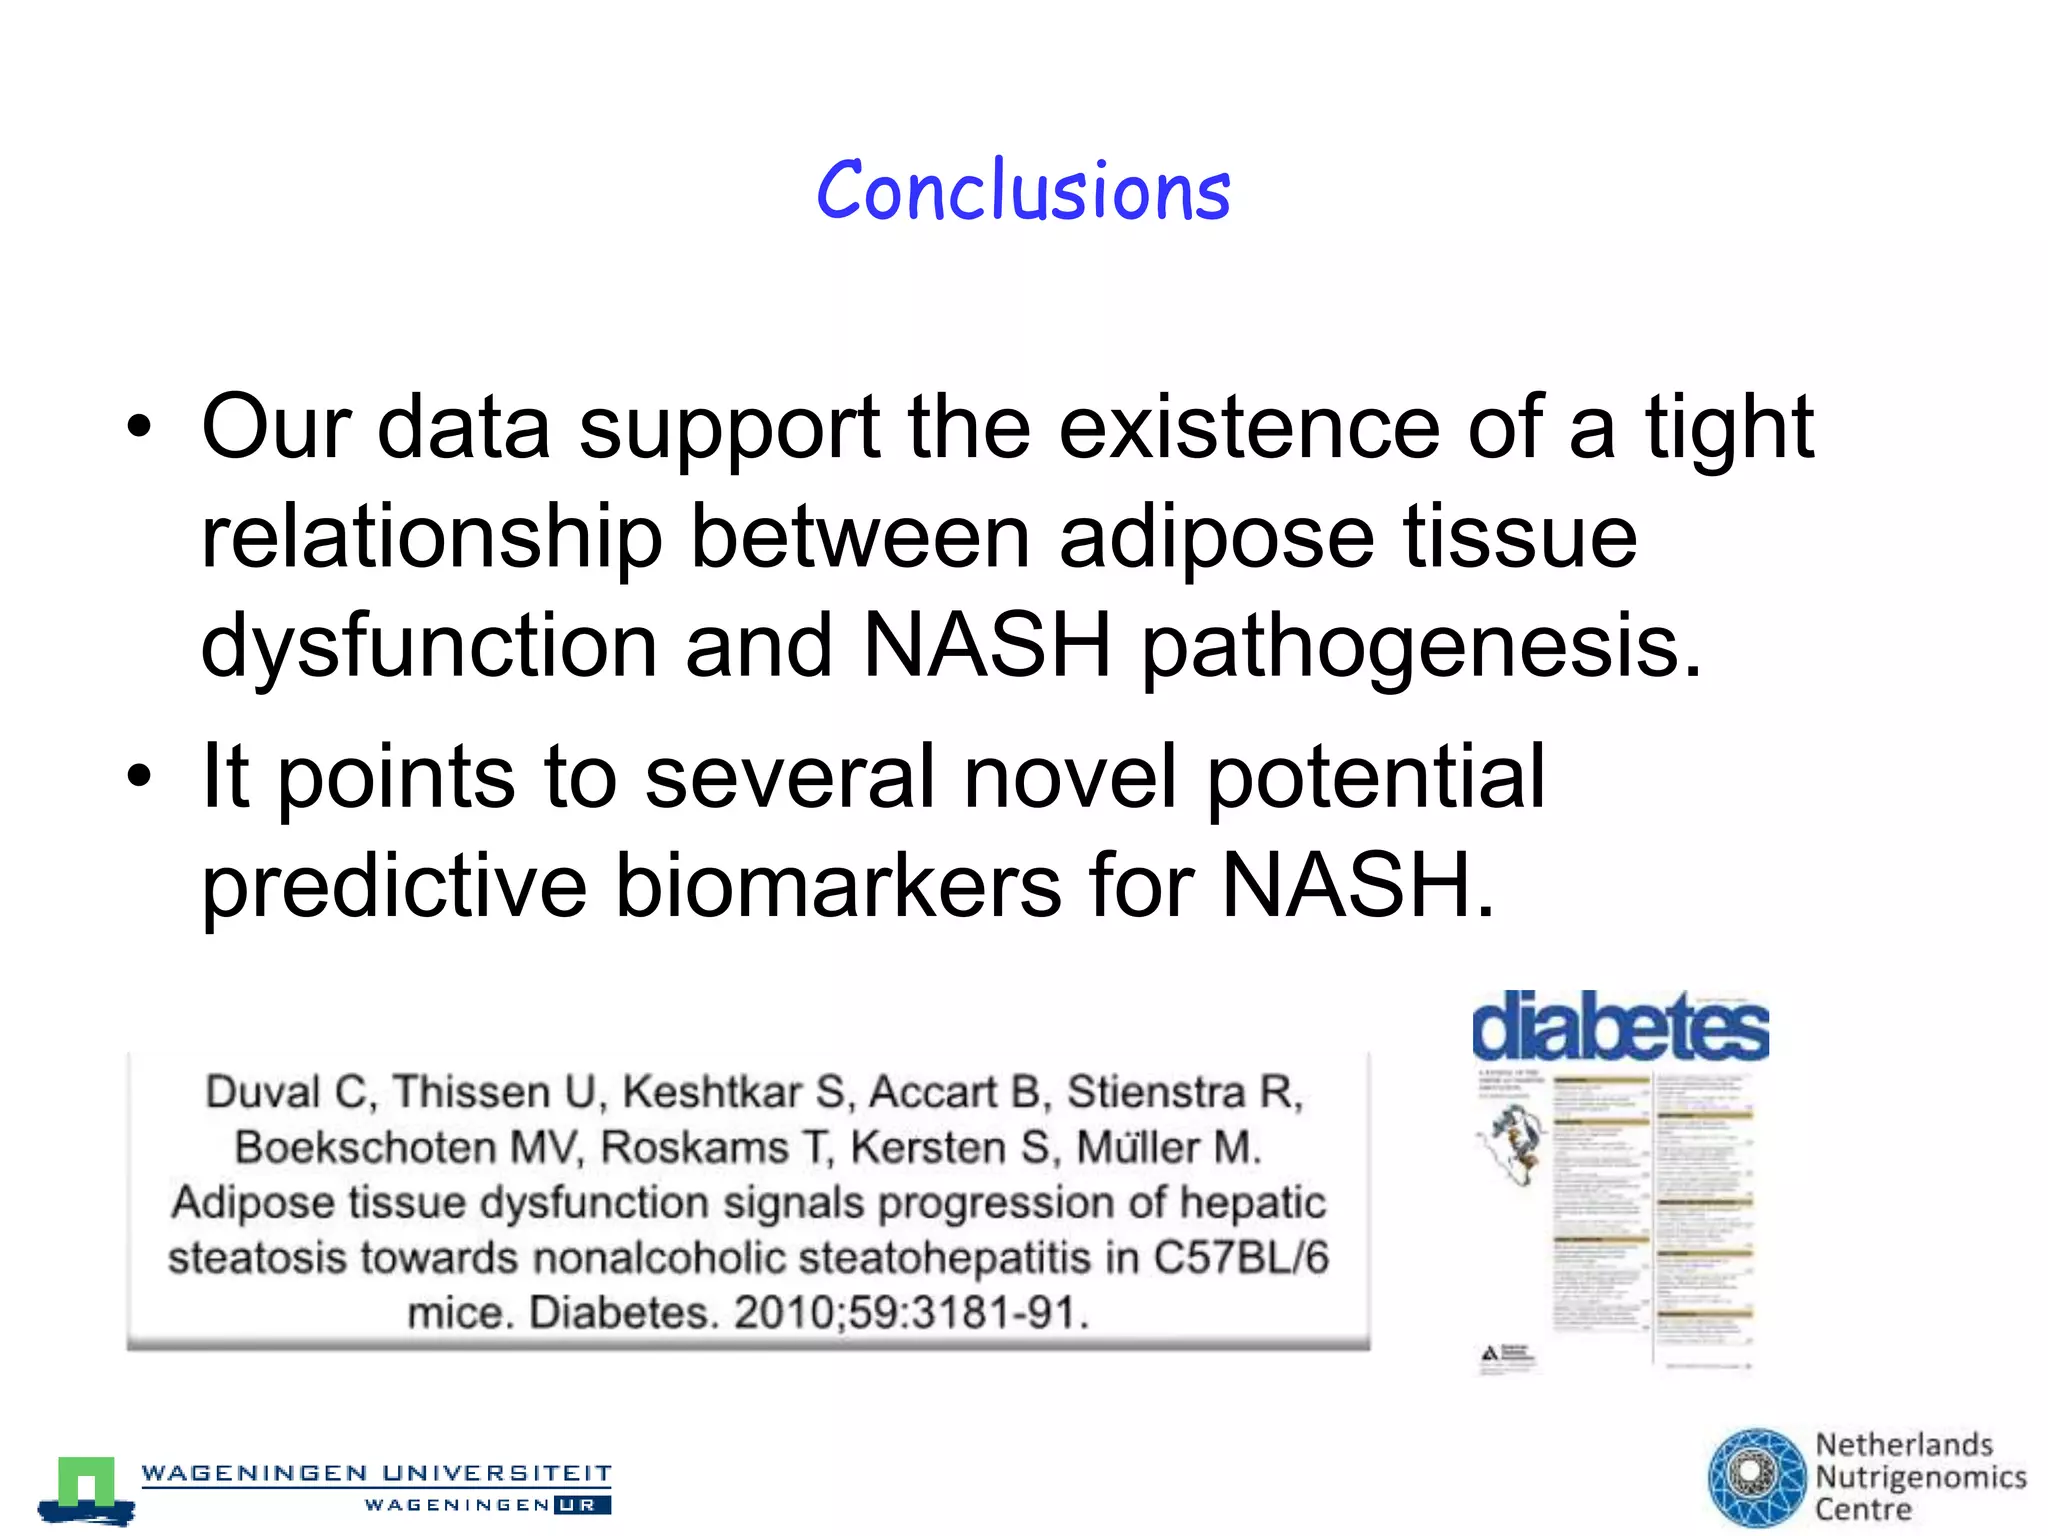
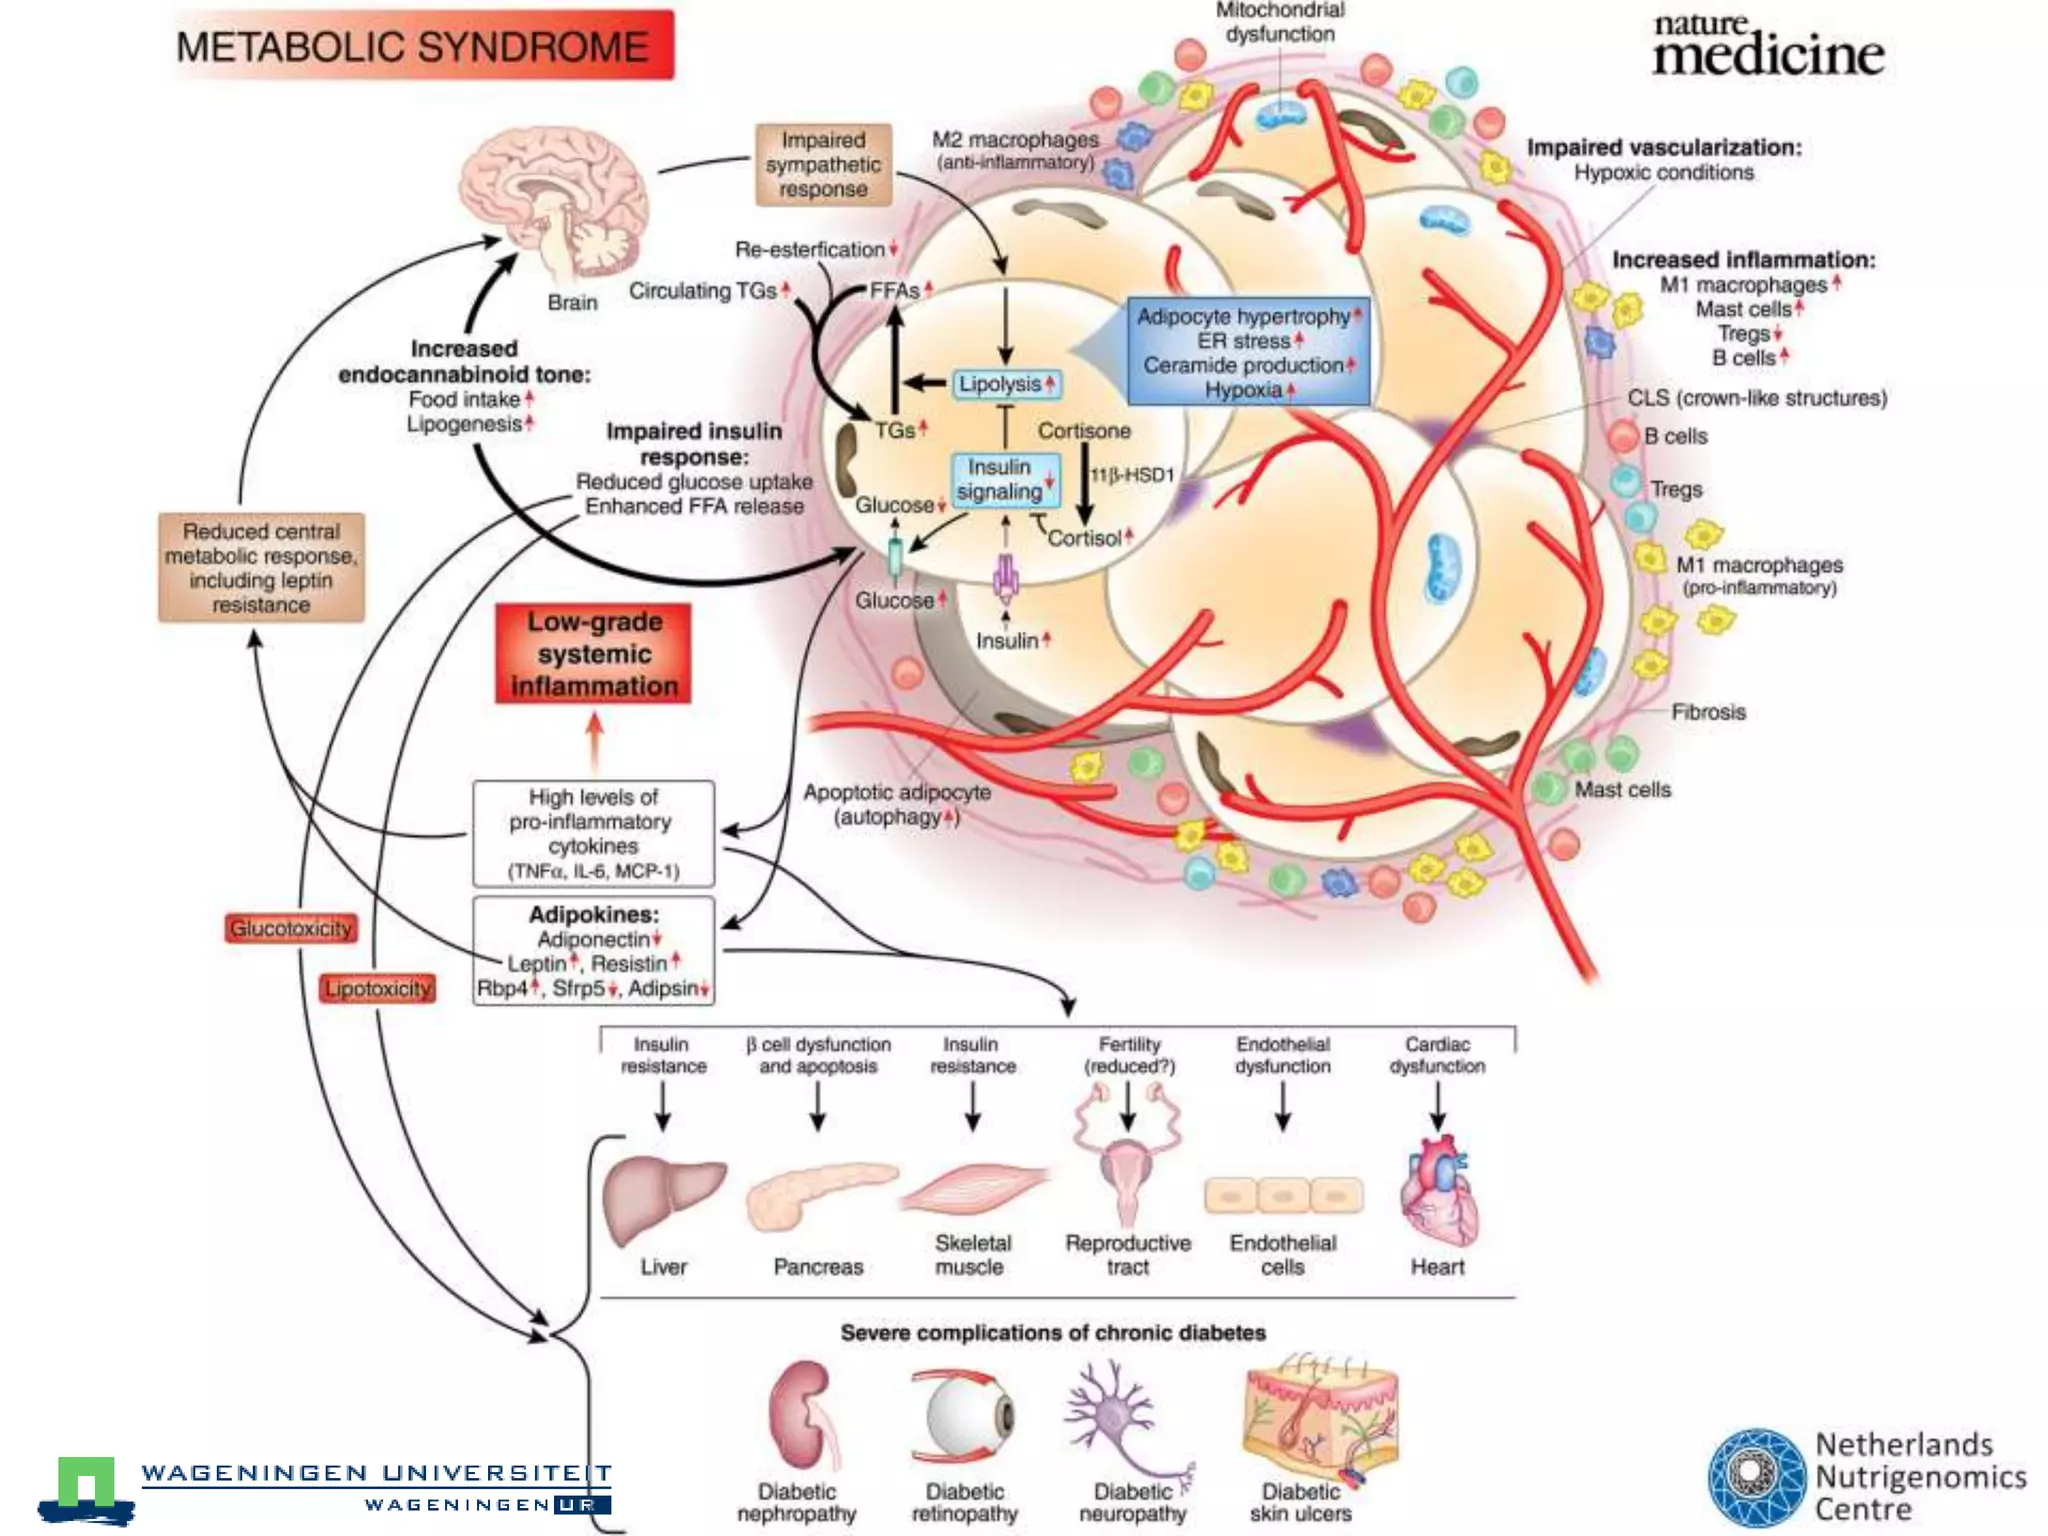
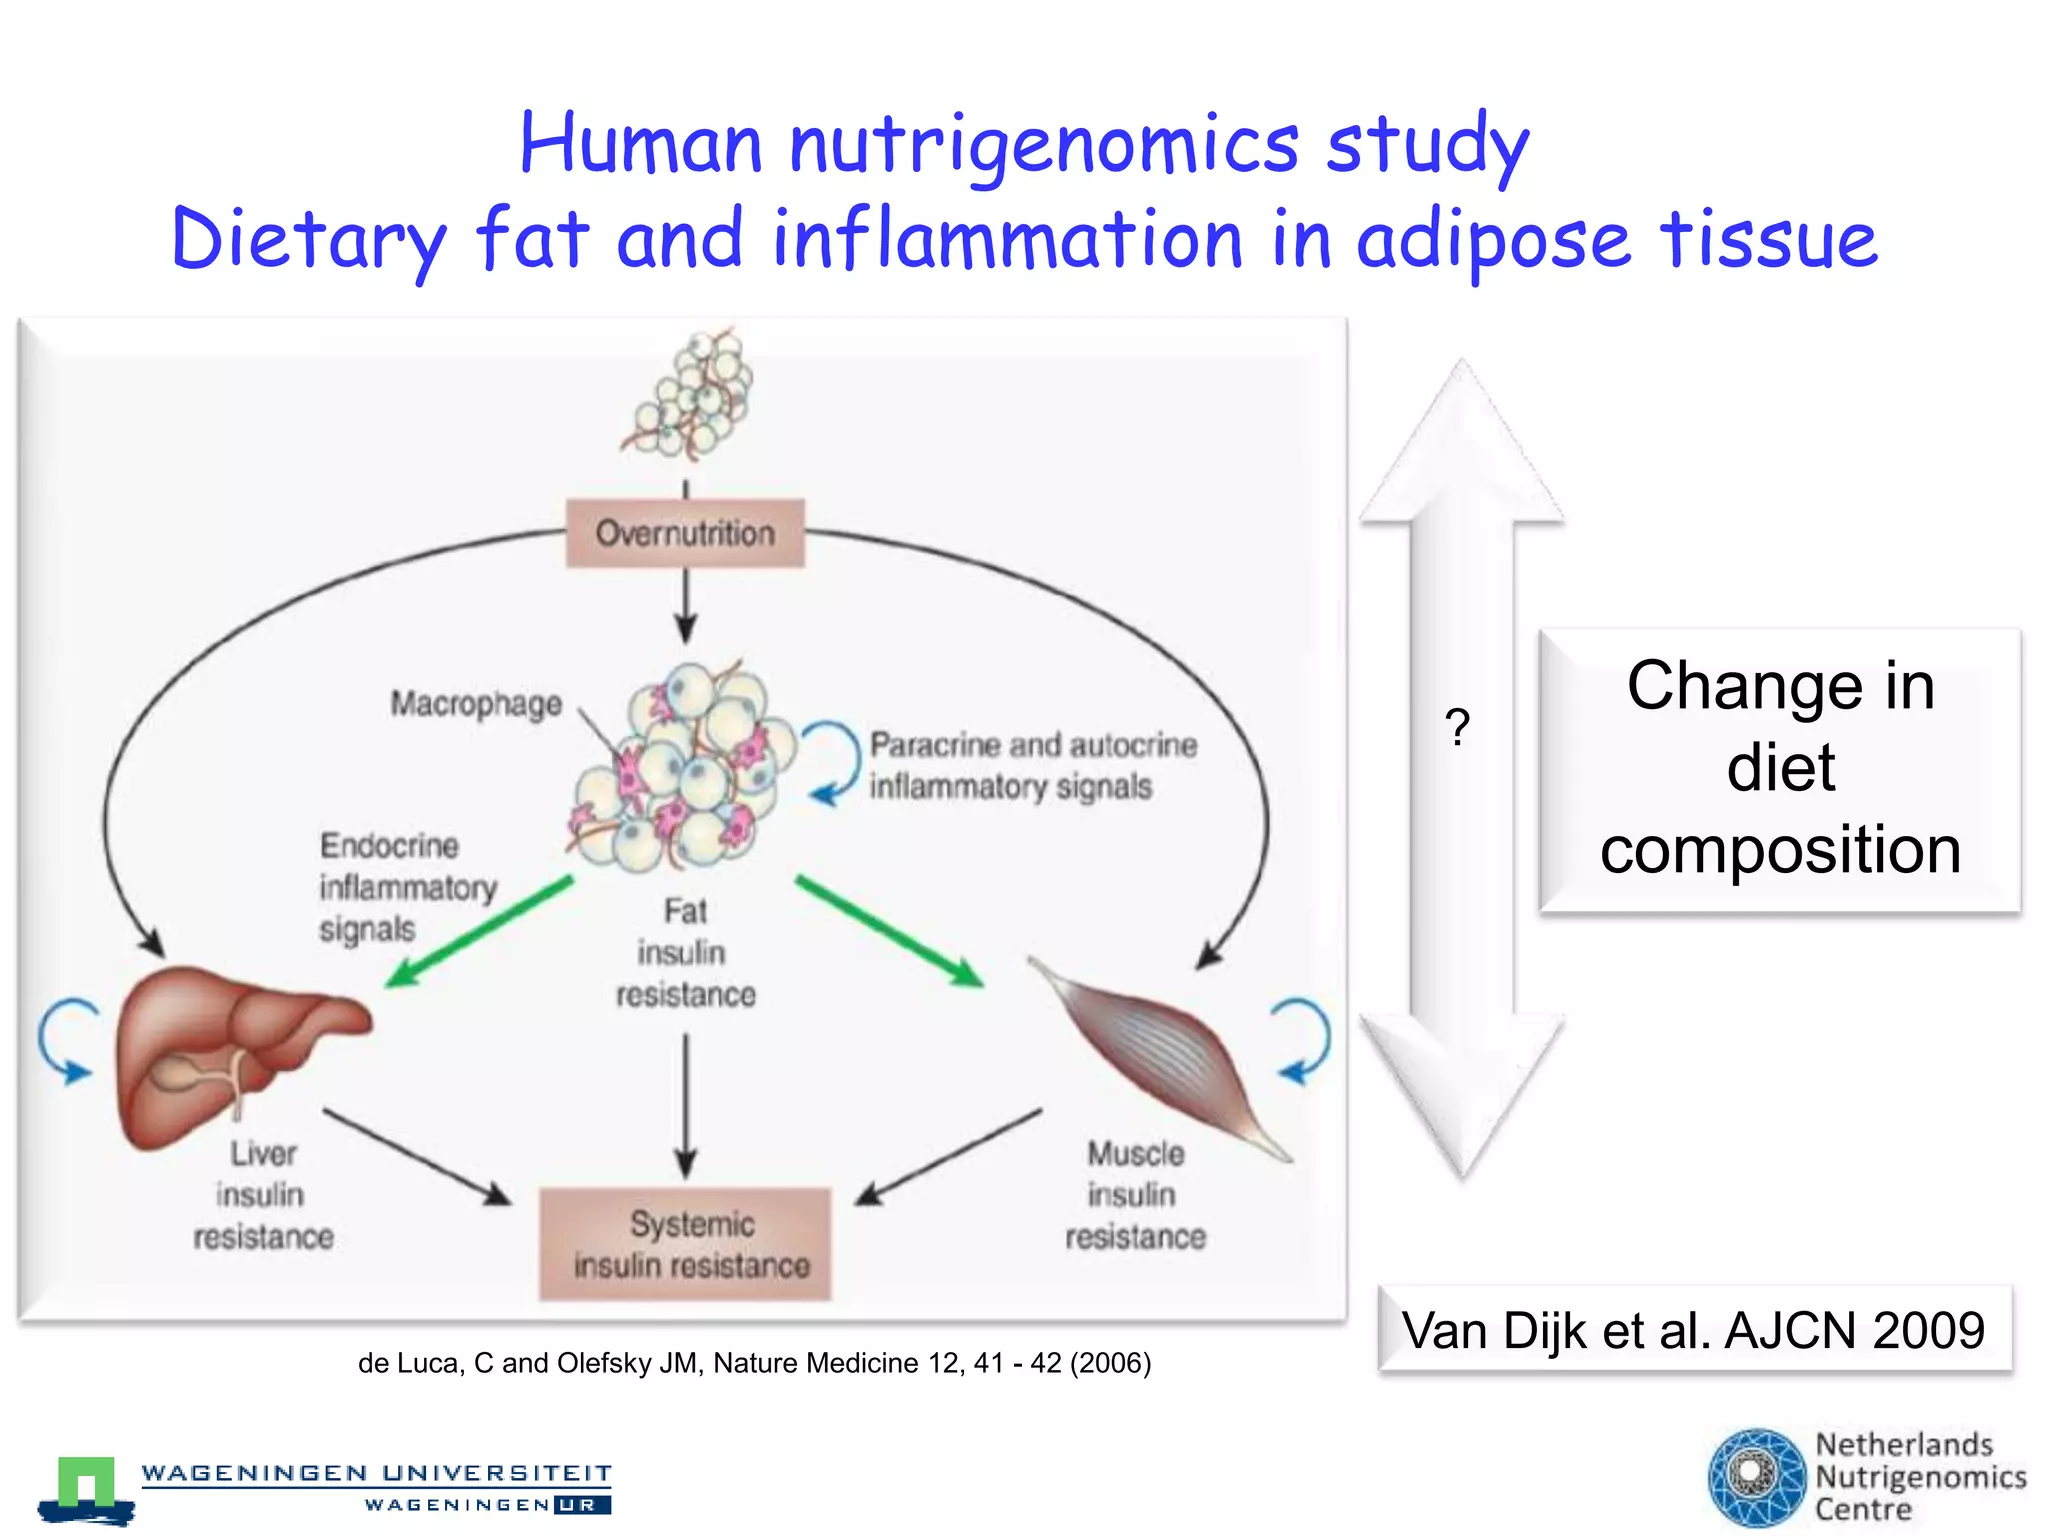
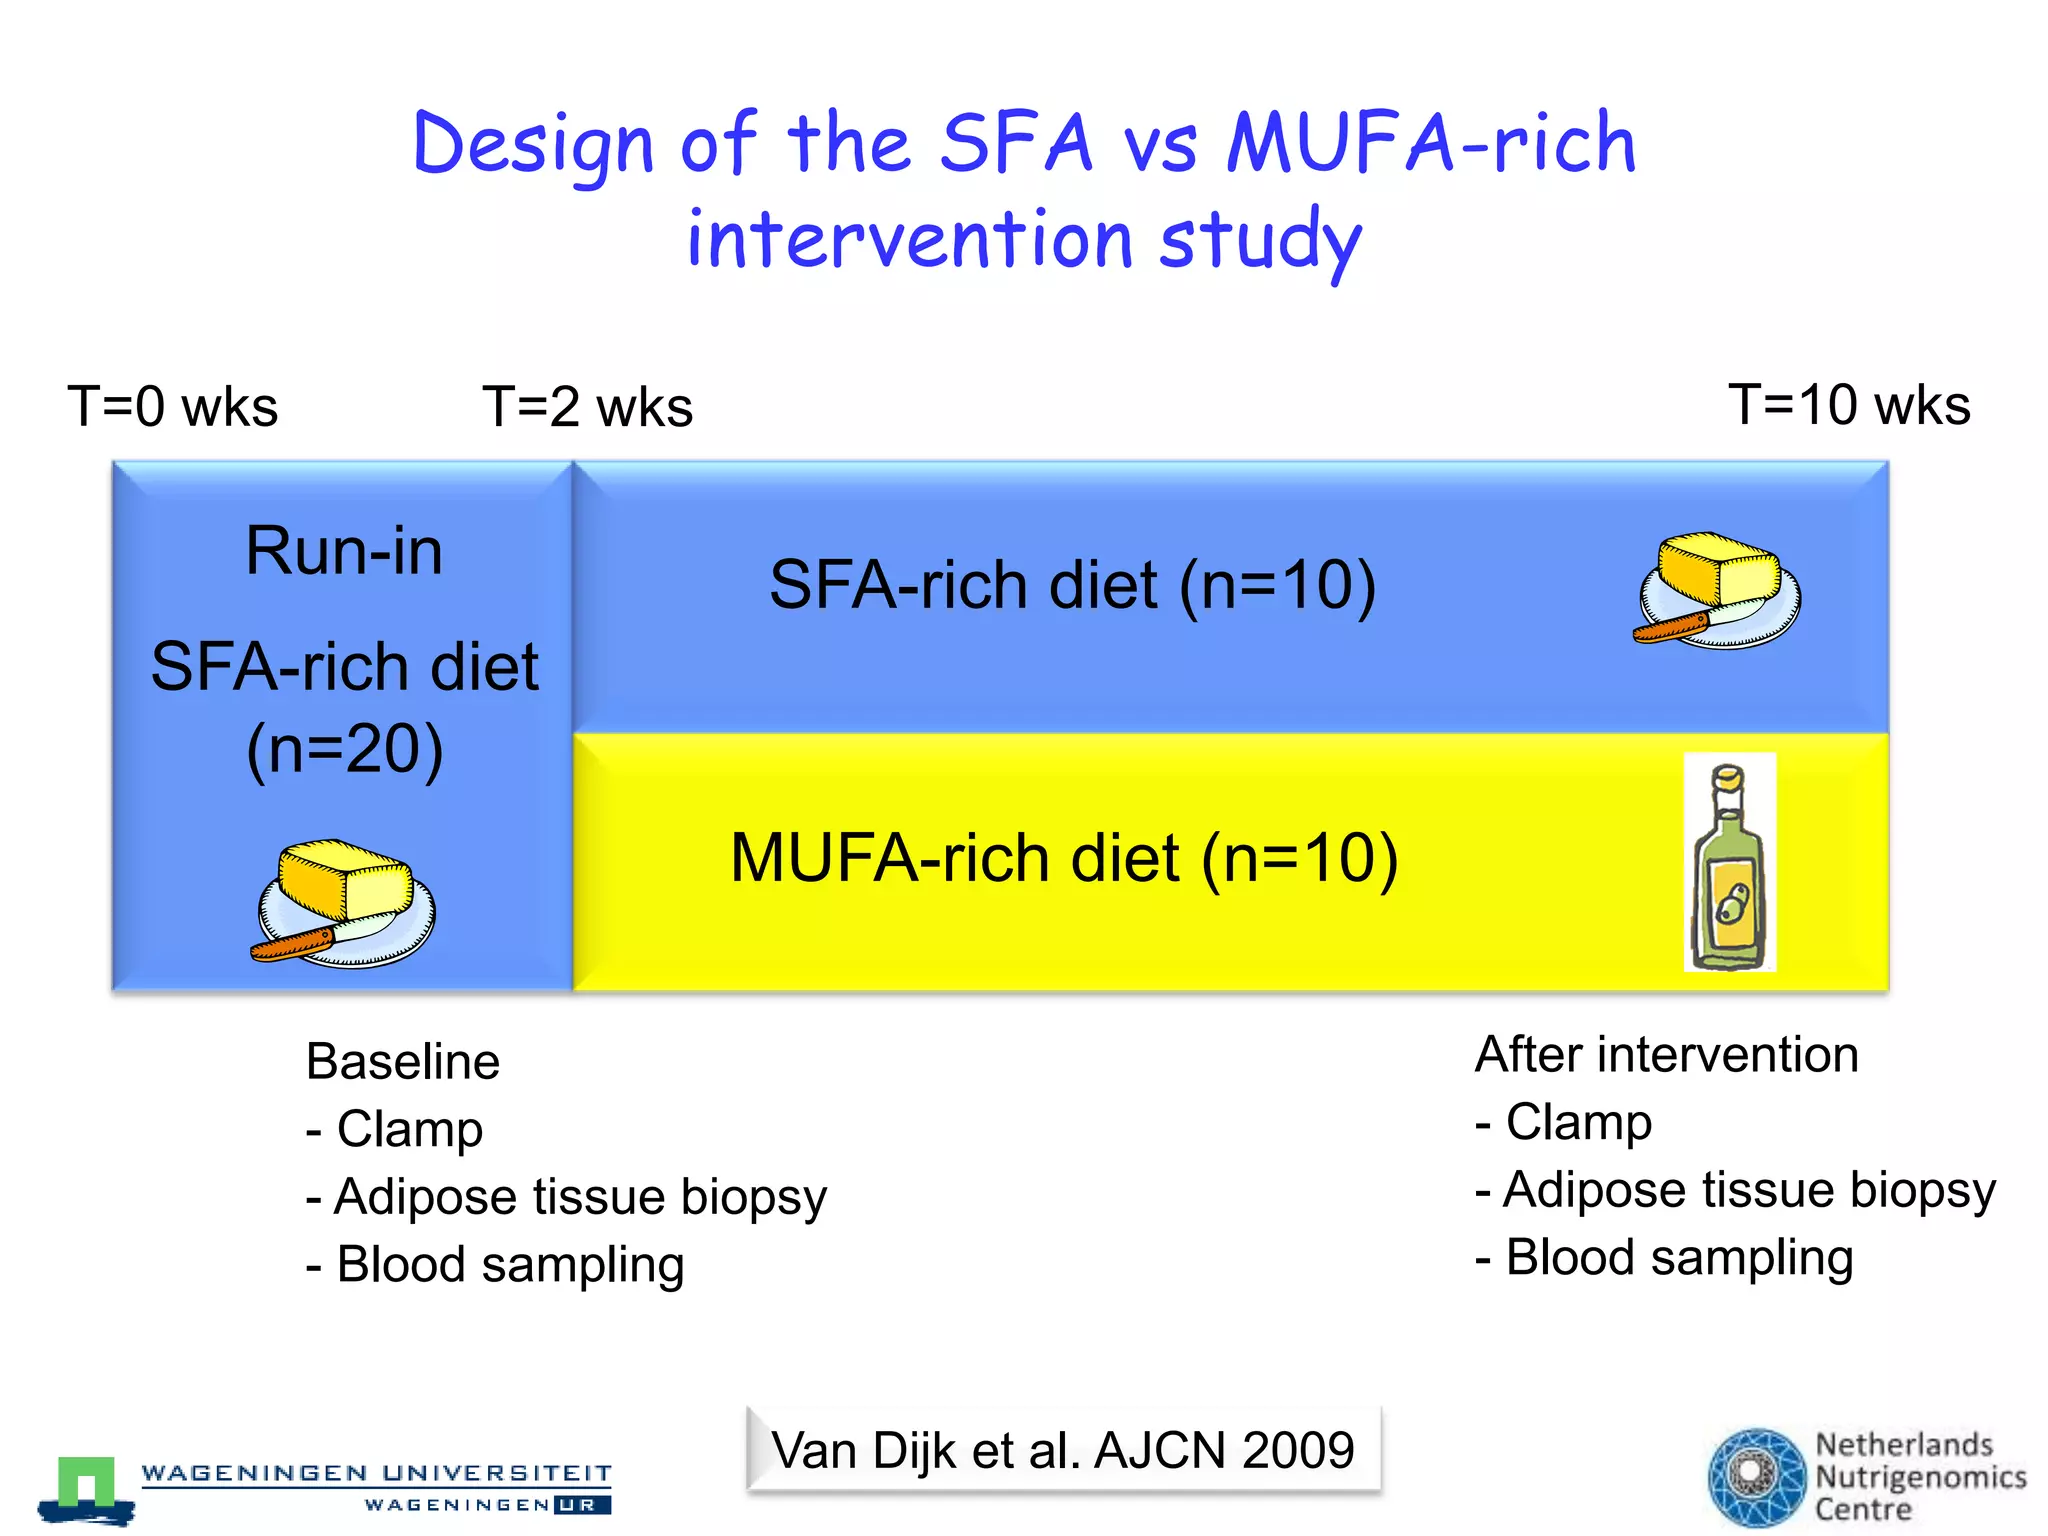
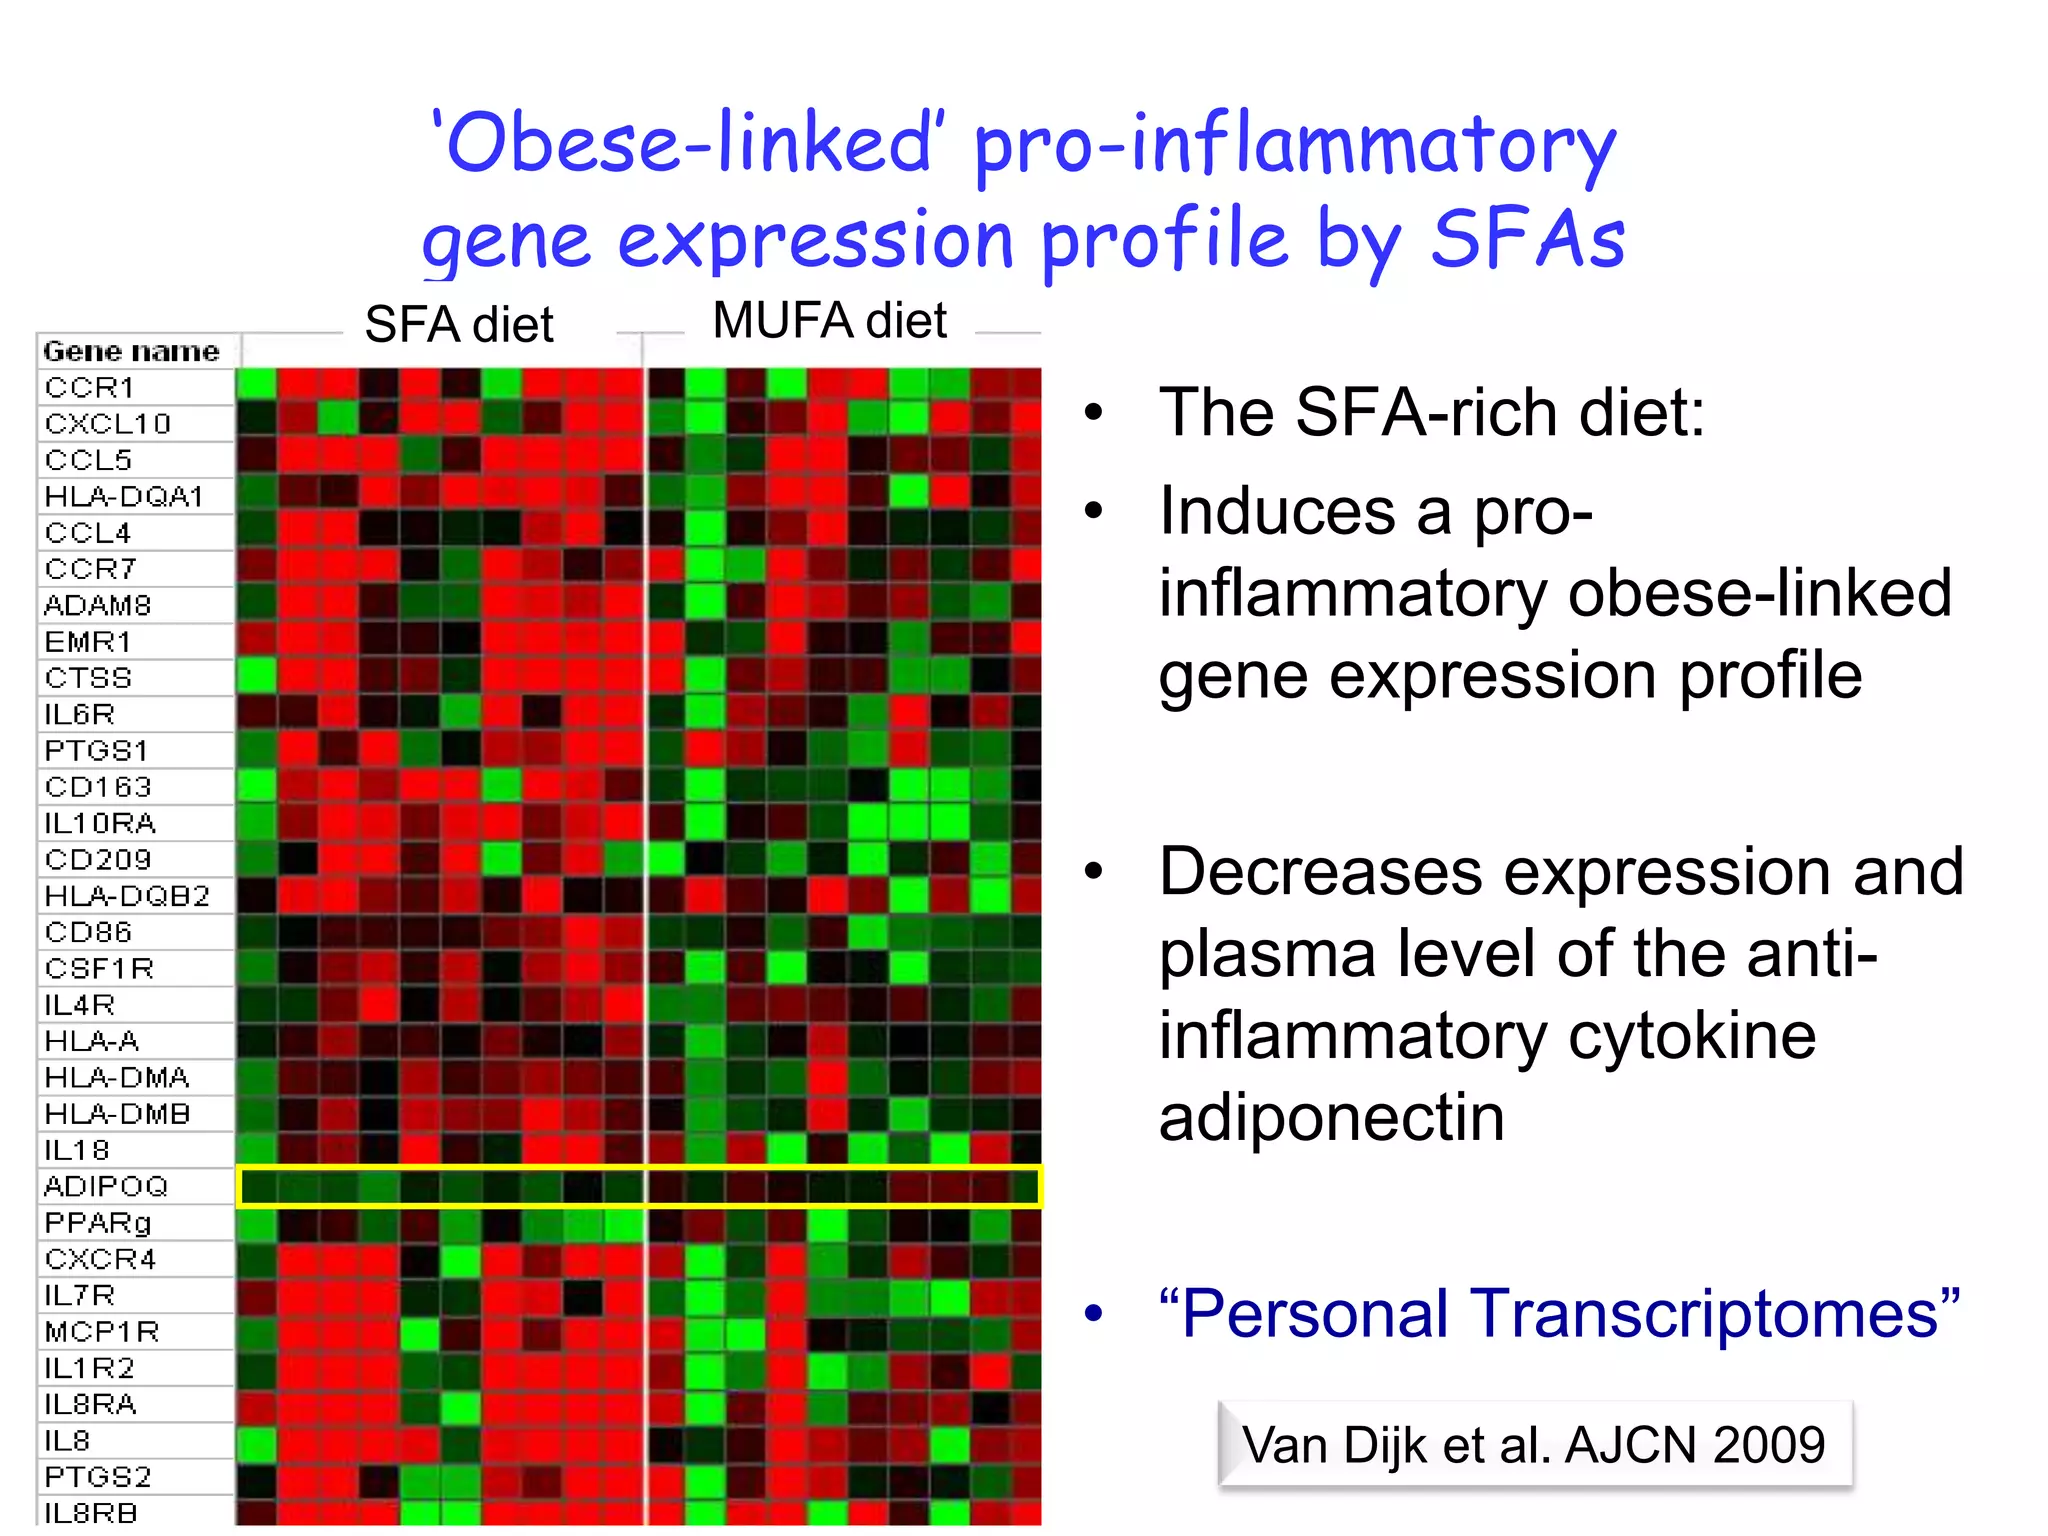
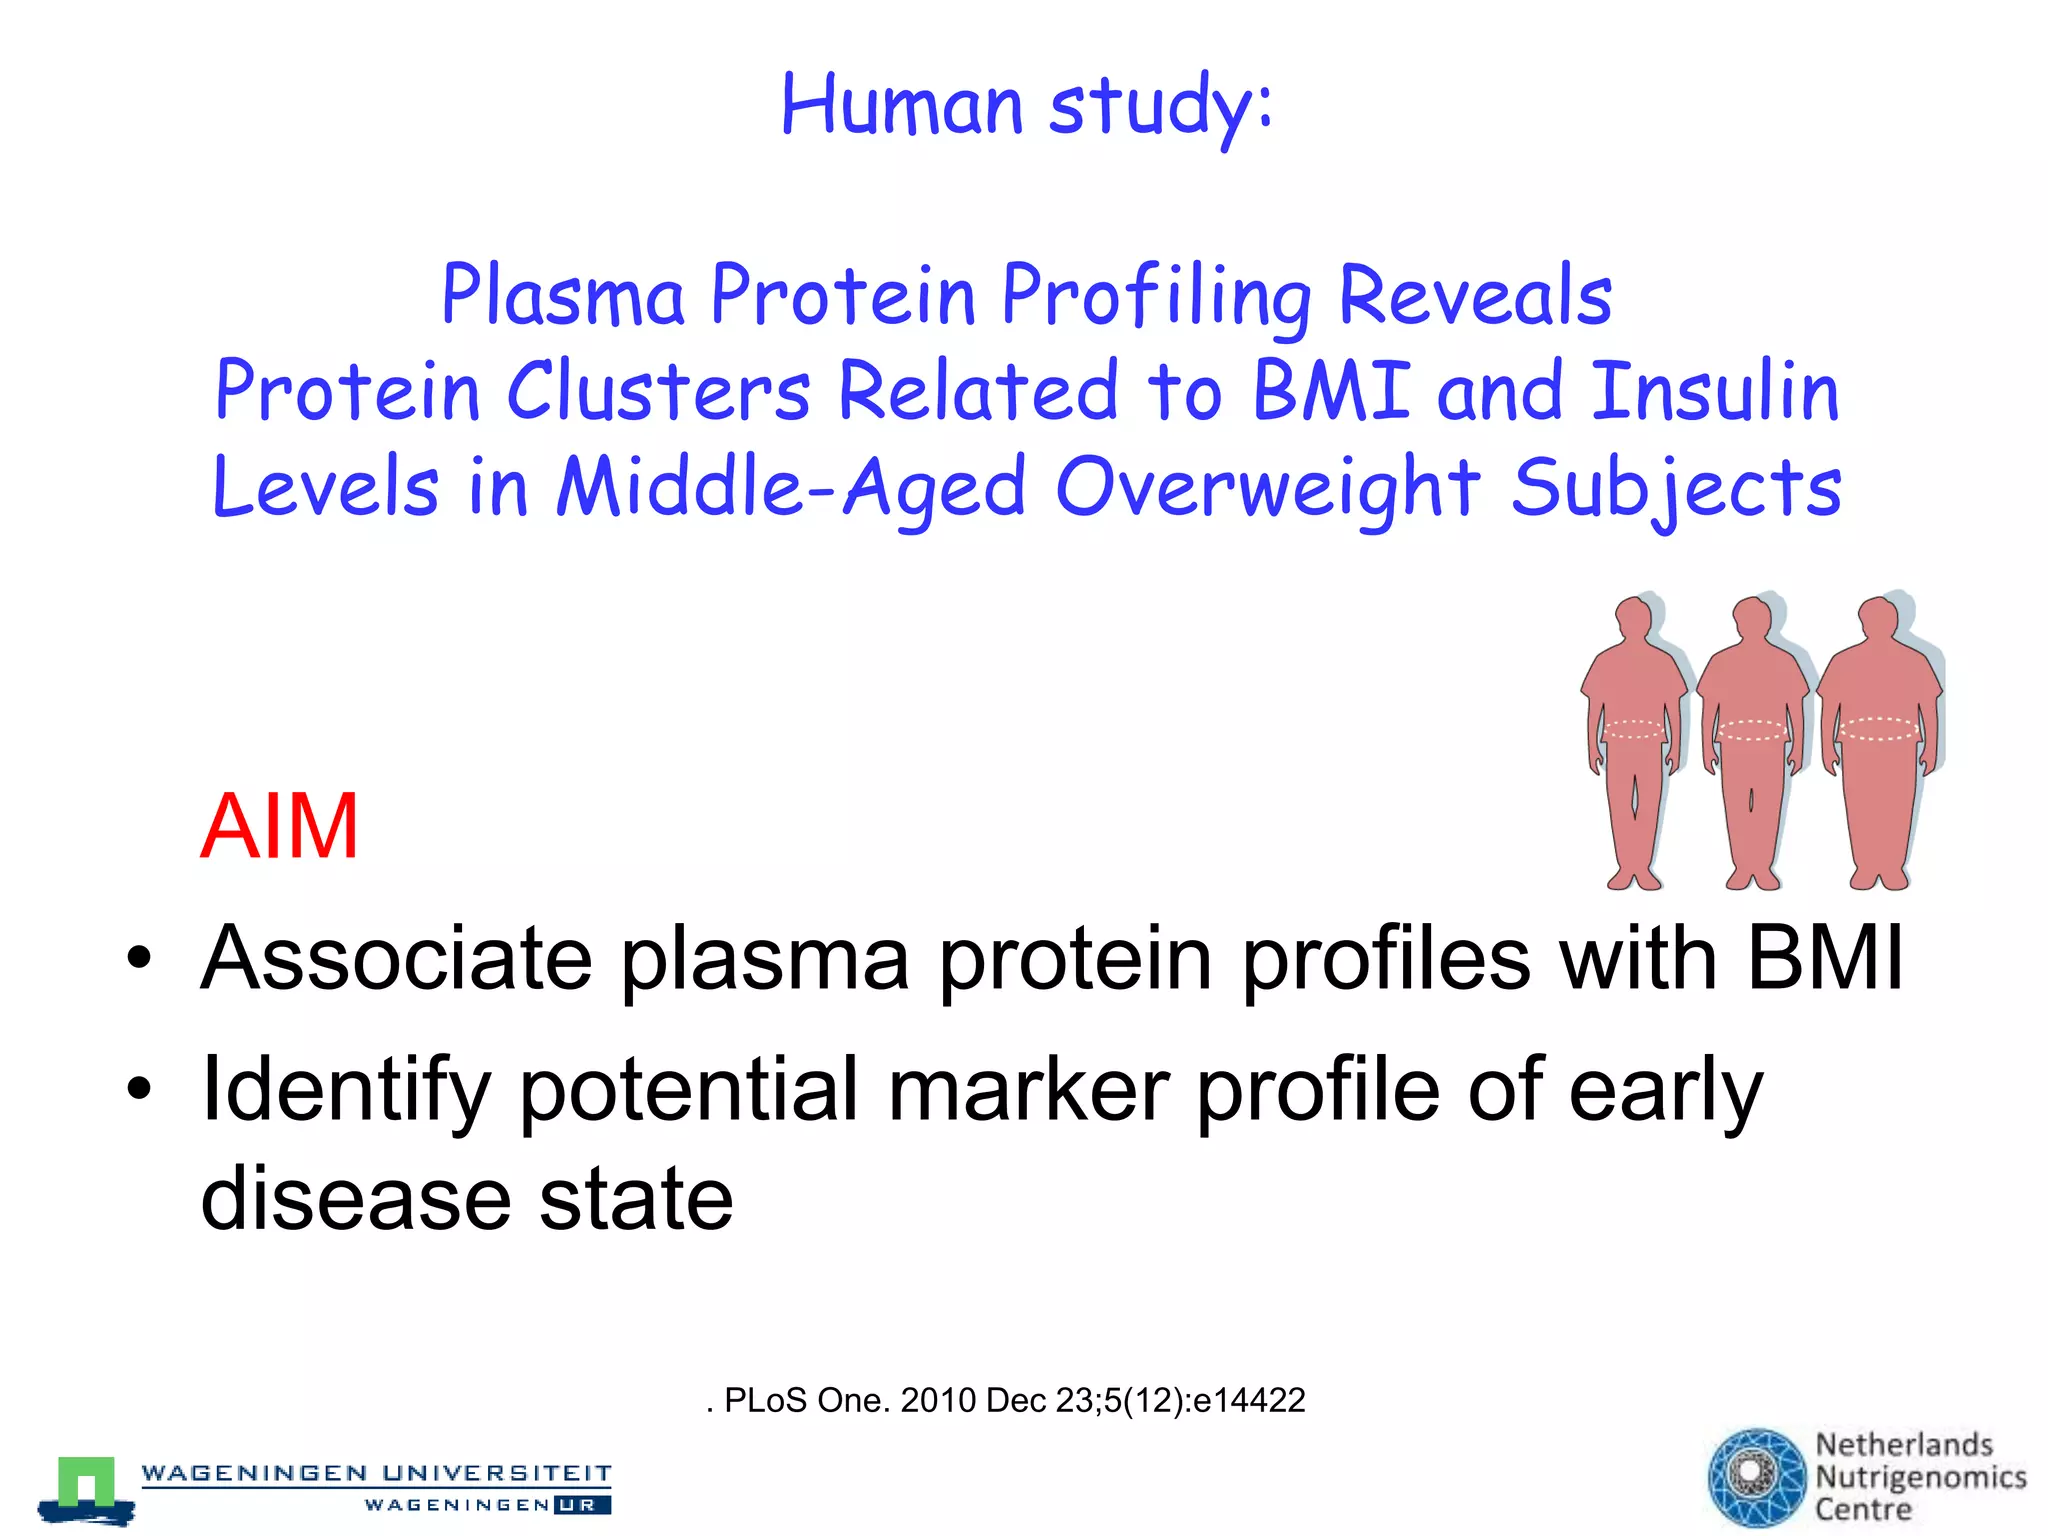
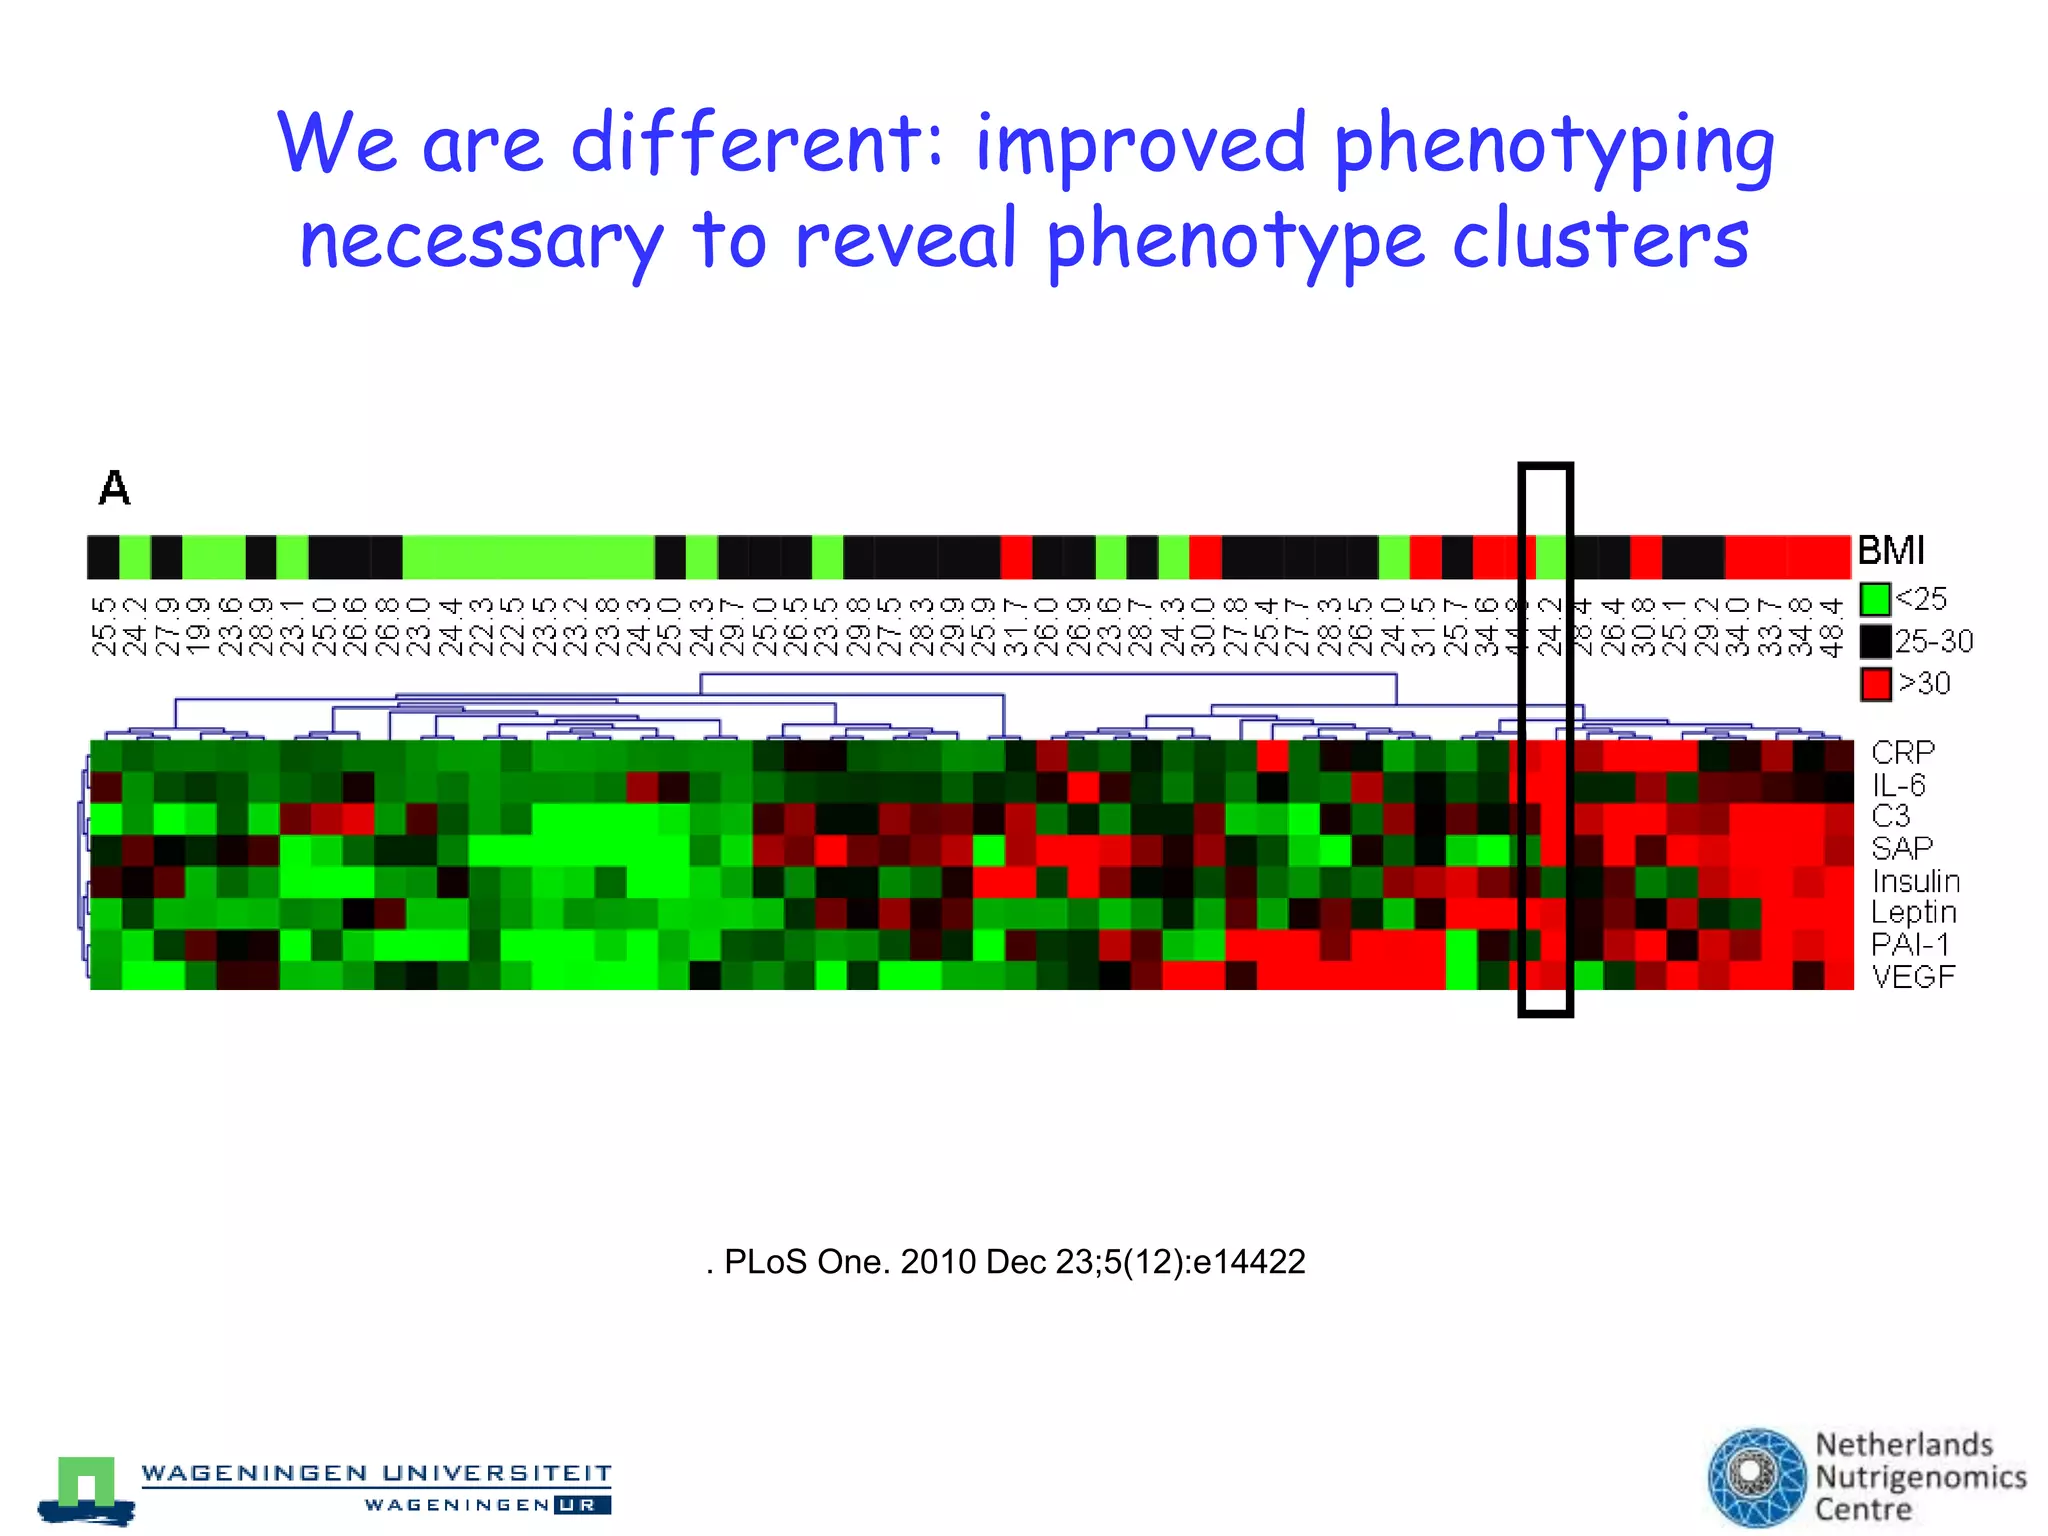
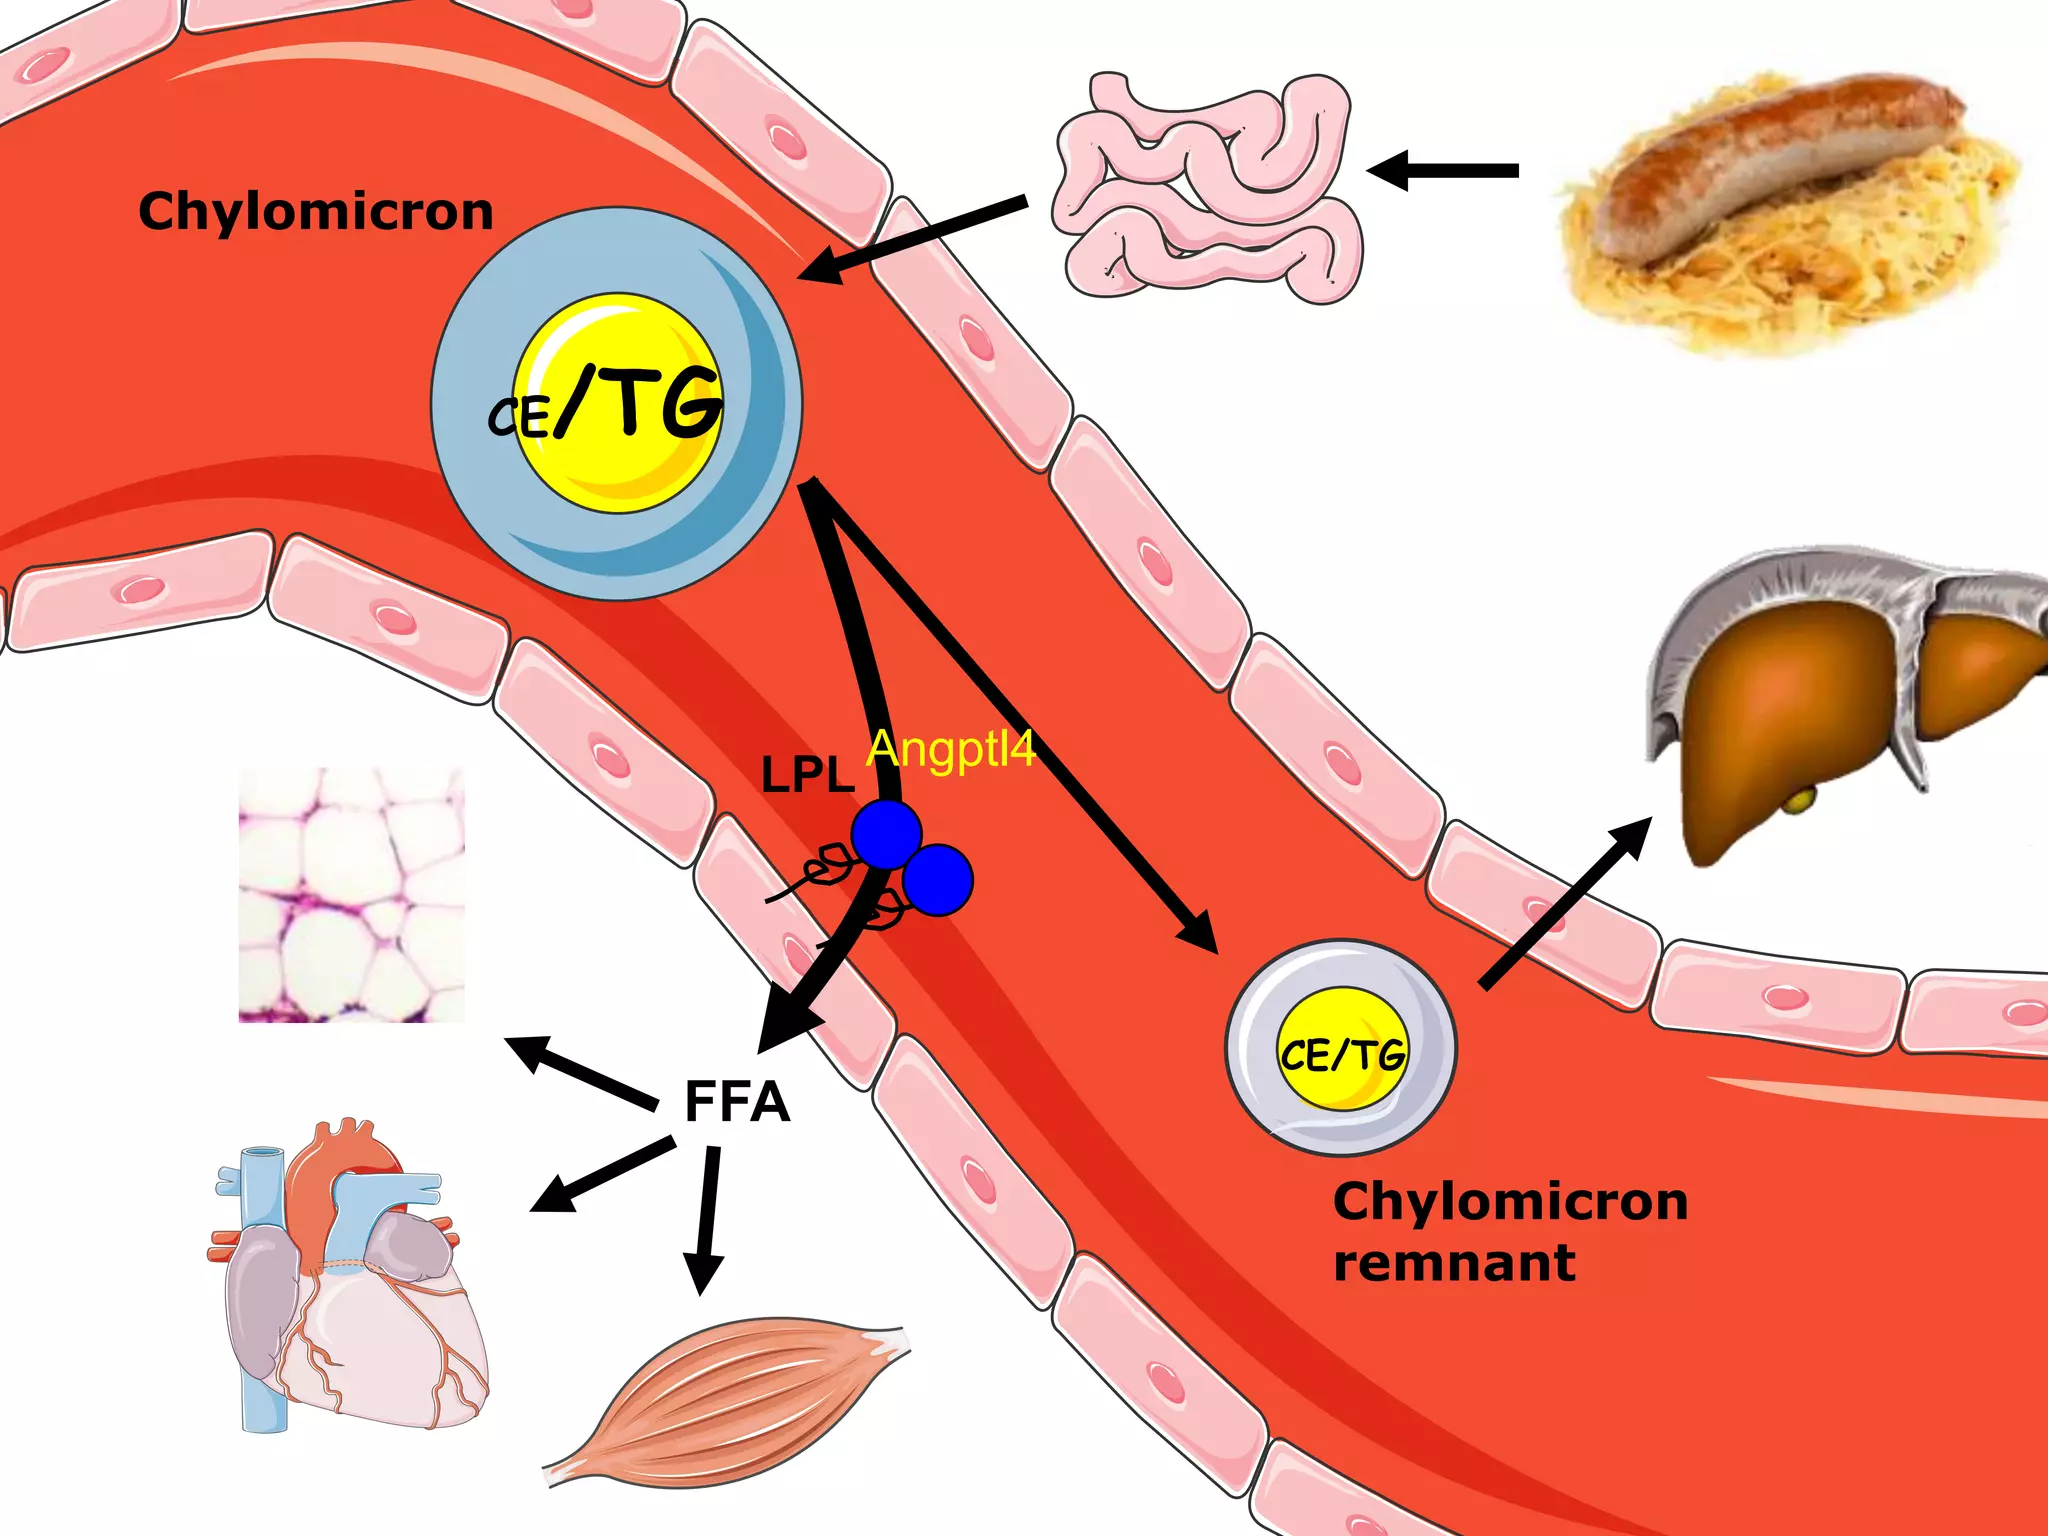
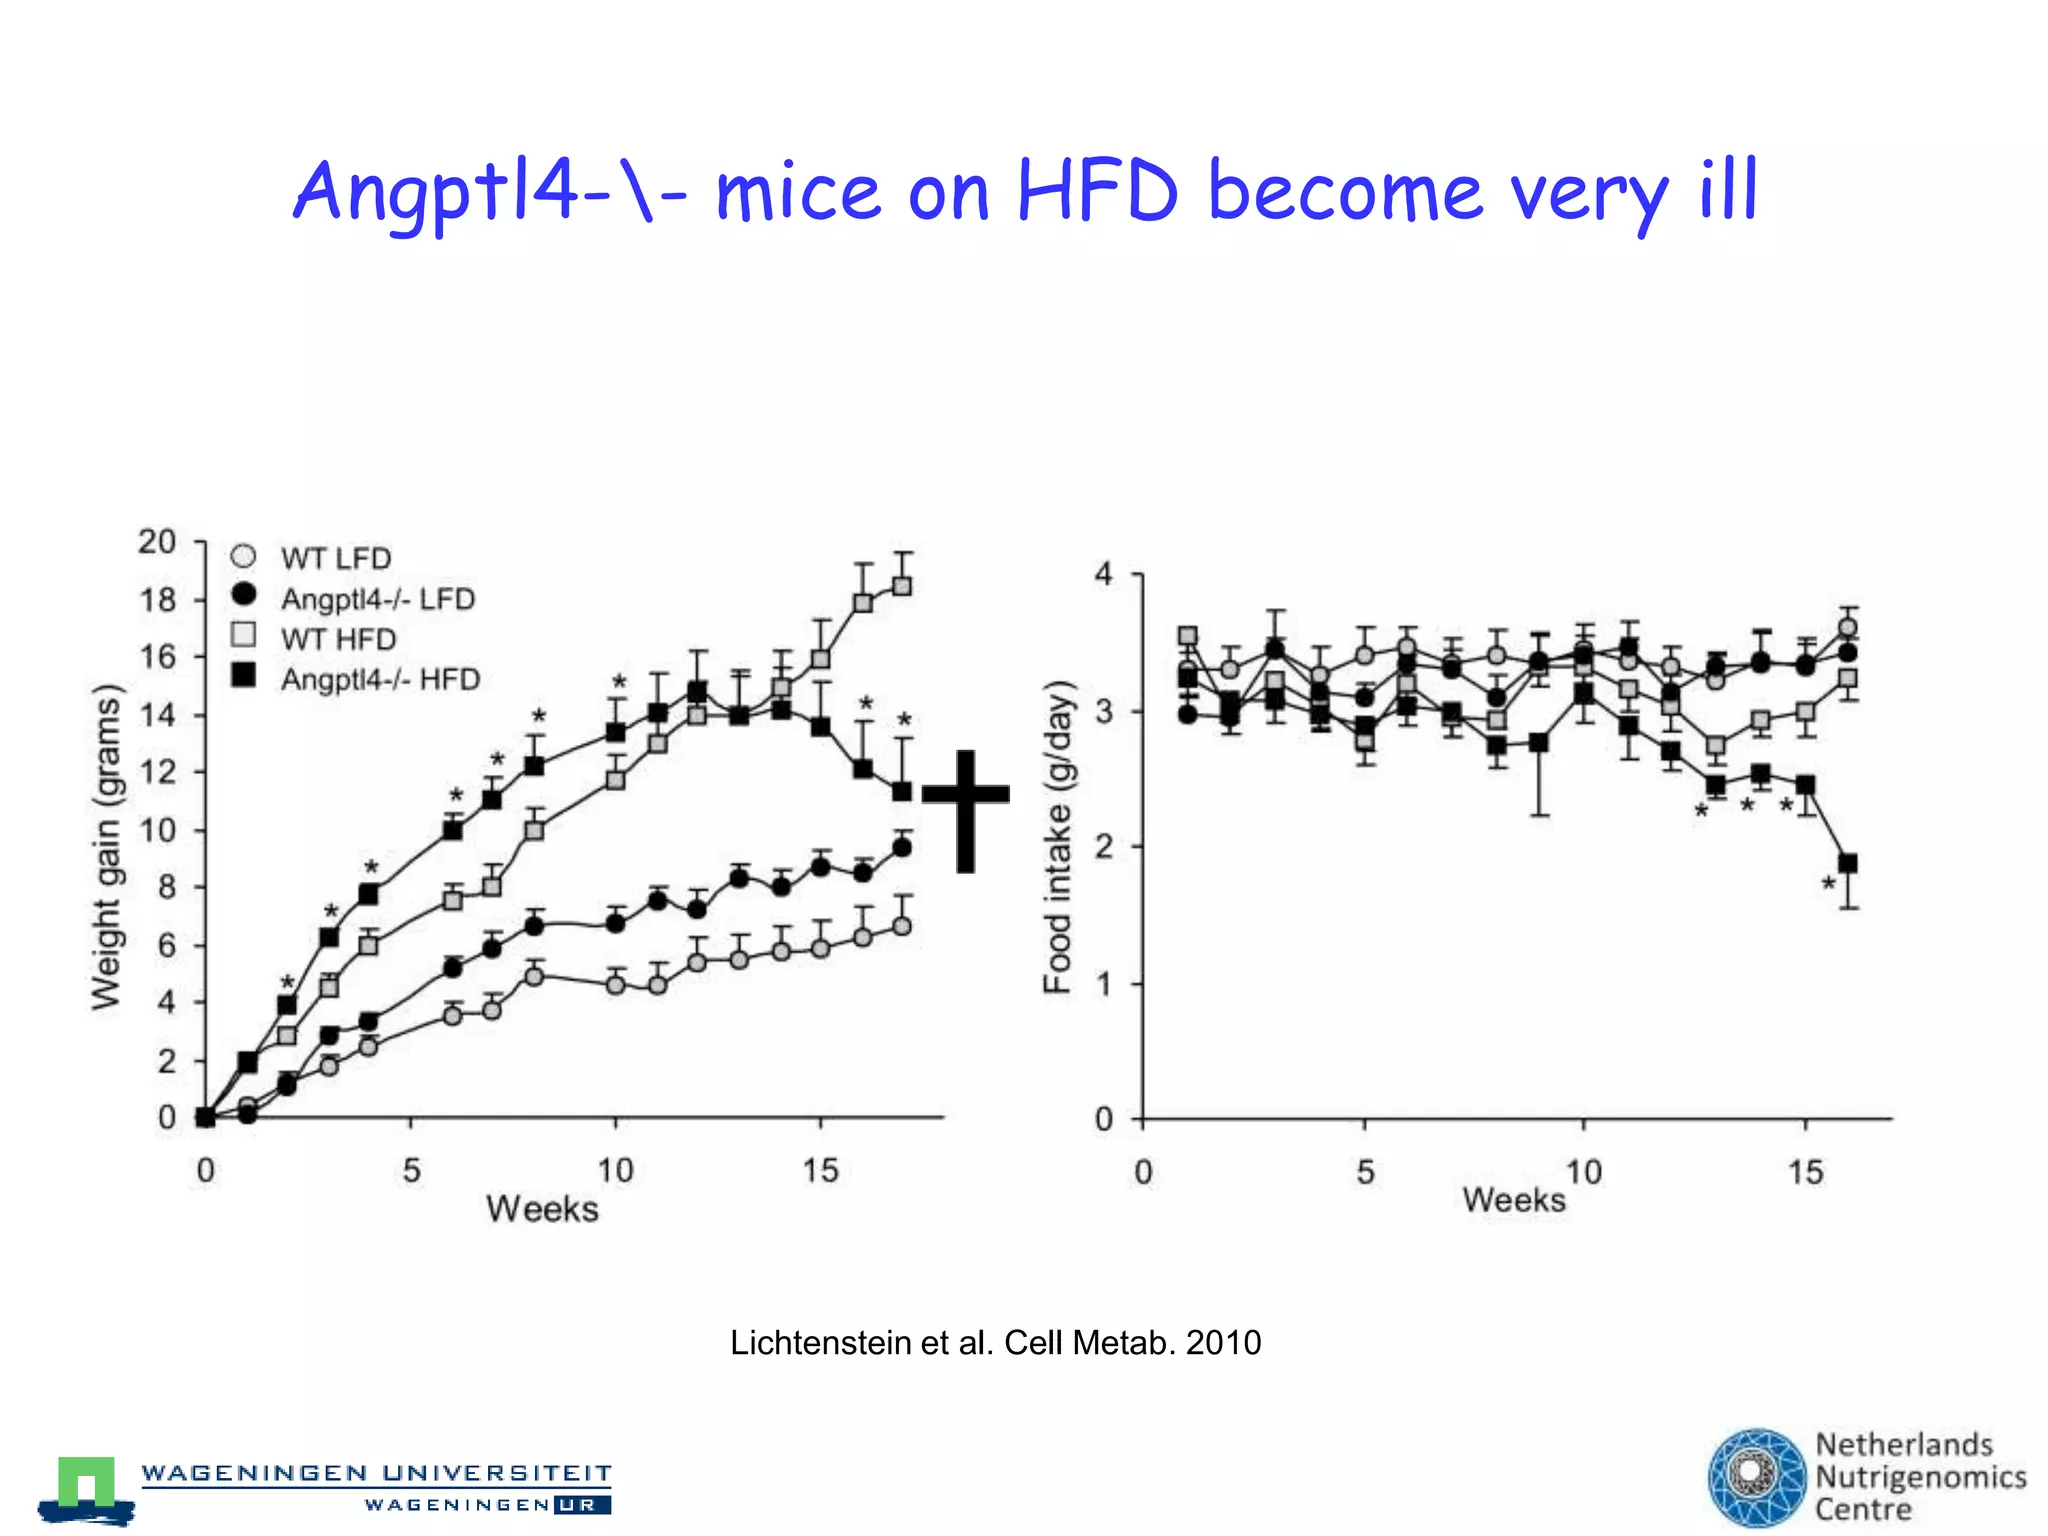
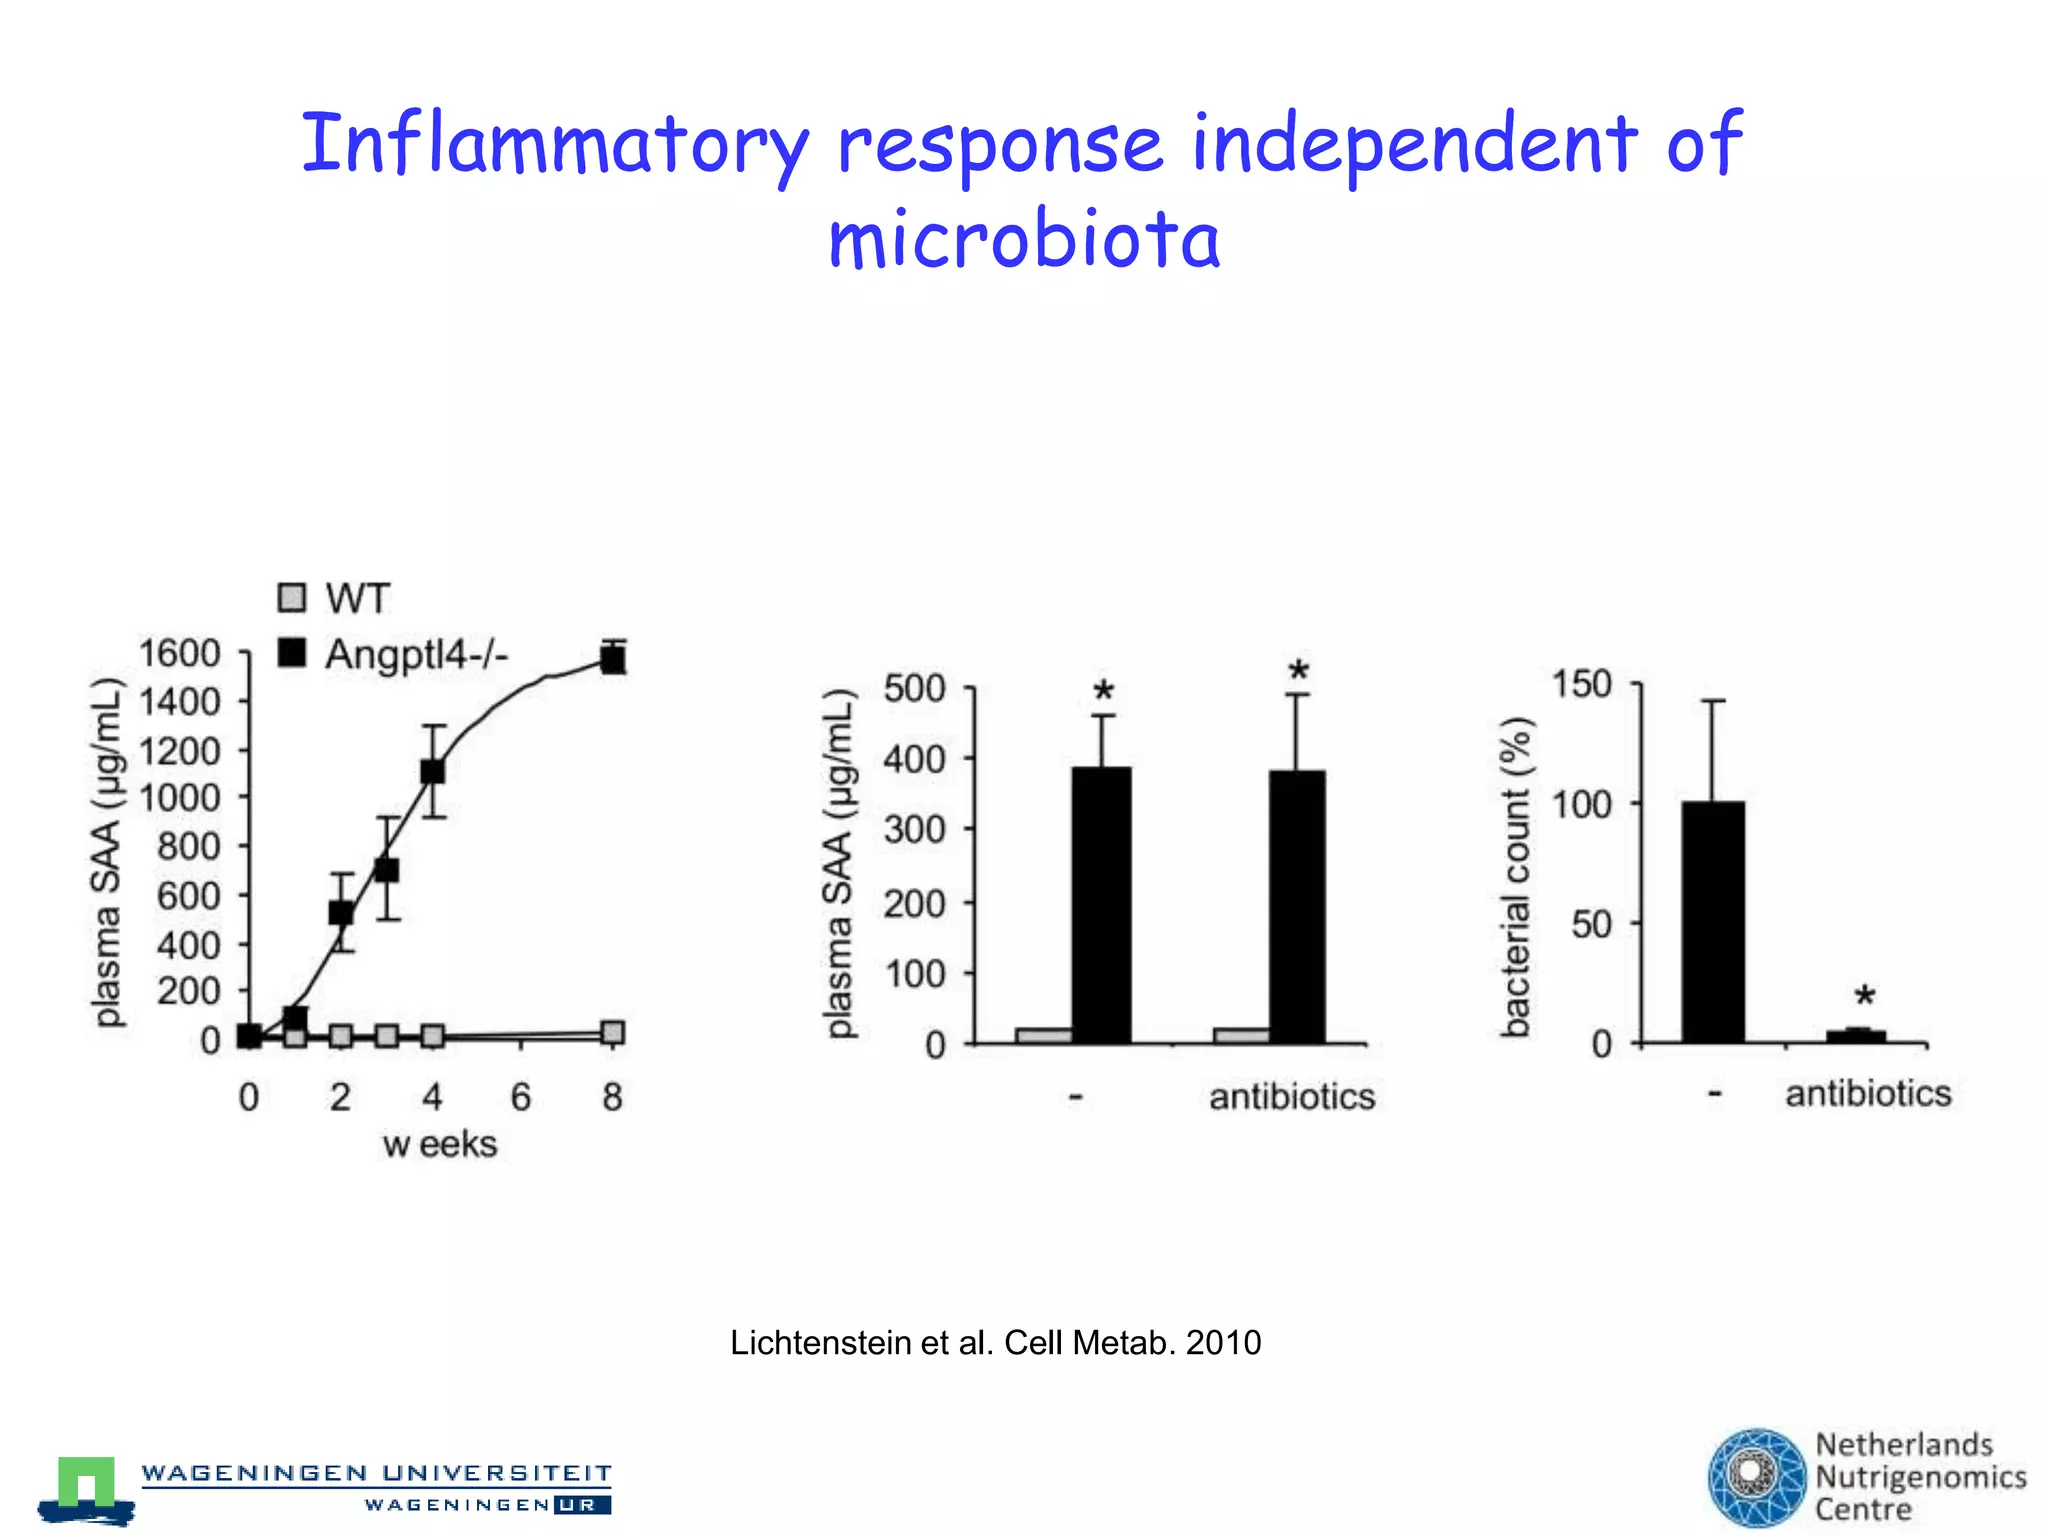
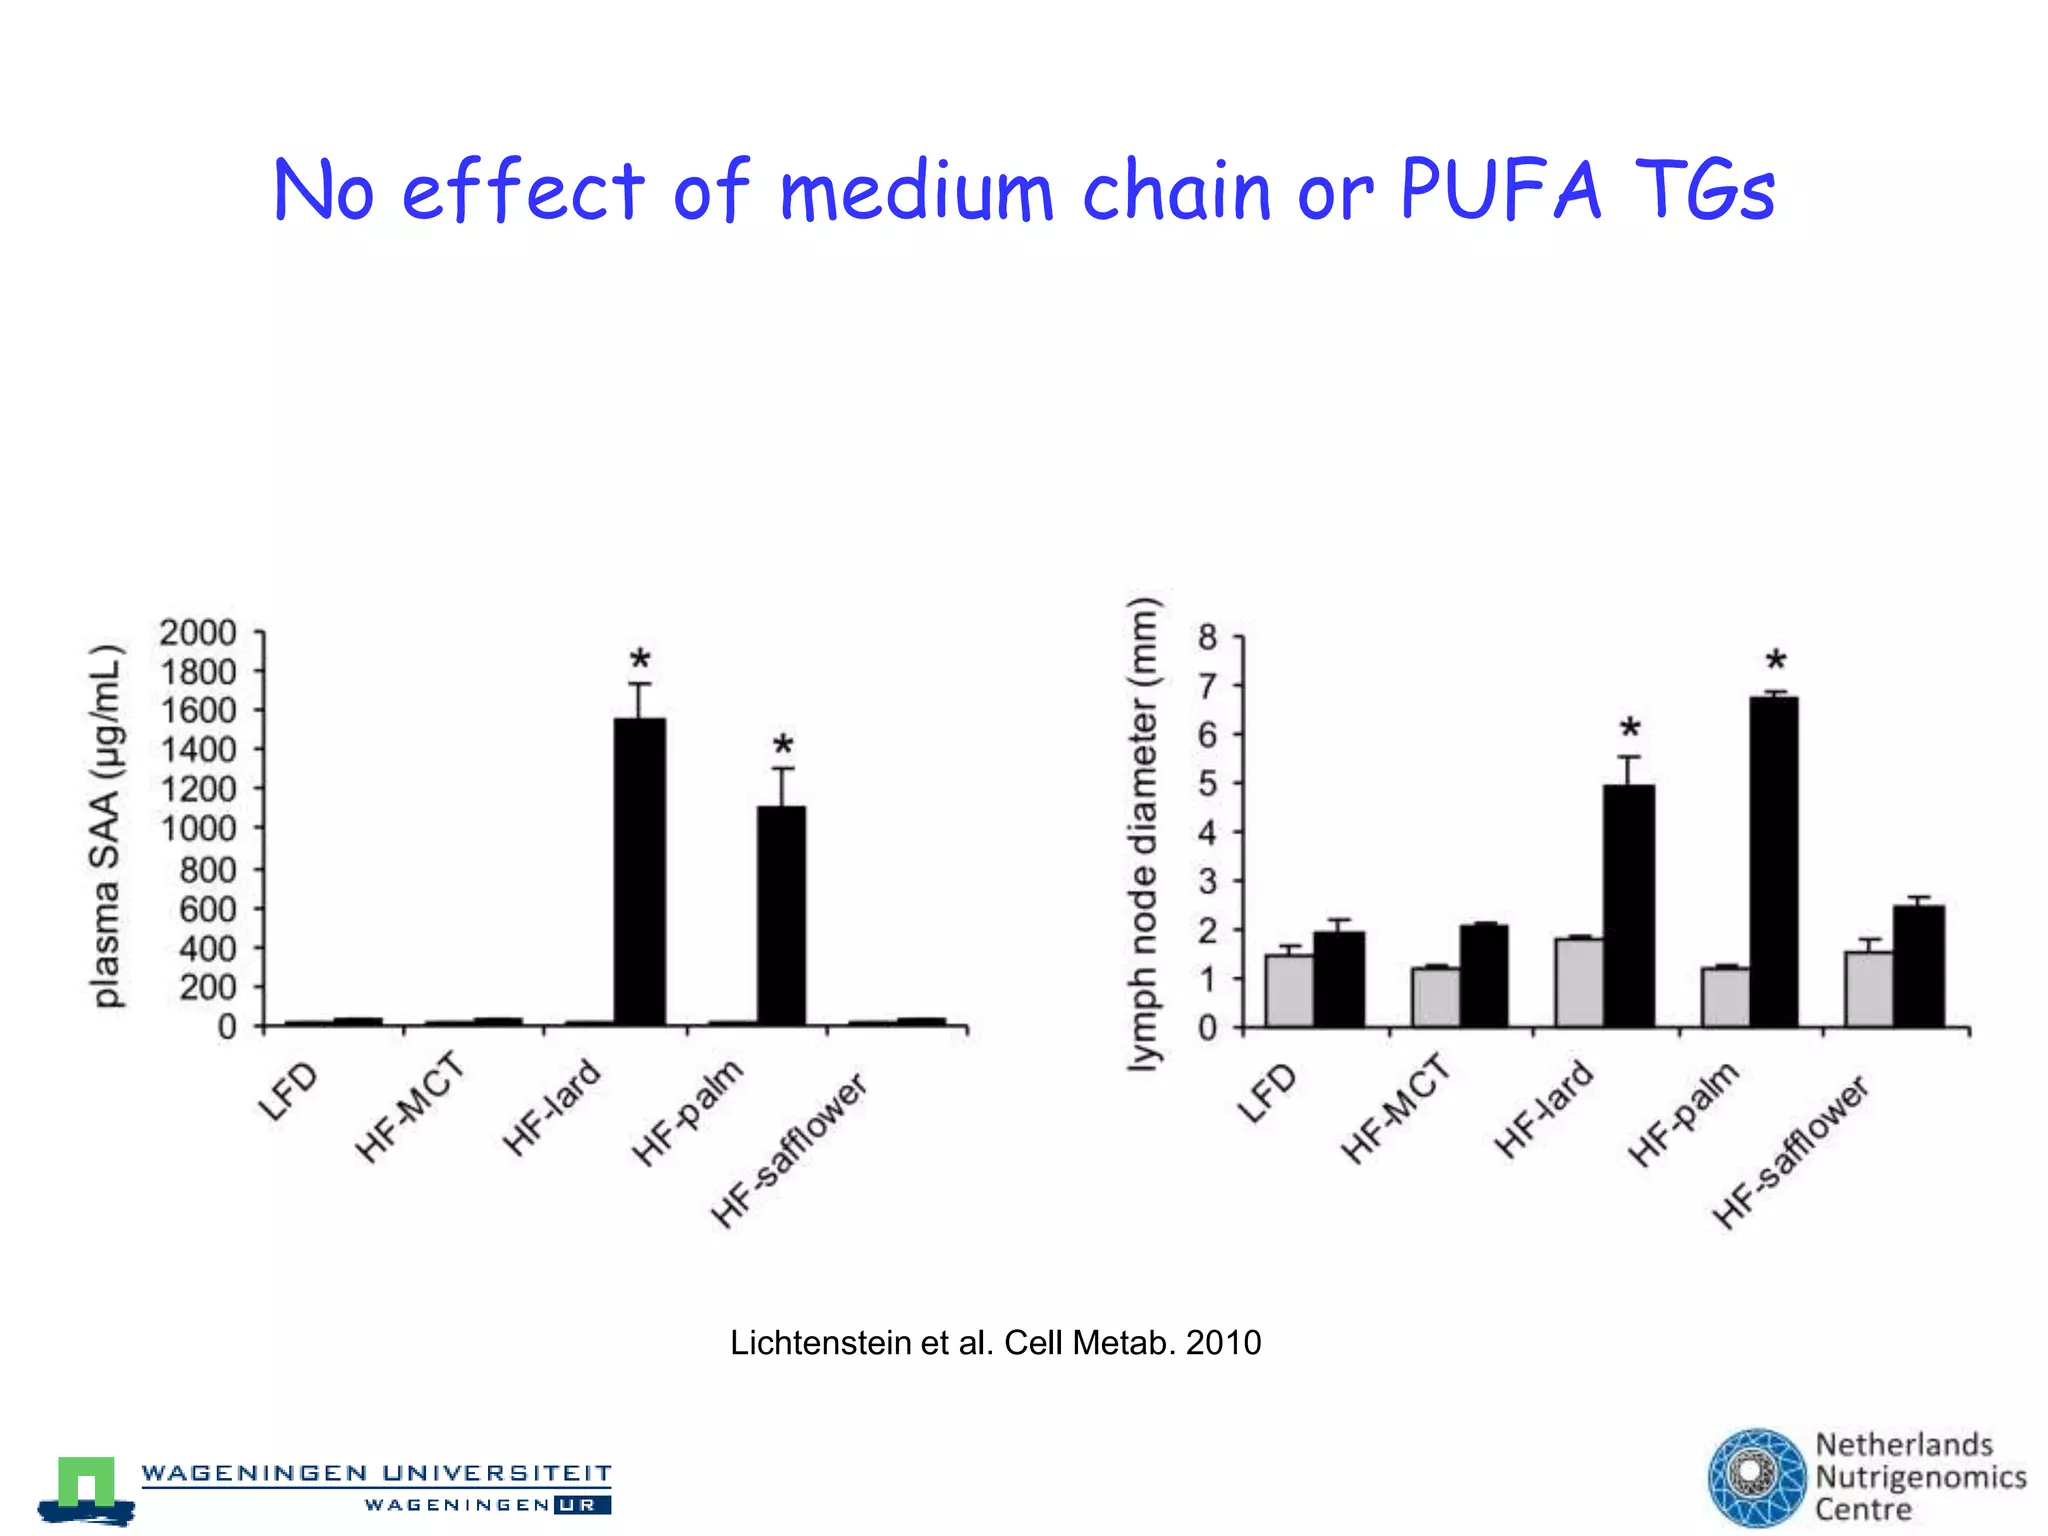
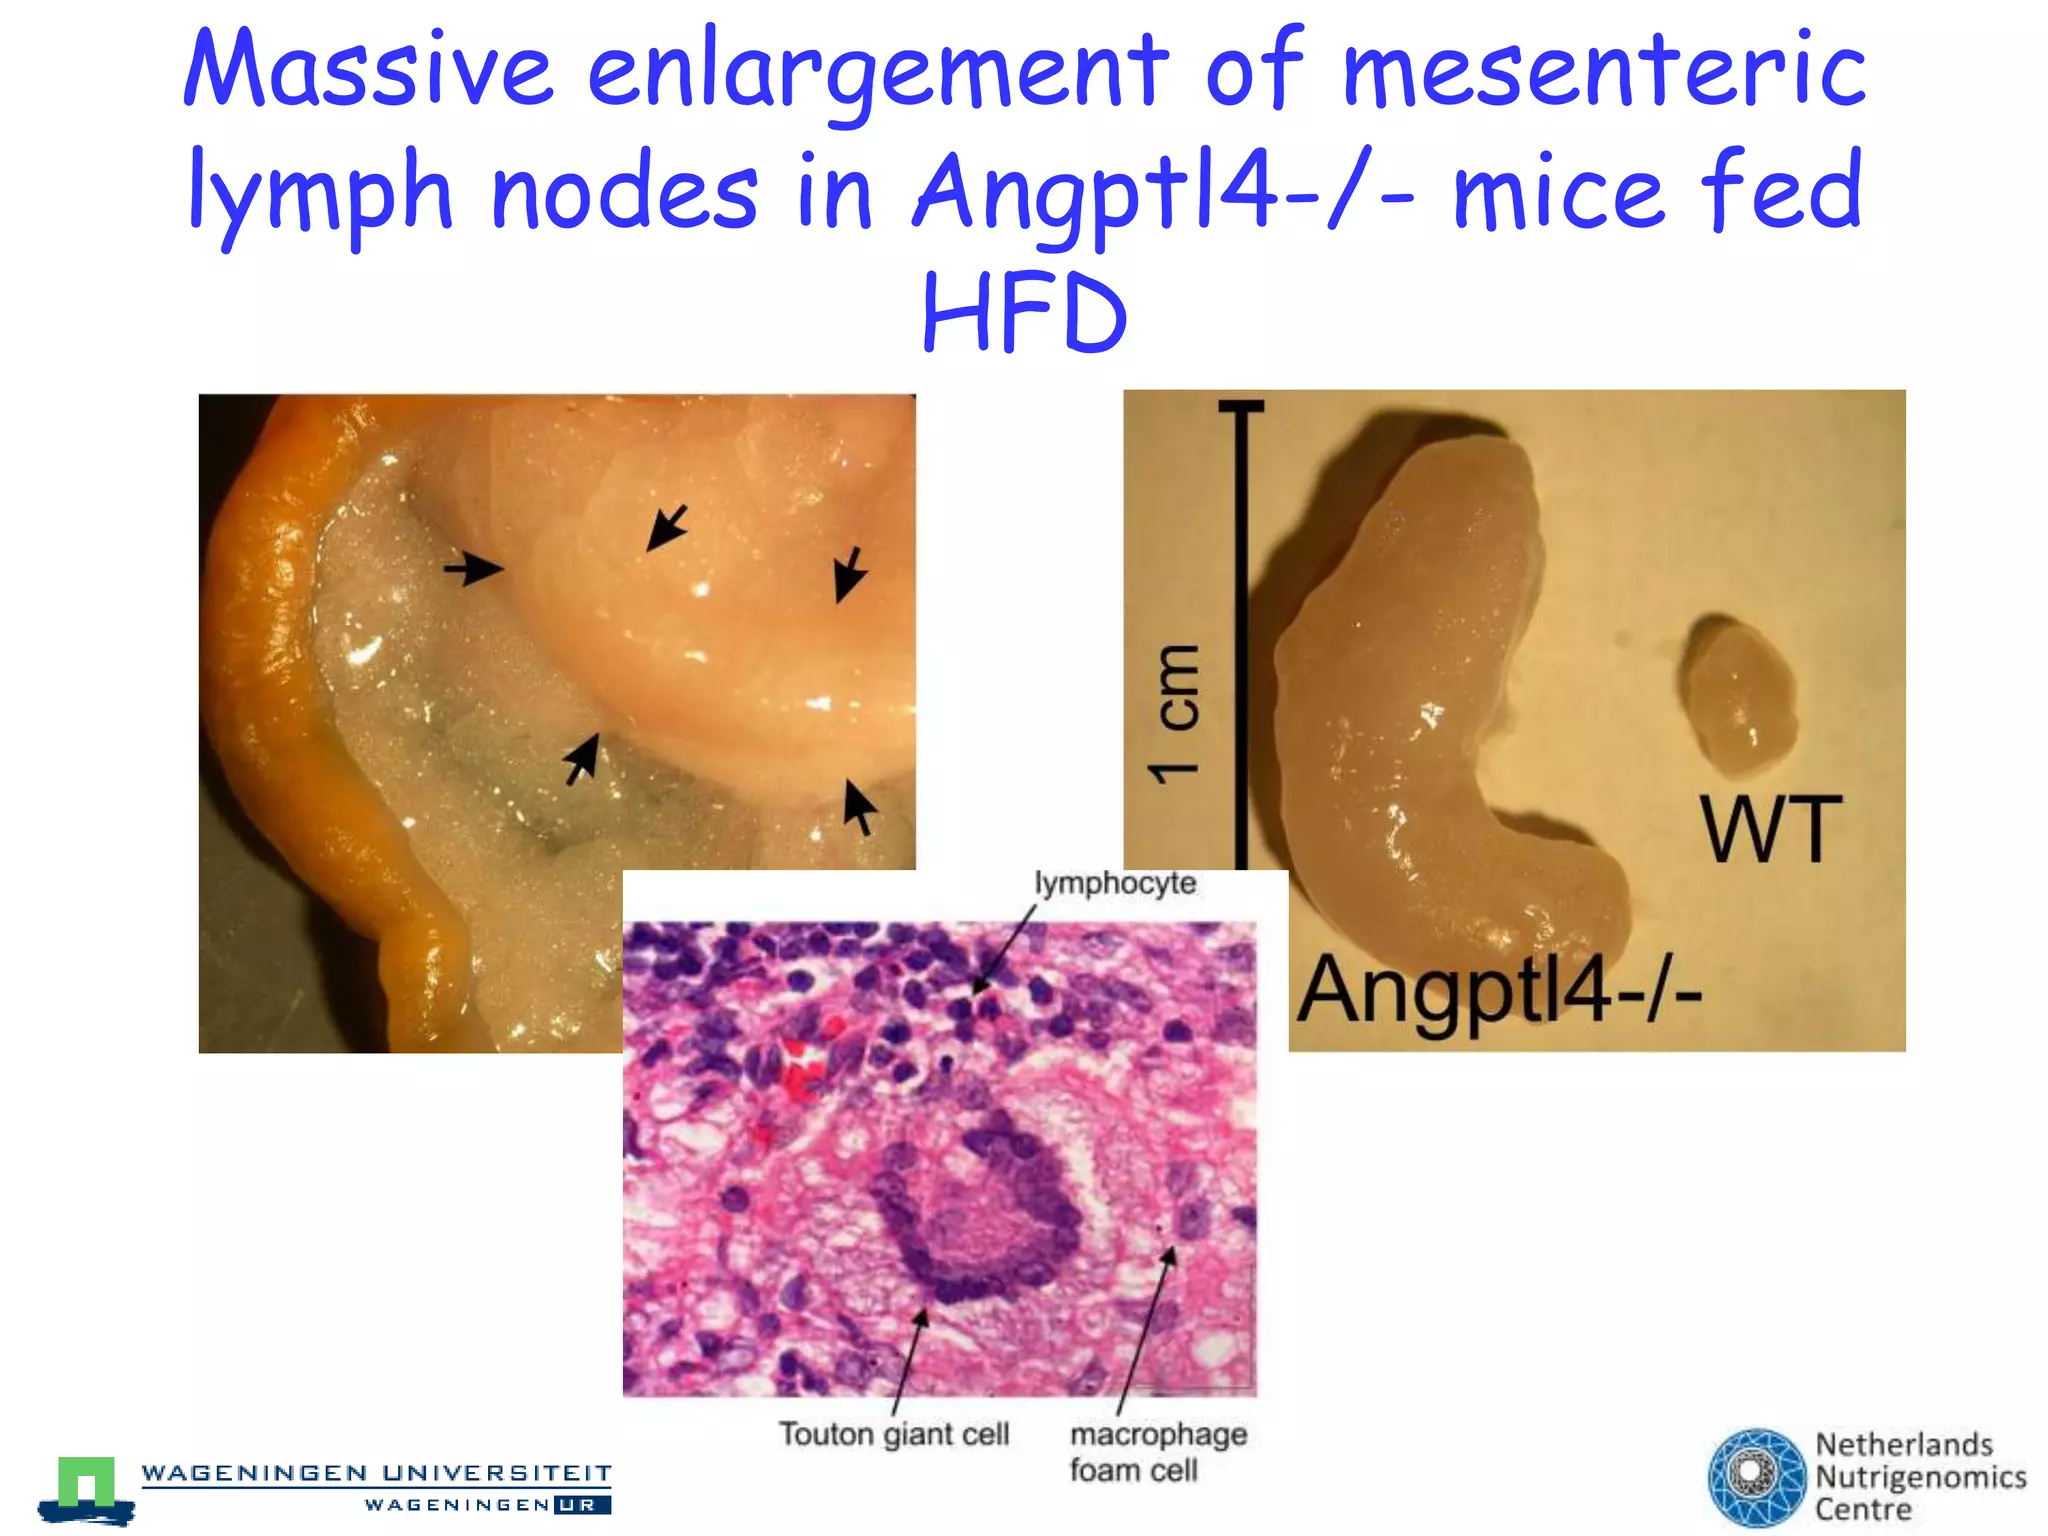
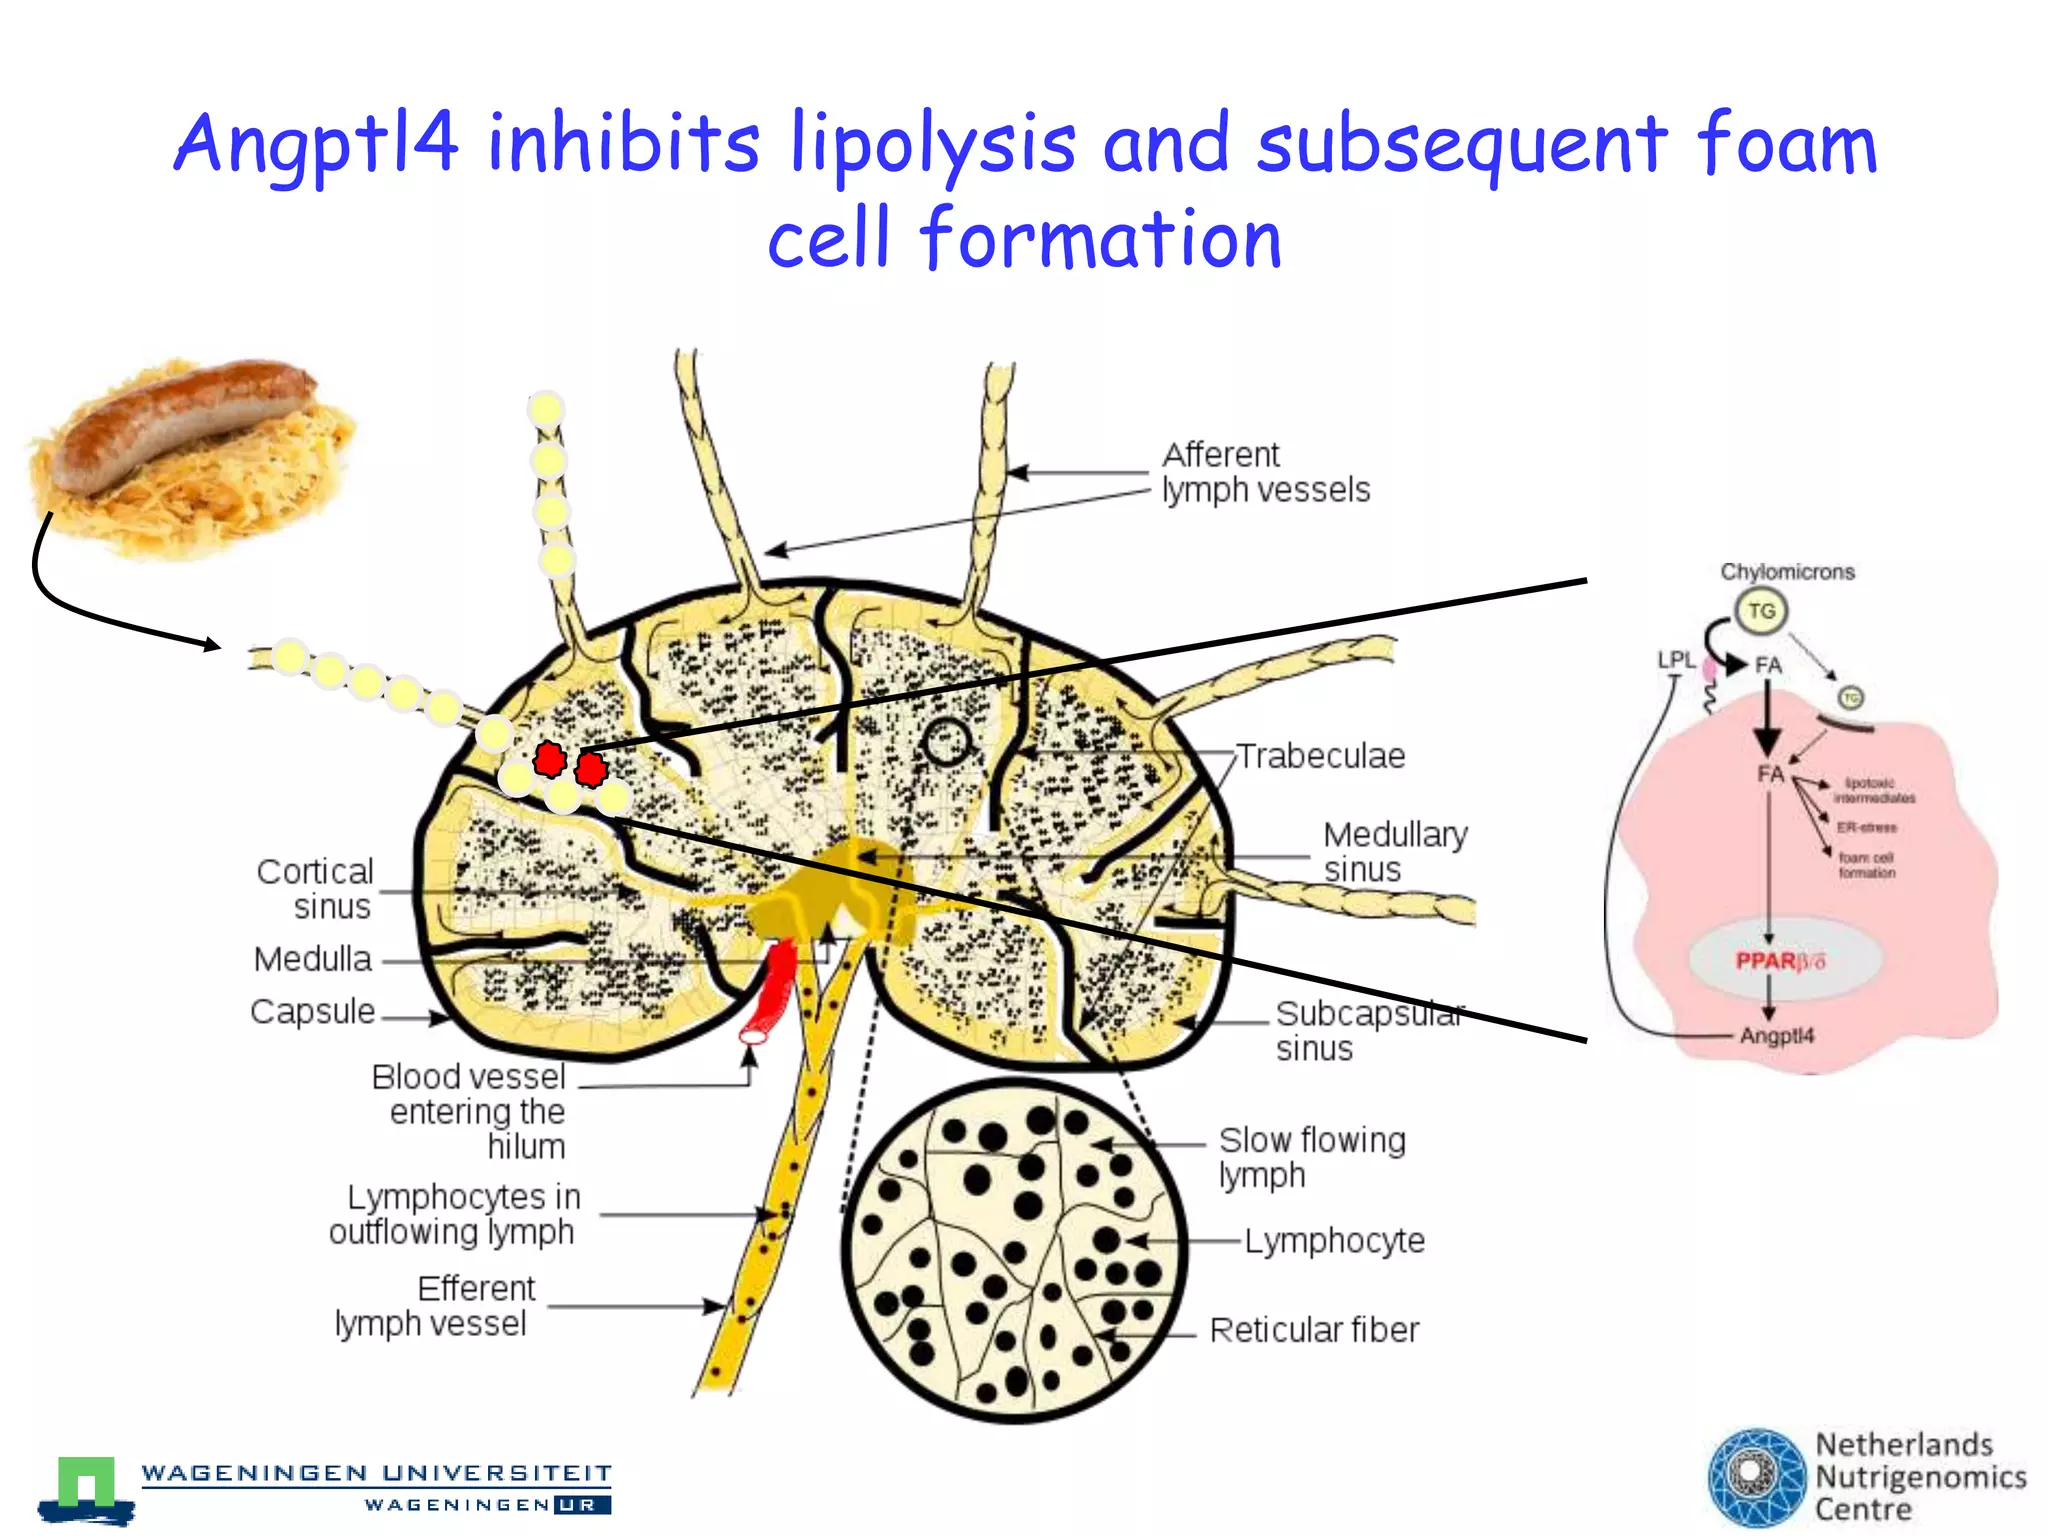
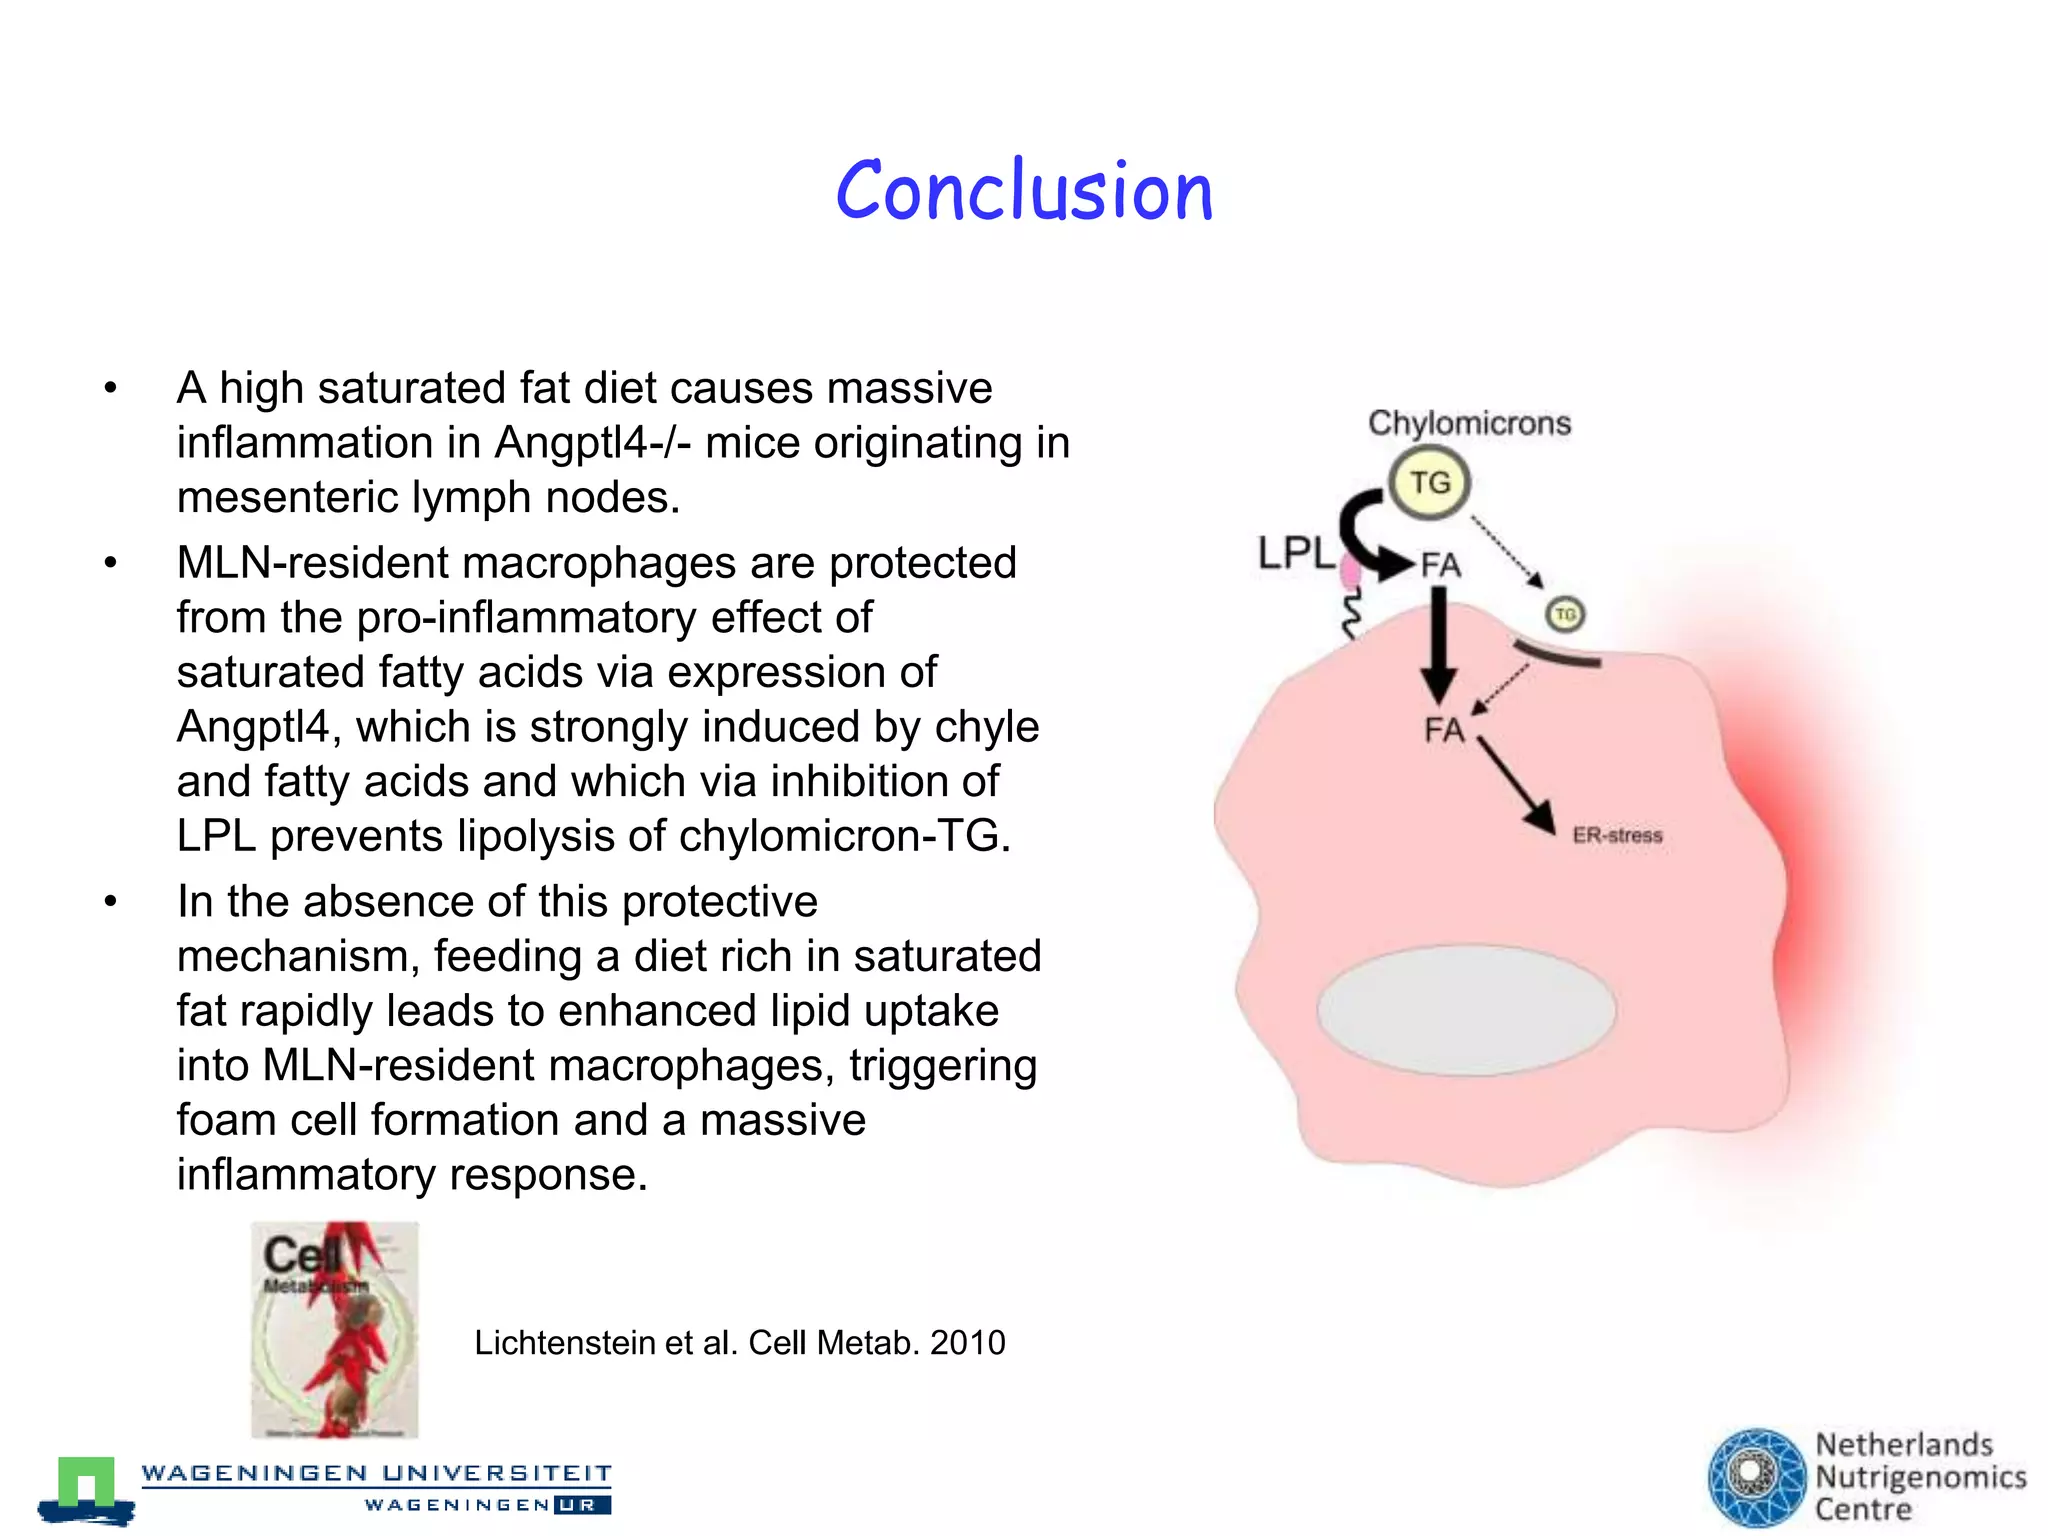
Adipose tissue, innate immunity and inflammation – a nutrigenomics perspective of the metabolic syndromehttp://twitter.com/nutrigenomicsMichael MüllerNetherlands Nutrigenomics Centre& Nutrition, Metabolism and Genomics GroupDivision of Human Nutrition, Wageningen University
I will talk aboutOur challenges: What is healthyWhat is Nutrigenomics?The metabolic syndromeThe deadly sinsGood fat / bad fat (tissue)Modern nutritional science & early biomarkersNASH & the role of the adipose tissueDietary saturated fat can induce pro-inflammatory responsesWe have different phenotypes: Personalized healthSaturated fat can be “killing” (in transgenic mice)Summary & recommendations
What do we know about the health network?
Our scientific challenge: What's healthy?
We are what we eat
Our “paleolithic” genes + modern dietsPaleolithic eraModern Times1.200.000 Generations between feast en famine2-3 Generations in energy abundance% Energy% Energy100100GrainMilk/-productsIsolated CarbohydratesIsolated Fat/OilAlcoholLow-fat meatChickenEggsFish50MeatChickenFish50FruitVegetables (carrots)NutsHoneyFruitVegetablesBeans00
Nutrigenomics Quantification of the nutritional genotype-phenotype LifestyleNutritionEnvironment
Adipocytes at the crossroads of energy homeostasis
What is the metabolic syndrome?	The metabolic syndrome is characterized by a group of metabolic risk factors in one person:Central obesity (excessive fat tissue in and around the abdomen) Atherogenic dyslipidemia (blood fat disorders — mainly high triglycerides and low HDL cholesterol — that foster plaque buildups in artery walls) Raised blood pressure (130/85 mm Hg or higher) Insulin resistance or glucose intolerance (the body can’t properly use insulin or blood sugar) Prothrombotic state (e.g., high fibrinogen or plasminogen activator inhibitor in the blood) Proinflammatory state (e.g., elevated high-sensitivity C-reactive protein in the blood)
The 7 deadly sins (gluttony & sloth)
Proposed pathway to the metabolic syndrome
Metabobolic homeostasis & syndrome
NormalType 2 DiabetesVisceral Fat Distribution:Normal vs Type 2 Diabetes
We need a new nutritional science   Insulin ± oral agentsOral combinationOral monotherapyDiet & exerciseComplex Disease100Different & similar targets80Pharma60DISEASE STATE (%) 40Nutrition200TIME (months/years)HomeostasisHealthL. Afman & M. Müller J Am DietAssoc. 2006;106:569-576.
Late biomarkersof diseaseEarlybiomarkersof diseaseOnset of diseaseBiomarkers of earlydiseasestateSingle marker vsmultimarker profilesDiseasePharmaNutritionEarly biomarkers in human nutrition researchhealthy
Organ-specific gene expression signatures of the early phase (metabolic stress) & the late phase of metabolic syndrome      1     2     3    4    10   16                    WeeksWAT     1     2     3     4    10   16                     WeeksMuscle     1     2     3     4    10   16                    WeeksLiver     1     2     3     4   10   16                   WeeksIntestineHealthy    UnhealthyHealthy    UnhealthyHealthy    UnhealthyHealthy    Unhealthy
Metabolism & Inflammation
Liver, FAT & NASH/NAFLDNonalcoholic Fatty Liver Diseases (NAFLD):Liver component of Metabolic Syndrome
Different stages in NAFLD progression:
Molecular events involved in NASH pathogenesis:
Role of PPARa (Endocrinology 2008 & Hepatology 2010)
Role Kupffer cells (Hepatology 2010)
Role of macrophages in lipid metabolism (JBC 2008; Cell Metabolism 2010)hepatic steatosis 		              steatohepatitis (NASH) & fibrosiscirrhosis
Study: Interaction between WAT and liver tissue essential for NASH/NAFLD in C57Bl/6 miceObjective: Nonalcoholic fatty liver disease (NAFLD) is strongly linked to obesity and diabetes, suggesting an important role of adipose tissue in the pathogenesis of NAFLD. Here we aimed to investigate the interaction between adipose tissue and liver in NAFLD, and identify potential early plasma markers that predict NASH.
Experimental Designtissue collectionrun-in diet20 weeks diet interventionplasma collectionmultiple proteinassaysliver
stratification on body weightfrozen sections: histological feat.lipid contentRNA extraction:Affx microarrays10 LFD0248121620 weeks20 LFD-3quality control & data analysis pipeline10 HFDMouse  genome 430 2.010% low fat diet (palm oil)45% high fat diet (palm oil)ep. white adipose tissueparaffin sections: histological feat.RNA extraction: real-time PCR
High fat diet-induced obesity0248121620HFLLFLHFHLFH2520**15**BW gain (g)*10****50weeks under diet interventionLiver TG contentHepatomegalyALT plasma activity20010100********160880**120660*Ratio LW/BW (%)mg TG/g liverALT activity (UI)80440**40220000LFLLFHHFLHFH
A subpopulation of mice fed HFD develops NASH
Immunohistochemicalstaining confirms enhanced liver inflammation and early fibrosis in HFH miceMacrophage CD68CollagenStellate cell GFAP
Upregulation of inflammatory and fibrotic gene expression in HFH responder mice
Adipose dysfunction in HFH mice
Change in adipose gene expression indicate adipose tissue dysfunction
Plasma proteins as early predictive biomarker for NASH in C57Bl/6 mice
Plasma proteins as early predictive biomarker for NASH in C57Bl/6 miceMultivariate analysis of association of protein plasma concentrations with final liver triglyceride content
ConclusionsOur data support the existence of a tight relationship between adipose tissue dysfunction and NASH pathogenesis.It points to several novel potential predictive biomarkers for NASH. Duval C, Thissen U, Keshtkar S, Accart B, Stienstra R, Boekschoten MV, Roskams T, Kersten S, Müller M. Adipose tissue dysfunction signals progression of hepatic steatosis towards nonalcoholic steatohepatitis in C57BL/6 mice. Diabetes. 2010;59:3181-91.
Human nutrigenomics study Dietary fat and inflammation in adipose tissue Change in diet composition?Van Dijk et al. AJCN 2009de Luca, C and Olefsky JM, Nature Medicine 12, 41 - 42 (2006)
Design of the SFA vs MUFA-rich intervention studyT=10 wksT=0 wksT=2 wksRun-inSFA-rich diet (n=20)SFA-rich diet (n=10)MUFA-rich diet (n=10)After intervention Clamp
 Adipose tissue biopsy
 Blood samplingBaseline Clamp
 Adipose tissue biopsy
 Blood samplingVan Dijk et al. AJCN 2009
‘Obese-linked’ pro-inflammatory gene expression profile by SFAsMUFA dietSFA dietThe SFA-rich diet:Induces a pro-inflammatory obese-linked gene expression profileDecreases expression and plasma level of the anti-inflammatory cytokine adiponectin“Personal Transcriptomes”Van Dijk et al. AJCN 2009
Humanstudy:Plasma Protein Profiling Reveals Protein Clusters Related to BMI and Insulin Levels in Middle-Aged Overweight SubjectsAIMAssociate plasma protein profiles with BMIIdentifypotential marker profile of earlydisease state. PLoS One. 2010 Dec 23;5(12):e14422
MeasurementsRulesBasedMedicine (Austin, USA)Multiplex immunoassayIn total 124 proteinsmeasuredInvolved in diseases, inflammation, endothelialfunction and metabolism. PLoS One. 2010 Dec 23;5(12):e14422
We are different: improved phenotyping necessary to reveal phenotype clusters. PLoS One. 2010 Dec 23;5(12):e14422
ConclusionWe identified clusters of plasma proteins associated with BMI and insulin in a healthy population. These clusters included earlier identified biomarkers for obesity-related disease as well as potential new biomarkers. These plasma protein clusters could have potential applications for improved phenotypic characterization of volunteers in nutritional intervention studies or as biomarkers in the early detection in obesity-linked disease development and progression.van DijkSJ, Feskens EJM, Heidema AG, Bos MB, van de Rest O, Geleijnse JM, de Groot CPGM, Müller M, Afman LA. Plasma Protein Profiling Reveals Protein Clusters Related to BMI and Insulin Levels in Middle-Aged Overweight Subjects. PLoS One. 2010 Dec 23;5(12):e14422
ChylomicronCE/TGAngptl4LPLCE/TGFFAChylomicron remnant
Angptl4-\- mice on HFD become very illLichtenstein et al. Cell Metab. 2010

Adipose tissue innate immunity & inflammation - a nutrigenomics perspective of the metabolic syndrome

  • 1.
    Adipose tissue, innateimmunity and inflammation – a nutrigenomics perspective of the metabolic syndromehttp://twitter.com/nutrigenomicsMichael MüllerNetherlands Nutrigenomics Centre& Nutrition, Metabolism and Genomics GroupDivision of Human Nutrition, Wageningen University
  • 2.
    I will talkaboutOur challenges: What is healthyWhat is Nutrigenomics?The metabolic syndromeThe deadly sinsGood fat / bad fat (tissue)Modern nutritional science & early biomarkersNASH & the role of the adipose tissueDietary saturated fat can induce pro-inflammatory responsesWe have different phenotypes: Personalized healthSaturated fat can be “killing” (in transgenic mice)Summary & recommendations
  • 3.
    What do weknow about the health network?
  • 4.
  • 5.
  • 6.
    Our “paleolithic” genes+ modern dietsPaleolithic eraModern Times1.200.000 Generations between feast en famine2-3 Generations in energy abundance% Energy% Energy100100GrainMilk/-productsIsolated CarbohydratesIsolated Fat/OilAlcoholLow-fat meatChickenEggsFish50MeatChickenFish50FruitVegetables (carrots)NutsHoneyFruitVegetablesBeans00
  • 7.
    Nutrigenomics Quantification ofthe nutritional genotype-phenotype LifestyleNutritionEnvironment
  • 8.
    Adipocytes at thecrossroads of energy homeostasis
  • 9.
    What is themetabolic syndrome? The metabolic syndrome is characterized by a group of metabolic risk factors in one person:Central obesity (excessive fat tissue in and around the abdomen) Atherogenic dyslipidemia (blood fat disorders — mainly high triglycerides and low HDL cholesterol — that foster plaque buildups in artery walls) Raised blood pressure (130/85 mm Hg or higher) Insulin resistance or glucose intolerance (the body can’t properly use insulin or blood sugar) Prothrombotic state (e.g., high fibrinogen or plasminogen activator inhibitor in the blood) Proinflammatory state (e.g., elevated high-sensitivity C-reactive protein in the blood)
  • 10.
    The 7 deadlysins (gluttony & sloth)
  • 11.
    Proposed pathway tothe metabolic syndrome
  • 12.
  • 13.
    NormalType 2 DiabetesVisceralFat Distribution:Normal vs Type 2 Diabetes
  • 15.
    We need anew nutritional science Insulin ± oral agentsOral combinationOral monotherapyDiet & exerciseComplex Disease100Different & similar targets80Pharma60DISEASE STATE (%) 40Nutrition200TIME (months/years)HomeostasisHealthL. Afman & M. Müller J Am DietAssoc. 2006;106:569-576.
  • 16.
    Late biomarkersof diseaseEarlybiomarkersofdiseaseOnset of diseaseBiomarkers of earlydiseasestateSingle marker vsmultimarker profilesDiseasePharmaNutritionEarly biomarkers in human nutrition researchhealthy
  • 17.
    Organ-specific gene expressionsignatures of the early phase (metabolic stress) & the late phase of metabolic syndrome 1 2 3 4 10 16 WeeksWAT 1 2 3 4 10 16 WeeksMuscle 1 2 3 4 10 16 WeeksLiver 1 2 3 4 10 16 WeeksIntestineHealthy UnhealthyHealthy UnhealthyHealthy UnhealthyHealthy Unhealthy
  • 19.
  • 20.
    Liver, FAT &NASH/NAFLDNonalcoholic Fatty Liver Diseases (NAFLD):Liver component of Metabolic Syndrome
  • 21.
    Different stages inNAFLD progression:
  • 22.
    Molecular events involvedin NASH pathogenesis:
  • 23.
    Role of PPARa(Endocrinology 2008 & Hepatology 2010)
  • 24.
    Role Kupffer cells(Hepatology 2010)
  • 25.
    Role of macrophagesin lipid metabolism (JBC 2008; Cell Metabolism 2010)hepatic steatosis steatohepatitis (NASH) & fibrosiscirrhosis
  • 26.
    Study: Interaction betweenWAT and liver tissue essential for NASH/NAFLD in C57Bl/6 miceObjective: Nonalcoholic fatty liver disease (NAFLD) is strongly linked to obesity and diabetes, suggesting an important role of adipose tissue in the pathogenesis of NAFLD. Here we aimed to investigate the interaction between adipose tissue and liver in NAFLD, and identify potential early plasma markers that predict NASH.
  • 27.
    Experimental Designtissue collectionrun-indiet20 weeks diet interventionplasma collectionmultiple proteinassaysliver
  • 28.
    stratification on bodyweightfrozen sections: histological feat.lipid contentRNA extraction:Affx microarrays10 LFD0248121620 weeks20 LFD-3quality control & data analysis pipeline10 HFDMouse genome 430 2.010% low fat diet (palm oil)45% high fat diet (palm oil)ep. white adipose tissueparaffin sections: histological feat.RNA extraction: real-time PCR
  • 29.
    High fat diet-inducedobesity0248121620HFLLFLHFHLFH2520**15**BW gain (g)*10****50weeks under diet interventionLiver TG contentHepatomegalyALT plasma activity20010100********160880**120660*Ratio LW/BW (%)mg TG/g liverALT activity (UI)80440**40220000LFLLFHHFLHFH
  • 30.
    A subpopulation ofmice fed HFD develops NASH
  • 31.
    Immunohistochemicalstaining confirms enhancedliver inflammation and early fibrosis in HFH miceMacrophage CD68CollagenStellate cell GFAP
  • 32.
    Upregulation of inflammatoryand fibrotic gene expression in HFH responder mice
  • 33.
  • 34.
    Change in adiposegene expression indicate adipose tissue dysfunction
  • 35.
    Plasma proteins asearly predictive biomarker for NASH in C57Bl/6 mice
  • 36.
    Plasma proteins asearly predictive biomarker for NASH in C57Bl/6 miceMultivariate analysis of association of protein plasma concentrations with final liver triglyceride content
  • 37.
    ConclusionsOur data supportthe existence of a tight relationship between adipose tissue dysfunction and NASH pathogenesis.It points to several novel potential predictive biomarkers for NASH. Duval C, Thissen U, Keshtkar S, Accart B, Stienstra R, Boekschoten MV, Roskams T, Kersten S, Müller M. Adipose tissue dysfunction signals progression of hepatic steatosis towards nonalcoholic steatohepatitis in C57BL/6 mice. Diabetes. 2010;59:3181-91.
  • 39.
    Human nutrigenomics studyDietary fat and inflammation in adipose tissue Change in diet composition?Van Dijk et al. AJCN 2009de Luca, C and Olefsky JM, Nature Medicine 12, 41 - 42 (2006)
  • 40.
    Design of theSFA vs MUFA-rich intervention studyT=10 wksT=0 wksT=2 wksRun-inSFA-rich diet (n=20)SFA-rich diet (n=10)MUFA-rich diet (n=10)After intervention Clamp
  • 41.
  • 42.
  • 43.
  • 44.
    Blood samplingVanDijk et al. AJCN 2009
  • 45.
    ‘Obese-linked’ pro-inflammatory geneexpression profile by SFAsMUFA dietSFA dietThe SFA-rich diet:Induces a pro-inflammatory obese-linked gene expression profileDecreases expression and plasma level of the anti-inflammatory cytokine adiponectin“Personal Transcriptomes”Van Dijk et al. AJCN 2009
  • 46.
    Humanstudy:Plasma Protein ProfilingReveals Protein Clusters Related to BMI and Insulin Levels in Middle-Aged Overweight SubjectsAIMAssociate plasma protein profiles with BMIIdentifypotential marker profile of earlydisease state. PLoS One. 2010 Dec 23;5(12):e14422
  • 47.
    MeasurementsRulesBasedMedicine (Austin, USA)MultipleximmunoassayIn total 124 proteinsmeasuredInvolved in diseases, inflammation, endothelialfunction and metabolism. PLoS One. 2010 Dec 23;5(12):e14422
  • 48.
    We are different:improved phenotyping necessary to reveal phenotype clusters. PLoS One. 2010 Dec 23;5(12):e14422
  • 49.
    ConclusionWe identified clustersof plasma proteins associated with BMI and insulin in a healthy population. These clusters included earlier identified biomarkers for obesity-related disease as well as potential new biomarkers. These plasma protein clusters could have potential applications for improved phenotypic characterization of volunteers in nutritional intervention studies or as biomarkers in the early detection in obesity-linked disease development and progression.van DijkSJ, Feskens EJM, Heidema AG, Bos MB, van de Rest O, Geleijnse JM, de Groot CPGM, Müller M, Afman LA. Plasma Protein Profiling Reveals Protein Clusters Related to BMI and Insulin Levels in Middle-Aged Overweight Subjects. PLoS One. 2010 Dec 23;5(12):e14422
  • 50.
  • 51.
    Angptl4-\- mice onHFD become very illLichtenstein et al. Cell Metab. 2010
  • 52.
    Inflammatory response independentof microbiotaLichtenstein et al. Cell Metab. 2010
  • 53.
    No effect ofmedium chain or PUFA TGsLichtenstein et al. Cell Metab. 2010
  • 54.
    Massive enlargement ofmesenteric lymph nodes in Angptl4-/- mice fed HFD
  • 55.
    Angptl4 inhibits lipolysisand subsequent foam cell formation
  • 56.
    ConclusionA high saturatedfat diet causes massive inflammation in Angptl4-/- mice originating in mesenteric lymph nodes.
  • 57.
    MLN-resident macrophages areprotected from the pro-inflammatory effect of saturated fatty acids via expression of Angptl4, which is strongly induced by chyle and fatty acids and which via inhibition of LPL prevents lipolysis of chylomicron-TG.
  • 58.
    In the absenceof this protective mechanism, feeding a diet rich in saturated fat rapidly leads to enhanced lipid uptake into MLN-resident macrophages, triggering foam cell formation and a massive inflammatory response.Lichtenstein et al. Cell Metab. 2010
  • 59.
    Is bariatric surgerythe only solution?
  • 60.
    Pharma is notthe (only) solution:Eat foods rich in challenging food bioactivesDrugsABCPPARgPPARbPPARaReceptorC3C2C1Fatty acidsFC6C5C4Multiple targets
  • 61.
    SummaryYou are whatyou eat => during life all events will leave their (epigenetic) traces on our genome, some are irreversible => ageingDisease phenotypes such as obesity, metabolic syndrome, diabetes are largely related to our “gluttony / sloth” lifestyles and modern convenient (“fast”) foods => unhealthy ageing.NASH is the liver phenotype of the metabolic syndrome and appears early in the progression towards diabetes or CVD. There is a tight relationship between adipose tissue dysfunction and NASH pathogenesis.Chronic overconsumption of saturated fat or lipogenic precursors (starch, sugars) induces non-resolving low-grade pro-inflammatory state largely caused by the innate immune system.=> choose the right lifestyle & food pattern (diverse & anti-inflammatory), eat less & exercise more (at least for 30 minutes/day).
  • 62.
    2 Meals aday, work as long as possible & embrace challengeWalter Breuning (1896 - 2011)
  • 63.
    Sander KerstenLinda SandersonNatashaGeorgiadiMark BouwensLydia AfmanGuido HooiveldMeike BungerPhilip de GrootMark BoekschotenNicole de WitMohammad Ohid UllahChristian TrautweinFolkert KuipersBen van Ommen + many more

Editor's Notes

  • #20 Inflammation has been associated with many disease phenotypes including steatohepatitis or diabetes. This relationship is in particular when inflammation is chronic or non-resolving. There is an interaction between metabolism and inflammation with positive or negative consequences with respect to organ and systemic health.In my talk I will briefly discuss two unpublished studies, one investigating the important interaction of WAT and liver in particular under conditions of diet-induced obesity. Organ-specific macrophages in WAT and liver play an crucial role in progressing organ-specific inflammatory phenotypes. In the second study we found very interesting interaction between dietary fat and macrophages in mesenteric lymph nodes that are exposed postprandially to very high concentrations of chylomicrons. We used a k.o. mouse for ANGPTL4 and could show that chronic consumption of saturated fat can be deadly.
  • #25 Haematoxylin and eosin staining (D) and oil red O staining (E) of representative liver sections of the 4 subgroups
  • #26  (Immuno)histochemical staining confirms enhanced inflammation and early fibrosis in HFH miceImmunohistochemical staining of macrophage activation in representative liver section of HFL and HFH mice using antibody against the specific macrophagemarker Cd68Collagen staining using fast green FCF/sirius red F3B. Staining of stellate cell activation using antibody against GFAP.
  • #27 - Number of genes up- or down-regulated in the various subgroups in comparison to the LFL mice, as determined by Affymetrix GeneChip analysis. Genes with a p-value below 0.05 were considered significantly regulated. - Heat map showing changes in expression of selected genes involved in lipid metabolism, inflammation and fibrosis in liver. Changes in gene expression of selected genes as determined by real-time quantitative PCR. Mean expression in LFL mice was set at 100%. Error bars reflect standard deviation. Bars with different letters are statistically different (P<0.05 according to Student’s t-test). Number of mice per group: n=4 (LFL, HFL, HFH), n=6 (LFH).
  • #28 Haematoxylin and eosin staining of representative adipose tissue sections. Immunohistochemical staining of macrophages using antibody against Cd68. Collagen staining using fast green FCF/sirius red F3B.
  • #29 Adipose tissue mRNA expression of a selected group of genes was determined by quantitative real-time PCR after 21 weeks of dietary intervention. Mean expression in LFL mice was set at 100%. Error bars reflect standard deviation. * = significantly different from HFL mice according to Student’s t-test (P<0.05). Number of mice per group: n=4 (LFL, HFL, HFH), n=6 (LFH).
  • #30 . A) Plasma concentration of haptoglobin, TIMP-1, IL-1β, leptin and insulin were determined by multiplex assay at specific time points during the 21 weeks of dietary intervention after a 6h fast. White squares: LFL, Light grey squares: LFH, dark grey squares: HFL, black squares: HFH. Error bars reflect standard deviation. * = significantly different from HFL mice according to Student’s t-test (P<0.05). Number of mice per group: n=4 (LFL, HFL, HFH), n=6 (LFH).
  • #31 Graphs illustrating the result of multivariate analysis showing the association of protein plasma concentrations at various time points with final liver triglyceride content. Significant proteins display an inverse RSD value higher than 2 (bold line indicates the inverse RSD threshold value of 2).RSD = Relative standard deviation.