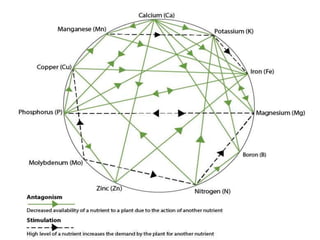
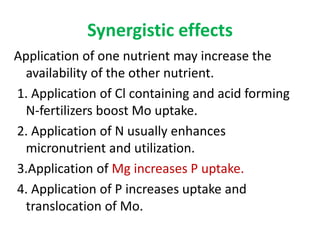
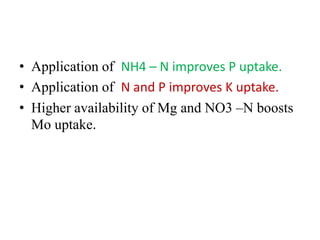
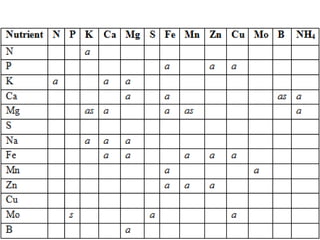
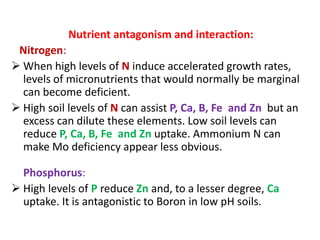
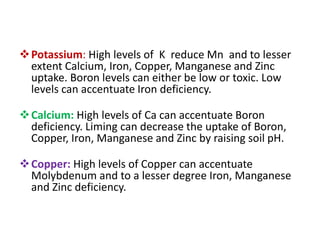
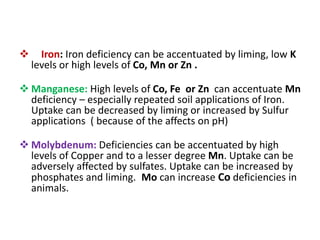
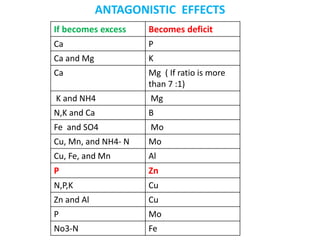
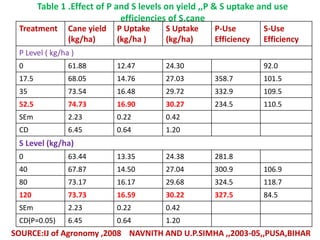
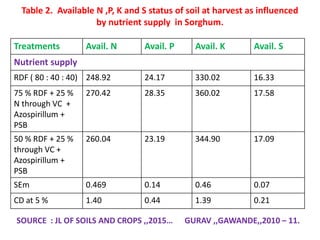
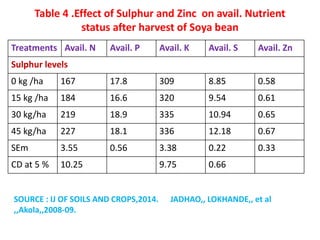
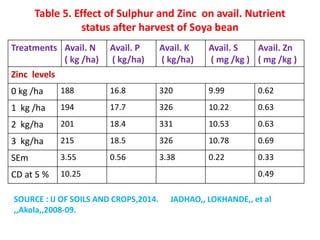
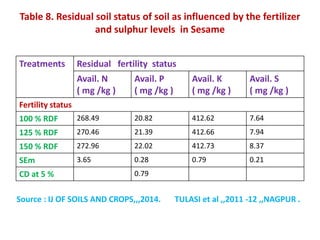
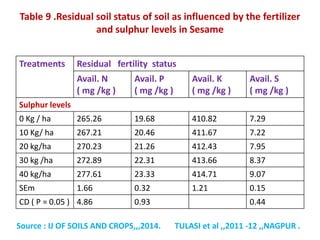
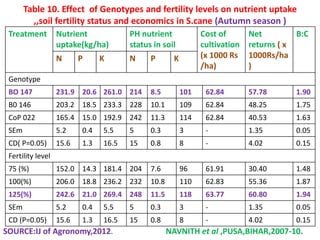
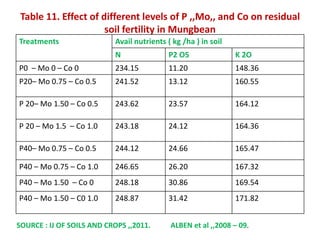
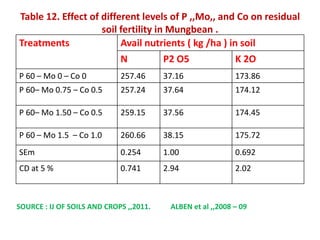
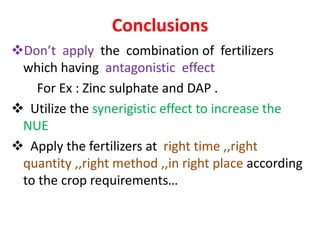
NUTRIENT
INTERACTIONS
Presented by
M. Shravan Kumar Reddy.
M.Sc . Agronomy – 1st year
RAM / 16 – 03.
• What is Interaction ?
• What is the need for knowing nutrient
interactions??
• Types of nutrient interactions ??
• Interactions among the essential nutrients ??
• Case studies on Nutrient interactions ..
• CONCLUSION
WHAT IS INTERACTION ???
Interaction : In simpler terms Interaction
means Influence / effect of one upon the
other is called INTERACTION .
( OR )
The availability of an ion is influenced by the
presence of other ions in soil solution is called
Interaction .
It may positive or Negative 0r no interaction
Why we need to know the plant
nutrient interactions ??
• There is need for us to know the nutrient
interactions and also the interation of nutrients
(fertilizers) with other
insecticides/fertilizers/pesticides ..
• we must know the antagonistic interactions so
that we avoid the Combined application of
fertilizers (Nutrients) which having antagonistic
effect In between them
Ex: application of DAP/SSP and Zinc is
avoided ..because of antagonistic effect.
NEED for knowing the Interactions???
• Balanced supply of of essential nutrients is
one of the most important factors in increasing
crop yields.
• The objective of this topic to discuss
interactions among major and minor nutrients
in crop plants.
• In crop plants, the nutrient interactions are
generally measured in terms of growth
response and change in concentration of
nutrients.
To know what combinations of fertilizers are
suitable for application at one time
To know the effect of one nutrient upon the other
..
To minimize the antagonistic effects by applying
-Right quantity of fertilizers at Right time in
Right place according to the crop needs.
Better understanding of nutrient interactions may
be useful in understanding importance of
balanced supply of nutrients and consequently
improvement in plant growth or yields
Types of Nutrient Interactions
Synergistic effect : Upon addition of two
nutrients, a increase in crop yield that is more
than adding only one separately , the interaction
is positive .
Ex: 5 +5 = More than 10 type interactions
Antagonistic effect: Similarly, if adding the two
nutrients together produced less yield as compared to
individual ones, the interactions is negative.
Ex: 5 + 5 = less than 10 type of interactions
• No interaction/ Zero interaction : When there
is no change, there is no interaction.
Ex : 5 + 5 =10 type of interactions.
All the three interactions among essential
plant nutrients have been reported.
 However, most interactions are complex.
 A nutrient interacting simultaneously with
more than one nutrients.
This may induced deficiencies,
toxicities, modified growth responses, and/or
modified nutrient composition
INTERACTIONS
1. Interaction between the nutrients .
2. Interactions between nutrients and plant
population.
3.Interaction between Nutrients and planting
date
4 . Interactions between nutrients and placement
5. Interaction between nutrient placement and
conservational tillage
6. Interaction between nutrients and hybrid or
variety .
Synergistic effects
Application of one nutrient may increase the
availability of the other nutrient.
1. Application of Cl containing and acid forming
N-fertilizers boost Mo uptake.
2. Application of N usually enhances
micronutrient and utilization.
3.Application of Mg increases P uptake.
4. Application of P increases uptake and
translocation of Mo.
• Application of NH4 – N improves P uptake.
• Application of N and P improves K uptake.
• Higher availability of Mg and NO3 –N boosts
Mo uptake.
Nutrient antagonism and interaction:
Nitrogen:
 When high levels of N induce accelerated growth rates,
levels of micronutrients that would normally be marginal
can become deficient.
 High soil levels of N can assist P, Ca, B, Fe and Zn but an
excess can dilute these elements. Low soil levels can
reduce P, Ca, B, Fe and Zn uptake. Ammonium N can
make Mo deficiency appear less obvious.
Phosphorus:
 High levels of P reduce Zn and, to a lesser degree, Ca
uptake. It is antagonistic to Boron in low pH soils.
Potassium: High levels of K reduce Mn and to lesser
extent Calcium, Iron, Copper, Manganese and Zinc
uptake. Boron levels can either be low or toxic. Low
levels can accentuate Iron deficiency.
Calcium: High levels of Ca can accentuate Boron
deficiency. Liming can decrease the uptake of Boron,
Copper, Iron, Manganese and Zinc by raising soil pH.
Copper: High levels of Copper can accentuate
Molybdenum and to a lesser degree Iron, Manganese
and Zinc deficiency.
 Iron: Iron deficiency can be accentuated by liming, low K
levels or high levels of Co, Mn or Zn .
 Manganese: High levels of Co, Fe or Zn can accentuate Mn
deficiency – especially repeated soil applications of Iron.
Uptake can be decreased by liming or increased by Sulfur
applications ( because of the affects on pH)
 Molybdenum: Deficiencies can be accentuated by high
levels of Copper and to a lesser degree Mn. Uptake can be
adversely affected by sulfates. Uptake can be increased by
phosphates and liming. Mo can increase Co deficiencies in
animals.
Zinc: Uptake can be decreased by high P levels ,
liming or high levels of Co , Fe or Mn .
 Zn deficiencies are often associated with
Mn deficiencies, especially in citrus.
ANTAGONISTIC EFFECTS
If becomes excess Becomes deficit
Ca P
Ca and Mg K
Ca Mg ( If ratio is more
than 7 :1)
K and NH4 Mg
N,K and Ca B
Fe and SO4 Mo
Cu, Mn, and NH4- N Mo
Cu, Fe, and Mn Al
P Zn
N,P,K Cu
Zn and Al Cu
P Mo
No3-N Fe
CASE STUDIES
On
NUTRIENT INTERACTIONS
Table 1 .Effect of P and S levels on yield ,,P & S uptake and use
efficiencies of S.cane
Treatment Cane yield
(kg/ha)
P Uptake
(kg/ha )
S Uptake
(kg/ha)
P-Use
Efficiency
S-Use
Efficiency
P Level ( kg/ha )
0 61.88 12.47 24.30 92.0
17.5 68.05 14.76 27.03 358.7 101.5
35 73.54 16.48 29.72 332.9 109.5
52.5 74.73 16.90 30.27 234.5 110.5
SEm 2.23 0.22 0.42
CD 6.45 0.64 1.20
S Level (kg/ha)
0 63.44 13.35 24.38 281.8
40 67.87 14.50 27.04 300.9 106.9
80 73.17 16.17 29.68 324.5 118.7
120 73.73 16.59 30.22 327.5 84.5
SEm 2.23 0.22 0.42
CD(P=0.05) 6.45 0.64 1.20
SOURCE:IJ of Agronomy ,2008 NAVNITH AND U.P.SIMHA ,,2003-05,,PUSA,BIHAR
Table 2. Available N ,P, K and S status of soil at harvest as influenced
by nutrient supply in Sorghum.
Treatments Avail. N Avail. P Avail. K Avail. S
Nutrient supply
RDF ( 80 : 40 : 40) 248.92 24.17 330.02 16.33
75 % RDF + 25 %
N through VC +
Azospirillum +
PSB
270.42 28.35 360.02 17.58
50 % RDF + 25 %
through VC +
Azospirillum +
PSB
260.04 23.19 344.90 17.09
SEm 0.469 0.14 0.46 0.07
CD at 5 % 1.40 0.44 1.39 0.21
SOURCE : JL OF SOILS AND CROPS ,,2015… GURAV ,,GAWANDE,,2010 – 11.
Table 3. Effect of Nitrogen levels on nutrient uptake,,net
nutrient availability and economics of S.cane
Treatment Total nutrient
uptake (kg/ha)
Net avail.nut(kg/ha) Cost
(Rs
x1000)
Net
returns (
Rs
x1000)
B:C
N P K N P K
Nitrogen levels ( kg/ha)
150 113 18.4 113.6 159.0 118.2 63.6 79.92 237.27 3.5
180 137.
4
21.2 138.6 184.2 122.3 50.1 80.26 321.98 4.4
210 144.
9
22.6 144.9 212.8 122.4 46.1 80.60 347.87 4.7
SEm 0.8 0.2 1.0
CD
( P=0.05)
2.3 0.4 2.03
SOURCE :IJ of Agronomy ,,2011. DEV et al,,2008-10,,VARANASI ,,U.P
Table 4 .Effect of Sulphur and Zinc on avail. Nutrient
status after harvest of Soya bean
Treatments Avail. N Avail. P Avail. K Avail. S Avail. Zn
Sulphur levels
0 kg /ha 167 17.8 309 8.85 0.58
15 kg /ha 184 16.6 320 9.54 0.61
30 kg/ha 219 18.9 335 10.94 0.65
45 kg/ha 227 18.1 336 12.18 0.67
SEm 3.55 0.56 3.38 0.22 0.33
CD at 5 % 10.25 9.75 0.66
SOURCE : IJ OF SOILS AND CROPS,2014. JADHAO,, LOKHANDE,, et al
,,Akola,,2008-09.
Table 5. Effect of Sulphur and Zinc on avail. Nutrient
status after harvest of Soya bean
Treatments Avail. N
( kg /ha)
Avail. P
( kg/ha)
Avail. K
( kg/ha)
Avail. S
( mg /kg )
Avail. Zn
( mg /kg )
Zinc levels
0 kg /ha 188 16.8 320 9.99 0.62
1 kg /ha 194 17.7 326 10.22 0.63
2 kg/ha 201 18.4 331 10.53 0.63
3 kg/ha 215 18.5 326 10.78 0.69
SEm 3.55 0.56 3.38 0.22 0.33
CD at 5 % 10.25 0.49
SOURCE : IJ OF SOILS AND CROPS,2014. JADHAO,, LOKHANDE,, et al
,,Akola,,2008-09.
Table 6. Effect of and fertilizer levels nutrient uptakes of N ,P, K
in S.cane
Treatment N Uptake
( kg/ha)
P Uptake
( kg/ha)
K Uptake
( kg/ha)
FYM ( t/ha)
0 187 17.2 219.1
20 226 20.7 263.4
SEm 3 0.3 2.5
CD( P=0.05) 9 1.0 7.7
Fertilizer levels ( kg/ha)
N 150 + P 37.1+ K 49.8 (RDF) 164 14.9 191.3
N 150 + P 43.6+ K 66.4(RDF) 196 18.1 230.5
N 200 + P 43.6 + K 83.0 (RDF) 227 20.8 265.5
N 200 + P 54.6 + K 99.6 (RDF) 238 21.9 277.6
SEm 4 0.4 3.6
CD ( P=0.05) 12 1.4 10.9
SOURCE:IJ of Agronomy,2012 KUMAR et al,2008-10 ,PUSA ,BIHAR
Table 7. Effect of FYM and fertilizer levels on yield and
economics of S.cane
Treatment Cane yield
(t /ha)
Cost (Rs
x1000)
Net inc.(Rs
x1000)
B:C
FYM ( t/ha)
0 75.3 63.51 62.41 1.99
20 87.5 67.71 78.83 2.16
SEm 2.1 3.40 0.05
CD( P=0.05) 6.4 10.31 0.16
Fertilizer levels ( kg/ha)
N 150 + P 37.1+ K 49.8 (RDF) 69.2 64.77 50.78 1.79
N 150 + P 43.6+ K 66.4(RDF) 78.3 65.21 65.82 2.01
N 200 + P 43.6 + K 83.0 (RDF) 87.6 65.94 80.66 2.23
N 200 + P 54.6 + K 99.6 (RDF) 90.7 66.54 85.23 2.28
SEm 3.0 4.81 0.08
CD ( P=0.05) 9.0 14.58 0.23
SOURCE:IJ of Agronomy,2012 KUMAR et al,2008-10 ,PUSA ,BIHAR
Table 8. Residual soil status of soil as influenced by the fertilizer
and sulphur levels in Sesame
Treatments Residual fertility status
Avail. N
( mg /kg )
Avail. P
( mg /kg )
Avail. K
( mg /kg )
Avail. S
( mg /kg )
Fertility status
100 % RDF 268.49 20.82 412.62 7.64
125 % RDF 270.46 21.39 412.66 7.94
150 % RDF 272.96 22.02 412.73 8.37
SEm 3.65 0.28 0.79 0.21
CD at 5 % 0.79
Source : IJ OF SOILS AND CROPS,,,2014. TULASI et al ,,2011 -12 ,,NAGPUR .
Table 9 .Residual soil status of soil as influenced by the fertilizer
and sulphur levels in Sesame
Treatments Residual fertility status
Avail. N
( mg /kg )
Avail. P
( mg /kg )
Avail. K
( mg /kg )
Avail. S
( mg /kg )
Sulphur levels
0 Kg / ha 265.26 19.68 410.82 7.29
10 Kg/ ha 267.21 20.46 411.67 7.22
20 kg/ha 270.23 21.26 412.43 7.95
30 kg /ha 272.89 22.31 413.66 8.37
40 kg/ha 277.61 23.33 414.71 9.07
SEm 1.66 0.32 1.21 0.15
CD ( P = 0.05 ) 4.86 0.93 0.44
Source : IJ OF SOILS AND CROPS,,,2014. TULASI et al ,,2011 -12 ,,NAGPUR .
Table 10. Effect of Genotypes and fertility levels on nutrient uptake
,,soil fertility status and economics in S.cane (Autumn season )
Treatment Nutrient
uptake(kg/ha)
PH nutrient
status in soil
Cost of
cultivation
(x 1000 Rs
/ha)
Net
returns ( x
1000Rs/ha
)
B:C
N P K N P K
Genotype
BO 147 231.9 20.6 261.0 214 8.5 101 62.84 57.78 1.90
B0 146 203.2 18.5 233.3 228 10.1 109 62.84 48.25 1.75
CoP 022 165.4 15.0 192.9 242 11.3 114 62.84 40.53 1.63
SEm 5.2 0.4 5.5 5 0.3 3 - 1.35 0.05
CD( P=0.05) 15.6 1.3 16.5 15 0.8 8 - 4.02 0.15
Fertility level
75 (%) 152.0 14.3 181.4 204 7.6 96 61.91 30.40 1.48
100(%) 206.0 18.8 236.2 232 10.8 110 62.83 55.36 1.87
125(%) 242.6 21.0 269.4 248 11.5 118 63.77 60.80 1.94
SEm 5.2 0.4 5.5 5 0.3 3 - 1.35 0.05
CD (P=0.05) 15.6 1.3 16.5 15 0.8 8 - 4.02 0.15
SOURCE:IJ of Agronomy,2012. NAVNITH et al ,PUSA,BIHAR,2007-10.
Table 11. Effect of different levels of P ,,Mo,, and Co on residual
soil fertility in Mungbean
Treatments Avail nutrients ( kg /ha ) in soil
N P2 O5 K 2O
P0 – Mo 0 – Co 0 234.15 11.20 148.36
P20– Mo 0.75 – Co 0.5 241.52 13.12 160.55
P 20– Mo 1.50 – Co 0.5 243.62 23.57 164.12
P 20 – Mo 1.5 – Co 1.0 243.18 24.12 164.36
P40– Mo 0.75 – Co 0.5 244.12 24.66 165.47
P40 – Mo 0.75 – Co 1.0 246.65 26.20 167.32
P40 – Mo 1.50 – Co 0 248.18 30.86 169.54
P40 – Mo 1.50 – C0 1.0 248.87 31.42 171.82
SOURCE : IJ OF SOILS AND CROPS ,,2011. ALBEN et al ,,2008 – 09.
Table 12. Effect of different levels of P ,,Mo,, and Co on residual
soil fertility in Mungbean .
Treatments Avail nutrients ( kg /ha ) in soil
N P2 O5 K 2O
P 60 – Mo 0 – Co 0 257.46 37.16 173.86
P 60– Mo 0.75 – Co 0.5 257.24 37.64 174.12
P 60– Mo 1.50 – Co 0.5 259.15 37.56 174.45
P 60 – Mo 1.5 – Co 1.0 260.66 38.15 175.72
SEm 0.254 1.00 0.692
CD at 5 % 0.741 2.94 2.02
SOURCE : IJ OF SOILS AND CROPS ,,2011. ALBEN et al ,,2008 – 09
Conclusions
Don’t apply the combination of fertilizers
which having antagonistic effect
For Ex : Zinc sulphate and DAP .
 Utilize the synerigistic effect to increase the
NUE
 Apply the fertilizers at right time ,,right
quantity ,,right method ,,in right place according
to the crop requirements…
NUTRIENT INTERACTIONS SHRAVAN REDDY

NUTRIENT INTERACTIONS SHRAVAN REDDY

  • 1.
    NUTRIENT INTERACTIONS Presented by M. ShravanKumar Reddy. M.Sc . Agronomy – 1st year RAM / 16 – 03.
  • 2.
    • What isInteraction ? • What is the need for knowing nutrient interactions?? • Types of nutrient interactions ?? • Interactions among the essential nutrients ?? • Case studies on Nutrient interactions .. • CONCLUSION
  • 3.
    WHAT IS INTERACTION??? Interaction : In simpler terms Interaction means Influence / effect of one upon the other is called INTERACTION . ( OR ) The availability of an ion is influenced by the presence of other ions in soil solution is called Interaction . It may positive or Negative 0r no interaction
  • 4.
    Why we needto know the plant nutrient interactions ?? • There is need for us to know the nutrient interactions and also the interation of nutrients (fertilizers) with other insecticides/fertilizers/pesticides .. • we must know the antagonistic interactions so that we avoid the Combined application of fertilizers (Nutrients) which having antagonistic effect In between them Ex: application of DAP/SSP and Zinc is avoided ..because of antagonistic effect.
  • 5.
    NEED for knowingthe Interactions??? • Balanced supply of of essential nutrients is one of the most important factors in increasing crop yields. • The objective of this topic to discuss interactions among major and minor nutrients in crop plants. • In crop plants, the nutrient interactions are generally measured in terms of growth response and change in concentration of nutrients.
  • 6.
    To know whatcombinations of fertilizers are suitable for application at one time To know the effect of one nutrient upon the other .. To minimize the antagonistic effects by applying -Right quantity of fertilizers at Right time in Right place according to the crop needs. Better understanding of nutrient interactions may be useful in understanding importance of balanced supply of nutrients and consequently improvement in plant growth or yields
  • 7.
    Types of NutrientInteractions Synergistic effect : Upon addition of two nutrients, a increase in crop yield that is more than adding only one separately , the interaction is positive . Ex: 5 +5 = More than 10 type interactions Antagonistic effect: Similarly, if adding the two nutrients together produced less yield as compared to individual ones, the interactions is negative. Ex: 5 + 5 = less than 10 type of interactions
  • 8.
    • No interaction/Zero interaction : When there is no change, there is no interaction. Ex : 5 + 5 =10 type of interactions. All the three interactions among essential plant nutrients have been reported.  However, most interactions are complex.  A nutrient interacting simultaneously with more than one nutrients. This may induced deficiencies, toxicities, modified growth responses, and/or modified nutrient composition
  • 9.
    INTERACTIONS 1. Interaction betweenthe nutrients . 2. Interactions between nutrients and plant population. 3.Interaction between Nutrients and planting date 4 . Interactions between nutrients and placement 5. Interaction between nutrient placement and conservational tillage 6. Interaction between nutrients and hybrid or variety .
  • 11.
    Synergistic effects Application ofone nutrient may increase the availability of the other nutrient. 1. Application of Cl containing and acid forming N-fertilizers boost Mo uptake. 2. Application of N usually enhances micronutrient and utilization. 3.Application of Mg increases P uptake. 4. Application of P increases uptake and translocation of Mo.
  • 12.
    • Application ofNH4 – N improves P uptake. • Application of N and P improves K uptake. • Higher availability of Mg and NO3 –N boosts Mo uptake.
  • 14.
    Nutrient antagonism andinteraction: Nitrogen:  When high levels of N induce accelerated growth rates, levels of micronutrients that would normally be marginal can become deficient.  High soil levels of N can assist P, Ca, B, Fe and Zn but an excess can dilute these elements. Low soil levels can reduce P, Ca, B, Fe and Zn uptake. Ammonium N can make Mo deficiency appear less obvious. Phosphorus:  High levels of P reduce Zn and, to a lesser degree, Ca uptake. It is antagonistic to Boron in low pH soils.
  • 15.
    Potassium: High levelsof K reduce Mn and to lesser extent Calcium, Iron, Copper, Manganese and Zinc uptake. Boron levels can either be low or toxic. Low levels can accentuate Iron deficiency. Calcium: High levels of Ca can accentuate Boron deficiency. Liming can decrease the uptake of Boron, Copper, Iron, Manganese and Zinc by raising soil pH. Copper: High levels of Copper can accentuate Molybdenum and to a lesser degree Iron, Manganese and Zinc deficiency.
  • 16.
     Iron: Irondeficiency can be accentuated by liming, low K levels or high levels of Co, Mn or Zn .  Manganese: High levels of Co, Fe or Zn can accentuate Mn deficiency – especially repeated soil applications of Iron. Uptake can be decreased by liming or increased by Sulfur applications ( because of the affects on pH)  Molybdenum: Deficiencies can be accentuated by high levels of Copper and to a lesser degree Mn. Uptake can be adversely affected by sulfates. Uptake can be increased by phosphates and liming. Mo can increase Co deficiencies in animals.
  • 17.
    Zinc: Uptake canbe decreased by high P levels , liming or high levels of Co , Fe or Mn .  Zn deficiencies are often associated with Mn deficiencies, especially in citrus.
  • 18.
    ANTAGONISTIC EFFECTS If becomesexcess Becomes deficit Ca P Ca and Mg K Ca Mg ( If ratio is more than 7 :1) K and NH4 Mg N,K and Ca B Fe and SO4 Mo Cu, Mn, and NH4- N Mo Cu, Fe, and Mn Al P Zn N,P,K Cu Zn and Al Cu P Mo No3-N Fe
  • 19.
  • 20.
    Table 1 .Effectof P and S levels on yield ,,P & S uptake and use efficiencies of S.cane Treatment Cane yield (kg/ha) P Uptake (kg/ha ) S Uptake (kg/ha) P-Use Efficiency S-Use Efficiency P Level ( kg/ha ) 0 61.88 12.47 24.30 92.0 17.5 68.05 14.76 27.03 358.7 101.5 35 73.54 16.48 29.72 332.9 109.5 52.5 74.73 16.90 30.27 234.5 110.5 SEm 2.23 0.22 0.42 CD 6.45 0.64 1.20 S Level (kg/ha) 0 63.44 13.35 24.38 281.8 40 67.87 14.50 27.04 300.9 106.9 80 73.17 16.17 29.68 324.5 118.7 120 73.73 16.59 30.22 327.5 84.5 SEm 2.23 0.22 0.42 CD(P=0.05) 6.45 0.64 1.20 SOURCE:IJ of Agronomy ,2008 NAVNITH AND U.P.SIMHA ,,2003-05,,PUSA,BIHAR
  • 21.
    Table 2. AvailableN ,P, K and S status of soil at harvest as influenced by nutrient supply in Sorghum. Treatments Avail. N Avail. P Avail. K Avail. S Nutrient supply RDF ( 80 : 40 : 40) 248.92 24.17 330.02 16.33 75 % RDF + 25 % N through VC + Azospirillum + PSB 270.42 28.35 360.02 17.58 50 % RDF + 25 % through VC + Azospirillum + PSB 260.04 23.19 344.90 17.09 SEm 0.469 0.14 0.46 0.07 CD at 5 % 1.40 0.44 1.39 0.21 SOURCE : JL OF SOILS AND CROPS ,,2015… GURAV ,,GAWANDE,,2010 – 11.
  • 22.
    Table 3. Effectof Nitrogen levels on nutrient uptake,,net nutrient availability and economics of S.cane Treatment Total nutrient uptake (kg/ha) Net avail.nut(kg/ha) Cost (Rs x1000) Net returns ( Rs x1000) B:C N P K N P K Nitrogen levels ( kg/ha) 150 113 18.4 113.6 159.0 118.2 63.6 79.92 237.27 3.5 180 137. 4 21.2 138.6 184.2 122.3 50.1 80.26 321.98 4.4 210 144. 9 22.6 144.9 212.8 122.4 46.1 80.60 347.87 4.7 SEm 0.8 0.2 1.0 CD ( P=0.05) 2.3 0.4 2.03 SOURCE :IJ of Agronomy ,,2011. DEV et al,,2008-10,,VARANASI ,,U.P
  • 23.
    Table 4 .Effectof Sulphur and Zinc on avail. Nutrient status after harvest of Soya bean Treatments Avail. N Avail. P Avail. K Avail. S Avail. Zn Sulphur levels 0 kg /ha 167 17.8 309 8.85 0.58 15 kg /ha 184 16.6 320 9.54 0.61 30 kg/ha 219 18.9 335 10.94 0.65 45 kg/ha 227 18.1 336 12.18 0.67 SEm 3.55 0.56 3.38 0.22 0.33 CD at 5 % 10.25 9.75 0.66 SOURCE : IJ OF SOILS AND CROPS,2014. JADHAO,, LOKHANDE,, et al ,,Akola,,2008-09.
  • 24.
    Table 5. Effectof Sulphur and Zinc on avail. Nutrient status after harvest of Soya bean Treatments Avail. N ( kg /ha) Avail. P ( kg/ha) Avail. K ( kg/ha) Avail. S ( mg /kg ) Avail. Zn ( mg /kg ) Zinc levels 0 kg /ha 188 16.8 320 9.99 0.62 1 kg /ha 194 17.7 326 10.22 0.63 2 kg/ha 201 18.4 331 10.53 0.63 3 kg/ha 215 18.5 326 10.78 0.69 SEm 3.55 0.56 3.38 0.22 0.33 CD at 5 % 10.25 0.49 SOURCE : IJ OF SOILS AND CROPS,2014. JADHAO,, LOKHANDE,, et al ,,Akola,,2008-09.
  • 25.
    Table 6. Effectof and fertilizer levels nutrient uptakes of N ,P, K in S.cane Treatment N Uptake ( kg/ha) P Uptake ( kg/ha) K Uptake ( kg/ha) FYM ( t/ha) 0 187 17.2 219.1 20 226 20.7 263.4 SEm 3 0.3 2.5 CD( P=0.05) 9 1.0 7.7 Fertilizer levels ( kg/ha) N 150 + P 37.1+ K 49.8 (RDF) 164 14.9 191.3 N 150 + P 43.6+ K 66.4(RDF) 196 18.1 230.5 N 200 + P 43.6 + K 83.0 (RDF) 227 20.8 265.5 N 200 + P 54.6 + K 99.6 (RDF) 238 21.9 277.6 SEm 4 0.4 3.6 CD ( P=0.05) 12 1.4 10.9 SOURCE:IJ of Agronomy,2012 KUMAR et al,2008-10 ,PUSA ,BIHAR
  • 26.
    Table 7. Effectof FYM and fertilizer levels on yield and economics of S.cane Treatment Cane yield (t /ha) Cost (Rs x1000) Net inc.(Rs x1000) B:C FYM ( t/ha) 0 75.3 63.51 62.41 1.99 20 87.5 67.71 78.83 2.16 SEm 2.1 3.40 0.05 CD( P=0.05) 6.4 10.31 0.16 Fertilizer levels ( kg/ha) N 150 + P 37.1+ K 49.8 (RDF) 69.2 64.77 50.78 1.79 N 150 + P 43.6+ K 66.4(RDF) 78.3 65.21 65.82 2.01 N 200 + P 43.6 + K 83.0 (RDF) 87.6 65.94 80.66 2.23 N 200 + P 54.6 + K 99.6 (RDF) 90.7 66.54 85.23 2.28 SEm 3.0 4.81 0.08 CD ( P=0.05) 9.0 14.58 0.23 SOURCE:IJ of Agronomy,2012 KUMAR et al,2008-10 ,PUSA ,BIHAR
  • 27.
    Table 8. Residualsoil status of soil as influenced by the fertilizer and sulphur levels in Sesame Treatments Residual fertility status Avail. N ( mg /kg ) Avail. P ( mg /kg ) Avail. K ( mg /kg ) Avail. S ( mg /kg ) Fertility status 100 % RDF 268.49 20.82 412.62 7.64 125 % RDF 270.46 21.39 412.66 7.94 150 % RDF 272.96 22.02 412.73 8.37 SEm 3.65 0.28 0.79 0.21 CD at 5 % 0.79 Source : IJ OF SOILS AND CROPS,,,2014. TULASI et al ,,2011 -12 ,,NAGPUR .
  • 28.
    Table 9 .Residualsoil status of soil as influenced by the fertilizer and sulphur levels in Sesame Treatments Residual fertility status Avail. N ( mg /kg ) Avail. P ( mg /kg ) Avail. K ( mg /kg ) Avail. S ( mg /kg ) Sulphur levels 0 Kg / ha 265.26 19.68 410.82 7.29 10 Kg/ ha 267.21 20.46 411.67 7.22 20 kg/ha 270.23 21.26 412.43 7.95 30 kg /ha 272.89 22.31 413.66 8.37 40 kg/ha 277.61 23.33 414.71 9.07 SEm 1.66 0.32 1.21 0.15 CD ( P = 0.05 ) 4.86 0.93 0.44 Source : IJ OF SOILS AND CROPS,,,2014. TULASI et al ,,2011 -12 ,,NAGPUR .
  • 29.
    Table 10. Effectof Genotypes and fertility levels on nutrient uptake ,,soil fertility status and economics in S.cane (Autumn season ) Treatment Nutrient uptake(kg/ha) PH nutrient status in soil Cost of cultivation (x 1000 Rs /ha) Net returns ( x 1000Rs/ha ) B:C N P K N P K Genotype BO 147 231.9 20.6 261.0 214 8.5 101 62.84 57.78 1.90 B0 146 203.2 18.5 233.3 228 10.1 109 62.84 48.25 1.75 CoP 022 165.4 15.0 192.9 242 11.3 114 62.84 40.53 1.63 SEm 5.2 0.4 5.5 5 0.3 3 - 1.35 0.05 CD( P=0.05) 15.6 1.3 16.5 15 0.8 8 - 4.02 0.15 Fertility level 75 (%) 152.0 14.3 181.4 204 7.6 96 61.91 30.40 1.48 100(%) 206.0 18.8 236.2 232 10.8 110 62.83 55.36 1.87 125(%) 242.6 21.0 269.4 248 11.5 118 63.77 60.80 1.94 SEm 5.2 0.4 5.5 5 0.3 3 - 1.35 0.05 CD (P=0.05) 15.6 1.3 16.5 15 0.8 8 - 4.02 0.15 SOURCE:IJ of Agronomy,2012. NAVNITH et al ,PUSA,BIHAR,2007-10.
  • 30.
    Table 11. Effectof different levels of P ,,Mo,, and Co on residual soil fertility in Mungbean Treatments Avail nutrients ( kg /ha ) in soil N P2 O5 K 2O P0 – Mo 0 – Co 0 234.15 11.20 148.36 P20– Mo 0.75 – Co 0.5 241.52 13.12 160.55 P 20– Mo 1.50 – Co 0.5 243.62 23.57 164.12 P 20 – Mo 1.5 – Co 1.0 243.18 24.12 164.36 P40– Mo 0.75 – Co 0.5 244.12 24.66 165.47 P40 – Mo 0.75 – Co 1.0 246.65 26.20 167.32 P40 – Mo 1.50 – Co 0 248.18 30.86 169.54 P40 – Mo 1.50 – C0 1.0 248.87 31.42 171.82 SOURCE : IJ OF SOILS AND CROPS ,,2011. ALBEN et al ,,2008 – 09.
  • 31.
    Table 12. Effectof different levels of P ,,Mo,, and Co on residual soil fertility in Mungbean . Treatments Avail nutrients ( kg /ha ) in soil N P2 O5 K 2O P 60 – Mo 0 – Co 0 257.46 37.16 173.86 P 60– Mo 0.75 – Co 0.5 257.24 37.64 174.12 P 60– Mo 1.50 – Co 0.5 259.15 37.56 174.45 P 60 – Mo 1.5 – Co 1.0 260.66 38.15 175.72 SEm 0.254 1.00 0.692 CD at 5 % 0.741 2.94 2.02 SOURCE : IJ OF SOILS AND CROPS ,,2011. ALBEN et al ,,2008 – 09
  • 32.
    Conclusions Don’t apply thecombination of fertilizers which having antagonistic effect For Ex : Zinc sulphate and DAP .  Utilize the synerigistic effect to increase the NUE  Apply the fertilizers at right time ,,right quantity ,,right method ,,in right place according to the crop requirements…