Download to read offline
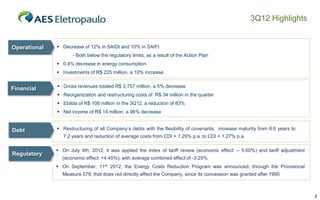
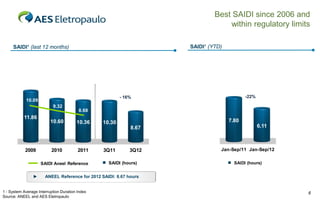
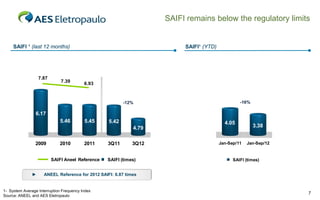
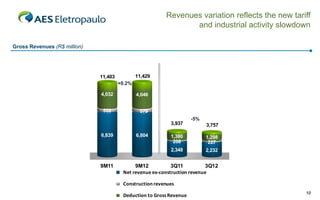
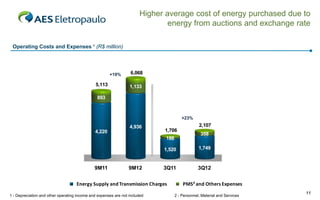
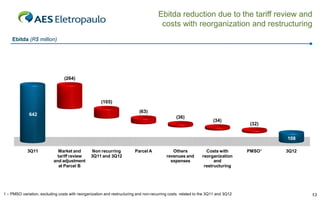
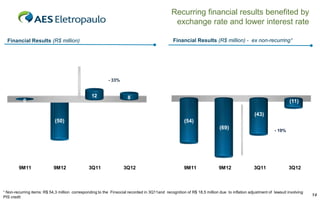
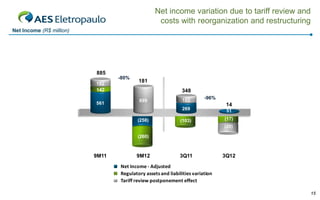
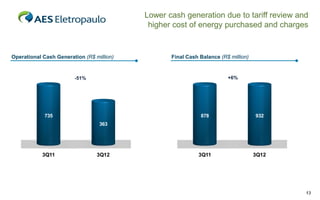
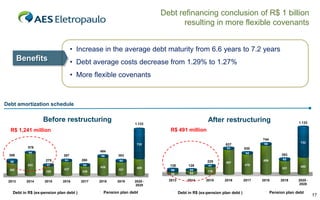
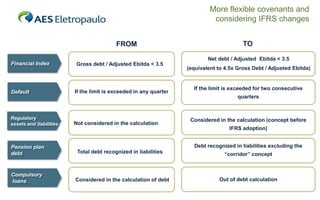

The document summarizes the 3Q12 results of a company. Key points include: - Operational improvements with decreases in SAIDI and SAIFI indices. Investments increased 10% to R$225 million. - Financial results declined due to a 5% decrease in revenues from tariff adjustments, and higher energy costs. EBITDA decreased 83% to R$108 million and net income declined 96% to R$14 million. - The company restructured debts, increasing average maturity to 7.2 years and reducing average costs. Covenants were also made more flexible considering regulatory assets/liabilities and IFRS changes.


![Getting Started with Apache Spark: Big Data Made Simple [Free Meetup]](https://cdn.slidesharecdn.com/ss_thumbnails/apachesparkgettingstarted-260203175547-8361bcc3-thumbnail.jpg?width=640&height=640&fit=bounds)


