SlideShare a Scribd company logo
1 of 35
Download to read offline
1
VATTENFALL YEAR-END REPORT 2020
Year-End Report 2021
KEY DATA
Full year Full year Oct-Dec Oct-Dec
Amounts in SEK million unless indicated otherwise 2021 2020 2021 2020
Net sales 180 119 158 847 63 529 44 032
Operating profit before depreciation, amortisation and impairment losses (EBITDA)1
75 790 46 507 10 226 12 121
Operating profit (EBIT)1
60 271 15 276 7 750 5 246
Underlying EBIT1
31 181 25 790 9 092 7 987
Profit for the period 48 013 7 716 6 101 5 727
Electricity generation, TWh 111.3 112.8 30.5 30.5
Sales of electricity, TWh2
168.9 164.1 45.6 44.0
- of which, customer sales 120.5 118.2 32.1 31.7
Sales of heat, TWh 15.6 13.8 5.1 4.5
Sales of gas, TWh 57.1 56.8 17.3 18.9
Return on capital employed, %1
22.2 5.8 22.2 3
5.8 3
FFO/adjusted net debt, %1
171.2 28.8 171.2 3
28.8 3
1) See Definitions and calculations of key ratios for definitions of Alternative Performance Measures.
2) Sales of electricity also include sales to Nord Pool Spot and deliveries to minority shareholders.
3) Last 12-month values.
Business highlights, January–December 2021
• Higher electricity prices, but Vattenfall’s achieved prices in
the Nordic countries at the same level as last year
• Agreement with the German state regarding compensation
for closure of nuclear power affected the results by SEK 11.1
billion in the second quarter
• Agreement on sale of 49.5% of offshore wind farm Hollandse
Kust Zuid in the Netherlands
• Sale of Stromnetz Berlin completed on July 1. The purchase
price totalled EUR 2.1 billion
• Inauguration of Scandinavia's largest wind farm, Kriegers
Flak in Denmark, and final investment decision for the
Vesterhav Syd and Nord wind farms
• Green light for expanding final repository of short-lived
radioactive waste as well as in January 2022 also for
construction of a final repository for spent nuclear fuel
• Tightening of emission-reduction targets to comply with the
1.5-degree target and net-zero emissions by 2040
• First fossil-free steel from HYBRIT and new collaboration with
Shell, LanzaTech, and SAS for the development of
sustainable aviation fuel
Financial highlights, January–December 2021
• Net sales increased by 13% (16% excluding currency effects)
to SEK 180,119 million (158,847)
• Underlying operating profit1
of SEK 31,181 million (25,790)
• Operating profit1
of SEK 60,271 million (15,276)
• Profit for the period of SEK 48,013 million (7,716)
• The Board of Directors proposes a dividend of SEK 23,414
million
Financial highlights, October–December 2021
• Net sales increased by 44% (46% excluding currency effects)
to SEK 63,529 million (44,032)
• Underlying operating profit1
of SEK 9,092 million (7,987)
• Operating profit1
of SEK 7,750 million (5,246)
• Profit for the period of SEK 6,101 million (5,727)
2
VATTENFALL YEAR-END REPORT 2021
CEO’s comment
Strong result and strategic progress
for Vattenfall in 2021
Vattenfall’s 2021 results is strong, mainly owing to compensation for the
closure of German nuclear power and the divestment of the distribution
operations in Berlin. The earnings impact from higher electricity prices
has been limited since we hedge our generation and achieved prices
were at the same level as last year in the Nordic region. Fossil-based
generation decreased markedly at the same time as nuclear, hydro and
wind power made higher contributions. We increased sales of electricity,
heat, and gas and reached milestones across a number of projects that
are driving the energy transition forward.
Volatility in Europe’s electricity markets
Electricity prices have risen significantly across all of our markets during the
year, and the average price for 2021 was five times higher than the previous
year in the Nordics and three times higher on the Continent. The fact that
Vattenfall's achieved price in the Nordic countries remained unchanged
compared to 2020 was primarily a result of the price hedges we have in place
to balance risks as well as the impact of price area differences in Sweden. In
the fourth quarter, electricity prices continued to reach record levels while
volatility was at historic highs. On the Continent, rising prices for gas and CO2
emission allowances had the greatest impact. This also affected electricity
prices across the Nordic countries, but cold and dry weather were also major
contributors. The market situation affected many customers, especially those
who did not have fixed electricity price agreements. When our customers are
in contact with us we aim to offer them tailored solutions regarding electricity
contract, consumption and payments.
Major result impact from one-off effects
Profit for the year 2021 amounted to SEK 48.0 billion for the full year and
SEK 6.1 billion for the quarter. Compensation for the closure of German
nuclear power and the sale of Stromnetz Berlin bolstered the results for the
year by SEK 12.5 billion and SEK 8.4 billion, respectively. The market
situation had a major temporary impact on our adjusted net debt, which
declined significantly as a result of received margin calls. Taking into
consideration these results with large one-off effects, the Board of Directors
proposes a dividend of SEK 23.4 billion. This will allow us to retain financial
stability as reflected in the balance sheet and Vattenfall will continue to invest
in the energy transition.
Our operations developed very well. The underlying operating profit rose by
SEK 5.4 billion to SEK 31.2 billion. Wind power nearly doubled its contribution
thanks to increased capacity in Denmark and the Netherlands as well as
higher electricity prices in the UK and on the Continent. Our pumped storage
power plants in Germany also made a significant contribution.
New climate target an important step
An important step for Vattenfall for the year was our new emissions target,
which complies with the 1.5-degree scenario set out in the Paris Agreement.
To reach this target, we will need to expand our renewable electricity
generation and phase out fossil fuels in our heat business. During the year, we
opened the biggest offshore wind farm in Scandinavia, Kriegers Flak in
Denmark, and in Sweden the first heat was delivered from the biofuel plant
Carpe Futurum in Uppsala. We are dedicated to establishing more
partnerships, like our sale of a 49.5% share of the offshore wind farm
Hollandse Kust Zuid to BASF. By partnering with customers in respect of both
ownership and production of new renewable capacity, we share risks and
release resources for more investments.
In-depth climate partnerships
For Vattenfall, 2021 was also a year in which we engaged in in-depth
relationships to help the climate. We attended the climate meeting COP26
where we launched the First Movers Coalition. This means that we, along with
32 other companies, have committed ourselves to increasing demand for new
technology with high potential to reduce the world's CO2 emissions. We have
also entered into multiple partnerships to pave the way for the energy
transition. One example of this is our latest collaboration with Shell,
LanzaTech, and SAS to develop sustainable aviation fuel. Another milestone,
in July 2021, was the production of the first fossil-free steel within our
partnership HYBRIT and subsequent delivery by SSAB to Volvo Group.
I would like to thank everyone who contributed to making 2021 such a strong
year for Vattenfall. I look forward to the new year with confidence. In spite of
an uncertain and volatile market, the road ahead is clear for Vattenfall.
Together with my colleagues, I am looking forward to continuing our journey
towards a fossil free life.
Anna Borg
President and CEO
Profit for the period
Full year 2021
48.0
SEK billion
(7.7)
Underlying operating profit
Full year 2021
31.2
SEK billion
(25.8)
FFO/adjusted net debt
Full year 2021
171.2%
(28.8)
Return on capital employed
Full year 2021
22.2%
(5.8)
3
VATTENFALL YEAR-END REPORT 2021
Group overview
Customer sales development
Sales of electricity, excluding sales to Nord Pool Spot and
deliveries to minority shareholders, increased by 2.3 TWh to
120.5 TWh (118.2), mainly owing to higher volumes in the
Nordic countries and in Germany. Lower sales in the B2B
segment in France had a countering effect. Sales of gas
increased by 0.3 TWh to 57.1 TWh (56.8) primarily as a result
of colder weather in the Netherlands and in Germany. Sales
of heat increased by 1.8 TWh to 15.6 TWh (13.8).
CUSTOMER SALES (TWh)
Generation development
Total electricity generation decreased by 1.5 TWh to
111.3 TWh (112.8) in 2021. Lower fossil-based (-4.1 TWh)
power generation and higher hydro (+1.1 TWh), nuclear (+1.0
TWh) and wind power (+0.3 TWh) generation.
ELECTRICITY GENERATION (TWh)
Price development
Average Nordic electricity spot prices were 599% higer, at
EUR 96.2/MWh (13.8) during the fourth quarter of 2021
compared to the same period in 2020, mainly owing to a
lower hydrological balance, cold weather, and higher
electricity prices on the Continent. Spot prices in Germany
were 362% higher, at EUR 178.9/MWh (38.8), and prices in
the Netherlands increased by 365% to EUR 196.0/MWh
(42.2). Prices in Germany and the Netherlands were mainly
affected by higher fuel prices and higher prices for CO2
emission allowances as well as lower wind speeds and
reduced availability of nuclear power in France. Electricity
futures prices for delivery in 2022 and 2023 were 38%–264%
higher than during the fourth quarter of 2020.
Compared with the fourth quarter of 2020 the average spot
price for gas was 551% higher, at EUR 94.7/MWh (14.5). The
spot price for coal was 195% higher, at USD 174.0/t (59.1).
The futures price 2022 for gas was 336% higher, at EUR
63.7/MWh (14.6), and the futures price 2022 for coal was
96% higher, at USD 122.1/t (62.2). The price of CO2 emission
allowances was 148% higher, at EUR 68.3/t (27.5).
AVERAGE INDICATIVE NORDIC HEDGE PRICES (SE, DK, FI)
AS PER 30 DECEMBER 2021, EUR/MWh
EUR/MWh 2022 2023 2024
29 28 28
VATTENFALL’S ESTIMATED NORDIC HEDGE RATIO (SE,
DK, FI) AS PER 30 DECEMBER 2021 (%)
ACHIEVED NORDIC ELECTRICITY PRICES (SE, DK, FI)1
EUR/MWh
Full year
2021
Full year
2020
Oct-Dec
2021
Oct-Dec
2020
31 31 35 31
SENSITIVITY ANALYSIS – CONTINENTAL PORTFOLIO (DE,
NL, UK)2
+/-10% price impact on future
profit before tax, SEK million3
Market-
quoted 2022 2023 2024
Observed
yearly
volatility4
Electricity +/- 1,270 +/- 977 +/- 555 24%-53%
Coal -/+ 43 -/+ 42 -/+ 27 39%-51%
Gas -/+ 455 -/+ 1,681 -/+ 964 21%-64%
CO2 -/+ 78 -/+ 561 -/+ 503 42%-43%
1) Achieved prices from the spot market and hedges. Includes Nordic
hydro, nuclear and wind power generation
2) Vattenfall’s continental portfolio is mainly exposed to clean spark
spreads. Vattenfall hedges these production margins, which in turn
affects reported sensitivity figures for electricity, gas and CO2
emission allowances
3) The denotation +/- entails that a higher price affects operating profit
favourably, and -/+ vice versa
4) Observed yearly volatility for daily price movements for each
commodity, based on forward contracts. Volatility normally
decreases the further ahead in time the contracts pertain to.
0
20
40
60
80
100
120
140
Electricity Gas Heat
Full year 2020 Full year 2021
0
10
20
30
40
50
Fossil Nuclear Hydro Wind Biomass,
waste
Full year 2020 Full year 2021
72
50
23
0
20
40
60
80
2022 2023 2024
4
VATTENFALL YEAR-END REPORT 2021
Net sales
January–December: Consolidated net sales increased by
SEK 21.3 billion, including negative currency effects of SEK 4.2
billion). The increase is mainly attributable to higher electricity
prices and higher sales volumes in the Nordic countries and
Germany.
October–December: Consolidated net sales increased by
SEK 19.5 billion, including negative currency effects of SEK 0.8
billion. The increase is primarily attributable to higher electricity
prices in customer sales.
Earnings
January–December: The underlying operating profit increased
by SEK 5.4 billion, which is explained by:
• Higher earnings contributions from the Power Generation
operating segment (SEK 4.7 billion) primarily as a result of
increased nuclear and hydro power generation, higher
contributions from pumped storage in Germany thanks to
favourable prices and higher realised earnings contribution
from the trading business
• Higher earnings contributions from the Wind operating
segment (SEK +3.9 billion) mainly owing to higher electricity
prices in the UK and on the Continent, as well as new
capacity, which was offset in part by lower wind speeds
• Lower earnings contributions from the Distribution operating
segment (SEK -2.2 billion) mainly due to the sale of
Stromnetz Berlin as well as lower gross margin in the
Swedish operation
• Lower earnings contributions from the Heat operating
segment (SEK -1.3 billion) attributable to higher prices for
gas and CO2 emission allowances, which led to lower clean
spark spreads
• Other items, net (SEK 0.4 billion)
Items affecting comparability amounted to SEK 29.1 billion
(-10.5), of which most pertains to compensation for the closure
of nuclear power operations in Germany (SEK 12.5 billion),
changes in market value for energy derivatives and inventories
(SEK 10.0 billion), and the capital gain from the sale of
Stromnetz Berlin (SEK 8.4 billion). Profit for the period totalled
SEK 48.0 billion (7.7) and was affected by – in addition to items
affecting comparability – a higher tax cost and higher net
financial items resulting from a higher return from the Swedish
Nuclear Waste Fund.
October–December: Underlying operating profit increased by
SEK1.1 billion. The Wind operating segment contributed
positively (SEK 3.0 billion) mainly owing to higher electricity
prices and new capacity. The Power Generation operating
segment also contributed positively (SEK 1.0 billion), mainly
owing to higher achieved prices in the Nordic countries. The
Heat and Distribution operating segments contributed
negatively (SEK -1.8 billion and SEK -1.0 billion, respectively).
Items affecting comparability amounted to SEK -1.3 billion
(-2.7), of which most pertains to changes in market value for
energy derivatives and inventories (SEK -2.3 billion) and
provisions (SEK -1.3 billion) primarily related to nuclear power.
Reversed impairment losses (SEK 1.9 billion) had a countering
effect. Profit for the period was SEK 6.1 billion (5.7) and was
affected by a higher operating profit (EBIT) and higher tax cost.
Cash flow
January–December: Funds from operations (FFO) increased
by SEK 11.1 billion primarily as a result of higher underlying
operating profit before depreciation, amortisation and
impairment losses (EBITDA). Cash flow from changes in
working capital amounted to SEK 54.0 billion. The largest
contributing factors were changes related to the net change in
margin calls received (SEK 88.0 billion), an increase in
inventories (SEK -23.1 billion), an increase in operating
receivables in the Customers & Solutions operating segment
(SEK -4.4 bn) and CO2 emission allowances (SEK -3.4 billion).
October–December: Funds from operations (FFO) increased
by SEK 7.2 billion primarily because compensation for the
closure of nuclear power operations in Germany was included
in the FFO in the fourth quarter. Cash flow from changes in
working capital amounted to SEK -14.5 billion, which is mainly
explained by an increase in inventories (SEK -19.1 billion) and
net changes in margin calls received (SEK 9.2 billion).
Events after the balance sheet date
• On 27 January 2022, the Swedish government decided to
permit a final repository for spent nuclear fuel at Forsmark.
KEY FIGURES – GROUP OVERVIEW
Full year Full year Oct-Dec Oct-Dec
Amounts in SEK million 2021 2020 2021 2020
Net sales 180 119 158 847 63 529 44 032
Operating profit before depreciation, amortisation and impairment losses (EBITDA)1
75 790 46 507 10 226 12 121
Operating profit (EBIT)1
60 271 15 276 7 750 5 246
Underlying operating profit1
31 181 25 790 9 092 7 987
Items affecting comparability1
29 090 - 10 514 - 1 342 - 2 741
Profit for the period 48 013 7 716 6 101 5 727
Funds from operations (FFO)1
46 096 35 024 18 616 11 368
Cash flow from changes in operating assets and operating liabilities (working capital) 54 036 6 668 - 14 486 3 486
Cash flow from operating activities 100 132 41 692 4 130 14 854
1) See Definitions and calculations of key ratios for definitions of Alternative Performance Measures.
5
VATTENFALL YEAR-END REPORT 2021
Capital structure
Cash and short-term investments increased by SEK 114.7 billion compared with the level at 31 December 2020. Committed credit
facilities consist of a EUR 2.0 billion Revolving Credit Facility that expires in November 2023. As per 31 December 2021 available
liquid assets and/or committed credit facilities amounted to 104.3% of net sales. Vattenfall’s target is to maintain a level of no less
than 10% of consolidated net sales, but at least the equivalent of the next 90 days’ maturities.
Net debt decreased by SEK 92.9 billion to a net asset of SEK 44.7 billion and adjusted net debt decreased by SEK 94.6 to SEK
26.9 billion compared to 31 December 2020. These reductions are mainly attributable to a positive cash flow after investments
(SEK 94.2 billion), which is largely explained by the change in working capital (SEK 54.0 billion). Significantly increased electricity
and gas prices resulted in higher margin calls received but also an increased credit risk for Vattenfall. The adjusted net debt was
also affected by reduced pension provisions (SEK 3.5 billion) and higher provisions for nuclear power (SEK 2.4 billion). Currency
effects increased net debt by SEK 1.2 billion. The key ratio FFO/adjusted net debt increased to 171.2%, which is mainly due to the
effects of the net change in margin calls received.
NET DEBT
-60
-30
0
30
60
90
120
-60 000
-30 000
0
30 000
60 000
90 000
120 000
Q3
2020
Q4
2020
Q1
2021
Q2
2021
Q3
2021
Q4
2021
%
MSEK
Interest-bearing liabilities, MSEK
Net debt, MSEK
Gross debt/equity, %
Net debt/equity, %
ADJUSTED NET DEBT
0
50
100
150
200
0
30 000
60 000
90 000
120 000
150 000
Q3
2020
Q4
2020
Q1
2021
Q2
2021
Q3
2021
Q4
2021
%
MSEK
Adjusted net debt, MSEK
FFO/adjusted net debt, %
Strategic objectives and targets for 2025
Strategic focus area Targets for 2025 Outcome 2021 Outcome 2020
Driving decarbonisation with
our customers & partners
1. Customer engagement, absolute Net
Promoter Score (NPS) 1
: +18 +10 +7
Securing a fossil-free energy
supply
2. CO2 emissions intensity2
: ≤86 gCO2e/kWh 79 97
Delivering high-performing
operations
3. Funds from operations (FFO)/adjusted net
debt: 22%–27%
171.2% 28.8%
4. Return On Capital Employed (ROCE), last
12 months: ≥8% 22.2% 5.8%
Empowering our people 5. Lost Time Injury Frequency (LTIF)3
: ≤1.0 1.7 1.8
6. Employee Engagement Index4
: ≥75% 75% 74%5
1) Absolute NPS is weighted 80% from Customers & Solutions and 20% from Heat, which corresponds to our customer composition. Reported on an annual basis
2) Includes CO2 and other greenhouse gases, such as N2O and SF6. Consolidated value. The target for 2025 is to be on track to achieving the 1.5°C target by 2030,
in accordance with SBT
3) Rolling 12-month values. LTIF (Lost Time Injury Frequency) is expressed in terms of the number of lost time work injuries per 1 million hours worked. The metric
pertains only to Vattenfall employees
4) Documentation for measurement of target achievement is derived from the results of an employee survey, which is conducted on an annual basi
5) The value has been adjusted compared with previously published information due to change in methodology.
6
VATTENFALL YEAR-END REPORT 2021
67%
14%
10%
9%
Growth capex per
technology 2022-2023
Wind power, 23 bn SEK
Heat supply, 5 bn SEK
Electricity distribution, 3 bn SEK
Other, 3 bn SEK
Empty
54%
26%
14%
7%
Growth capex per country
2022-2023
The Netherlands, 18 bn SEK
Denmark, 9 bn SEK
Sweden, 5 bn SEK
Germany and other, 2 bn SEK
62%
28%
10%
Total capex
2022-2023
Growth, 34 bn SEK
Maintenance, 16 bn SEK
Replacement, 6 bn SEK
Empty
34
SEK billion
34
SEK billion
55
SEK billion
1
Investment plan 2022-2023
Vattenfall has decided on an investment plan for 2022-2023 of net SEK 55 billion. Gross investments amount to SEK 77 billion and
the difference is attributable to partnership for the wind power project Hollandse Kust Zuid 1-4, assumptions for partnership for the
Norfolk projects, as well as assumptions related to income derived from divestment of certain onshore wind and solar projects,
which are being developed for sale. The amounts stated below refer to net investments.
Growth investments total SEK 34 billion with the largest share, SEK 23 billion, corresponding to 67%, planned to be invested in
wind power. Vattenfall will also invest in electricity grids and expansion of district heating operations. Other growth investments
include charging infrastructure, solar and battery projects, heating and energy solutions, and the HYBRIT project .
1
Germany (SEK 3 billion) and other (SEK -0.7 billion). Other countries mainly relate to France and the UK, negative value owing to expected income from
partnerships and from projects devloped for sale.
7
VATTENFALL YEAR-END REPORT 2021
Operating segments
Full year Full year Oct-Dec Oct-Dec
Amounts in SEK million 2021 2020 2021 2020
Underlying EBIT
Customers & Solutions 2 349 2 146 104 387
Power Generation 19 334 14 670 4 935 3 938
- of which, realised trading result 3 633 2 757 - 473 631
Wind 7 866 3 970 4 676 1 716
Heat - 343 978 - 981 784
Distribution 3 152 5 325 459 1 454
- of which, Distribution Germany 666 1 093 — 268
- of which, Distribution Sweden 2 516 4 225 484 1 177
Other1
- 1 189 - 1 290 - 275 - 397
Eliminations 12 - 9 174 105
Underlying operating profit 31 181 25 790 9 092 7 987
1) “Other” pertains mainly to all Staff functions, including Treasury and Shared Service Centres.
8
VATTENFALL YEAR-END REPORT 2021
Customers & Solutions
The Customers & Solutions Business Area is responsible for
sales of electricity, gas and energy services in all of Vattenfall’s
markets.
Increased customer base and continued expansion in e-
vehicle charging solutions
• The total customer base grew to 10.5 million contracts
• New heating pump launched as alternative to gas-fired
boilers
• Continued expansion of public charging network for electric
vehicles
Full year: Net sales increased by 23% compared to 2020.
Underlying operating profit increased by 9%, mainly owing to
customer growth and lower average temperatures in the
Netherlands and Germany. Several of our markets had colder
weather during the first half of the year. This had a positive
effect on sales of electricity, mainly in the Nordic countries, while
it contributed to higher sales of gas in the Netherlands and
Germany. Compared with year-end 2020, the total customer
base grew by 3.7% to 10.5 million contracts.
Q4: Net sales increased by 50%, mainly owing to higher
electricity prices in the Nordic countries. Underlying operating
profit decreased by 73% compared to 2020, mainly due to
higher sourcing costs resulting from higher electricity prices and
periods with cold weather in the Nordics. Sales of electricity
increased as a result of colder weather in the Nordic countries,
which was countered by lower volumes in the B2B segment in
France.
Vattenfall has launched a heat pump system to replace gas-fired
boilers in single-family homes. The heat pump is an innovative
high temperature heat pump, which avoids large direct
investments in changing the heat delivery system (radiators)
and large-scale insulation, thereby reducing the cost to move to
a gas-free heating system. The first heat pumps are expected
to be delivered to customers in the Netherlands in mid-2022;
and the solution will later be introduced to other markets with
comparable needs and demands.
In the Netherlands, Vattenfall has also started a large-scale
smart rollout of an EV-charging infrastructure, the first of its kind
in Europe. Suitable locations for charging stations were selected
in partnership with 68 municipalities and by means of a data-
driven model. By 2024 Vattenfall will have installed a total of
8,000 charging points in the provinces of North Brabant and
Limburg.
In Germany, Vattenfall is continuing its expansion with public
charging solutions for electric vehicles. In collaboration with the
German pet store chain Das Futterhaus, Vattenfall will install
170 charging points for high-powered charging at close to 70
locations in Germany. Vattenfall will be responsible for planning,
construction, and operation of the charging stations.
Vattenfall has launched a new app in Germany called Naturate.
The app is used to calculate the user’s carbon footprint from
travelling, shopping, and heating. Users are given advice on
how to reduce their carbon footprint and have the chance to
compensate for any remaining emissions.
KEY FIGURES – CUSTOMERS & SOLUTIONS
Full year Full year Oct-Dec Oct-Dec
Amounts in SEK million unless indicated otherwise 2021 2020 2021 2020
Net sales 106 560 86 298 35 822 23 931
External net sales 102 300 84 661 34 109 23 470
Underlying EBITDA 3 230 3 083 317 611
Underlying EBIT 2 349 2 146 104 387
Sales of electricity, TWh 96.1 95.8 25.5 25.7
- of which, private customers 26.8 26.3 7.5 7.3
- of which, resellers 7.9 8.0 2.6 2.6
- of which, business customers 61.4 61.5 15.4 15.8
Sales of gas, TWh 56.0 52.1 16.9 17.6
Number of employees, full-time equivalents 3 213 2 971 3 213 2 971
9
VATTENFALL YEAR-END REPORT 2021
Power Generation
Power Generation comprises the Generation and Markets
Business Areas. The segment includes Vattenfall’s hydro and
nuclear power operations, maintenance services business, and
optimisation and trading operations including certain large
business customers. The result from hedging of the Group’s net
exposure in electricity and fuel is reported in this segment.
Higher electricity prices and increased generation
volumes
• Generation record at Forsmark nuclear power plant
• Fourth quarter earnings affected by higher achieved prices
in the Nordic countries
• Green light from the Swedish government to expand the
final repository for short-lived radioactive waste and to
permit a final repository for spent nuclear fuel
• New partnership with Cargill and Windpark Hanze lowering
CO2 emissions in the Netherlands
Full-year: Net sales increased by 40%. Underlying operating
profit increased by 32%, mainly owing to higher hydro (1.1 TWh)
and nuclear (1.0 TWh) power generation, increased contribution
from pumped hydro storage operations in Germany given
favourable prices as well as higher realised trading result. The
achieved price in the Nordic countries were at the same level as
in 2020 (EUR 31/MWh), partly affected by large price
differences between electricity areas in Sweden. A lower
average hedging price was countered by a higher spot price
following the recent sharp rise in electricity prices.
The combined availability of Vattenfall’s nuclear power plants
during the period January–December 2021 was 84.8% (76.4%).
Higher availability and higher generation in 2021 compensated
for the lower volume attributable to the closure of Ringhals 1 on
31 December 2020. The nuclear power plant Forsmark reached
record levels of generation in 2021 with a 25.5 TWh delivered
volume.
At the end of the fourth quarter, Nordic reservoir levels were at
65% (82%) of capacity, which is 6 percentage points above the
normal level.
Q4: Net sales increased by 112%. Underlying operating profit
increased by 25%, mainly owing to higher achieved price in the
Nordic countries. A higher average spot price was partly offset
by a lower hedging price. A lower realised trading result had a
countering effect. High market volatility has also affected
Vattenfall’s credit risk exposure, which is handled within the
company’s risk management framework.
Through the Markets Business Area and a 15-year supply
agreement, Vattenfall will purchase the generated electricity
from 78 MW of a new onshore wind farm that is being built by
Windpark Hanze in the Netherlands. The global food corporation
Cargill, in turn, will purchase 2.9 TWh from Vattenfall through a
10-year corporate power purchase agreement, which will cover
more than 90% of Cargill's electricity consumption in the
Netherlands. The wind farm is scheduled to be commissioned in
2023 and is estimated to reduce carbon emissions by 350,000
tonnes per year.
The Swedish government has approved the application from the
Swedish Nuclear Fuel and Waste Management Company (SKB)
to expand the final repository for short-lived radioactive waste
(SFR) in Forsmark. The facility needs to expand to make room
for demolition waste from the Swedish nuclear power plants.
After the end of the fourth quarter the Swedish government also
decided to permit a final repository for spent nuclear fuel at
Forsmark.
KEY FIGURES – POWER GENERATION
Full year Full year Oct-Dec Oct-Dec
Amounts in SEK million unless indicated otherwise 2021 2020 2021 2020
Net sales 126 318 90 133 52 649 24 825
External net sales 40 312 36 597 16 962 9 571
Underlying EBITDA 23 714 18 796 6 073 4 997
Underlying EBIT 19 334 14 670 4 935 3 938
- of which, realised trading result 3 633 2 757 - 473 631
Electricity generation, TWh 81.2 79.0 21.5 21.2
- of which, hydro power 40.8 39.7 10.3 10.4
- of which, nuclear power 40.4 39.3 11.2 10.8
Sales of electricity, TWh 22.2 20.0 5.9 5.3
- of which, resellers 17.5 17.9 2.0 4.7
- of which, business customers 4.7 2.1 3.9 0.6
Sales of gas, TWh 1.1 4.7 0.4 1.3
Number of employees, full-time equivalents 7 260 7 474 7 260 7 474
10
VATTENFALL YEAR-END REPORT 2021
Wind
The Wind Business Area is responsible for development,
construction and operation of Vattenfall’s wind farms as well as
large-scale and decentralised solar power and batteries.
Earnings lifted by higher electricity prices and new
capacity
• Final investment decision for Vesterhav Syd and Nord
offshore wind farms in Denmark
• Planning consent granted for the offshore wind farm Norfolk
Boreas in the UK
Full year: Net sales increased by 54% compared to 2020.
Underlying operating profit increased by 98% as a result of
higher electricity prices, especially in the UK, and new capacity
mainly attributable to the Princess Ariane onshore wind farm in
the Netherlands and the Kriegers Flak offshore wind farm in
Denmark. Earnings were also affected positively by divestment
of onshore wind farms like Grönhult in Sweden and part of
Princess Ariane in the Netherlands. Lower wind speeds and
lower offshore availability due to increased maintenance work
had a negative impact compared to the previous year. Electricity
generation increased by 3% as a result of higher generation
from new capacity, which was countered in part by lower
generation from existing assets.
Q4: Net sales increased by 159%. Underlying operating profit
increased by 172% owing to higher electricity prices and new
capacity, which were partly offset by lower wind speeds.
Electricity generation increased by 26% as a result of new
capacity, mainly from the Princess Ariane onshore wind farm in
the Netherlands and the Kriegers Flak offshore wind farm in
Denmark, which was partly offset by lower wind speeds,
especially in the Netherlands
In December, Vattenfall made the final investment decision for
the Vesterhav Syd and Nord offshore wind farms in Denmark.
The wind farms are slated for completion in 2023 and will have
a combined capacity of 344 MW, corresponding to the annual
electricity consumption of 350,000 Danish households. The
total investment amounts to EUR 769 million and this is
Vattenfall’s third-largest project in offshore wind in Denmark,
having previously completed the wind farms Kriegers Flak and
Horns Rev 3.
The UK government has awarded planning consent for
Vattenfall’s offshore wind farm Norfolk Boreas. The wind farm
is expected to begin generating electricity in the mid-2020s and
to have a capacity of 1.8 GW, corresponding to the annual
electricity consumption of 2 million British households.
In the Netherlands, the insurance company a.s.r. will purchase
a portion of Vattenfall's onshore wind farm Princess Ariane.
This means that a.s.r. will own 32 of 82 turbines, which
corresponds to a capacity of 118 MW. Vattenfall will remain
responsible for maintaining the turbines and will purchase the
generated electricity.
In October, Vattenfall completed a transaction to sell eight of its
wind and solar power assets to European Energy. The assets
are situated in Denmark, Germany, the Netherlands, and the
United Kingdom, and have a total capacity of 85.8 MW. They
include already commissioned plants as well as solar power
projects in development. The sale enables Vattenfall to
optimise its onshore fleet by reducing the range of turbine
models and it provides for greater technological
standardisation. Vattenfall will continue to grow in onshore wind
power and currently has in excess of 1 GW under construction.
Vattenfall is also expanding in solar power and batteries. In the
Netherlands, the solar farm Kooypunt (13 MW) started supplying
electricity; and Vattenfall was awarded a tender for a solar farm
of 17 MW in Almere to be built without government subsidies.
Construction has also started on a battery with a 20 MW (46
MWh) capacity at the onshore wind farm Ray in the United
Kingdom.
KEY FIGURES – WIND
Full year Full year Oct-Dec Oct-Dec
Amounts in SEK million unless indicated otherwise 2021 2020 2021 2020
Net sales 20 872 13 565 10 256 3 959
External net sales 7 791 6 901 4 150 2 047
Underlying EBITDA 13 451 9 426 6 118 2 982
Underlying EBIT 7 866 3 970 4 676 1 716
Electricity generation - wind power TWh 11.1 10.8 3.9 3.1
Sales of electricity, TWh 1.0 1.2 0.4 0.4
Number of employees, full-time equivalents 1 279 1 104 1 279 1 104
11
VATTENFALL YEAR-END REPORT 2021
Heat
The Heat Business Area comprises Vattenfall’s heat business
(district heating and decentralised solutions) and gas-fired
condensing plants.
Lower clean spark spreads
• Earnings negatively affected by lower clean spark spreads
for operations in Berlin
• New partnerships for increased integration of district
heating
• Connection of district heating networks in Amsterdam
completed
Full year: Net sales increased by 49% compared with 2020.
Underlying operating profit decreased by 135% compared with
2020 mainly owing to higher gas and CO2 prices which led to
lower clean spark spreads largely affecting the heat operations
in Berlin. The end of commercial operation of the Moorburg
power plant in December 2020 had a positive effect on
underlying operating profit by SEK 1.1 billion, mainly driven by
lower operating costs and lower depreciation. Sales of heat
increased as a result of lower temperatures and a growing
customer base, which also had a positive effect. Compared with
year-end 2020, the number of customers increased by 2.0% to
the equivalent of 1.8 million households.
Q4: Net sales increased by 108% compared with the fourth
quarter of 2020. Underlying operating profit decreased by 225%
compared with the same period a year ago, owing to higher gas
and CO2 prices, which led to lower clean spark spreads mainly
affecting the heat operations in Berlin. This was partly countered
by lower operating costs and lower depreciation, largely
associated with the end of commercial operation of Moorburg in
December 2020.
In Sweden, Vattenfall entered into new partnerships that will
facilitate the integration of district heating. Vattenfall has
expanded its partnership with AstaReal by signing an energy
contract for reclaiming excess heat from algae cultivation. It is
estimated that the heating needs for 2,500 new apartments in
Gustavsberg will be met through this partnership. Vattenfall has
also signed contracts with Oxelö Energi to connect the district
heating network in Oxelösund to Vattenfall’s combined heat-
and-power plant in Nyköping. The new biofuel-based district
heating supply is estimated to be brought online in 2025 once
the waste-heat supply from SSAB ends.
An auxiliary heat plant with a heat-buffer opened in October as
the final link in the Amsterdam South Connection project. The
project links the district heating in the south-eastern and north-
western parts of Amsterdam and provides opportunities for
connecting more sustainable district heating. In turn, this
represents a major step towards the goal of connecting up to
290,000 homes to district heating by 2040.
Vattenfall continues to develop innovative heating solutions that
contribute to higher energy efficiency and lower CO2 emissions.
In the Dutch city of Nijmegen, Vattenfall and BPD (Bouwfonds
Property Development) have signed a contract to build a local
storage solution for heating and cooling combined with district
heating. In 2024, approximately 300 newly built homes will be
supplied with heat, hot water, and cooling. A new heat pump
system has been entered into service on a separate heating
network in north-eastern Berlin. This system has the capacity to
reclaim excess heat from heat production and has the potential
to save 5,000 MWh in heat from the burning of natural gas,
which represents the consumption of about 220 single-family
homes.
KEY FIGURES – HEAT
Full year Full year Oct-Dec Oct-Dec
Amounts in SEK million unless indicated otherwise 2021 2020 2021 2020
Net sales 34 759 23 328 15 119 7 279
External net sales 14 655 13 538 4 819 4 165
Underlying EBITDA 2 590 4 462 - 237 1 581
Underlying EBIT - 343 978 - 981 784
Electricity generation - TWh 19.0 23.0 5.1 6.2
- of which, fossil-based power 18.6 22.7 5.0 6.1
- of which, biomass, waste 0.3 0.3 0.1 0.1
Sales of electricity business customers, TWh 1.2 1.2 0.3 0.3
Sales of heat, TWh 15.6 13.8 5.1 4.5
Number of employees, full-time equivalents 3 126 3 213 3 126 3 213
12
VATTENFALL YEAR-END REPORT 2021
Distribution
The Distribution Business Area comprises Vattenfall’s electricity
distribution operations in Sweden as well as operations in the
UK focused on owning and operating new networks
Lower earnings as a result of price reductions and
higher costs for the transmission network
• The Administrative Court of Appeal in Jönköping has
granted leave to appeal in proceeding related to the
revenue frames for 2020–2023 for the distribution system
operators
• Markets for flexibility reduce capacity shortages on the
electricity grid during the winter season
• High inflow of connection requests and continued large
investments in the electricity grid
Full-year: Net sales decreased by 20%, and underlying
operating profit decreased by 41% compared to 2020. The sale
of Stromnetz Berlin on 1 July 2021 affected the net sales
comparison by SEK 4.8 billion and the underlying operating
profit negatively by SEK 0.6 billion. In addition, underlying
operating profit was affected by a lower gross margin in the
Swedish operations, mainly owing to price reductions in the
local grid, higher costs for the transmission network as well as
an increase in network losses caused by higher electricity
prices. This was partly countered by higher distributed volume in
connection with colder weather.
Q4: Net sales decreased by 43% compared to 2020, and
underlying operating profit decreased by 68%. The sale of
Stromnetz Berlin affected the net sales comparison by SEK 2.4
billion and underlying operating profit negatively by SEK 0.3
billion. In addition, the underlying operating profit was affected
by a lower gross margin in the Swedish operations, mainly
owing to higher costs for the transmission network, an increase
in network losses caused by higher electricity prices and price
reductions in the local grid. This was partly offset by higher
distributed volume as a result of colder weather.
In the spring of 2021, the Linköping Administrative Court of
Appeal announced the verdict about the 2020-2023 revenue
frames for the distribution system operators. The Swedish
Energy Markets Inspectorate (Energimarknadsinspektionen)
appealed the decision, and at the end of November the
Jönköping Administrative Court of Appeal accepted the 120
cases for review.
There has been a continued high inflow of connection requests
to the electricity grid, and Vattenfall has invested extensively in
both regional and local grids. In total, SEK 4.9 billion was
invested in Sweden in 2021. The need for major investments in
the electricity grid also means that there is an increased need
for continued recruitment. As part of a long-term investment in
competence and to broaden its skill base, Vattenfall has started
a programme for newly graduated academics.
Protracted licensing processes for building electricity grids
continue to present a major challenge for the energy transition in
Sweden. As the electricity grid is developed and strengthened,
Vattenfall is working on various solutions to contribute to
reducing capacity shortages across the grid. There is a local
market for output flexibility in Uppsala within the framework of
the EU-funded project CoordiNet where 18 local flexible
resources and 400 houses contribute to a more efficient energy
system. A corresponding market is available in the Stockholm
region, sthlmflex, where 2,100 electricity users and suppliers are
participating with, among other things, electric vehicle chargers,
and heating of housing and major properties.
The electrification of the transport sector continues and the
electricity grid is a central prerequisite for the needed charging
infrastructure. To enable accelerated connections to the
electricity grid, Vattenfall has started a research and
development project called FlexConnect in Riksgränsen. The
project will test and evaluate flexible connection technology for
electric vehicle fast chargers when the electricity grid does not
have sufficient capacity available.
KEY FIGURES – DISTRIBUTION
Full year Full year Oct-Dec Oct-Dec
Amounts in SEK million unless indicated otherwise 2021 2020 2021 2020
Net sales 17 262 21 644 3 429 5 982
External net sales 14 643 16 970 3 306 4 736
Underlying EBITDA 5 913 8 725 1 102 2 328
Underlying EBIT 3 152 5 325 459 1 454
Number of employees, full-time equivalents 1 165 2 366 1 165 2 366
13
VATTENFALL YEAR-END REPORT 2021
Other
Other pertains mainly to all Staff functions, including Treasury
and Shared Service Centres.
Net sales consist primarily of revenues attributable to
Vattenfall’s service organisations such as Shared Services, IT
and Vattenfall Insurance.
KEY FIGURES – OTHER
Full year Full year Oct-Dec Oct-Dec
Amounts in SEK million unless indicated otherwise 2021 2020 2021 2020
Net sales 6 169 5 917 1 714 1 662
External net sales 418 180 183 43
Underlying EBITDA - 326 - 442 - 95 - 189
Underlying EBIT - 1 189 - 1 290 - 275 - 397
Number of employees, full-time equivalents 2 792 2 731 2 792 2 731
14
VATTENFALL YEAR-END REPORT 2021
Consolidated income statement
Full year Full year Oct-Dec Oct-Dec
Amounts in SEK million 2021 2020 2021 2020
Net sales 180 119 158 847 63 529 44 032
Cost of purchases - 87 474 - 76 225 - 43 072 - 20 243
Other external expenses - 18 450 - 20 732 - 5 064 - 8 107
Personnel expenses - 19 801 - 19 535 - 4 993 - 4 787
Other operating income and expenses, net 21 454 3 882 - 159 1 078
Participations in the results of associated companies - 58 270 - 15 148
Operating profit before depreciation, amortisation and impairment losses (EBITDA) 75 790 46 507 10 226 12 121
Depreciation, amortisation and impairments - 15 519 - 31 231 - 2 476 - 6 875
Operating profit (EBIT) 60 271 15 276 7 750 5 246
Financial income3
783 558 110 76
Financial expenses1,2,3
- 5 906 - 5 886 - 1 599 - 1 402
Return from the Swedish Nuclear Waste Fund 4 225 2 058 895 633
Profit before income taxes 59 373 12 006 7 156 4 553
Income taxes - 11 360 - 4 290 - 1 055 1 174
Profit for the period 48 013 7 716 6 101 5 727
Attributable to owner of the Parent Company 46 828 6 489 5 774 5 132
Attributable to non-controlling interests 1 185 1 227 327 595
Supplementary information
Underlying EBITDA4
48 584 44 041 13 452 12 415
Underlying EBIT4
31 181 25 790 9 092 7 987
Financial items, net excl. discounting effects attributable
to provisions and return from the Swedish Nuclear Waste Fund - 3 090 - 3 163 - 983 - 773
1) Including interest components related to pension costs - 439 - 538 - 110 - 132
2) Including discounting effects attributable to provisions - 2 033 - 2 165 - 506 - 553
3) Items affecting comparability recognised as
financial income and expenses, net - 6 - 1 — - 1
4) See note 5 for information on items affecting comparability
15
VATTENFALL YEAR-END REPORT 2021
Consolidated statement of
comprehensive income
Full year Full year Oct-Dec Oct-Dec
Amounts in SEK million 2021 2020 2021 2020
Profit for the period 48 013 7 716 6 101 5 727
Other comprehensive income
Items that will be reclassified to profit or loss when specific conditions are met
Cash flow hedges - changes in fair value 82 259 3 023 20 435 3 287
Cash flow hedges - dissolved against income statement - 31 553 4 310 - 22 878 267
Cash flow hedges - transferred to cost of hedged item 16 - 43 5 12
Hedging of net investments in foreign operations - 1 414 1 808 - 437 1 864
Translation differences, divested companies 697 - 5 8 —
Translation differences 3 218 - 4 084 1 348 - 4 251
Income taxes related to items that will be reclassified - 15 420 - 2 587 927 - 1 676
Total items that will be reclassified to profit or loss when specific conditions are met 37 803 2 422 - 592 - 497
Items that will not be reclassified to profit or loss
Remeasurement pertaining to defined benefit obligations - 670 - 1 505 - 1 096 - 2 224
Income taxes related to items that will not be reclassified 226 392 231 667
Total items that will not be reclassified to profit or loss - 444 - 1 113 - 865 - 1 557
Total other comprehensive income, net after income taxes 37 359 1 309 - 1 457 - 2 054
Total comprehensive income for the period 85 372 9 025 4 644 3 673
Attributable to owner of the Parent Company 83 915 8 260 4 188 3 563
Attributable to non-controlling interests 1 457 765 456 110
16
VATTENFALL YEAR-END REPORT 2021
Operating segments, Vattenfall Group
Full year Full year Oct-Dec Oct-Dec
Amounts in SEK million 2021 2020 2021 2020
External net sales
Customers & Solutions 102 300 84 661 34 109 23 470
Power Generation 40 312 36 597 16 962 9 571
Wind 7 791 6 901 4 150 2 047
Heat 14 655 13 538 4 819 4 165
Distribution 14 643 16 970 3 306 4 736
- of which, Distribution Germany 3 203 5 464 1 1 339
- of which, Distribution Sweden 11 310 11 377 3 269 3 358
Other1
418 180 183 43
Total 180 119 158 847 63 529 44 032
Internal net sales
Customers & Solutions 4 260 1 637 1 713 461
Power Generation 86 006 53 536 35 687 15 254
Wind 13 081 6 664 6 106 1 912
Heat 20 104 9 790 10 300 3 114
Distribution 2 619 4 674 123 1 246
- of which, Distribution Germany 2 061 4 107 1 1 110
- of which, Distribution Sweden 586 597 137 142
Other1
5 751 5 737 1 531 1 619
Eliminations - 131 821 - 82 038 - 55 460 - 23 606
Total — — — —
Total net sales
Customers & Solutions 106 560 86 298 35 822 23 931
Power Generation 126 318 90 133 52 649 24 825
Wind 20 872 13 565 10 256 3 959
Heat 34 759 23 328 15 119 7 279
Distribution 17 262 21 644 3 429 5 982
- of which, Distribution Germany 5 264 9 571 2 2 449
- of which, Distribution Sweden 11 896 11 974 3 406 3 500
Other1
6 169 5 917 1 714 1 662
Eliminations - 131 821 - 82 038 - 55 460 - 23 606
Total 180 119 158 847 63 529 44 032
17
VATTENFALL YEAR-END REPORT 2021
Full year Full year Oct-Dec Oct-Dec
Amounts in SEK million 2021 2020 2021 2020
Operating profit before depreciation, amortisation and impairment losses (EBITDA)
Customers & Solutions 3 241 2 832 318 456
Power Generation 42 053 23 144 2 607 6 580
Wind 13 534 9 482 6 126 3 045
Heat 2 842 2 644 - 12 - 187
Distribution 5 911 8 713 1 101 2 326
- of which, Distribution Germany 1 008 2 162 — 539
- of which, Distribution Sweden 4 873 6 505 1 109 1 766
Other1
8 197 - 299 - 88 - 204
Eliminations 12 - 9 174 105
Total 75 790 46 507 10 226 12 121
Underlying EBITDA
Customers & Solutions 3 230 3 083 317 611
Power Generation 23 714 18 796 6 073 4 997
Wind 13 451 9 426 6 118 2 982
Heat 2 590 4 462 - 237 1 581
Distribution 5 913 8 725 1 102 2 328
- of which, Distribution Germany 1 009 2 174 — 542
- of which, Distribution Sweden 4 874 6 505 1 110 1 766
Other1
- 326 - 442 - 95 - 189
Eliminations 12 - 9 174 105
Total 48 584 44 041 13 452 12 415
Full year Full year Oct-Dec Oct-Dec
Amounts in SEK million 2021 2020 2021 2020
Operating profit (EBIT)
Customers & Solutions 2 446 1 882 191 231
Power Generation 39 502 18 984 3 299 5 490
Wind 7 919 2 401 4 654 1 639
Heat - 91 - 12 149 - 756 - 3 257
Distribution 3 150 5 313 458 1 452
- of which, Distribution Germany 665 1 081 — 266
- of which, Distribution Sweden 2 515 4 225 483 1 177
Other1
7 333 - 1 146 - 270 - 414
Eliminations 12 - 9 174 105
Operating profit (EBIT) 60 271 15 276 7 750 5 246
Financial net - 898 - 3 270 - 594 - 693
Profit before tax 59 373 12 006 7 156 4 553
Underlying EBIT
Customers & Solutions 2 349 2 146 104 387
Power Generation 19 334 14 670 4 935 3 938
Wind 7 866 3 970 4 676 1 716
Heat - 343 978 - 981 784
Distribution 3 152 5 325 459 1 454
- of which, Distribution Germany 666 1 093 — 268
- of which, Distribution Sweden 2 516 4 225 484 1 177
Other1
- 1 189 - 1 290 - 275 - 397
Eliminations 12 - 9 174 105
Underlying EBIT 31 181 25 790 9 092 7 987
1) “Other” pertains mainly to all Staff functions, including Treasury, Shared Service Centres and material capital gains and -losses.
18
VATTENFALL YEAR-END REPORT 2021
Consolidated balance sheet
31 Dec 31 Dec
Amounts in SEK million 2021 2020
Assets
Non-current assets
Intangible assets: non-current 17 070 16 524
Property, plant and equipment 252 828 249 120
Participations in associated companies and joint arrangements 6 110 4 347
Other shares and participations 313 304
Share in the Swedish Nuclear Waste Fund 52 772 48 270
Derivative assets 35 240 9 449
Deferred tax assets 8 905 13 824
Other non-current receivables 6 118 5 529
Total non-current assets 379 356 347 367
Current assets
Inventories 41 539 16 828
Intangible assets: current 4 861 192
Trade receivables and other receivables 41 219 23 812
Contract assets 375 416
Advance payments paid 8 362 1 046
Derivative assets 120 645 9 962
Prepaid expenses and accrued income 12 402 6 935
Current tax assets 2 717 280
Short-term investments 102 706 30 148
Cash and cash equivalents 68 176 26 074
Assets held for sale — 188
Total current assets 403 002 115 881
Total assets 782 358 463 248
Equity and liabilities
Equity
Attributable to owner of the Parent Company 180 710 97 724
Attributable to non-controlling interests 16 472 13 468
Total equity 197 182 111 192
Non-current liabilities
Hybrid Capital 20 421 19 304
Other interest-bearing liabilities 50 839 49 091
Pension provisions 40 328 43 824
Other interest-bearing provisions 116 637 108 665
Derivative liabilities 30 307 7 924
Deferred tax liabilities 33 913 17 617
Contract liabilities 8 635 8 752
Other noninterest-bearing liabilities 2 018 1 994
Total non-current liabilities 303 098 257 171
Current liabilities
Trade payables and other liabilities 39 241 24 912
Advance payments received 62 790 5 794
Derivative liabilities 99 511 8 901
Accrued expenses and deferred income 18 460 14 558
Current tax liabilities 2 418 838
Other interest-bearing liabilities 55 148 36 380
Interest-bearing provisions 4 510 3 462
Liabilities associated with assets held for sale — 40
Total current liabilities 282 078 94 885
Total equity and liabilities 782 358 463 248
19
VATTENFALL YEAR-END REPORT 2021
SUPPLEMENTARY INFORMATION
31 Dec 31 Dec
Amounts in SEK million 2021 2020
Calculation of capital employed
Intangible assets: current and non-current 21 931 16 716
Property, plant and equipment 252 828 249 120
Participations in associated companies and joint arrangements 6 110 4 347
Deferred and current tax assets 11 622 14 104
Non-current noninterest-bearing receivables 3 563 3 853
Contract assets 375 416
Inventories 41 539 16 828
Trade receivables and other receivables 41 219 23 812
Prepaid expenses and accrued income 12 402 6 935
Unavailable liquidity 3 446 5 374
Other 643 483
Total assets excl. financial assets 395 678 341 988
Deferred and current tax liabilities - 36 331 - 18 455
Other noninterest-bearing liabilities - 2 018 - 1 994
Contract liabilities - 8 635 - 8 752
Trade payable and other liabilities - 39 241 - 24 912
Accrued expenses and deferred income - 18 460 - 14 558
Other - 899 - 232
Total noninterest-bearing liabilities - 105 584 - 68 903
Other interest-bearing provisions not related to adjusted net debt1
- 9 213 - 10 619
Capital employed2
280 881 262 466
Capital employed, average 271 674 265 639
Calculation of net debt
Hybrid Capital - 20 421 - 19 304
Bond issues and liabilities to credit institutions - 37 732 - 49 642
Short-term debt, commercial papers and repo - 46 189 - 13 268
Liabilities to associated companies - 1 452 - 688
Liabilities to owners of non-controlling interests - 10 747 - 10 931
Other liabilities - 9 867 - 10 942
Total interest-bearing liabilities - 126 408 - 104 775
Cash and cash equivalents 68 176 26 074
Short-term investments 102 706 30 148
Loans to owners of non-controlling interests in foreign Group companies 229 375
Net debt2
44 703 - 48 178
Calculation of adjusted gross debt and net debt
Total interest-bearing liabilities - 126 408 - 104 775
50% of Hybrid Capital3
10 211 9 652
Present value of pension obligations - 40 328 - 43 824
Provisions for gas and wind operations and other environment-related provisions - 11 687 - 10 599
Provisions for nuclear power (net)4
- 40 233 - 37 794
Margin calls received 3 340 4 081
Liabilities to owners of non-controlling interests due to consortium agreements 10 747 10 931
Adjusted gross debt - 194 359 - 172 328
Reported cash and cash equivalents and short-term investments 170 882 56 222
Unavailable liquidity - 3 446 - 5 374
Adjusted cash and cash equivalents and short-term investments 167 436 50 848
Adjusted net debt2
- 26 923 - 121 480
1) Includes personnel-related provisions for non-pension purposes, provisions for tax and legal disputes and certain other provisions.
2) See Definitions and calculations of key ratios for definitions of Alternative Performance Measures.
3) 50% of Hybrid Capital is treated as equity by the rating agencies, which thereby reduces adjusted net debt.
4) The calculation is based on Vattenfall’s share of ownership in the respective nuclear power plants, less Vattenfall’s share in the Swedish Nuclear Waste Fund and
liabilities to associated companies. Vattenfall has the following ownership interests in the respective plants: Forsmark 66%, Ringhals 70.4%, Brokdorf 20%, Brunsbüttel
66.7%, Krümmel 50% and Stade 33.3%. (According to a special agreement, Vattenfall is responsible for 100% of the provisions for Ringhals.)
20
VATTENFALL YEAR-END REPORT 2021
Consolidated statement of cash flows
Full year Full year Oct-Dec Oct-Dec
Amounts in SEK million 2021 2020 2021 2020
Operating activities
Operating profit before depreciation, amortisation and impairment losses (EBITDA) 75 790 46 507 10 226 12 121
Tax paid - 6 725 - 2 719 - 4 005 - 420
Capital gains/losses, net - 8 760 - 62 - 124 102
Interest received 523 183 170 72
Interest paid - 3 226 - 2 808 - 655 - 420
Other, incl. non-cash items - 11 506 - 6 077 13 004 - 87
Funds from operations (FFO) 46 096 35 024 18 616 11 368
Changes in inventories - 23 067 - 1 315 - 19 112 - 2 584
Changes in operating receivables - 31 816 - 1 344 - 20 261 - 6 094
Changes in operating liabilities 25 491 - 3 726 18 091 2 742
Margin calls 88 036 12 588 9 166 9 238
Other changes - 4 608 465 - 2 370 184
Cash flow from changes in operating assets and operating liabilities 54 036 6 668 - 14 486 3 486
Cash flow from operating activities 100 132 41 692 4 130 14 854
Investing activities
Acquisitions in Group companies - 122 - 86 - 67 - 19
Investments in associated companies and other shares and participations - 278 223 - 101 78
Other investments in non-current assets - 25 157 - 21 484 - 7 585 - 5 710
Total investments - 25 557 - 21 347 - 7 753 - 5 651
Divestments 22 060 1 237 330 557
Changes in short-term investments1
- 71 351 - 8 926 - 38 228 - 2 659
Cash and cash equivalents in acquired companies 8 20 8 20
Cash and cash equivalents in divested companies - 2 481 - 80 - 47 4
Cash flow from investing activities - 77 321 - 29 096 - 45 690 - 7 729
Cash flow before financing activities 22 811 12 596 - 41 560 7 125
Financing activities
Changes in loans to owners of non-controlling interests in foreign Group companies 153 - 185 101 57
Loans raised2
51 150 21 471 44 615 545
Amortisation of debt pertaining to acquisitions of Group companies — - 27 — —
Amortisation of other debt - 35 870 - 12 156 - 3 738 - 1 057
Divestment of shares in Group companies to owners of non-controlling interests 4 025 — 9 —
Redemption of Hybrid Capital - 2 941 — — —
Issue of Hybrid Capital 6 481 — — —
Dividends paid to owners - 5 190 - 5 298 - 1 - 275
Contribution to/from owners of non-controlling interests 1 185 - 829 869 - 364
Cash flow from financing activities 18 993 2 976 41 855 - 1 094
Cash flow for the period 41 804 15 572 295 6 031
Full year Full year Oct-Dec Oct-Dec
Amounts in SEK million 2021 2020 2021 2020
Cash and cash equivalents
Cash and cash equivalents at start of period 26 074 10 604 67 644 20 180
Cash flow for the period 41 804 15 572 295 6 031
Translation differences 298 - 102 237 - 137
Cash and cash equivalents at end of period 68 176 26 074 68 176 26 074
21
VATTENFALL YEAR-END REPORT 2021
SUPPLEMENTARY INFORMATION
Full year Full year Oct-Dec Oct-Dec
Amounts in SEK million 2021 2020 2021 2020
Cash flow before financing activities 22 811 12 596 - 41 560 7 125
Changes in short-term investments 71 351 8 926 38 228 2 659
Financing activities
Divestment of shares in Group companies to owners of non-controlling interests 4 025 — 9 —
Dividends paid to owners - 5 190 - 5 298 - 1 - 275
Contribution to/from owners of non-controlling interests 1 185 - 829 869 - 364
Cash flow after dividend 94 182 15 395 - 2 455 9 145
Analysis of change in net debt
Net debt at start of period - 48 178 - 64 266 47 348 - 58 858
Cash flow after dividend 94 182 15 395 - 2 455 9 145
Changes as a result of valuation at fair value 660 - 171 - 143 141
Changes in interest-bearing liabilities for leasing - 1 442 - 2 837 - 444 - 1 712
Interest-bearing liabilities/short-term investments acquired/divested - 13 24 - 10 —
Translation differences on net debt - 506 3 677 407 3 106
Net debt at end of period 44 703 - 48 178 44 703 - 48 178
Cash flow from operating activities 100 132 41 692 4 130 14 854
Maintenance/replacement investments - 11 012 - 12 539 - 3 796 - 4 655
Free cash flow3
89 120 29 153 334 10 199
1) Change from Financing activities to Investing activities
2) Short-term borrowings in which the duration is three months or shorter are reported net
3) See Definitions and calculations of key ratios for definitions of Alternative Performance Measures.
22
VATTENFALL YEAR-END REPORT 2021
INVESTMENTS
Full year Full year Oct-Dec Oct-Dec
Amounts in SEK million 2021 2020 2021 2020
Electricity generation
Hydro power 795 920 314 349
Nuclear power 1 263 1 877 420 499
Coal power — 22 — 15
Gas 64 192 20 33
Wind power and solar PV 11 157 7 709 1 975 2 568
Biomass, waste 73 295 3 71
Total electricity generation 13 352 11 015 2 732 3 535
CHP/heat
Fossil-based power 1 053 1 261 537 396
Heat networks 1 511 1 400 610 598
Other 483 933 322 418
Total CHP/heat 3 047 3 594 1 469 1 412
Electricity networks
Electricity networks 5 758 7 435 1 919 2 511
Total electricity networks 5 758 7 435 1 919 2 511
Purchases of shares, shareholder contributions 400 - 137 168 - 59
Other 1 557 1 690 573 512
Total investments 24 114 23 597 6 861 7 911
Accrued investments, unpaid invoices (-)/
release of accrued investments (+) 1 443 - 2 250 892 - 2 260
Total investments with cash flow effect 25 557 21 347 7 753 5 651
23
VATTENFALL YEAR-END REPORT 2021
Consolidated statement of changes in equity
31 Dec 2021 31 Dec 2020
Amounts in SEK million
Attributable
to owner of
the Parent
Company
Attributable
to non-
controlling
interests
Total
equity
Attributable
to owner of
the Parent
Company
Attributable
to non-
controlling
interests
Total
equity
Balance brought forward 97 724 13 468 111 192 93 631 14 891 108 522
Profit for the period 46 828 1 185 48 013 6 489 1 227 7 716
Cash flow hedges - changes in fair value 82 259 — 82 259 3 023 — 3 023
Cash flow hedges - dissolved against income statement - 31 569 16 - 31 553 4 344 - 34 4 310
Cash flow hedges - transferred to cost of hedged item 16 — 16 - 43 — - 43
Hedging of net investments in foreign operations - 1 414 — - 1 414 1 808 — 1 808
Translation differences, divested companies 697 — 697 - 5 — - 5
Translation differences 2 983 235 3 218 - 3 684 - 400 - 4 084
Remeasurement pertaining to defined benefit obligations - 700 30 - 670 - 1 465 - 40 - 1 505
Income taxes related to other comprehensive income - 15 185 - 9 - 15 194 - 2 207 12 - 2 195
Total other comprehensive income for the period 37 087 272 37 359 1 771 - 462 1 309
Total comprehensive income for the period 83 915 1 457 85 372 8 260 765 9 025
Dividends paid to owners - 4 000 - 1 190 - 5 190 - 3 623 - 1 675 - 5 298
Group contributions from(+)/to(-) owners of non-controlling interests — 51 51 — - 1 - 1
Changes in ownership in Group companies on divestments of shares to owners of
non-controlling interests 2 538 1 508 4 046 — — —
Contribution to/from owners of non-controlling interests — 1 185 1 185 — - 829 - 829
Changes as a result of changed ownership — — — — - 227 - 227
Other changes 533 - 7 526 - 544 544 —
Total transactions with equity holders - 929 1 547 618 - 4 167 - 2 188 - 6 355
Balance carried forward 180 710 16 472 197 182 97 724 13 468 111 192
- Of which, Reserve for hedges 36 968 8 36 976 1 970 - 5 1 965
24
VATTENFALL YEAR-END REPORT 2021
Key ratios, Vattenfall Group
Full year Full year Oct-Dec Oct-Dec
In % unless otherwise stated. (x) means times1
2021 2020 2021 2020
Operating margin 33.5 9.6 12.2 11.9
Operating margin2
17.3 16.2 14.3 18.1
Pre-tax profit margin 33.0 7.6 11.3 10.3
Pre-tax profit margin2
16.8 14.2 13.4 16.6
Return on equity 36.9 6.7 36.93
6.73
Return on capital employed 22.2 5.8 22.23
5.83
Return on capital employed2
11.5 9.7 11.53
9.73
EBIT interest cover, (x) 16.2 4.3 16.23
4.33
EBIT interest cover, (x)2
8.5 7.1 8.53
7.13
FFO interest cover, (x) 13.3 10.4 13.33
10.43
FFO interest cover, net, (x) 15.9 12.1 15.93
12.13
Cash flow interest cover after maintenance investments, (x) 27.9 10.2 27.93
10.23
FFO/gross debt 36.5 33.4 36.53
33.43
FFO/net debt - 103.1 72.7 - 103.13
72.73
FFO/adjusted net debt 171.2 28.8 171.23
28.83
EBITDA/net financial items, (x) 24.5 14.7 10.4 15.7
EBITDA/net financial items, (x)2
15.7 13.9 13.7 16.1
Equity/Total assets 25.2 24.0 25.2 24.0
Gross debt/equity 64.1 94.2 64.1 94.2
Net debt/equity - 22.7 43.3 - 22.7 43.3
Gross debt/gross debt plus equity 39.1 48.5 39.1 48.5
Net debt/net debt plus equity - 29.3 30.2 - 29.3 30.2
Net debt/EBITDA, (x) - 0.6 1.0 - 0.63
1.03
Adjusted net debt/EBITDA, (x) 0.4 2.6 0.43
2.63
1) See Definitions and calculations of key ratios for definitions of Alternative Performance Measures.
2) Based on Underlying operating profit.
3) Last 12-month values.
25
VATTENFALL YEAR-END REPORT 2021
Quarterly information, Vattenfall Group
Q4 Q3 Q2 Q1 Q4 Q3 Q2 Q1
Amounts in SEK million 2021 2021 2021 2021 2020 2020 2020 2020
Income statement
Net sales 63 529 36 125 34 554 45 911 44 032 35 375 31 280 48 160
Operating profit before depreciation,
amortisation and impairment losses
(EBITDA) 10 226 27 293 20 531 17 740 12 121 9 235 8 251 16 900
Underlying EBITDA 13 452 9 149 9 577 16 408 12 415 9 378 7 471 14 773
Operating profit (EBIT) 7 750 22 926 16 210 13 385 5 246 4 743 - 7 027 12 313
Underlying EBIT 9 092 4 782 5 256 12 053 7 987 4 818 2 792 10 187
Profit before income taxes 7 156 567 16 778 13 257 4 553 4 525 - 5 969 8 895
Profit for the period 6 101 18 277 13 212 10 423 5 727 3 583 - 8 495 6 900
- of which, attributable to owner of the
Parent Company 5 774 18 178 13 002 9 875 5 132 3 595 - 8 826 6 587
- of which, attributable to non-controlling
interests 327 99 210 548 595 - 12 331 313
Balance sheet
Capital employed 280 881 255 184 280 855 271 110 262 466 260 921 266 641 287 567
Net debt 44 703 47 348 - 32 328 - 43 865 - 48 178 - 58 858 - 71 613 - 81 579
Cash flow
Funds from operations (FFO) 18 616 6 054 7 439 13 987 11 368 7 000 4 420 12 235
Cash flow from operating activities 4 130 60 836 24 041 11 124 14 854 19 447 15 924 - 8 533
Cash flow from investing activities - 45 690 - 14 851 - 12 858 - 3 921 - 7 729 - 11 507 - 5 991 - 3 867
Cash flow from financing activities 41 855 - 1 252 - 6 446 - 15 164 - 1 094 - 7 588 1 087 10 572
Cash flow for the period 295 44 733 4 737 - 7 961 6 031 352 11 020 - 1 828
Free cash flow 334 57 309 22 629 8 847 10 199 17 161 12 656 - 10 865
Q4 Q3 Q2 Q1 Q4 Q3 Q2 Q1
In % unless otherwise stated. (x) means times1
2021 2021 2021 2021 2020 2020 2020 2020
Key ratios
Return on equity1
36.9 40.2 30.3 10.0 6.7 1.5 4.4 14.4
Return on capital employed2
22.2 22.4 14.5 5.9 5.8 4.7 6.1 9.4
Return on capital employed2, 3
11.5 11.7 11.0 9.9 9.7 9.9 9.2 9.2
EBIT interest cover, (x)2
16.2 16.6 12.1 5.1 4.3 3.3 3.2 4.5
EBIT interest cover, (x)2, 3
8.5 8.7 9.3 8.6 7.1 6.8 6.1 4.4
FFO/gross debt2
36.5 46.0 44.3 40.0 33.4 32.4 31.2 32.8
FFO/net debt2
- 103.1 - 82.0 123.1 83.8 72.7 59.8 49.9 45.8
FFO/adjusted net debt2
171.2 182.7 38.1 32.8 28.8 27.9 25.5 25.2
Equity/Total assets 25.2 27.8 25.8 26.8 24.0 24.0 22.8 24.8
Gross debt/equity 64.1 44.2 64.2 72.0 94.2 100.6 111.0 93.1
Net debt/equity - 22.7 - 24.8 23.1 34.4 43.3 54.6 69.3 66.7
Net debt/net debt plus equity - 29.3 - 32.9 18.8 25.6 30.2 35.3 40.9 40.0
Net debt/EBITDA, (x)2
- 0.6 - 0.6 0.5 0.9 1.0 1.4 1.5 1.7
Adjusted net debt/EBITDA, (x)2
0.4 0.3 1.8 2.4 2.6 2.9 3.0 3.2
1) See Definitions and calculations of key ratios for definitions of Alternative Performance Measures.
2) Last 12-month values.
3) Based on Underlying operating profit.
26
VATTENFALL YEAR-END REPORT 2021
NOTE 1 | Accounting policies, risks and uncertainties
Accounting policies
This interim report for the Group has been prepared in accordance with
IAS 34 – “Interim Financial Reporting”, and the Swedish Annual
Accounts Act. The accounting policies and calculation methods applied
in this interim report are the same as those described in Vattenfall’s 2020
Annual and Sustainability Report in Note 3 to the consolidated accounts,
Accounting policies. Amended IFRSs endorsed by the EU for application
in the 2021 financial year have no significant effect on Vattenfall’s
financial statements.
Risks and uncertainties
A historical high price volatility for electricity and fuels in 2021 has led to
increased credit risks. For a description of risks, uncertainties and risk
management, please refer to Vattenfall’s 2020 Annual and Sustainability
Report, pages 62-71. Apart from the information provided under
“Business highlights” in this report and under “Business highlights” in
previously published interim reports in 2021, no other material changes
have taken place since the publication.
Other
Significant related-party transactions are described in Note 44 to the
consolidated accounts in Vattenfall’s 2020 Annual and Sustainability
Report. No material changes have taken place in relations or
transactions with related parties since the publication. In addition to the
significant contingent liabilities described in Note 40
NOTE 2 | Exchange rates
KEY EXCHANGE RATES APPLIED IN THE ACCOUNTS OF THE VATTENFALL GROUP
Full year Full year Oct-Dec Oct-Dec
2021 2020 2021 2020
Average rate
EUR 10.1469 10.4789 10.1604 10.2871
DKK 1.3644 1.4056 1.3662 1.3820
GBP 11.7820 11.8334 11.9631 11.3916
USD 8.5687 9.1718 8.8543 8.6406
31 Dec 31 Dec
2021 2020
Balance sheet date rate
EUR 10.2503 10.0343
DKK 1.3784 1.3485
GBP 12.1987 11.1613
USD 9.0502 8.1773
27
VATTENFALL YEAR-END REPORT 2021
NOTE 3 | Financial instruments by measurement category and related effects on income
For assets and liabilities with a remaining maturity less than three
months (e.g., cash and bank balances, trade receivables and other
receivables and trade payables and other payables), fair value is
considered to be equal to the carrying amount. For other shares and
participations the fair value is approximated by using cost.
The carrying amounts of financial assets do not differ significantly from
their fair values. The difference between carrying amounts and fair
values for financial liabilities amounts to SEK 6.784 million (31 December
2020: 8.509).
Financial instruments that are measured at fair value on the balance
sheet are described below according to the fair value hierarchy (levels),
which in IFRS 13 is defined as:
Level 1: Quoted prices (unadjusted) in active markets for identical assets
or liabilities.
Level 2: Inputs other than quoted prices included in Level 1 that are
observable for the asset or liability, either directly (that is, as prices) or
indirectly (that is, derived from prices). In Level 2 Vattenfall reports
mainly commodity derivatives, currency-forward contracts and interest
rate swaps.
Level 3: Inputs for the asset or liability that are not based on observable
market data.
FINANCIAL ASSETS AND LIABILITIES THAT ARE MEASURED AT FAIR VALUE ON THE BALANCE SHEET AT 31 DECEMBER
2021
Amounts in SEK million Level 1 Level 2 Level 3 Total
Assets
Share in the Swedish Nuclear Waste Fund 52 772 — — 52 772
Derivative assets — 154 744 1 141 155 885
Short-term investments, cash equivalents and other shares and participations 116 013 11 404 — 127 417
Total assets 168 785 166 148 1 141 336 074
Liabilities
Derivative liabilities — 129 818 — 129 818
Total liabilities — 129 818 — 129 818
FINANCIAL ASSETS AND LIABILITIES THAT ARE MEASURED AT FAIR VALUE ON THE BALANCE SHEET AT 31 DECEMBER
2020
Amounts in SEK million Level 1 Level 2 Level 3 Total
Assets
Share in the Swedish Nuclear Waste Fund 48 270 — — 48 270
Derivative assets — 18 911 500 19 411
Short-term investments, cash equivalents and other shares and participations 29 900 8 011 — 37 911
Total assets 78 170 26 922 500 105 592
Liabilities
Derivative liabilities — 16 825 — 16 825
Total liabilities — 16 825 — 16 825
28
VATTENFALL YEAR-END REPORT 2021
NOTE 4 | Acquired and divested operations
Acquired operations
On 1 July 2021 Vattenfall acquired the remaining shares in Enwell AB,
and as a result, as from that date the company has changed over from
being reported as an associated company to being reported as a
subsidiary. The total purchase price for all of the shares was SEK 130
million, and the value of total assets acquired is SEK 328 million, of
which SEK 179 million consists of intangible non-current assets.
Divested operations
On 1 July 2021 the sale of the electricity distribution company Stromnetz
to the City of Berlin was completed. The consideration received amounts
to SEK 21 248 million and the capital gain to SEK 8 414 million. In
addition to this a number small companies within business area Wind
have been sold during the period, total consideration received amounts
to SEK 130 million and the capital gain to SEK 34 million.
NOTE 5 | Items affecting comparability
Items affecting comparability include capital gains and capital losses from sale of shares and other non-current assets, impairment losses and reversed
impairment losses and other material items that are of an infrequent nature. Also included here are, for trading activities, changes in the fair value of
energy derivatives, which according to IFRS 9 cannot be recognised using hedge accounting and changes in the fair value of inventories.
Full year Full year Oct-Dec Oct-Dec
Amounts in SEK million 2021 2020 2021 2020
1) Including items affecting comparability 29 090 - 10 514 - 1 342 - 2 741
- of which, capital gains 8 960 301 156 86
- of which, capital losses - 199 - 241 - 32 - 184
- of which, impairment losses - 38 - 12 980 - 38 - 2 447
- of which, reversed impairment losses 1 922 — 1 922 —
- of which, provisions - 3 785 - 3 488 - 1 332 - 2 803
- of which, changes in the fair value of energy derivatives 8 715 4 753 - 1 822 1 967
- of which, changes in the fair value of inventories 1 313 476 - 488 418
- of which, restructuring costs — - 854 — - 709
- of which, other non-recurring items affecting comparability 12 202 1 519 292 931
Items affecting comparability during January-December 2021 amounted
to SEK 29.1 billion, most of which pertains to compensation for closure of
nuclear power in Germany and sales of related production rights (SEK
12.5 billion, reported in other non-recurring items affecting comparability),
and changes in market value for energy derivatives and inventories (SEK
10.0 billion). The increase in provisions pertains to the nuclear operations
(SEK -3.8 billion). Capital gains pertains mainly to the sale of Stromnetz
Berlin (SEK 8.4 billion).
Items affecting comparability during January-December 2020 amounted
to SEK -10.5 billion. Most pertains to impairment losses (SEK -13.0
billion) where coal-fired power in Germany accounts for the major part
and unrealised changes in market value for energy derivatives and
inventories (SEK 5.2 billion). The increase in provisions pertains to the
nuclear operations (SEK -3.5 billion). Other items affecting comparability
pertain to the sale of nuclear power production rights in Germany (SEK
2.8 billion).
NOTE 6 | Impairment losses and reversed impairment losses
Accounting policy
Assessments are made on a regular basis throughout the year for any
indication that an asset may have decreased in value. If any such
indication is identified, the asset’s recoverable amount is estimated,
and an impairment test is performed. For a description of the
principles for such calculations, please refer to Note 9 to the
consolidated accounts in Vattenfall’s 2020 Annual and Sustainability
Report.
Impairment losses and reversed impairment losses
2021
During the period impairment losses of SEK 38 million have been
charged against operating profit of which SEK 30 million pertains to
participations within BA Wind.
Previously recognised impairment losses of SEK 1,922 million mainly
pertaining to hydro assets in Germany have been reversed in the
income statement.
29
VATTENFALL YEAR-END REPORT 2021
The Parent Company Vattenfall AB
Accounting policies
The Parent Company Vattenfall AB’s accounts are prepared in
accordance with the Swedish Annual Accounts Act and recommendation
RFR 2 – Accounting for Legal Entities, issued by the Swedish Financial
Reporting Board. The accounting policies used in this interim report are
the same as those described in Vattenfall’s 2020 Annual and
Sustainability Report, Note 3 to the Parent Company accounts,
Accounting policies. New accounting policies applicable from 1 January
2021 has had no significant effect on the Parent Company’s financial
statements.
January – December 2021
A condensed income statement and balance sheet for the Parent
Company are presented below.
• Net sales amounted to SEK 40,045 million (41,969).
• Profit before appropriations and income taxes was SEK -4,219
million (10,786).
• Lower operating profit are attributable to changes in market value
for energy derivates.
• Dividend received from subsidiaries amounted to SEK 2,231 million
(408), mainly from Vattenfall B.V.
• Lower financial income due to exchange rate effects impacted
earnings negatively.
• The balance sheet total was SEK 468,482 million (305,916).
• Investments during the period amounted to SEK 7,303 million
(11,917), whereof 5,417 pertains to group internal asset
transactions.
• Cash and cash equivalents, and short-term investments amounted
to SEK 145,743 million (53,043).
• The equity has been adjusted with SEK -900 million per January 1st
of 2020 due to nuclear related commitments previously not
accounted for. Profit before appropriations and income taxes 2020
has been adjusted with SEK -376 million for the same reason.
• Dividend paid to the owner of SEK 4,000 million (3,623).
Presentation of Parent Company income statements
See Note 1 to the consolidated accounts, Accounting policies, risks and
uncertainties.
Risks and uncertainties
See Note 1 to the consolidated accounts, Accounting policies, risks and
uncertainties.
Other
Significant related-party transactions are described in Note 44 to the
consolidated accounts, Related party disclosures, in Vattenfall’s 2020
Annual and Sustainability Report. No material changes have taken place
in relations or transactions with related parties compared with the
description in Vattenfall’s 2020 Annual and Sustainability Report.
30
VATTENFALL YEAR-END REPORT 2021
Parent Company income statement
Full year Full year
Amounts in SEK million 2021 2020
Net sales 40 045 41 969
Cost of purchases - 37 035 - 23 929
1
Other external expenses - 5 250 - 4 966
1
Personnel expenses - 2 247 - 2 116
Other operating incomes and expenses, net - 52 170
Operating profit before depreciation, amortisation and impairment losses (EBITDA) - 4 539 11 128
1
Depreciation, amortisation and impairments - 629 - 596
Operating profit (EBIT) - 5 168 10 532
1
Result from participations in subsidiaries 2 231 408
Result from participations in associated companies 1 —
Other financial income 1 537 2 593
Other financial expenses - 2 820 - 2 747
1
Profit before appropriations and income taxes - 4 219 10 786
1
Appropriations 5 086 - 394
Profit before income taxes 867 10 392
1
Income taxes 445 - 2 243
Profit for the period 1 312 8 149
1
1
The period has been adjusted according to IAS 8, please refer to the comments on the Parent company income statement and balance sheet for additional information
31
VATTENFALL YEAR-END REPORT 2021
Parent Company balance sheet
31 Dec 31 Dec
Amounts in SEK million 2021 2020
Assets
Non-current assets
Intangible assets: non-current 330 356
Property, plant and equipment 7 003 6 618
Shares and participations 166 802 161 474
Deferred tax assets 2 272 313
Other non-current receivables 71 123 69 078
Total non-current assets 247 530 237 839
Current assets
Inventories 342 411
Intangible assets: current 9 38
Current receivables 73 157 14 585
Current tax assets 1 701 —
Short-term investments 101 877 29 301
Cash and cash equivalents 43 866 23 742
Total current assets 220 952 68 077
Total assets 468 482 305 916
Equity, provisions and liabilities
Equity
Restricted equity
Share capital (131,700,000 shares with a share quota value of SEK 50) 6 585 6 585
Revaluation reserve 37 989 37 989
Other reserves 1 370 1 492
Non-restricted equity
Retained earnings 64 911 60 640 1
Profit for the period 1 312 8 149 1
Total equity 112 167 114 855
Untaxed reserves 7 168 13 342
Provisions 5 621 5 376
Non-current liabilities
Hybrid capital 20 421 19 305
Other interest-bearing liabilities 39 475 36 544 1
Other noninterest-bearing liabilities 12 869 12 762
Total non-current liabilities 72 765 68 611
Current liabilities
Other interest-bearing liabilities 252 315 95 706
Current tax liabilities — 122
Other noninterest-bearing liabilities 18 446 7 904
Total current liabilities 270 761 103 732
Total equity, provisions and liabilities 468 482 305 916
1
The period has been adjusted according to IAS 8, please refer to the comments on the Parent company income statement and balance sheet for additional information
32
VATTENFALL YEAR-END REPORT 2021
Definitions and calculations of key ratios
Alternative Performance Measures
In order to ensure a fair presentation of the Group’s operations, the
Vattenfall Group uses a number of Alternative Performance Measures
that are not defined in IFRS or in the Swedish Annual Accounts Act. The
Alternative Performance Measures that Vattenfall uses are described
below, including their definitions and how they are calculated. The
Alternative Performance Measures used are unchanged compared with
earlier periods.
Definition
EBIT: Operating profit (Earnings Before Interest and Tax)
EBITDA: Operating profit before depreciation, amortisation and impairment losses (Earnings Before Interest, Tax,
Depreciation and Amortisation)
Items affecting comparability: Capital gains and capital losses from shares and other non-current assets, impairment losses and reversed
impairment losses and other material items that are of an infrequent nature. Also included here are, for trading
activities, unrealised changes in the fair value of energy derivatives, which according to IFRS 9 cannot be
recognised using hedge accounting and unrealised changes in the fair value of inventories. See Consolidated
income statement for a specification of items affecting comparability.
Underlying EBITDA: Underlying operating profit before depreciation, amortisation and impairment losses. This measure is intended to
provide a better view on the operating result by excluding items affecting comparability that are of an infrequent
nature, while also excluding non-cash depreciation and amortisation.
Underlying operating profit: Operating profit (EBIT) excluding items affecting comparability. This measure is intended to provide a better view
on the operating result by excluding items affecting comparability that are of an infrequent nature.
FFO: Funds From Operations, see Consolidated statement of cash flow
Free cash flow: Cash flow from operating activities less maintenance investments
Interest-bearing liabilities See Consolidated balance sheet - Supplementary Information
Net debt: See Consolidated balance sheet - Supplementary Information
Adjusted net debt: See Consolidated balance sheet - Supplementary Information
Capital employed: Total assets less financial assets, noninterest-bearing liabilities and certain other interest-bearing provisions not
included in adjusted net debt. see Consolidated balance sheet - Supplementary Information
Other definitions Definition
Hybrid Capital: Perpetual subordinated securities, junior to all Vattenfall’s unsubordinated debt instruments.
LTIF: Lost Time Injury Frequency (LTIF) is expressed in terms of the number of lost time work injuries (per 1 million
hours worked), i.e., work-related accidents resulting in absence longer than one day, and accidents resulting in
fatality.
CALCULATION OF EBITDA, UNDERLYING EBITDA AND UNDERLYING EBIT
Full year Full year Oct-Dec Oct-Dec
Amounts in SEK million 2021 2020 2021 2020
Operating profit (EBIT) 60 271 15 276 7 750 5 246
Depreciation, amortisation and impairment losses - 15 519 - 31 231 - 2 476 - 6 875
Operating profit before depreciation, amortisation and impairment losses (EBITDA) 75 790 46 507 10 226 12 121
Items affecting comparability excl. impairment losses and reversed impairment losses - 27 206 - 2 466 3 226 294
Underlying operating profit before depreciation, amortisation and impairment losses 48 584 44 041 13 452 12 415
Operating profit (EBIT) 60 271 15 276 7 750 5 246
Items affecting comparability - 29 090 10 514 1 342 2 741
Underlying operating profit 31 181 25 790 9 092 7 987
33
VATTENFALL YEAR-END REPORT 2021
The key ratios are presented as percentages (%) or times (x).
KEY RATIOS BASED ON CONTINUING OPERATIONS AND LAST 12-MONTH VALUES JANUARY 2021– DECEMBER 2021
Operating margin, % = 100 x
EBIT 60 271
= 33.5
Net sales 180 119
Operating margin excl. items
= 100 x
Underlying EBIT 31 181
= 17.3
affecting comparability, % Net sales 180 119
Pre-tax profit margin, % = 100 x
Profit before income taxes 59 373
= 33.0
Net sales 180 119
Pre-tax profit margin excl. items
= 100 x
Profit before income taxes excl. items affecting comparability 30 289
= 16.8
affecting comparability, % Net sales 180 119
Return on equity, % = 100 x
Profit for the period attributable to owner of the Parent Company 46 828
= 36.9
Average equity for the period attributable to owner of the 126 811
Parent Company excl. the Reserve for cash flow hedges
Return on capital employed, % = 100 x
EBIT 60 271
= 22.2
Capital employed, average 271 674
Return on capital employed excl.
= 100 x
Underlying EBIT 31 181
= 11.5
items affecting comparability, % Capital employed, average 271 674
EBIT interest cover, (x) =
EBIT + financial income 61 054
= 15.8
Financial expenses excl. discounting effects attributable to 3 873
provisions
EBIT interest cover excl. Items = Underlying EBIT + financial income 31 964 = 8.3
affecting comparability, (x) Financial expenses excl. discounting effects attributable to 3 873
provisions
FFO + financial expenses excl.
FFO interest cover, (x) =
discounting effects attributable to provisions 49 969
= 12.9
Financial expenses excl. discounting effects attributable to 3 873
provisions
FFO + financial items net excl. discounting effects attributable
FFO interest cover, net, (x) =
to provisions and return from the Swedish Nuclear Waste Fund 49 186
= 15.9
Financial items net excl. discounting effects attributable to 3 090
provisions and return from the Swedish Nuclear Waste Fund
34
VATTENFALL YEAR-END REPORT 2021
Cash flow from operating activities less maintenance
investments + financial expenses excl. Discounting
Cash flow interest cover after
=
effects attributable to provisions and interest components
related to pension costs 92 554
= 27.0
maintenance investments, (x) Financial expenses excl. discounting effects attributable to 3 434
provisions and interest components related to pension costs
FFO/gross debt, % = 100 x
FFO 46 096
= 36.5
Interest-bearing liabilities 126 408
FFO/net debt, % = 100 x
FFO 46 096
= -103.1
Net debt -44 703
FFO/adjusted net debt, % = 100 x
FFO 46 096
= 171.2
Adjusted net debt 26 922
EBITDA/net financial
=
EBITDA 75 790
= 24.5
items, (x) Financial items net excl. discounting effects attributable to 3 090
provisions and return from the Swedish Nuclear Waste Fund
EBITDA excl. items affecting
=
EBITDA excl. items affecting comparability 48 584
= 15.7
comparability/net financial Financial items net excl. discounting effects attributable to 3 090
items, (x) provisions and return from the Swedish Nuclear Waste Fund
KEY RATIOS BASED ON THE BALANCE SHEET PER 31 DECEMBER 2021
Equity/total assets, % = 100 x
Equity 197 182
= 25.2
Balance sheet total 782 358
Gross debt/equity, % = 100 x
Interest-bearing liabilities 126 408
= 64.1
Equity 197 182
Net debt/equity, % = 100 x
Net debt -44 703
= -22.7
Equity 197 182
Gross debt/gross debt
= 100 x
Interest-bearing liabilities 126 408
= 39.1
equity, % Interest-bearing liabilities + equity 323 590
Net debt/net debt plus
= 100 x
Net debt -44 703
= -29.3
equity, % Net debt + equity 152 479
Net debt/EBITDA, (x) =
Net debt -44 703
= -0.6
EBITDA 75 790
Adjusted net debt/
=
Adjusted net debt 26 922
= 0.4
EBITDA, (x) EBITDA 75 790
35
VATTENFALL YEAR-END REPORT 2021
This is information is such that Vattenfall AB is obliged to make public in accordance with the EU Market Abuse Regulation. The
information was submitted for publication, through the agency of the contact persons set out above, at 08.00 CET on 3 February
2022. This report has been prepared in both Swedish and English versions. In the event of discrepancies between the two versions,
the Swedish version shall govern.
Dividend
In accordance with Vattenfall’s dividend policy, the Board of
Directors proposes a dividend of SEK 23,414 million.
Annual General Meeting
The Annual General Meeting will be held on 28 April 2022.
The Annual General Meeting is open to the general public.
The Annual Report (in both Swedish and English versions) is
expected to be published on www.vattenfall.se and
www.vattenfall.com, respectively, on 29 March 2022.
Year-end report signature
Solna, 3 February 2022
Vattenfall AB (publ) The Board of Directors
This year-end report has not been reviewed by the
company’s auditor.
Financial calendar
Annual General Meeting, 28 April 2022
Interim report January-March, 29 April 2022
Interim report January-June, 22 July 2022
Interim report January-September, 27 October 2022
Contact information
Vattenfall AB (publ)
SE-169 92 Stockholm
Corporate identity number 556036-2138
T +46-8-739 50 00
www.vattenfall.com
www.vattenfall.se
Anna Borg
President and CEO
T +46-8-739 64 28
Kerstin Ahlfont
CFO
T +46-8-739 51 67
Johan Sahlqvist
Head of Group Control & Investor Relations
T +46-8-739 72 51
Vattenfall’s press office
T +46-8-739 50 10
press@vattenfall.com

More Related Content

What's hot

Presentation of Vattenfall's full year 2015 results
Presentation of Vattenfall's full year 2015 resultsPresentation of Vattenfall's full year 2015 results
Presentation of Vattenfall's full year 2015 resultsVattenfall
 
Q3 presentation 2015 for Vattenfall
Q3 presentation 2015 for VattenfallQ3 presentation 2015 for Vattenfall
Q3 presentation 2015 for VattenfallVattenfall
 
Vattenfall's year-end report 2016
Vattenfall's year-end report 2016Vattenfall's year-end report 2016
Vattenfall's year-end report 2016Vattenfall
 
Q1 2018: Interim report January-March
Q1 2018: Interim report January-MarchQ1 2018: Interim report January-March
Q1 2018: Interim report January-MarchVattenfall
 
Vattenfall's quarterly report January - March 2016
Vattenfall's quarterly report January - March 2016Vattenfall's quarterly report January - March 2016
Vattenfall's quarterly report January - March 2016Vattenfall
 
Half-year report January-June 2015 for Vattenfall
Half-year report January-June 2015 for VattenfallHalf-year report January-June 2015 for Vattenfall
Half-year report January-June 2015 for VattenfallVattenfall
 
Vattenfall’s Q2 and half-year results 2018
Vattenfall’s Q2 and half-year results 2018Vattenfall’s Q2 and half-year results 2018
Vattenfall’s Q2 and half-year results 2018Vattenfall
 
Vattenfall's year-end report 2015
Vattenfall's year-end report 2015Vattenfall's year-end report 2015
Vattenfall's year-end report 2015Vattenfall
 
Interim report January-June 2016
Interim report January-June 2016Interim report January-June 2016
Interim report January-June 2016Vattenfall
 
Q3 report 2016 for Vattenfall
Q3 report 2016 for VattenfallQ3 report 2016 for Vattenfall
Q3 report 2016 for VattenfallVattenfall
 
Third quarter 2020: Interim report January-September
Third quarter 2020: Interim report January-SeptemberThird quarter 2020: Interim report January-September
Third quarter 2020: Interim report January-SeptemberVattenfall
 
Q1 2019: Interim report January-March
Q1 2019: Interim report January-MarchQ1 2019: Interim report January-March
Q1 2019: Interim report January-MarchVattenfall
 
Vattenfall's Q3 report 2018
Vattenfall's Q3 report 2018Vattenfall's Q3 report 2018
Vattenfall's Q3 report 2018Vattenfall
 
Q3 report 2015 for Vattenfall
Q3 report 2015 for VattenfallQ3 report 2015 for Vattenfall
Q3 report 2015 for VattenfallVattenfall
 
Year end report 2018 - Vattenfall
Year end report 2018 - VattenfallYear end report 2018 - Vattenfall
Year end report 2018 - VattenfallVattenfall
 
Year-End report 2019 - Vattenfall
Year-End report 2019 - VattenfallYear-End report 2019 - Vattenfall
Year-End report 2019 - VattenfallVattenfall
 
9M 2021 Consolidated results
9M 2021 Consolidated results9M 2021 Consolidated results
9M 2021 Consolidated resultsSnam
 
Enea 2017 H1 - financial results (english)
Enea 2017 H1 - financial results (english)Enea 2017 H1 - financial results (english)
Enea 2017 H1 - financial results (english)Enea
 
Snam 2020 - 1Q Results
Snam 2020 - 1Q Results Snam 2020 - 1Q Results
Snam 2020 - 1Q Results Snam
 
Enea 2017 Q1 - financial results (english)
Enea 2017 Q1 - financial results (english)Enea 2017 Q1 - financial results (english)
Enea 2017 Q1 - financial results (english)Enea
 

What's hot (20)

Presentation of Vattenfall's full year 2015 results
Presentation of Vattenfall's full year 2015 resultsPresentation of Vattenfall's full year 2015 results
Presentation of Vattenfall's full year 2015 results
 
Q3 presentation 2015 for Vattenfall
Q3 presentation 2015 for VattenfallQ3 presentation 2015 for Vattenfall
Q3 presentation 2015 for Vattenfall
 
Vattenfall's year-end report 2016
Vattenfall's year-end report 2016Vattenfall's year-end report 2016
Vattenfall's year-end report 2016
 
Q1 2018: Interim report January-March
Q1 2018: Interim report January-MarchQ1 2018: Interim report January-March
Q1 2018: Interim report January-March
 
Vattenfall's quarterly report January - March 2016
Vattenfall's quarterly report January - March 2016Vattenfall's quarterly report January - March 2016
Vattenfall's quarterly report January - March 2016
 
Half-year report January-June 2015 for Vattenfall
Half-year report January-June 2015 for VattenfallHalf-year report January-June 2015 for Vattenfall
Half-year report January-June 2015 for Vattenfall
 
Vattenfall’s Q2 and half-year results 2018
Vattenfall’s Q2 and half-year results 2018Vattenfall’s Q2 and half-year results 2018
Vattenfall’s Q2 and half-year results 2018
 
Vattenfall's year-end report 2015
Vattenfall's year-end report 2015Vattenfall's year-end report 2015
Vattenfall's year-end report 2015
 
Interim report January-June 2016
Interim report January-June 2016Interim report January-June 2016
Interim report January-June 2016
 
Q3 report 2016 for Vattenfall
Q3 report 2016 for VattenfallQ3 report 2016 for Vattenfall
Q3 report 2016 for Vattenfall
 
Third quarter 2020: Interim report January-September
Third quarter 2020: Interim report January-SeptemberThird quarter 2020: Interim report January-September
Third quarter 2020: Interim report January-September
 
Q1 2019: Interim report January-March
Q1 2019: Interim report January-MarchQ1 2019: Interim report January-March
Q1 2019: Interim report January-March
 
Vattenfall's Q3 report 2018
Vattenfall's Q3 report 2018Vattenfall's Q3 report 2018
Vattenfall's Q3 report 2018
 
Q3 report 2015 for Vattenfall
Q3 report 2015 for VattenfallQ3 report 2015 for Vattenfall
Q3 report 2015 for Vattenfall
 
Year end report 2018 - Vattenfall
Year end report 2018 - VattenfallYear end report 2018 - Vattenfall
Year end report 2018 - Vattenfall
 
Year-End report 2019 - Vattenfall
Year-End report 2019 - VattenfallYear-End report 2019 - Vattenfall
Year-End report 2019 - Vattenfall
 
9M 2021 Consolidated results
9M 2021 Consolidated results9M 2021 Consolidated results
9M 2021 Consolidated results
 
Enea 2017 H1 - financial results (english)
Enea 2017 H1 - financial results (english)Enea 2017 H1 - financial results (english)
Enea 2017 H1 - financial results (english)
 
Snam 2020 - 1Q Results
Snam 2020 - 1Q Results Snam 2020 - 1Q Results
Snam 2020 - 1Q Results
 
Enea 2017 Q1 - financial results (english)
Enea 2017 Q1 - financial results (english)Enea 2017 Q1 - financial results (english)
Enea 2017 Q1 - financial results (english)
 

Similar to Year-End report 2021 – Vattenfall

Q3: Interim report January-September 2022
Q3: Interim report January-September 2022Q3: Interim report January-September 2022
Q3: Interim report January-September 2022Vattenfall
 
Year-End Report 2022
Year-End Report 2022Year-End Report 2022
Year-End Report 2022Vattenfall
 
Q2 2022: Interim report January-June
Q2 2022: Interim report January-JuneQ2 2022: Interim report January-June
Q2 2022: Interim report January-JuneVattenfall
 
Q1 2022: Interim Report January-March
Q1 2022: Interim Report January-MarchQ1 2022: Interim Report January-March
Q1 2022: Interim Report January-MarchVattenfall
 
Q3 2023: Interim report January- September
Q3 2023: Interim report January- SeptemberQ3 2023: Interim report January- September
Q3 2023: Interim report January- SeptemberVattenfall
 
Q2 2023: Interim report January- June
Q2 2023: Interim report January- JuneQ2 2023: Interim report January- June
Q2 2023: Interim report January- JuneVattenfall
 
Vattenfall’s Q2 and half-year results 2017
Vattenfall’s Q2 and half-year results 2017Vattenfall’s Q2 and half-year results 2017
Vattenfall’s Q2 and half-year results 2017Vattenfall
 
Vattenfall Q1 report 2017
Vattenfall Q1 report 2017Vattenfall Q1 report 2017
Vattenfall Q1 report 2017Vattenfall
 
Vattenfall's year-end report 2017
Vattenfall's year-end report 2017Vattenfall's year-end report 2017
Vattenfall's year-end report 2017Vattenfall
 
Vattenfall’s Q3 report 2017
Vattenfall’s Q3 report 2017Vattenfall’s Q3 report 2017
Vattenfall’s Q3 report 2017Vattenfall
 
Q1 2023: Interim Report January-March
Q1 2023: Interim Report January-MarchQ1 2023: Interim Report January-March
Q1 2023: Interim Report January-MarchVattenfall
 
Q3 2019: Interim report January-September
Q3 2019: Interim report January-SeptemberQ3 2019: Interim report January-September
Q3 2019: Interim report January-SeptemberVattenfall
 
Vattenfall's quarterly report January - March 2015
Vattenfall's quarterly report January - March 2015Vattenfall's quarterly report January - March 2015
Vattenfall's quarterly report January - March 2015Vattenfall
 
The role of Norwegian offshore wind in the energy system transition
The role of Norwegian offshore wind in the energy system transitionThe role of Norwegian offshore wind in the energy system transition
The role of Norwegian offshore wind in the energy system transitionIEA-ETSAP
 
Vattenfall Annual and Sustainability Report 2016
Vattenfall Annual and Sustainability Report 2016Vattenfall Annual and Sustainability Report 2016
Vattenfall Annual and Sustainability Report 2016Vattenfall
 

Similar to Year-End report 2021 – Vattenfall (15)

Q3: Interim report January-September 2022
Q3: Interim report January-September 2022Q3: Interim report January-September 2022
Q3: Interim report January-September 2022
 
Year-End Report 2022
Year-End Report 2022Year-End Report 2022
Year-End Report 2022
 
Q2 2022: Interim report January-June
Q2 2022: Interim report January-JuneQ2 2022: Interim report January-June
Q2 2022: Interim report January-June
 
Q1 2022: Interim Report January-March
Q1 2022: Interim Report January-MarchQ1 2022: Interim Report January-March
Q1 2022: Interim Report January-March
 
Q3 2023: Interim report January- September
Q3 2023: Interim report January- SeptemberQ3 2023: Interim report January- September
Q3 2023: Interim report January- September
 
Q2 2023: Interim report January- June
Q2 2023: Interim report January- JuneQ2 2023: Interim report January- June
Q2 2023: Interim report January- June
 
Vattenfall’s Q2 and half-year results 2017
Vattenfall’s Q2 and half-year results 2017Vattenfall’s Q2 and half-year results 2017
Vattenfall’s Q2 and half-year results 2017
 
Vattenfall Q1 report 2017
Vattenfall Q1 report 2017Vattenfall Q1 report 2017
Vattenfall Q1 report 2017
 
Vattenfall's year-end report 2017
Vattenfall's year-end report 2017Vattenfall's year-end report 2017
Vattenfall's year-end report 2017
 
Vattenfall’s Q3 report 2017
Vattenfall’s Q3 report 2017Vattenfall’s Q3 report 2017
Vattenfall’s Q3 report 2017
 
Q1 2023: Interim Report January-March
Q1 2023: Interim Report January-MarchQ1 2023: Interim Report January-March
Q1 2023: Interim Report January-March
 
Q3 2019: Interim report January-September
Q3 2019: Interim report January-SeptemberQ3 2019: Interim report January-September
Q3 2019: Interim report January-September
 
Vattenfall's quarterly report January - March 2015
Vattenfall's quarterly report January - March 2015Vattenfall's quarterly report January - March 2015
Vattenfall's quarterly report January - March 2015
 
The role of Norwegian offshore wind in the energy system transition
The role of Norwegian offshore wind in the energy system transitionThe role of Norwegian offshore wind in the energy system transition
The role of Norwegian offshore wind in the energy system transition
 
Vattenfall Annual and Sustainability Report 2016
Vattenfall Annual and Sustainability Report 2016Vattenfall Annual and Sustainability Report 2016
Vattenfall Annual and Sustainability Report 2016
 

More from Vattenfall

Kvartal 3 2023: Delårsrapport Januari-September
Kvartal 3 2023: Delårsrapport Januari-SeptemberKvartal 3 2023: Delårsrapport Januari-September
Kvartal 3 2023: Delårsrapport Januari-SeptemberVattenfall
 
Kvartal 2 2023: Delårsrapport Januari-Juni
Kvartal 2 2023: Delårsrapport Januari-JuniKvartal 2 2023: Delårsrapport Januari-Juni
Kvartal 2 2023: Delårsrapport Januari-JuniVattenfall
 
Kvartal 1 2023: Delårsrapport januari-mars
Kvartal 1 2023: Delårsrapport januari-marsKvartal 1 2023: Delårsrapport januari-mars
Kvartal 1 2023: Delårsrapport januari-marsVattenfall
 
Bokslutskommuniké 2022
Bokslutskommuniké 2022Bokslutskommuniké 2022
Bokslutskommuniké 2022Vattenfall
 
Kvartal 3 2022: Delårsrapport januari-september
Kvartal 3 2022: Delårsrapport januari-septemberKvartal 3 2022: Delårsrapport januari-september
Kvartal 3 2022: Delårsrapport januari-septemberVattenfall
 
Kvartal 2 2022: Delårsrapport januari-juni 2022
Kvartal 2 2022: Delårsrapport januari-juni 2022Kvartal 2 2022: Delårsrapport januari-juni 2022
Kvartal 2 2022: Delårsrapport januari-juni 2022Vattenfall
 
Kvartal 1 2022: Delårsrapport januari-mars
Kvartal 1 2022: Delårsrapport januari-marsKvartal 1 2022: Delårsrapport januari-mars
Kvartal 1 2022: Delårsrapport januari-marsVattenfall
 
Bokslutskommuniké 2021 - Vattenfall
Bokslutskommuniké 2021 - VattenfallBokslutskommuniké 2021 - Vattenfall
Bokslutskommuniké 2021 - VattenfallVattenfall
 
Kvartal 3 2021: Delårsrapport januari-september 2021
Kvartal 3 2021: Delårsrapport januari-september 2021Kvartal 3 2021: Delårsrapport januari-september 2021
Kvartal 3 2021: Delårsrapport januari-september 2021Vattenfall
 
Kvartal 2 2021: Delårsrapport januari-juni 2021
Kvartal 2 2021: Delårsrapport januari-juni 2021Kvartal 2 2021: Delårsrapport januari-juni 2021
Kvartal 2 2021: Delårsrapport januari-juni 2021Vattenfall
 
Kvartal 1 2021: Delårsrapport januari-mars 2021
Kvartal 1 2021: Delårsrapport januari-mars 2021Kvartal 1 2021: Delårsrapport januari-mars 2021
Kvartal 1 2021: Delårsrapport januari-mars 2021Vattenfall
 
Bokslutskommuniké 2020 – Vattenfall
Bokslutskommuniké 2020 – VattenfallBokslutskommuniké 2020 – Vattenfall
Bokslutskommuniké 2020 – VattenfallVattenfall
 
Kvartal 3 2020: Delårsrapport januari-september 2020
Kvartal 3 2020: Delårsrapport januari-september 2020Kvartal 3 2020: Delårsrapport januari-september 2020
Kvartal 3 2020: Delårsrapport januari-september 2020Vattenfall
 
Kvartal 2 2020: Delårsrapport januari-juni 2020
Kvartal 2 2020: Delårsrapport januari-juni 2020Kvartal 2 2020: Delårsrapport januari-juni 2020
Kvartal 2 2020: Delårsrapport januari-juni 2020Vattenfall
 
Kvartal 1 2020: Delårsrapport januari-mars 2020
Kvartal 1 2020: Delårsrapport januari-mars 2020Kvartal 1 2020: Delårsrapport januari-mars 2020
Kvartal 1 2020: Delårsrapport januari-mars 2020Vattenfall
 

More from Vattenfall (15)

Kvartal 3 2023: Delårsrapport Januari-September
Kvartal 3 2023: Delårsrapport Januari-SeptemberKvartal 3 2023: Delårsrapport Januari-September
Kvartal 3 2023: Delårsrapport Januari-September
 
Kvartal 2 2023: Delårsrapport Januari-Juni
Kvartal 2 2023: Delårsrapport Januari-JuniKvartal 2 2023: Delårsrapport Januari-Juni
Kvartal 2 2023: Delårsrapport Januari-Juni
 
Kvartal 1 2023: Delårsrapport januari-mars
Kvartal 1 2023: Delårsrapport januari-marsKvartal 1 2023: Delårsrapport januari-mars
Kvartal 1 2023: Delårsrapport januari-mars
 
Bokslutskommuniké 2022
Bokslutskommuniké 2022Bokslutskommuniké 2022
Bokslutskommuniké 2022
 
Kvartal 3 2022: Delårsrapport januari-september
Kvartal 3 2022: Delårsrapport januari-septemberKvartal 3 2022: Delårsrapport januari-september
Kvartal 3 2022: Delårsrapport januari-september
 
Kvartal 2 2022: Delårsrapport januari-juni 2022
Kvartal 2 2022: Delårsrapport januari-juni 2022Kvartal 2 2022: Delårsrapport januari-juni 2022
Kvartal 2 2022: Delårsrapport januari-juni 2022
 
Kvartal 1 2022: Delårsrapport januari-mars
Kvartal 1 2022: Delårsrapport januari-marsKvartal 1 2022: Delårsrapport januari-mars
Kvartal 1 2022: Delårsrapport januari-mars
 
Bokslutskommuniké 2021 - Vattenfall
Bokslutskommuniké 2021 - VattenfallBokslutskommuniké 2021 - Vattenfall
Bokslutskommuniké 2021 - Vattenfall
 
Kvartal 3 2021: Delårsrapport januari-september 2021
Kvartal 3 2021: Delårsrapport januari-september 2021Kvartal 3 2021: Delårsrapport januari-september 2021
Kvartal 3 2021: Delårsrapport januari-september 2021
 
Kvartal 2 2021: Delårsrapport januari-juni 2021
Kvartal 2 2021: Delårsrapport januari-juni 2021Kvartal 2 2021: Delårsrapport januari-juni 2021
Kvartal 2 2021: Delårsrapport januari-juni 2021
 
Kvartal 1 2021: Delårsrapport januari-mars 2021
Kvartal 1 2021: Delårsrapport januari-mars 2021Kvartal 1 2021: Delårsrapport januari-mars 2021
Kvartal 1 2021: Delårsrapport januari-mars 2021
 
Bokslutskommuniké 2020 – Vattenfall
Bokslutskommuniké 2020 – VattenfallBokslutskommuniké 2020 – Vattenfall
Bokslutskommuniké 2020 – Vattenfall
 
Kvartal 3 2020: Delårsrapport januari-september 2020
Kvartal 3 2020: Delårsrapport januari-september 2020Kvartal 3 2020: Delårsrapport januari-september 2020
Kvartal 3 2020: Delårsrapport januari-september 2020
 
Kvartal 2 2020: Delårsrapport januari-juni 2020
Kvartal 2 2020: Delårsrapport januari-juni 2020Kvartal 2 2020: Delårsrapport januari-juni 2020
Kvartal 2 2020: Delårsrapport januari-juni 2020
 
Kvartal 1 2020: Delårsrapport januari-mars 2020
Kvartal 1 2020: Delårsrapport januari-mars 2020Kvartal 1 2020: Delårsrapport januari-mars 2020
Kvartal 1 2020: Delårsrapport januari-mars 2020
 

Recently uploaded

Nicola Mining Inc. Corporate Presentation April 2024
Nicola Mining Inc. Corporate Presentation April 2024Nicola Mining Inc. Corporate Presentation April 2024
Nicola Mining Inc. Corporate Presentation April 2024nicola_mining
 
Cyberagent_For New Investors_EN_240424.pdf
Cyberagent_For New Investors_EN_240424.pdfCyberagent_For New Investors_EN_240424.pdf
Cyberagent_For New Investors_EN_240424.pdfCyberAgent, Inc.
 
Osisko Gold Royalties Ltd - Corporate Presentation, April 23, 2024
Osisko Gold Royalties Ltd - Corporate Presentation, April 23, 2024Osisko Gold Royalties Ltd - Corporate Presentation, April 23, 2024
Osisko Gold Royalties Ltd - Corporate Presentation, April 23, 2024Osisko Gold Royalties Ltd
 
9654467111 Low Rate Call Girls In Tughlakabad, Delhi NCR
9654467111 Low Rate Call Girls In Tughlakabad, Delhi NCR9654467111 Low Rate Call Girls In Tughlakabad, Delhi NCR
9654467111 Low Rate Call Girls In Tughlakabad, Delhi NCRSapana Sha
 
High Profile Call Girls Kolkata Trisha 🤌 8250192130 🚀 Vip Call Girls Kolkata
High Profile Call Girls Kolkata Trisha 🤌  8250192130 🚀 Vip Call Girls KolkataHigh Profile Call Girls Kolkata Trisha 🤌  8250192130 🚀 Vip Call Girls Kolkata
High Profile Call Girls Kolkata Trisha 🤌 8250192130 🚀 Vip Call Girls Kolkataanamikaraghav4
 
Russian Call Girls Kolkata Indira 🤌 8250192130 🚀 Vip Call Girls Kolkata
Russian Call Girls Kolkata Indira 🤌  8250192130 🚀 Vip Call Girls KolkataRussian Call Girls Kolkata Indira 🤌  8250192130 🚀 Vip Call Girls Kolkata
Russian Call Girls Kolkata Indira 🤌 8250192130 🚀 Vip Call Girls Kolkataanamikaraghav4
 
如何办理北卡罗来纳大学教堂山分校毕业证(文凭)UNC学位证书
如何办理北卡罗来纳大学教堂山分校毕业证(文凭)UNC学位证书如何办理北卡罗来纳大学教堂山分校毕业证(文凭)UNC学位证书
如何办理北卡罗来纳大学教堂山分校毕业证(文凭)UNC学位证书Fir La
 
High Profile Call Girls Kolkata Gayatri 🤌 8250192130 🚀 Vip Call Girls Kolkata
High Profile Call Girls Kolkata Gayatri 🤌  8250192130 🚀 Vip Call Girls KolkataHigh Profile Call Girls Kolkata Gayatri 🤌  8250192130 🚀 Vip Call Girls Kolkata
High Profile Call Girls Kolkata Gayatri 🤌 8250192130 🚀 Vip Call Girls Kolkataanamikaraghav4
 
VIP 7001035870 Find & Meet Hyderabad Call Girls Abids high-profile Call Girl
VIP 7001035870 Find & Meet Hyderabad Call Girls Abids high-profile Call GirlVIP 7001035870 Find & Meet Hyderabad Call Girls Abids high-profile Call Girl
VIP 7001035870 Find & Meet Hyderabad Call Girls Abids high-profile Call Girladitipandeya
 
定制(UWIC毕业证书)英国卡迪夫城市大学毕业证成绩单原版一比一
定制(UWIC毕业证书)英国卡迪夫城市大学毕业证成绩单原版一比一定制(UWIC毕业证书)英国卡迪夫城市大学毕业证成绩单原版一比一
定制(UWIC毕业证书)英国卡迪夫城市大学毕业证成绩单原版一比一Fir La
 
The Concept of Humanity in Islam and its effects at future of humanity
The Concept of Humanity in Islam and its effects at future of humanityThe Concept of Humanity in Islam and its effects at future of humanity
The Concept of Humanity in Islam and its effects at future of humanityJohanAspro
 
VIP 7001035870 Find & Meet Hyderabad Call Girls Miyapur high-profile Call Girl
VIP 7001035870 Find & Meet Hyderabad Call Girls Miyapur high-profile Call GirlVIP 7001035870 Find & Meet Hyderabad Call Girls Miyapur high-profile Call Girl
VIP 7001035870 Find & Meet Hyderabad Call Girls Miyapur high-profile Call Girladitipandeya
 
Methanex Investor Presentation (April 2024)
Methanex Investor Presentation (April 2024)Methanex Investor Presentation (April 2024)
Methanex Investor Presentation (April 2024)Methanex Corporation
 
VIP Kolkata Call Girl Rishra 👉 8250192130 Available With Room
VIP Kolkata Call Girl Rishra 👉 8250192130  Available With RoomVIP Kolkata Call Girl Rishra 👉 8250192130  Available With Room
VIP Kolkata Call Girl Rishra 👉 8250192130 Available With Roomdivyansh0kumar0
 
Malad Escorts, (Pooja 09892124323), Malad Call Girls Service
Malad Escorts, (Pooja 09892124323), Malad Call Girls ServiceMalad Escorts, (Pooja 09892124323), Malad Call Girls Service
Malad Escorts, (Pooja 09892124323), Malad Call Girls ServicePooja Nehwal
 

Recently uploaded (20)

Nicola Mining Inc. Corporate Presentation April 2024
Nicola Mining Inc. Corporate Presentation April 2024Nicola Mining Inc. Corporate Presentation April 2024
Nicola Mining Inc. Corporate Presentation April 2024
 
Cyberagent_For New Investors_EN_240424.pdf
Cyberagent_For New Investors_EN_240424.pdfCyberagent_For New Investors_EN_240424.pdf
Cyberagent_For New Investors_EN_240424.pdf
 
Osisko Gold Royalties Ltd - Corporate Presentation, April 23, 2024
Osisko Gold Royalties Ltd - Corporate Presentation, April 23, 2024Osisko Gold Royalties Ltd - Corporate Presentation, April 23, 2024
Osisko Gold Royalties Ltd - Corporate Presentation, April 23, 2024
 
9654467111 Low Rate Call Girls In Tughlakabad, Delhi NCR
9654467111 Low Rate Call Girls In Tughlakabad, Delhi NCR9654467111 Low Rate Call Girls In Tughlakabad, Delhi NCR
9654467111 Low Rate Call Girls In Tughlakabad, Delhi NCR
 
High Profile Call Girls Kolkata Trisha 🤌 8250192130 🚀 Vip Call Girls Kolkata
High Profile Call Girls Kolkata Trisha 🤌  8250192130 🚀 Vip Call Girls KolkataHigh Profile Call Girls Kolkata Trisha 🤌  8250192130 🚀 Vip Call Girls Kolkata
High Profile Call Girls Kolkata Trisha 🤌 8250192130 🚀 Vip Call Girls Kolkata
 
Russian Call Girls Kolkata Indira 🤌 8250192130 🚀 Vip Call Girls Kolkata
Russian Call Girls Kolkata Indira 🤌  8250192130 🚀 Vip Call Girls KolkataRussian Call Girls Kolkata Indira 🤌  8250192130 🚀 Vip Call Girls Kolkata
Russian Call Girls Kolkata Indira 🤌 8250192130 🚀 Vip Call Girls Kolkata
 
young call girls in Govindpuri 🔝 9953056974 🔝 Delhi escort Service
young call girls in Govindpuri 🔝 9953056974 🔝 Delhi escort Serviceyoung call girls in Govindpuri 🔝 9953056974 🔝 Delhi escort Service
young call girls in Govindpuri 🔝 9953056974 🔝 Delhi escort Service
 
Call Girls 🫤 Nehru Place ➡️ 9999965857 ➡️ Delhi 🫦 Russian Escorts FULL ENJOY
Call Girls 🫤 Nehru Place ➡️ 9999965857  ➡️ Delhi 🫦  Russian Escorts FULL ENJOYCall Girls 🫤 Nehru Place ➡️ 9999965857  ➡️ Delhi 🫦  Russian Escorts FULL ENJOY
Call Girls 🫤 Nehru Place ➡️ 9999965857 ➡️ Delhi 🫦 Russian Escorts FULL ENJOY
 
如何办理北卡罗来纳大学教堂山分校毕业证(文凭)UNC学位证书
如何办理北卡罗来纳大学教堂山分校毕业证(文凭)UNC学位证书如何办理北卡罗来纳大学教堂山分校毕业证(文凭)UNC学位证书
如何办理北卡罗来纳大学教堂山分校毕业证(文凭)UNC学位证书
 
High Profile Call Girls Kolkata Gayatri 🤌 8250192130 🚀 Vip Call Girls Kolkata
High Profile Call Girls Kolkata Gayatri 🤌  8250192130 🚀 Vip Call Girls KolkataHigh Profile Call Girls Kolkata Gayatri 🤌  8250192130 🚀 Vip Call Girls Kolkata
High Profile Call Girls Kolkata Gayatri 🤌 8250192130 🚀 Vip Call Girls Kolkata
 
VIP 7001035870 Find & Meet Hyderabad Call Girls Abids high-profile Call Girl
VIP 7001035870 Find & Meet Hyderabad Call Girls Abids high-profile Call GirlVIP 7001035870 Find & Meet Hyderabad Call Girls Abids high-profile Call Girl
VIP 7001035870 Find & Meet Hyderabad Call Girls Abids high-profile Call Girl
 
定制(UWIC毕业证书)英国卡迪夫城市大学毕业证成绩单原版一比一
定制(UWIC毕业证书)英国卡迪夫城市大学毕业证成绩单原版一比一定制(UWIC毕业证书)英国卡迪夫城市大学毕业证成绩单原版一比一
定制(UWIC毕业证书)英国卡迪夫城市大学毕业证成绩单原版一比一
 
The Concept of Humanity in Islam and its effects at future of humanity
The Concept of Humanity in Islam and its effects at future of humanityThe Concept of Humanity in Islam and its effects at future of humanity
The Concept of Humanity in Islam and its effects at future of humanity
 
Model Call Girl in Uttam Nagar Delhi reach out to us at 🔝9953056974🔝
Model Call Girl in Uttam Nagar Delhi reach out to us at 🔝9953056974🔝Model Call Girl in Uttam Nagar Delhi reach out to us at 🔝9953056974🔝
Model Call Girl in Uttam Nagar Delhi reach out to us at 🔝9953056974🔝
 
VIP 7001035870 Find & Meet Hyderabad Call Girls Miyapur high-profile Call Girl
VIP 7001035870 Find & Meet Hyderabad Call Girls Miyapur high-profile Call GirlVIP 7001035870 Find & Meet Hyderabad Call Girls Miyapur high-profile Call Girl
VIP 7001035870 Find & Meet Hyderabad Call Girls Miyapur high-profile Call Girl
 
Methanex Investor Presentation (April 2024)
Methanex Investor Presentation (April 2024)Methanex Investor Presentation (April 2024)
Methanex Investor Presentation (April 2024)
 
VIP Kolkata Call Girl Rishra 👉 8250192130 Available With Room
VIP Kolkata Call Girl Rishra 👉 8250192130  Available With RoomVIP Kolkata Call Girl Rishra 👉 8250192130  Available With Room
VIP Kolkata Call Girl Rishra 👉 8250192130 Available With Room
 
Call Girls 🫤 Mukherjee Nagar ➡️ 9999965857 ➡️ Delhi 🫦 Russian Escorts FULL ...
Call Girls 🫤 Mukherjee Nagar ➡️ 9999965857  ➡️ Delhi 🫦  Russian Escorts FULL ...Call Girls 🫤 Mukherjee Nagar ➡️ 9999965857  ➡️ Delhi 🫦  Russian Escorts FULL ...
Call Girls 🫤 Mukherjee Nagar ➡️ 9999965857 ➡️ Delhi 🫦 Russian Escorts FULL ...
 
Preet Vihar (Delhi) 9953330565 Escorts, Call Girls Services
Preet Vihar (Delhi) 9953330565 Escorts, Call Girls ServicesPreet Vihar (Delhi) 9953330565 Escorts, Call Girls Services
Preet Vihar (Delhi) 9953330565 Escorts, Call Girls Services
 
Malad Escorts, (Pooja 09892124323), Malad Call Girls Service
Malad Escorts, (Pooja 09892124323), Malad Call Girls ServiceMalad Escorts, (Pooja 09892124323), Malad Call Girls Service
Malad Escorts, (Pooja 09892124323), Malad Call Girls Service
 

Year-End report 2021 – Vattenfall

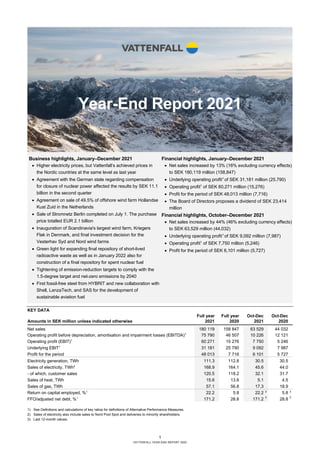
  • 1. 1 VATTENFALL YEAR-END REPORT 2020 Year-End Report 2021 KEY DATA Full year Full year Oct-Dec Oct-Dec Amounts in SEK million unless indicated otherwise 2021 2020 2021 2020 Net sales 180 119 158 847 63 529 44 032 Operating profit before depreciation, amortisation and impairment losses (EBITDA)1 75 790 46 507 10 226 12 121 Operating profit (EBIT)1 60 271 15 276 7 750 5 246 Underlying EBIT1 31 181 25 790 9 092 7 987 Profit for the period 48 013 7 716 6 101 5 727 Electricity generation, TWh 111.3 112.8 30.5 30.5 Sales of electricity, TWh2 168.9 164.1 45.6 44.0 - of which, customer sales 120.5 118.2 32.1 31.7 Sales of heat, TWh 15.6 13.8 5.1 4.5 Sales of gas, TWh 57.1 56.8 17.3 18.9 Return on capital employed, %1 22.2 5.8 22.2 3 5.8 3 FFO/adjusted net debt, %1 171.2 28.8 171.2 3 28.8 3 1) See Definitions and calculations of key ratios for definitions of Alternative Performance Measures. 2) Sales of electricity also include sales to Nord Pool Spot and deliveries to minority shareholders. 3) Last 12-month values. Business highlights, January–December 2021 • Higher electricity prices, but Vattenfall’s achieved prices in the Nordic countries at the same level as last year • Agreement with the German state regarding compensation for closure of nuclear power affected the results by SEK 11.1 billion in the second quarter • Agreement on sale of 49.5% of offshore wind farm Hollandse Kust Zuid in the Netherlands • Sale of Stromnetz Berlin completed on July 1. The purchase price totalled EUR 2.1 billion • Inauguration of Scandinavia's largest wind farm, Kriegers Flak in Denmark, and final investment decision for the Vesterhav Syd and Nord wind farms • Green light for expanding final repository of short-lived radioactive waste as well as in January 2022 also for construction of a final repository for spent nuclear fuel • Tightening of emission-reduction targets to comply with the 1.5-degree target and net-zero emissions by 2040 • First fossil-free steel from HYBRIT and new collaboration with Shell, LanzaTech, and SAS for the development of sustainable aviation fuel Financial highlights, January–December 2021 • Net sales increased by 13% (16% excluding currency effects) to SEK 180,119 million (158,847) • Underlying operating profit1 of SEK 31,181 million (25,790) • Operating profit1 of SEK 60,271 million (15,276) • Profit for the period of SEK 48,013 million (7,716) • The Board of Directors proposes a dividend of SEK 23,414 million Financial highlights, October–December 2021 • Net sales increased by 44% (46% excluding currency effects) to SEK 63,529 million (44,032) • Underlying operating profit1 of SEK 9,092 million (7,987) • Operating profit1 of SEK 7,750 million (5,246) • Profit for the period of SEK 6,101 million (5,727)
  • 2. 2 VATTENFALL YEAR-END REPORT 2021 CEO’s comment Strong result and strategic progress for Vattenfall in 2021 Vattenfall’s 2021 results is strong, mainly owing to compensation for the closure of German nuclear power and the divestment of the distribution operations in Berlin. The earnings impact from higher electricity prices has been limited since we hedge our generation and achieved prices were at the same level as last year in the Nordic region. Fossil-based generation decreased markedly at the same time as nuclear, hydro and wind power made higher contributions. We increased sales of electricity, heat, and gas and reached milestones across a number of projects that are driving the energy transition forward. Volatility in Europe’s electricity markets Electricity prices have risen significantly across all of our markets during the year, and the average price for 2021 was five times higher than the previous year in the Nordics and three times higher on the Continent. The fact that Vattenfall's achieved price in the Nordic countries remained unchanged compared to 2020 was primarily a result of the price hedges we have in place to balance risks as well as the impact of price area differences in Sweden. In the fourth quarter, electricity prices continued to reach record levels while volatility was at historic highs. On the Continent, rising prices for gas and CO2 emission allowances had the greatest impact. This also affected electricity prices across the Nordic countries, but cold and dry weather were also major contributors. The market situation affected many customers, especially those who did not have fixed electricity price agreements. When our customers are in contact with us we aim to offer them tailored solutions regarding electricity contract, consumption and payments. Major result impact from one-off effects Profit for the year 2021 amounted to SEK 48.0 billion for the full year and SEK 6.1 billion for the quarter. Compensation for the closure of German nuclear power and the sale of Stromnetz Berlin bolstered the results for the year by SEK 12.5 billion and SEK 8.4 billion, respectively. The market situation had a major temporary impact on our adjusted net debt, which declined significantly as a result of received margin calls. Taking into consideration these results with large one-off effects, the Board of Directors proposes a dividend of SEK 23.4 billion. This will allow us to retain financial stability as reflected in the balance sheet and Vattenfall will continue to invest in the energy transition. Our operations developed very well. The underlying operating profit rose by SEK 5.4 billion to SEK 31.2 billion. Wind power nearly doubled its contribution thanks to increased capacity in Denmark and the Netherlands as well as higher electricity prices in the UK and on the Continent. Our pumped storage power plants in Germany also made a significant contribution. New climate target an important step An important step for Vattenfall for the year was our new emissions target, which complies with the 1.5-degree scenario set out in the Paris Agreement. To reach this target, we will need to expand our renewable electricity generation and phase out fossil fuels in our heat business. During the year, we opened the biggest offshore wind farm in Scandinavia, Kriegers Flak in Denmark, and in Sweden the first heat was delivered from the biofuel plant Carpe Futurum in Uppsala. We are dedicated to establishing more partnerships, like our sale of a 49.5% share of the offshore wind farm Hollandse Kust Zuid to BASF. By partnering with customers in respect of both ownership and production of new renewable capacity, we share risks and release resources for more investments. In-depth climate partnerships For Vattenfall, 2021 was also a year in which we engaged in in-depth relationships to help the climate. We attended the climate meeting COP26 where we launched the First Movers Coalition. This means that we, along with 32 other companies, have committed ourselves to increasing demand for new technology with high potential to reduce the world's CO2 emissions. We have also entered into multiple partnerships to pave the way for the energy transition. One example of this is our latest collaboration with Shell, LanzaTech, and SAS to develop sustainable aviation fuel. Another milestone, in July 2021, was the production of the first fossil-free steel within our partnership HYBRIT and subsequent delivery by SSAB to Volvo Group. I would like to thank everyone who contributed to making 2021 such a strong year for Vattenfall. I look forward to the new year with confidence. In spite of an uncertain and volatile market, the road ahead is clear for Vattenfall. Together with my colleagues, I am looking forward to continuing our journey towards a fossil free life. Anna Borg President and CEO Profit for the period Full year 2021 48.0 SEK billion (7.7) Underlying operating profit Full year 2021 31.2 SEK billion (25.8) FFO/adjusted net debt Full year 2021 171.2% (28.8) Return on capital employed Full year 2021 22.2% (5.8)
  • 3. 3 VATTENFALL YEAR-END REPORT 2021 Group overview Customer sales development Sales of electricity, excluding sales to Nord Pool Spot and deliveries to minority shareholders, increased by 2.3 TWh to 120.5 TWh (118.2), mainly owing to higher volumes in the Nordic countries and in Germany. Lower sales in the B2B segment in France had a countering effect. Sales of gas increased by 0.3 TWh to 57.1 TWh (56.8) primarily as a result of colder weather in the Netherlands and in Germany. Sales of heat increased by 1.8 TWh to 15.6 TWh (13.8). CUSTOMER SALES (TWh) Generation development Total electricity generation decreased by 1.5 TWh to 111.3 TWh (112.8) in 2021. Lower fossil-based (-4.1 TWh) power generation and higher hydro (+1.1 TWh), nuclear (+1.0 TWh) and wind power (+0.3 TWh) generation. ELECTRICITY GENERATION (TWh) Price development Average Nordic electricity spot prices were 599% higer, at EUR 96.2/MWh (13.8) during the fourth quarter of 2021 compared to the same period in 2020, mainly owing to a lower hydrological balance, cold weather, and higher electricity prices on the Continent. Spot prices in Germany were 362% higher, at EUR 178.9/MWh (38.8), and prices in the Netherlands increased by 365% to EUR 196.0/MWh (42.2). Prices in Germany and the Netherlands were mainly affected by higher fuel prices and higher prices for CO2 emission allowances as well as lower wind speeds and reduced availability of nuclear power in France. Electricity futures prices for delivery in 2022 and 2023 were 38%–264% higher than during the fourth quarter of 2020. Compared with the fourth quarter of 2020 the average spot price for gas was 551% higher, at EUR 94.7/MWh (14.5). The spot price for coal was 195% higher, at USD 174.0/t (59.1). The futures price 2022 for gas was 336% higher, at EUR 63.7/MWh (14.6), and the futures price 2022 for coal was 96% higher, at USD 122.1/t (62.2). The price of CO2 emission allowances was 148% higher, at EUR 68.3/t (27.5). AVERAGE INDICATIVE NORDIC HEDGE PRICES (SE, DK, FI) AS PER 30 DECEMBER 2021, EUR/MWh EUR/MWh 2022 2023 2024 29 28 28 VATTENFALL’S ESTIMATED NORDIC HEDGE RATIO (SE, DK, FI) AS PER 30 DECEMBER 2021 (%) ACHIEVED NORDIC ELECTRICITY PRICES (SE, DK, FI)1 EUR/MWh Full year 2021 Full year 2020 Oct-Dec 2021 Oct-Dec 2020 31 31 35 31 SENSITIVITY ANALYSIS – CONTINENTAL PORTFOLIO (DE, NL, UK)2 +/-10% price impact on future profit before tax, SEK million3 Market- quoted 2022 2023 2024 Observed yearly volatility4 Electricity +/- 1,270 +/- 977 +/- 555 24%-53% Coal -/+ 43 -/+ 42 -/+ 27 39%-51% Gas -/+ 455 -/+ 1,681 -/+ 964 21%-64% CO2 -/+ 78 -/+ 561 -/+ 503 42%-43% 1) Achieved prices from the spot market and hedges. Includes Nordic hydro, nuclear and wind power generation 2) Vattenfall’s continental portfolio is mainly exposed to clean spark spreads. Vattenfall hedges these production margins, which in turn affects reported sensitivity figures for electricity, gas and CO2 emission allowances 3) The denotation +/- entails that a higher price affects operating profit favourably, and -/+ vice versa 4) Observed yearly volatility for daily price movements for each commodity, based on forward contracts. Volatility normally decreases the further ahead in time the contracts pertain to. 0 20 40 60 80 100 120 140 Electricity Gas Heat Full year 2020 Full year 2021 0 10 20 30 40 50 Fossil Nuclear Hydro Wind Biomass, waste Full year 2020 Full year 2021 72 50 23 0 20 40 60 80 2022 2023 2024
  • 4. 4 VATTENFALL YEAR-END REPORT 2021 Net sales January–December: Consolidated net sales increased by SEK 21.3 billion, including negative currency effects of SEK 4.2 billion). The increase is mainly attributable to higher electricity prices and higher sales volumes in the Nordic countries and Germany. October–December: Consolidated net sales increased by SEK 19.5 billion, including negative currency effects of SEK 0.8 billion. The increase is primarily attributable to higher electricity prices in customer sales. Earnings January–December: The underlying operating profit increased by SEK 5.4 billion, which is explained by: • Higher earnings contributions from the Power Generation operating segment (SEK 4.7 billion) primarily as a result of increased nuclear and hydro power generation, higher contributions from pumped storage in Germany thanks to favourable prices and higher realised earnings contribution from the trading business • Higher earnings contributions from the Wind operating segment (SEK +3.9 billion) mainly owing to higher electricity prices in the UK and on the Continent, as well as new capacity, which was offset in part by lower wind speeds • Lower earnings contributions from the Distribution operating segment (SEK -2.2 billion) mainly due to the sale of Stromnetz Berlin as well as lower gross margin in the Swedish operation • Lower earnings contributions from the Heat operating segment (SEK -1.3 billion) attributable to higher prices for gas and CO2 emission allowances, which led to lower clean spark spreads • Other items, net (SEK 0.4 billion) Items affecting comparability amounted to SEK 29.1 billion (-10.5), of which most pertains to compensation for the closure of nuclear power operations in Germany (SEK 12.5 billion), changes in market value for energy derivatives and inventories (SEK 10.0 billion), and the capital gain from the sale of Stromnetz Berlin (SEK 8.4 billion). Profit for the period totalled SEK 48.0 billion (7.7) and was affected by – in addition to items affecting comparability – a higher tax cost and higher net financial items resulting from a higher return from the Swedish Nuclear Waste Fund. October–December: Underlying operating profit increased by SEK1.1 billion. The Wind operating segment contributed positively (SEK 3.0 billion) mainly owing to higher electricity prices and new capacity. The Power Generation operating segment also contributed positively (SEK 1.0 billion), mainly owing to higher achieved prices in the Nordic countries. The Heat and Distribution operating segments contributed negatively (SEK -1.8 billion and SEK -1.0 billion, respectively). Items affecting comparability amounted to SEK -1.3 billion (-2.7), of which most pertains to changes in market value for energy derivatives and inventories (SEK -2.3 billion) and provisions (SEK -1.3 billion) primarily related to nuclear power. Reversed impairment losses (SEK 1.9 billion) had a countering effect. Profit for the period was SEK 6.1 billion (5.7) and was affected by a higher operating profit (EBIT) and higher tax cost. Cash flow January–December: Funds from operations (FFO) increased by SEK 11.1 billion primarily as a result of higher underlying operating profit before depreciation, amortisation and impairment losses (EBITDA). Cash flow from changes in working capital amounted to SEK 54.0 billion. The largest contributing factors were changes related to the net change in margin calls received (SEK 88.0 billion), an increase in inventories (SEK -23.1 billion), an increase in operating receivables in the Customers & Solutions operating segment (SEK -4.4 bn) and CO2 emission allowances (SEK -3.4 billion). October–December: Funds from operations (FFO) increased by SEK 7.2 billion primarily because compensation for the closure of nuclear power operations in Germany was included in the FFO in the fourth quarter. Cash flow from changes in working capital amounted to SEK -14.5 billion, which is mainly explained by an increase in inventories (SEK -19.1 billion) and net changes in margin calls received (SEK 9.2 billion). Events after the balance sheet date • On 27 January 2022, the Swedish government decided to permit a final repository for spent nuclear fuel at Forsmark. KEY FIGURES – GROUP OVERVIEW Full year Full year Oct-Dec Oct-Dec Amounts in SEK million 2021 2020 2021 2020 Net sales 180 119 158 847 63 529 44 032 Operating profit before depreciation, amortisation and impairment losses (EBITDA)1 75 790 46 507 10 226 12 121 Operating profit (EBIT)1 60 271 15 276 7 750 5 246 Underlying operating profit1 31 181 25 790 9 092 7 987 Items affecting comparability1 29 090 - 10 514 - 1 342 - 2 741 Profit for the period 48 013 7 716 6 101 5 727 Funds from operations (FFO)1 46 096 35 024 18 616 11 368 Cash flow from changes in operating assets and operating liabilities (working capital) 54 036 6 668 - 14 486 3 486 Cash flow from operating activities 100 132 41 692 4 130 14 854 1) See Definitions and calculations of key ratios for definitions of Alternative Performance Measures.
  • 5. 5 VATTENFALL YEAR-END REPORT 2021 Capital structure Cash and short-term investments increased by SEK 114.7 billion compared with the level at 31 December 2020. Committed credit facilities consist of a EUR 2.0 billion Revolving Credit Facility that expires in November 2023. As per 31 December 2021 available liquid assets and/or committed credit facilities amounted to 104.3% of net sales. Vattenfall’s target is to maintain a level of no less than 10% of consolidated net sales, but at least the equivalent of the next 90 days’ maturities. Net debt decreased by SEK 92.9 billion to a net asset of SEK 44.7 billion and adjusted net debt decreased by SEK 94.6 to SEK 26.9 billion compared to 31 December 2020. These reductions are mainly attributable to a positive cash flow after investments (SEK 94.2 billion), which is largely explained by the change in working capital (SEK 54.0 billion). Significantly increased electricity and gas prices resulted in higher margin calls received but also an increased credit risk for Vattenfall. The adjusted net debt was also affected by reduced pension provisions (SEK 3.5 billion) and higher provisions for nuclear power (SEK 2.4 billion). Currency effects increased net debt by SEK 1.2 billion. The key ratio FFO/adjusted net debt increased to 171.2%, which is mainly due to the effects of the net change in margin calls received. NET DEBT -60 -30 0 30 60 90 120 -60 000 -30 000 0 30 000 60 000 90 000 120 000 Q3 2020 Q4 2020 Q1 2021 Q2 2021 Q3 2021 Q4 2021 % MSEK Interest-bearing liabilities, MSEK Net debt, MSEK Gross debt/equity, % Net debt/equity, % ADJUSTED NET DEBT 0 50 100 150 200 0 30 000 60 000 90 000 120 000 150 000 Q3 2020 Q4 2020 Q1 2021 Q2 2021 Q3 2021 Q4 2021 % MSEK Adjusted net debt, MSEK FFO/adjusted net debt, % Strategic objectives and targets for 2025 Strategic focus area Targets for 2025 Outcome 2021 Outcome 2020 Driving decarbonisation with our customers & partners 1. Customer engagement, absolute Net Promoter Score (NPS) 1 : +18 +10 +7 Securing a fossil-free energy supply 2. CO2 emissions intensity2 : ≤86 gCO2e/kWh 79 97 Delivering high-performing operations 3. Funds from operations (FFO)/adjusted net debt: 22%–27% 171.2% 28.8% 4. Return On Capital Employed (ROCE), last 12 months: ≥8% 22.2% 5.8% Empowering our people 5. Lost Time Injury Frequency (LTIF)3 : ≤1.0 1.7 1.8 6. Employee Engagement Index4 : ≥75% 75% 74%5 1) Absolute NPS is weighted 80% from Customers & Solutions and 20% from Heat, which corresponds to our customer composition. Reported on an annual basis 2) Includes CO2 and other greenhouse gases, such as N2O and SF6. Consolidated value. The target for 2025 is to be on track to achieving the 1.5°C target by 2030, in accordance with SBT 3) Rolling 12-month values. LTIF (Lost Time Injury Frequency) is expressed in terms of the number of lost time work injuries per 1 million hours worked. The metric pertains only to Vattenfall employees 4) Documentation for measurement of target achievement is derived from the results of an employee survey, which is conducted on an annual basi 5) The value has been adjusted compared with previously published information due to change in methodology.
  • 6. 6 VATTENFALL YEAR-END REPORT 2021 67% 14% 10% 9% Growth capex per technology 2022-2023 Wind power, 23 bn SEK Heat supply, 5 bn SEK Electricity distribution, 3 bn SEK Other, 3 bn SEK Empty 54% 26% 14% 7% Growth capex per country 2022-2023 The Netherlands, 18 bn SEK Denmark, 9 bn SEK Sweden, 5 bn SEK Germany and other, 2 bn SEK 62% 28% 10% Total capex 2022-2023 Growth, 34 bn SEK Maintenance, 16 bn SEK Replacement, 6 bn SEK Empty 34 SEK billion 34 SEK billion 55 SEK billion 1 Investment plan 2022-2023 Vattenfall has decided on an investment plan for 2022-2023 of net SEK 55 billion. Gross investments amount to SEK 77 billion and the difference is attributable to partnership for the wind power project Hollandse Kust Zuid 1-4, assumptions for partnership for the Norfolk projects, as well as assumptions related to income derived from divestment of certain onshore wind and solar projects, which are being developed for sale. The amounts stated below refer to net investments. Growth investments total SEK 34 billion with the largest share, SEK 23 billion, corresponding to 67%, planned to be invested in wind power. Vattenfall will also invest in electricity grids and expansion of district heating operations. Other growth investments include charging infrastructure, solar and battery projects, heating and energy solutions, and the HYBRIT project . 1 Germany (SEK 3 billion) and other (SEK -0.7 billion). Other countries mainly relate to France and the UK, negative value owing to expected income from partnerships and from projects devloped for sale.
  • 7. 7 VATTENFALL YEAR-END REPORT 2021 Operating segments Full year Full year Oct-Dec Oct-Dec Amounts in SEK million 2021 2020 2021 2020 Underlying EBIT Customers & Solutions 2 349 2 146 104 387 Power Generation 19 334 14 670 4 935 3 938 - of which, realised trading result 3 633 2 757 - 473 631 Wind 7 866 3 970 4 676 1 716 Heat - 343 978 - 981 784 Distribution 3 152 5 325 459 1 454 - of which, Distribution Germany 666 1 093 — 268 - of which, Distribution Sweden 2 516 4 225 484 1 177 Other1 - 1 189 - 1 290 - 275 - 397 Eliminations 12 - 9 174 105 Underlying operating profit 31 181 25 790 9 092 7 987 1) “Other” pertains mainly to all Staff functions, including Treasury and Shared Service Centres.
  • 8. 8 VATTENFALL YEAR-END REPORT 2021 Customers & Solutions The Customers & Solutions Business Area is responsible for sales of electricity, gas and energy services in all of Vattenfall’s markets. Increased customer base and continued expansion in e- vehicle charging solutions • The total customer base grew to 10.5 million contracts • New heating pump launched as alternative to gas-fired boilers • Continued expansion of public charging network for electric vehicles Full year: Net sales increased by 23% compared to 2020. Underlying operating profit increased by 9%, mainly owing to customer growth and lower average temperatures in the Netherlands and Germany. Several of our markets had colder weather during the first half of the year. This had a positive effect on sales of electricity, mainly in the Nordic countries, while it contributed to higher sales of gas in the Netherlands and Germany. Compared with year-end 2020, the total customer base grew by 3.7% to 10.5 million contracts. Q4: Net sales increased by 50%, mainly owing to higher electricity prices in the Nordic countries. Underlying operating profit decreased by 73% compared to 2020, mainly due to higher sourcing costs resulting from higher electricity prices and periods with cold weather in the Nordics. Sales of electricity increased as a result of colder weather in the Nordic countries, which was countered by lower volumes in the B2B segment in France. Vattenfall has launched a heat pump system to replace gas-fired boilers in single-family homes. The heat pump is an innovative high temperature heat pump, which avoids large direct investments in changing the heat delivery system (radiators) and large-scale insulation, thereby reducing the cost to move to a gas-free heating system. The first heat pumps are expected to be delivered to customers in the Netherlands in mid-2022; and the solution will later be introduced to other markets with comparable needs and demands. In the Netherlands, Vattenfall has also started a large-scale smart rollout of an EV-charging infrastructure, the first of its kind in Europe. Suitable locations for charging stations were selected in partnership with 68 municipalities and by means of a data- driven model. By 2024 Vattenfall will have installed a total of 8,000 charging points in the provinces of North Brabant and Limburg. In Germany, Vattenfall is continuing its expansion with public charging solutions for electric vehicles. In collaboration with the German pet store chain Das Futterhaus, Vattenfall will install 170 charging points for high-powered charging at close to 70 locations in Germany. Vattenfall will be responsible for planning, construction, and operation of the charging stations. Vattenfall has launched a new app in Germany called Naturate. The app is used to calculate the user’s carbon footprint from travelling, shopping, and heating. Users are given advice on how to reduce their carbon footprint and have the chance to compensate for any remaining emissions. KEY FIGURES – CUSTOMERS & SOLUTIONS Full year Full year Oct-Dec Oct-Dec Amounts in SEK million unless indicated otherwise 2021 2020 2021 2020 Net sales 106 560 86 298 35 822 23 931 External net sales 102 300 84 661 34 109 23 470 Underlying EBITDA 3 230 3 083 317 611 Underlying EBIT 2 349 2 146 104 387 Sales of electricity, TWh 96.1 95.8 25.5 25.7 - of which, private customers 26.8 26.3 7.5 7.3 - of which, resellers 7.9 8.0 2.6 2.6 - of which, business customers 61.4 61.5 15.4 15.8 Sales of gas, TWh 56.0 52.1 16.9 17.6 Number of employees, full-time equivalents 3 213 2 971 3 213 2 971
  • 9. 9 VATTENFALL YEAR-END REPORT 2021 Power Generation Power Generation comprises the Generation and Markets Business Areas. The segment includes Vattenfall’s hydro and nuclear power operations, maintenance services business, and optimisation and trading operations including certain large business customers. The result from hedging of the Group’s net exposure in electricity and fuel is reported in this segment. Higher electricity prices and increased generation volumes • Generation record at Forsmark nuclear power plant • Fourth quarter earnings affected by higher achieved prices in the Nordic countries • Green light from the Swedish government to expand the final repository for short-lived radioactive waste and to permit a final repository for spent nuclear fuel • New partnership with Cargill and Windpark Hanze lowering CO2 emissions in the Netherlands Full-year: Net sales increased by 40%. Underlying operating profit increased by 32%, mainly owing to higher hydro (1.1 TWh) and nuclear (1.0 TWh) power generation, increased contribution from pumped hydro storage operations in Germany given favourable prices as well as higher realised trading result. The achieved price in the Nordic countries were at the same level as in 2020 (EUR 31/MWh), partly affected by large price differences between electricity areas in Sweden. A lower average hedging price was countered by a higher spot price following the recent sharp rise in electricity prices. The combined availability of Vattenfall’s nuclear power plants during the period January–December 2021 was 84.8% (76.4%). Higher availability and higher generation in 2021 compensated for the lower volume attributable to the closure of Ringhals 1 on 31 December 2020. The nuclear power plant Forsmark reached record levels of generation in 2021 with a 25.5 TWh delivered volume. At the end of the fourth quarter, Nordic reservoir levels were at 65% (82%) of capacity, which is 6 percentage points above the normal level. Q4: Net sales increased by 112%. Underlying operating profit increased by 25%, mainly owing to higher achieved price in the Nordic countries. A higher average spot price was partly offset by a lower hedging price. A lower realised trading result had a countering effect. High market volatility has also affected Vattenfall’s credit risk exposure, which is handled within the company’s risk management framework. Through the Markets Business Area and a 15-year supply agreement, Vattenfall will purchase the generated electricity from 78 MW of a new onshore wind farm that is being built by Windpark Hanze in the Netherlands. The global food corporation Cargill, in turn, will purchase 2.9 TWh from Vattenfall through a 10-year corporate power purchase agreement, which will cover more than 90% of Cargill's electricity consumption in the Netherlands. The wind farm is scheduled to be commissioned in 2023 and is estimated to reduce carbon emissions by 350,000 tonnes per year. The Swedish government has approved the application from the Swedish Nuclear Fuel and Waste Management Company (SKB) to expand the final repository for short-lived radioactive waste (SFR) in Forsmark. The facility needs to expand to make room for demolition waste from the Swedish nuclear power plants. After the end of the fourth quarter the Swedish government also decided to permit a final repository for spent nuclear fuel at Forsmark. KEY FIGURES – POWER GENERATION Full year Full year Oct-Dec Oct-Dec Amounts in SEK million unless indicated otherwise 2021 2020 2021 2020 Net sales 126 318 90 133 52 649 24 825 External net sales 40 312 36 597 16 962 9 571 Underlying EBITDA 23 714 18 796 6 073 4 997 Underlying EBIT 19 334 14 670 4 935 3 938 - of which, realised trading result 3 633 2 757 - 473 631 Electricity generation, TWh 81.2 79.0 21.5 21.2 - of which, hydro power 40.8 39.7 10.3 10.4 - of which, nuclear power 40.4 39.3 11.2 10.8 Sales of electricity, TWh 22.2 20.0 5.9 5.3 - of which, resellers 17.5 17.9 2.0 4.7 - of which, business customers 4.7 2.1 3.9 0.6 Sales of gas, TWh 1.1 4.7 0.4 1.3 Number of employees, full-time equivalents 7 260 7 474 7 260 7 474
  • 10. 10 VATTENFALL YEAR-END REPORT 2021 Wind The Wind Business Area is responsible for development, construction and operation of Vattenfall’s wind farms as well as large-scale and decentralised solar power and batteries. Earnings lifted by higher electricity prices and new capacity • Final investment decision for Vesterhav Syd and Nord offshore wind farms in Denmark • Planning consent granted for the offshore wind farm Norfolk Boreas in the UK Full year: Net sales increased by 54% compared to 2020. Underlying operating profit increased by 98% as a result of higher electricity prices, especially in the UK, and new capacity mainly attributable to the Princess Ariane onshore wind farm in the Netherlands and the Kriegers Flak offshore wind farm in Denmark. Earnings were also affected positively by divestment of onshore wind farms like Grönhult in Sweden and part of Princess Ariane in the Netherlands. Lower wind speeds and lower offshore availability due to increased maintenance work had a negative impact compared to the previous year. Electricity generation increased by 3% as a result of higher generation from new capacity, which was countered in part by lower generation from existing assets. Q4: Net sales increased by 159%. Underlying operating profit increased by 172% owing to higher electricity prices and new capacity, which were partly offset by lower wind speeds. Electricity generation increased by 26% as a result of new capacity, mainly from the Princess Ariane onshore wind farm in the Netherlands and the Kriegers Flak offshore wind farm in Denmark, which was partly offset by lower wind speeds, especially in the Netherlands In December, Vattenfall made the final investment decision for the Vesterhav Syd and Nord offshore wind farms in Denmark. The wind farms are slated for completion in 2023 and will have a combined capacity of 344 MW, corresponding to the annual electricity consumption of 350,000 Danish households. The total investment amounts to EUR 769 million and this is Vattenfall’s third-largest project in offshore wind in Denmark, having previously completed the wind farms Kriegers Flak and Horns Rev 3. The UK government has awarded planning consent for Vattenfall’s offshore wind farm Norfolk Boreas. The wind farm is expected to begin generating electricity in the mid-2020s and to have a capacity of 1.8 GW, corresponding to the annual electricity consumption of 2 million British households. In the Netherlands, the insurance company a.s.r. will purchase a portion of Vattenfall's onshore wind farm Princess Ariane. This means that a.s.r. will own 32 of 82 turbines, which corresponds to a capacity of 118 MW. Vattenfall will remain responsible for maintaining the turbines and will purchase the generated electricity. In October, Vattenfall completed a transaction to sell eight of its wind and solar power assets to European Energy. The assets are situated in Denmark, Germany, the Netherlands, and the United Kingdom, and have a total capacity of 85.8 MW. They include already commissioned plants as well as solar power projects in development. The sale enables Vattenfall to optimise its onshore fleet by reducing the range of turbine models and it provides for greater technological standardisation. Vattenfall will continue to grow in onshore wind power and currently has in excess of 1 GW under construction. Vattenfall is also expanding in solar power and batteries. In the Netherlands, the solar farm Kooypunt (13 MW) started supplying electricity; and Vattenfall was awarded a tender for a solar farm of 17 MW in Almere to be built without government subsidies. Construction has also started on a battery with a 20 MW (46 MWh) capacity at the onshore wind farm Ray in the United Kingdom. KEY FIGURES – WIND Full year Full year Oct-Dec Oct-Dec Amounts in SEK million unless indicated otherwise 2021 2020 2021 2020 Net sales 20 872 13 565 10 256 3 959 External net sales 7 791 6 901 4 150 2 047 Underlying EBITDA 13 451 9 426 6 118 2 982 Underlying EBIT 7 866 3 970 4 676 1 716 Electricity generation - wind power TWh 11.1 10.8 3.9 3.1 Sales of electricity, TWh 1.0 1.2 0.4 0.4 Number of employees, full-time equivalents 1 279 1 104 1 279 1 104
  • 11. 11 VATTENFALL YEAR-END REPORT 2021 Heat The Heat Business Area comprises Vattenfall’s heat business (district heating and decentralised solutions) and gas-fired condensing plants. Lower clean spark spreads • Earnings negatively affected by lower clean spark spreads for operations in Berlin • New partnerships for increased integration of district heating • Connection of district heating networks in Amsterdam completed Full year: Net sales increased by 49% compared with 2020. Underlying operating profit decreased by 135% compared with 2020 mainly owing to higher gas and CO2 prices which led to lower clean spark spreads largely affecting the heat operations in Berlin. The end of commercial operation of the Moorburg power plant in December 2020 had a positive effect on underlying operating profit by SEK 1.1 billion, mainly driven by lower operating costs and lower depreciation. Sales of heat increased as a result of lower temperatures and a growing customer base, which also had a positive effect. Compared with year-end 2020, the number of customers increased by 2.0% to the equivalent of 1.8 million households. Q4: Net sales increased by 108% compared with the fourth quarter of 2020. Underlying operating profit decreased by 225% compared with the same period a year ago, owing to higher gas and CO2 prices, which led to lower clean spark spreads mainly affecting the heat operations in Berlin. This was partly countered by lower operating costs and lower depreciation, largely associated with the end of commercial operation of Moorburg in December 2020. In Sweden, Vattenfall entered into new partnerships that will facilitate the integration of district heating. Vattenfall has expanded its partnership with AstaReal by signing an energy contract for reclaiming excess heat from algae cultivation. It is estimated that the heating needs for 2,500 new apartments in Gustavsberg will be met through this partnership. Vattenfall has also signed contracts with Oxelö Energi to connect the district heating network in Oxelösund to Vattenfall’s combined heat- and-power plant in Nyköping. The new biofuel-based district heating supply is estimated to be brought online in 2025 once the waste-heat supply from SSAB ends. An auxiliary heat plant with a heat-buffer opened in October as the final link in the Amsterdam South Connection project. The project links the district heating in the south-eastern and north- western parts of Amsterdam and provides opportunities for connecting more sustainable district heating. In turn, this represents a major step towards the goal of connecting up to 290,000 homes to district heating by 2040. Vattenfall continues to develop innovative heating solutions that contribute to higher energy efficiency and lower CO2 emissions. In the Dutch city of Nijmegen, Vattenfall and BPD (Bouwfonds Property Development) have signed a contract to build a local storage solution for heating and cooling combined with district heating. In 2024, approximately 300 newly built homes will be supplied with heat, hot water, and cooling. A new heat pump system has been entered into service on a separate heating network in north-eastern Berlin. This system has the capacity to reclaim excess heat from heat production and has the potential to save 5,000 MWh in heat from the burning of natural gas, which represents the consumption of about 220 single-family homes. KEY FIGURES – HEAT Full year Full year Oct-Dec Oct-Dec Amounts in SEK million unless indicated otherwise 2021 2020 2021 2020 Net sales 34 759 23 328 15 119 7 279 External net sales 14 655 13 538 4 819 4 165 Underlying EBITDA 2 590 4 462 - 237 1 581 Underlying EBIT - 343 978 - 981 784 Electricity generation - TWh 19.0 23.0 5.1 6.2 - of which, fossil-based power 18.6 22.7 5.0 6.1 - of which, biomass, waste 0.3 0.3 0.1 0.1 Sales of electricity business customers, TWh 1.2 1.2 0.3 0.3 Sales of heat, TWh 15.6 13.8 5.1 4.5 Number of employees, full-time equivalents 3 126 3 213 3 126 3 213
  • 12. 12 VATTENFALL YEAR-END REPORT 2021 Distribution The Distribution Business Area comprises Vattenfall’s electricity distribution operations in Sweden as well as operations in the UK focused on owning and operating new networks Lower earnings as a result of price reductions and higher costs for the transmission network • The Administrative Court of Appeal in Jönköping has granted leave to appeal in proceeding related to the revenue frames for 2020–2023 for the distribution system operators • Markets for flexibility reduce capacity shortages on the electricity grid during the winter season • High inflow of connection requests and continued large investments in the electricity grid Full-year: Net sales decreased by 20%, and underlying operating profit decreased by 41% compared to 2020. The sale of Stromnetz Berlin on 1 July 2021 affected the net sales comparison by SEK 4.8 billion and the underlying operating profit negatively by SEK 0.6 billion. In addition, underlying operating profit was affected by a lower gross margin in the Swedish operations, mainly owing to price reductions in the local grid, higher costs for the transmission network as well as an increase in network losses caused by higher electricity prices. This was partly countered by higher distributed volume in connection with colder weather. Q4: Net sales decreased by 43% compared to 2020, and underlying operating profit decreased by 68%. The sale of Stromnetz Berlin affected the net sales comparison by SEK 2.4 billion and underlying operating profit negatively by SEK 0.3 billion. In addition, the underlying operating profit was affected by a lower gross margin in the Swedish operations, mainly owing to higher costs for the transmission network, an increase in network losses caused by higher electricity prices and price reductions in the local grid. This was partly offset by higher distributed volume as a result of colder weather. In the spring of 2021, the Linköping Administrative Court of Appeal announced the verdict about the 2020-2023 revenue frames for the distribution system operators. The Swedish Energy Markets Inspectorate (Energimarknadsinspektionen) appealed the decision, and at the end of November the Jönköping Administrative Court of Appeal accepted the 120 cases for review. There has been a continued high inflow of connection requests to the electricity grid, and Vattenfall has invested extensively in both regional and local grids. In total, SEK 4.9 billion was invested in Sweden in 2021. The need for major investments in the electricity grid also means that there is an increased need for continued recruitment. As part of a long-term investment in competence and to broaden its skill base, Vattenfall has started a programme for newly graduated academics. Protracted licensing processes for building electricity grids continue to present a major challenge for the energy transition in Sweden. As the electricity grid is developed and strengthened, Vattenfall is working on various solutions to contribute to reducing capacity shortages across the grid. There is a local market for output flexibility in Uppsala within the framework of the EU-funded project CoordiNet where 18 local flexible resources and 400 houses contribute to a more efficient energy system. A corresponding market is available in the Stockholm region, sthlmflex, where 2,100 electricity users and suppliers are participating with, among other things, electric vehicle chargers, and heating of housing and major properties. The electrification of the transport sector continues and the electricity grid is a central prerequisite for the needed charging infrastructure. To enable accelerated connections to the electricity grid, Vattenfall has started a research and development project called FlexConnect in Riksgränsen. The project will test and evaluate flexible connection technology for electric vehicle fast chargers when the electricity grid does not have sufficient capacity available. KEY FIGURES – DISTRIBUTION Full year Full year Oct-Dec Oct-Dec Amounts in SEK million unless indicated otherwise 2021 2020 2021 2020 Net sales 17 262 21 644 3 429 5 982 External net sales 14 643 16 970 3 306 4 736 Underlying EBITDA 5 913 8 725 1 102 2 328 Underlying EBIT 3 152 5 325 459 1 454 Number of employees, full-time equivalents 1 165 2 366 1 165 2 366
  • 13. 13 VATTENFALL YEAR-END REPORT 2021 Other Other pertains mainly to all Staff functions, including Treasury and Shared Service Centres. Net sales consist primarily of revenues attributable to Vattenfall’s service organisations such as Shared Services, IT and Vattenfall Insurance. KEY FIGURES – OTHER Full year Full year Oct-Dec Oct-Dec Amounts in SEK million unless indicated otherwise 2021 2020 2021 2020 Net sales 6 169 5 917 1 714 1 662 External net sales 418 180 183 43 Underlying EBITDA - 326 - 442 - 95 - 189 Underlying EBIT - 1 189 - 1 290 - 275 - 397 Number of employees, full-time equivalents 2 792 2 731 2 792 2 731
  • 14. 14 VATTENFALL YEAR-END REPORT 2021 Consolidated income statement Full year Full year Oct-Dec Oct-Dec Amounts in SEK million 2021 2020 2021 2020 Net sales 180 119 158 847 63 529 44 032 Cost of purchases - 87 474 - 76 225 - 43 072 - 20 243 Other external expenses - 18 450 - 20 732 - 5 064 - 8 107 Personnel expenses - 19 801 - 19 535 - 4 993 - 4 787 Other operating income and expenses, net 21 454 3 882 - 159 1 078 Participations in the results of associated companies - 58 270 - 15 148 Operating profit before depreciation, amortisation and impairment losses (EBITDA) 75 790 46 507 10 226 12 121 Depreciation, amortisation and impairments - 15 519 - 31 231 - 2 476 - 6 875 Operating profit (EBIT) 60 271 15 276 7 750 5 246 Financial income3 783 558 110 76 Financial expenses1,2,3 - 5 906 - 5 886 - 1 599 - 1 402 Return from the Swedish Nuclear Waste Fund 4 225 2 058 895 633 Profit before income taxes 59 373 12 006 7 156 4 553 Income taxes - 11 360 - 4 290 - 1 055 1 174 Profit for the period 48 013 7 716 6 101 5 727 Attributable to owner of the Parent Company 46 828 6 489 5 774 5 132 Attributable to non-controlling interests 1 185 1 227 327 595 Supplementary information Underlying EBITDA4 48 584 44 041 13 452 12 415 Underlying EBIT4 31 181 25 790 9 092 7 987 Financial items, net excl. discounting effects attributable to provisions and return from the Swedish Nuclear Waste Fund - 3 090 - 3 163 - 983 - 773 1) Including interest components related to pension costs - 439 - 538 - 110 - 132 2) Including discounting effects attributable to provisions - 2 033 - 2 165 - 506 - 553 3) Items affecting comparability recognised as financial income and expenses, net - 6 - 1 — - 1 4) See note 5 for information on items affecting comparability
  • 15. 15 VATTENFALL YEAR-END REPORT 2021 Consolidated statement of comprehensive income Full year Full year Oct-Dec Oct-Dec Amounts in SEK million 2021 2020 2021 2020 Profit for the period 48 013 7 716 6 101 5 727 Other comprehensive income Items that will be reclassified to profit or loss when specific conditions are met Cash flow hedges - changes in fair value 82 259 3 023 20 435 3 287 Cash flow hedges - dissolved against income statement - 31 553 4 310 - 22 878 267 Cash flow hedges - transferred to cost of hedged item 16 - 43 5 12 Hedging of net investments in foreign operations - 1 414 1 808 - 437 1 864 Translation differences, divested companies 697 - 5 8 — Translation differences 3 218 - 4 084 1 348 - 4 251 Income taxes related to items that will be reclassified - 15 420 - 2 587 927 - 1 676 Total items that will be reclassified to profit or loss when specific conditions are met 37 803 2 422 - 592 - 497 Items that will not be reclassified to profit or loss Remeasurement pertaining to defined benefit obligations - 670 - 1 505 - 1 096 - 2 224 Income taxes related to items that will not be reclassified 226 392 231 667 Total items that will not be reclassified to profit or loss - 444 - 1 113 - 865 - 1 557 Total other comprehensive income, net after income taxes 37 359 1 309 - 1 457 - 2 054 Total comprehensive income for the period 85 372 9 025 4 644 3 673 Attributable to owner of the Parent Company 83 915 8 260 4 188 3 563 Attributable to non-controlling interests 1 457 765 456 110
  • 16. 16 VATTENFALL YEAR-END REPORT 2021 Operating segments, Vattenfall Group Full year Full year Oct-Dec Oct-Dec Amounts in SEK million 2021 2020 2021 2020 External net sales Customers & Solutions 102 300 84 661 34 109 23 470 Power Generation 40 312 36 597 16 962 9 571 Wind 7 791 6 901 4 150 2 047 Heat 14 655 13 538 4 819 4 165 Distribution 14 643 16 970 3 306 4 736 - of which, Distribution Germany 3 203 5 464 1 1 339 - of which, Distribution Sweden 11 310 11 377 3 269 3 358 Other1 418 180 183 43 Total 180 119 158 847 63 529 44 032 Internal net sales Customers & Solutions 4 260 1 637 1 713 461 Power Generation 86 006 53 536 35 687 15 254 Wind 13 081 6 664 6 106 1 912 Heat 20 104 9 790 10 300 3 114 Distribution 2 619 4 674 123 1 246 - of which, Distribution Germany 2 061 4 107 1 1 110 - of which, Distribution Sweden 586 597 137 142 Other1 5 751 5 737 1 531 1 619 Eliminations - 131 821 - 82 038 - 55 460 - 23 606 Total — — — — Total net sales Customers & Solutions 106 560 86 298 35 822 23 931 Power Generation 126 318 90 133 52 649 24 825 Wind 20 872 13 565 10 256 3 959 Heat 34 759 23 328 15 119 7 279 Distribution 17 262 21 644 3 429 5 982 - of which, Distribution Germany 5 264 9 571 2 2 449 - of which, Distribution Sweden 11 896 11 974 3 406 3 500 Other1 6 169 5 917 1 714 1 662 Eliminations - 131 821 - 82 038 - 55 460 - 23 606 Total 180 119 158 847 63 529 44 032
  • 17. 17 VATTENFALL YEAR-END REPORT 2021 Full year Full year Oct-Dec Oct-Dec Amounts in SEK million 2021 2020 2021 2020 Operating profit before depreciation, amortisation and impairment losses (EBITDA) Customers & Solutions 3 241 2 832 318 456 Power Generation 42 053 23 144 2 607 6 580 Wind 13 534 9 482 6 126 3 045 Heat 2 842 2 644 - 12 - 187 Distribution 5 911 8 713 1 101 2 326 - of which, Distribution Germany 1 008 2 162 — 539 - of which, Distribution Sweden 4 873 6 505 1 109 1 766 Other1 8 197 - 299 - 88 - 204 Eliminations 12 - 9 174 105 Total 75 790 46 507 10 226 12 121 Underlying EBITDA Customers & Solutions 3 230 3 083 317 611 Power Generation 23 714 18 796 6 073 4 997 Wind 13 451 9 426 6 118 2 982 Heat 2 590 4 462 - 237 1 581 Distribution 5 913 8 725 1 102 2 328 - of which, Distribution Germany 1 009 2 174 — 542 - of which, Distribution Sweden 4 874 6 505 1 110 1 766 Other1 - 326 - 442 - 95 - 189 Eliminations 12 - 9 174 105 Total 48 584 44 041 13 452 12 415 Full year Full year Oct-Dec Oct-Dec Amounts in SEK million 2021 2020 2021 2020 Operating profit (EBIT) Customers & Solutions 2 446 1 882 191 231 Power Generation 39 502 18 984 3 299 5 490 Wind 7 919 2 401 4 654 1 639 Heat - 91 - 12 149 - 756 - 3 257 Distribution 3 150 5 313 458 1 452 - of which, Distribution Germany 665 1 081 — 266 - of which, Distribution Sweden 2 515 4 225 483 1 177 Other1 7 333 - 1 146 - 270 - 414 Eliminations 12 - 9 174 105 Operating profit (EBIT) 60 271 15 276 7 750 5 246 Operating profit (EBIT) 60 271 15 276 7 750 5 246 Financial net - 898 - 3 270 - 594 - 693 Profit before tax 59 373 12 006 7 156 4 553 Underlying EBIT Customers & Solutions 2 349 2 146 104 387 Power Generation 19 334 14 670 4 935 3 938 Wind 7 866 3 970 4 676 1 716 Heat - 343 978 - 981 784 Distribution 3 152 5 325 459 1 454 - of which, Distribution Germany 666 1 093 — 268 - of which, Distribution Sweden 2 516 4 225 484 1 177 Other1 - 1 189 - 1 290 - 275 - 397 Eliminations 12 - 9 174 105 Underlying EBIT 31 181 25 790 9 092 7 987 1) “Other” pertains mainly to all Staff functions, including Treasury, Shared Service Centres and material capital gains and -losses.
  • 18. 18 VATTENFALL YEAR-END REPORT 2021 Consolidated balance sheet 31 Dec 31 Dec Amounts in SEK million 2021 2020 Assets Non-current assets Intangible assets: non-current 17 070 16 524 Property, plant and equipment 252 828 249 120 Participations in associated companies and joint arrangements 6 110 4 347 Other shares and participations 313 304 Share in the Swedish Nuclear Waste Fund 52 772 48 270 Derivative assets 35 240 9 449 Deferred tax assets 8 905 13 824 Other non-current receivables 6 118 5 529 Total non-current assets 379 356 347 367 Current assets Inventories 41 539 16 828 Intangible assets: current 4 861 192 Trade receivables and other receivables 41 219 23 812 Contract assets 375 416 Advance payments paid 8 362 1 046 Derivative assets 120 645 9 962 Prepaid expenses and accrued income 12 402 6 935 Current tax assets 2 717 280 Short-term investments 102 706 30 148 Cash and cash equivalents 68 176 26 074 Assets held for sale — 188 Total current assets 403 002 115 881 Total assets 782 358 463 248 Equity and liabilities Equity Attributable to owner of the Parent Company 180 710 97 724 Attributable to non-controlling interests 16 472 13 468 Total equity 197 182 111 192 Non-current liabilities Hybrid Capital 20 421 19 304 Other interest-bearing liabilities 50 839 49 091 Pension provisions 40 328 43 824 Other interest-bearing provisions 116 637 108 665 Derivative liabilities 30 307 7 924 Deferred tax liabilities 33 913 17 617 Contract liabilities 8 635 8 752 Other noninterest-bearing liabilities 2 018 1 994 Total non-current liabilities 303 098 257 171 Current liabilities Trade payables and other liabilities 39 241 24 912 Advance payments received 62 790 5 794 Derivative liabilities 99 511 8 901 Accrued expenses and deferred income 18 460 14 558 Current tax liabilities 2 418 838 Other interest-bearing liabilities 55 148 36 380 Interest-bearing provisions 4 510 3 462 Liabilities associated with assets held for sale — 40 Total current liabilities 282 078 94 885 Total equity and liabilities 782 358 463 248
  • 19. 19 VATTENFALL YEAR-END REPORT 2021 SUPPLEMENTARY INFORMATION 31 Dec 31 Dec Amounts in SEK million 2021 2020 Calculation of capital employed Intangible assets: current and non-current 21 931 16 716 Property, plant and equipment 252 828 249 120 Participations in associated companies and joint arrangements 6 110 4 347 Deferred and current tax assets 11 622 14 104 Non-current noninterest-bearing receivables 3 563 3 853 Contract assets 375 416 Inventories 41 539 16 828 Trade receivables and other receivables 41 219 23 812 Prepaid expenses and accrued income 12 402 6 935 Unavailable liquidity 3 446 5 374 Other 643 483 Total assets excl. financial assets 395 678 341 988 Deferred and current tax liabilities - 36 331 - 18 455 Other noninterest-bearing liabilities - 2 018 - 1 994 Contract liabilities - 8 635 - 8 752 Trade payable and other liabilities - 39 241 - 24 912 Accrued expenses and deferred income - 18 460 - 14 558 Other - 899 - 232 Total noninterest-bearing liabilities - 105 584 - 68 903 Other interest-bearing provisions not related to adjusted net debt1 - 9 213 - 10 619 Capital employed2 280 881 262 466 Capital employed, average 271 674 265 639 Calculation of net debt Hybrid Capital - 20 421 - 19 304 Bond issues and liabilities to credit institutions - 37 732 - 49 642 Short-term debt, commercial papers and repo - 46 189 - 13 268 Liabilities to associated companies - 1 452 - 688 Liabilities to owners of non-controlling interests - 10 747 - 10 931 Other liabilities - 9 867 - 10 942 Total interest-bearing liabilities - 126 408 - 104 775 Cash and cash equivalents 68 176 26 074 Short-term investments 102 706 30 148 Loans to owners of non-controlling interests in foreign Group companies 229 375 Net debt2 44 703 - 48 178 Calculation of adjusted gross debt and net debt Total interest-bearing liabilities - 126 408 - 104 775 50% of Hybrid Capital3 10 211 9 652 Present value of pension obligations - 40 328 - 43 824 Provisions for gas and wind operations and other environment-related provisions - 11 687 - 10 599 Provisions for nuclear power (net)4 - 40 233 - 37 794 Margin calls received 3 340 4 081 Liabilities to owners of non-controlling interests due to consortium agreements 10 747 10 931 Adjusted gross debt - 194 359 - 172 328 Reported cash and cash equivalents and short-term investments 170 882 56 222 Unavailable liquidity - 3 446 - 5 374 Adjusted cash and cash equivalents and short-term investments 167 436 50 848 Adjusted net debt2 - 26 923 - 121 480 1) Includes personnel-related provisions for non-pension purposes, provisions for tax and legal disputes and certain other provisions. 2) See Definitions and calculations of key ratios for definitions of Alternative Performance Measures. 3) 50% of Hybrid Capital is treated as equity by the rating agencies, which thereby reduces adjusted net debt. 4) The calculation is based on Vattenfall’s share of ownership in the respective nuclear power plants, less Vattenfall’s share in the Swedish Nuclear Waste Fund and liabilities to associated companies. Vattenfall has the following ownership interests in the respective plants: Forsmark 66%, Ringhals 70.4%, Brokdorf 20%, Brunsbüttel 66.7%, Krümmel 50% and Stade 33.3%. (According to a special agreement, Vattenfall is responsible for 100% of the provisions for Ringhals.)
  • 20. 20 VATTENFALL YEAR-END REPORT 2021 Consolidated statement of cash flows Full year Full year Oct-Dec Oct-Dec Amounts in SEK million 2021 2020 2021 2020 Operating activities Operating profit before depreciation, amortisation and impairment losses (EBITDA) 75 790 46 507 10 226 12 121 Tax paid - 6 725 - 2 719 - 4 005 - 420 Capital gains/losses, net - 8 760 - 62 - 124 102 Interest received 523 183 170 72 Interest paid - 3 226 - 2 808 - 655 - 420 Other, incl. non-cash items - 11 506 - 6 077 13 004 - 87 Funds from operations (FFO) 46 096 35 024 18 616 11 368 Changes in inventories - 23 067 - 1 315 - 19 112 - 2 584 Changes in operating receivables - 31 816 - 1 344 - 20 261 - 6 094 Changes in operating liabilities 25 491 - 3 726 18 091 2 742 Margin calls 88 036 12 588 9 166 9 238 Other changes - 4 608 465 - 2 370 184 Cash flow from changes in operating assets and operating liabilities 54 036 6 668 - 14 486 3 486 Cash flow from operating activities 100 132 41 692 4 130 14 854 Investing activities Acquisitions in Group companies - 122 - 86 - 67 - 19 Investments in associated companies and other shares and participations - 278 223 - 101 78 Other investments in non-current assets - 25 157 - 21 484 - 7 585 - 5 710 Total investments - 25 557 - 21 347 - 7 753 - 5 651 Divestments 22 060 1 237 330 557 Changes in short-term investments1 - 71 351 - 8 926 - 38 228 - 2 659 Cash and cash equivalents in acquired companies 8 20 8 20 Cash and cash equivalents in divested companies - 2 481 - 80 - 47 4 Cash flow from investing activities - 77 321 - 29 096 - 45 690 - 7 729 Cash flow before financing activities 22 811 12 596 - 41 560 7 125 Financing activities Changes in loans to owners of non-controlling interests in foreign Group companies 153 - 185 101 57 Loans raised2 51 150 21 471 44 615 545 Amortisation of debt pertaining to acquisitions of Group companies — - 27 — — Amortisation of other debt - 35 870 - 12 156 - 3 738 - 1 057 Divestment of shares in Group companies to owners of non-controlling interests 4 025 — 9 — Redemption of Hybrid Capital - 2 941 — — — Issue of Hybrid Capital 6 481 — — — Dividends paid to owners - 5 190 - 5 298 - 1 - 275 Contribution to/from owners of non-controlling interests 1 185 - 829 869 - 364 Cash flow from financing activities 18 993 2 976 41 855 - 1 094 Cash flow for the period 41 804 15 572 295 6 031 Full year Full year Oct-Dec Oct-Dec Amounts in SEK million 2021 2020 2021 2020 Cash and cash equivalents Cash and cash equivalents at start of period 26 074 10 604 67 644 20 180 Cash flow for the period 41 804 15 572 295 6 031 Translation differences 298 - 102 237 - 137 Cash and cash equivalents at end of period 68 176 26 074 68 176 26 074
  • 21. 21 VATTENFALL YEAR-END REPORT 2021 SUPPLEMENTARY INFORMATION Full year Full year Oct-Dec Oct-Dec Amounts in SEK million 2021 2020 2021 2020 Cash flow before financing activities 22 811 12 596 - 41 560 7 125 Changes in short-term investments 71 351 8 926 38 228 2 659 Financing activities Divestment of shares in Group companies to owners of non-controlling interests 4 025 — 9 — Dividends paid to owners - 5 190 - 5 298 - 1 - 275 Contribution to/from owners of non-controlling interests 1 185 - 829 869 - 364 Cash flow after dividend 94 182 15 395 - 2 455 9 145 Analysis of change in net debt Net debt at start of period - 48 178 - 64 266 47 348 - 58 858 Cash flow after dividend 94 182 15 395 - 2 455 9 145 Changes as a result of valuation at fair value 660 - 171 - 143 141 Changes in interest-bearing liabilities for leasing - 1 442 - 2 837 - 444 - 1 712 Interest-bearing liabilities/short-term investments acquired/divested - 13 24 - 10 — Translation differences on net debt - 506 3 677 407 3 106 Net debt at end of period 44 703 - 48 178 44 703 - 48 178 Cash flow from operating activities 100 132 41 692 4 130 14 854 Maintenance/replacement investments - 11 012 - 12 539 - 3 796 - 4 655 Free cash flow3 89 120 29 153 334 10 199 1) Change from Financing activities to Investing activities 2) Short-term borrowings in which the duration is three months or shorter are reported net 3) See Definitions and calculations of key ratios for definitions of Alternative Performance Measures.
  • 22. 22 VATTENFALL YEAR-END REPORT 2021 INVESTMENTS Full year Full year Oct-Dec Oct-Dec Amounts in SEK million 2021 2020 2021 2020 Electricity generation Hydro power 795 920 314 349 Nuclear power 1 263 1 877 420 499 Coal power — 22 — 15 Gas 64 192 20 33 Wind power and solar PV 11 157 7 709 1 975 2 568 Biomass, waste 73 295 3 71 Total electricity generation 13 352 11 015 2 732 3 535 CHP/heat Fossil-based power 1 053 1 261 537 396 Heat networks 1 511 1 400 610 598 Other 483 933 322 418 Total CHP/heat 3 047 3 594 1 469 1 412 Electricity networks Electricity networks 5 758 7 435 1 919 2 511 Total electricity networks 5 758 7 435 1 919 2 511 Purchases of shares, shareholder contributions 400 - 137 168 - 59 Other 1 557 1 690 573 512 Total investments 24 114 23 597 6 861 7 911 Accrued investments, unpaid invoices (-)/ release of accrued investments (+) 1 443 - 2 250 892 - 2 260 Total investments with cash flow effect 25 557 21 347 7 753 5 651
  • 23. 23 VATTENFALL YEAR-END REPORT 2021 Consolidated statement of changes in equity 31 Dec 2021 31 Dec 2020 Amounts in SEK million Attributable to owner of the Parent Company Attributable to non- controlling interests Total equity Attributable to owner of the Parent Company Attributable to non- controlling interests Total equity Balance brought forward 97 724 13 468 111 192 93 631 14 891 108 522 Profit for the period 46 828 1 185 48 013 6 489 1 227 7 716 Cash flow hedges - changes in fair value 82 259 — 82 259 3 023 — 3 023 Cash flow hedges - dissolved against income statement - 31 569 16 - 31 553 4 344 - 34 4 310 Cash flow hedges - transferred to cost of hedged item 16 — 16 - 43 — - 43 Hedging of net investments in foreign operations - 1 414 — - 1 414 1 808 — 1 808 Translation differences, divested companies 697 — 697 - 5 — - 5 Translation differences 2 983 235 3 218 - 3 684 - 400 - 4 084 Remeasurement pertaining to defined benefit obligations - 700 30 - 670 - 1 465 - 40 - 1 505 Income taxes related to other comprehensive income - 15 185 - 9 - 15 194 - 2 207 12 - 2 195 Total other comprehensive income for the period 37 087 272 37 359 1 771 - 462 1 309 Total comprehensive income for the period 83 915 1 457 85 372 8 260 765 9 025 Dividends paid to owners - 4 000 - 1 190 - 5 190 - 3 623 - 1 675 - 5 298 Group contributions from(+)/to(-) owners of non-controlling interests — 51 51 — - 1 - 1 Changes in ownership in Group companies on divestments of shares to owners of non-controlling interests 2 538 1 508 4 046 — — — Contribution to/from owners of non-controlling interests — 1 185 1 185 — - 829 - 829 Changes as a result of changed ownership — — — — - 227 - 227 Other changes 533 - 7 526 - 544 544 — Total transactions with equity holders - 929 1 547 618 - 4 167 - 2 188 - 6 355 Balance carried forward 180 710 16 472 197 182 97 724 13 468 111 192 - Of which, Reserve for hedges 36 968 8 36 976 1 970 - 5 1 965
  • 24. 24 VATTENFALL YEAR-END REPORT 2021 Key ratios, Vattenfall Group Full year Full year Oct-Dec Oct-Dec In % unless otherwise stated. (x) means times1 2021 2020 2021 2020 Operating margin 33.5 9.6 12.2 11.9 Operating margin2 17.3 16.2 14.3 18.1 Pre-tax profit margin 33.0 7.6 11.3 10.3 Pre-tax profit margin2 16.8 14.2 13.4 16.6 Return on equity 36.9 6.7 36.93 6.73 Return on capital employed 22.2 5.8 22.23 5.83 Return on capital employed2 11.5 9.7 11.53 9.73 EBIT interest cover, (x) 16.2 4.3 16.23 4.33 EBIT interest cover, (x)2 8.5 7.1 8.53 7.13 FFO interest cover, (x) 13.3 10.4 13.33 10.43 FFO interest cover, net, (x) 15.9 12.1 15.93 12.13 Cash flow interest cover after maintenance investments, (x) 27.9 10.2 27.93 10.23 FFO/gross debt 36.5 33.4 36.53 33.43 FFO/net debt - 103.1 72.7 - 103.13 72.73 FFO/adjusted net debt 171.2 28.8 171.23 28.83 EBITDA/net financial items, (x) 24.5 14.7 10.4 15.7 EBITDA/net financial items, (x)2 15.7 13.9 13.7 16.1 Equity/Total assets 25.2 24.0 25.2 24.0 Gross debt/equity 64.1 94.2 64.1 94.2 Net debt/equity - 22.7 43.3 - 22.7 43.3 Gross debt/gross debt plus equity 39.1 48.5 39.1 48.5 Net debt/net debt plus equity - 29.3 30.2 - 29.3 30.2 Net debt/EBITDA, (x) - 0.6 1.0 - 0.63 1.03 Adjusted net debt/EBITDA, (x) 0.4 2.6 0.43 2.63 1) See Definitions and calculations of key ratios for definitions of Alternative Performance Measures. 2) Based on Underlying operating profit. 3) Last 12-month values.
  • 25. 25 VATTENFALL YEAR-END REPORT 2021 Quarterly information, Vattenfall Group Q4 Q3 Q2 Q1 Q4 Q3 Q2 Q1 Amounts in SEK million 2021 2021 2021 2021 2020 2020 2020 2020 Income statement Net sales 63 529 36 125 34 554 45 911 44 032 35 375 31 280 48 160 Operating profit before depreciation, amortisation and impairment losses (EBITDA) 10 226 27 293 20 531 17 740 12 121 9 235 8 251 16 900 Underlying EBITDA 13 452 9 149 9 577 16 408 12 415 9 378 7 471 14 773 Operating profit (EBIT) 7 750 22 926 16 210 13 385 5 246 4 743 - 7 027 12 313 Underlying EBIT 9 092 4 782 5 256 12 053 7 987 4 818 2 792 10 187 Profit before income taxes 7 156 567 16 778 13 257 4 553 4 525 - 5 969 8 895 Profit for the period 6 101 18 277 13 212 10 423 5 727 3 583 - 8 495 6 900 - of which, attributable to owner of the Parent Company 5 774 18 178 13 002 9 875 5 132 3 595 - 8 826 6 587 - of which, attributable to non-controlling interests 327 99 210 548 595 - 12 331 313 Balance sheet Capital employed 280 881 255 184 280 855 271 110 262 466 260 921 266 641 287 567 Net debt 44 703 47 348 - 32 328 - 43 865 - 48 178 - 58 858 - 71 613 - 81 579 Cash flow Funds from operations (FFO) 18 616 6 054 7 439 13 987 11 368 7 000 4 420 12 235 Cash flow from operating activities 4 130 60 836 24 041 11 124 14 854 19 447 15 924 - 8 533 Cash flow from investing activities - 45 690 - 14 851 - 12 858 - 3 921 - 7 729 - 11 507 - 5 991 - 3 867 Cash flow from financing activities 41 855 - 1 252 - 6 446 - 15 164 - 1 094 - 7 588 1 087 10 572 Cash flow for the period 295 44 733 4 737 - 7 961 6 031 352 11 020 - 1 828 Free cash flow 334 57 309 22 629 8 847 10 199 17 161 12 656 - 10 865 Q4 Q3 Q2 Q1 Q4 Q3 Q2 Q1 In % unless otherwise stated. (x) means times1 2021 2021 2021 2021 2020 2020 2020 2020 Key ratios Return on equity1 36.9 40.2 30.3 10.0 6.7 1.5 4.4 14.4 Return on capital employed2 22.2 22.4 14.5 5.9 5.8 4.7 6.1 9.4 Return on capital employed2, 3 11.5 11.7 11.0 9.9 9.7 9.9 9.2 9.2 EBIT interest cover, (x)2 16.2 16.6 12.1 5.1 4.3 3.3 3.2 4.5 EBIT interest cover, (x)2, 3 8.5 8.7 9.3 8.6 7.1 6.8 6.1 4.4 FFO/gross debt2 36.5 46.0 44.3 40.0 33.4 32.4 31.2 32.8 FFO/net debt2 - 103.1 - 82.0 123.1 83.8 72.7 59.8 49.9 45.8 FFO/adjusted net debt2 171.2 182.7 38.1 32.8 28.8 27.9 25.5 25.2 Equity/Total assets 25.2 27.8 25.8 26.8 24.0 24.0 22.8 24.8 Gross debt/equity 64.1 44.2 64.2 72.0 94.2 100.6 111.0 93.1 Net debt/equity - 22.7 - 24.8 23.1 34.4 43.3 54.6 69.3 66.7 Net debt/net debt plus equity - 29.3 - 32.9 18.8 25.6 30.2 35.3 40.9 40.0 Net debt/EBITDA, (x)2 - 0.6 - 0.6 0.5 0.9 1.0 1.4 1.5 1.7 Adjusted net debt/EBITDA, (x)2 0.4 0.3 1.8 2.4 2.6 2.9 3.0 3.2 1) See Definitions and calculations of key ratios for definitions of Alternative Performance Measures. 2) Last 12-month values. 3) Based on Underlying operating profit.
  • 26. 26 VATTENFALL YEAR-END REPORT 2021 NOTE 1 | Accounting policies, risks and uncertainties Accounting policies This interim report for the Group has been prepared in accordance with IAS 34 – “Interim Financial Reporting”, and the Swedish Annual Accounts Act. The accounting policies and calculation methods applied in this interim report are the same as those described in Vattenfall’s 2020 Annual and Sustainability Report in Note 3 to the consolidated accounts, Accounting policies. Amended IFRSs endorsed by the EU for application in the 2021 financial year have no significant effect on Vattenfall’s financial statements. Risks and uncertainties A historical high price volatility for electricity and fuels in 2021 has led to increased credit risks. For a description of risks, uncertainties and risk management, please refer to Vattenfall’s 2020 Annual and Sustainability Report, pages 62-71. Apart from the information provided under “Business highlights” in this report and under “Business highlights” in previously published interim reports in 2021, no other material changes have taken place since the publication. Other Significant related-party transactions are described in Note 44 to the consolidated accounts in Vattenfall’s 2020 Annual and Sustainability Report. No material changes have taken place in relations or transactions with related parties since the publication. In addition to the significant contingent liabilities described in Note 40 NOTE 2 | Exchange rates KEY EXCHANGE RATES APPLIED IN THE ACCOUNTS OF THE VATTENFALL GROUP Full year Full year Oct-Dec Oct-Dec 2021 2020 2021 2020 Average rate EUR 10.1469 10.4789 10.1604 10.2871 DKK 1.3644 1.4056 1.3662 1.3820 GBP 11.7820 11.8334 11.9631 11.3916 USD 8.5687 9.1718 8.8543 8.6406 31 Dec 31 Dec 2021 2020 Balance sheet date rate EUR 10.2503 10.0343 DKK 1.3784 1.3485 GBP 12.1987 11.1613 USD 9.0502 8.1773
  • 27. 27 VATTENFALL YEAR-END REPORT 2021 NOTE 3 | Financial instruments by measurement category and related effects on income For assets and liabilities with a remaining maturity less than three months (e.g., cash and bank balances, trade receivables and other receivables and trade payables and other payables), fair value is considered to be equal to the carrying amount. For other shares and participations the fair value is approximated by using cost. The carrying amounts of financial assets do not differ significantly from their fair values. The difference between carrying amounts and fair values for financial liabilities amounts to SEK 6.784 million (31 December 2020: 8.509). Financial instruments that are measured at fair value on the balance sheet are described below according to the fair value hierarchy (levels), which in IFRS 13 is defined as: Level 1: Quoted prices (unadjusted) in active markets for identical assets or liabilities. Level 2: Inputs other than quoted prices included in Level 1 that are observable for the asset or liability, either directly (that is, as prices) or indirectly (that is, derived from prices). In Level 2 Vattenfall reports mainly commodity derivatives, currency-forward contracts and interest rate swaps. Level 3: Inputs for the asset or liability that are not based on observable market data. FINANCIAL ASSETS AND LIABILITIES THAT ARE MEASURED AT FAIR VALUE ON THE BALANCE SHEET AT 31 DECEMBER 2021 Amounts in SEK million Level 1 Level 2 Level 3 Total Assets Share in the Swedish Nuclear Waste Fund 52 772 — — 52 772 Derivative assets — 154 744 1 141 155 885 Short-term investments, cash equivalents and other shares and participations 116 013 11 404 — 127 417 Total assets 168 785 166 148 1 141 336 074 Liabilities Derivative liabilities — 129 818 — 129 818 Total liabilities — 129 818 — 129 818 FINANCIAL ASSETS AND LIABILITIES THAT ARE MEASURED AT FAIR VALUE ON THE BALANCE SHEET AT 31 DECEMBER 2020 Amounts in SEK million Level 1 Level 2 Level 3 Total Assets Share in the Swedish Nuclear Waste Fund 48 270 — — 48 270 Derivative assets — 18 911 500 19 411 Short-term investments, cash equivalents and other shares and participations 29 900 8 011 — 37 911 Total assets 78 170 26 922 500 105 592 Liabilities Derivative liabilities — 16 825 — 16 825 Total liabilities — 16 825 — 16 825
  • 28. 28 VATTENFALL YEAR-END REPORT 2021 NOTE 4 | Acquired and divested operations Acquired operations On 1 July 2021 Vattenfall acquired the remaining shares in Enwell AB, and as a result, as from that date the company has changed over from being reported as an associated company to being reported as a subsidiary. The total purchase price for all of the shares was SEK 130 million, and the value of total assets acquired is SEK 328 million, of which SEK 179 million consists of intangible non-current assets. Divested operations On 1 July 2021 the sale of the electricity distribution company Stromnetz to the City of Berlin was completed. The consideration received amounts to SEK 21 248 million and the capital gain to SEK 8 414 million. In addition to this a number small companies within business area Wind have been sold during the period, total consideration received amounts to SEK 130 million and the capital gain to SEK 34 million. NOTE 5 | Items affecting comparability Items affecting comparability include capital gains and capital losses from sale of shares and other non-current assets, impairment losses and reversed impairment losses and other material items that are of an infrequent nature. Also included here are, for trading activities, changes in the fair value of energy derivatives, which according to IFRS 9 cannot be recognised using hedge accounting and changes in the fair value of inventories. Full year Full year Oct-Dec Oct-Dec Amounts in SEK million 2021 2020 2021 2020 1) Including items affecting comparability 29 090 - 10 514 - 1 342 - 2 741 - of which, capital gains 8 960 301 156 86 - of which, capital losses - 199 - 241 - 32 - 184 - of which, impairment losses - 38 - 12 980 - 38 - 2 447 - of which, reversed impairment losses 1 922 — 1 922 — - of which, provisions - 3 785 - 3 488 - 1 332 - 2 803 - of which, changes in the fair value of energy derivatives 8 715 4 753 - 1 822 1 967 - of which, changes in the fair value of inventories 1 313 476 - 488 418 - of which, restructuring costs — - 854 — - 709 - of which, other non-recurring items affecting comparability 12 202 1 519 292 931 Items affecting comparability during January-December 2021 amounted to SEK 29.1 billion, most of which pertains to compensation for closure of nuclear power in Germany and sales of related production rights (SEK 12.5 billion, reported in other non-recurring items affecting comparability), and changes in market value for energy derivatives and inventories (SEK 10.0 billion). The increase in provisions pertains to the nuclear operations (SEK -3.8 billion). Capital gains pertains mainly to the sale of Stromnetz Berlin (SEK 8.4 billion). Items affecting comparability during January-December 2020 amounted to SEK -10.5 billion. Most pertains to impairment losses (SEK -13.0 billion) where coal-fired power in Germany accounts for the major part and unrealised changes in market value for energy derivatives and inventories (SEK 5.2 billion). The increase in provisions pertains to the nuclear operations (SEK -3.5 billion). Other items affecting comparability pertain to the sale of nuclear power production rights in Germany (SEK 2.8 billion). NOTE 6 | Impairment losses and reversed impairment losses Accounting policy Assessments are made on a regular basis throughout the year for any indication that an asset may have decreased in value. If any such indication is identified, the asset’s recoverable amount is estimated, and an impairment test is performed. For a description of the principles for such calculations, please refer to Note 9 to the consolidated accounts in Vattenfall’s 2020 Annual and Sustainability Report. Impairment losses and reversed impairment losses 2021 During the period impairment losses of SEK 38 million have been charged against operating profit of which SEK 30 million pertains to participations within BA Wind. Previously recognised impairment losses of SEK 1,922 million mainly pertaining to hydro assets in Germany have been reversed in the income statement.
  • 29. 29 VATTENFALL YEAR-END REPORT 2021 The Parent Company Vattenfall AB Accounting policies The Parent Company Vattenfall AB’s accounts are prepared in accordance with the Swedish Annual Accounts Act and recommendation RFR 2 – Accounting for Legal Entities, issued by the Swedish Financial Reporting Board. The accounting policies used in this interim report are the same as those described in Vattenfall’s 2020 Annual and Sustainability Report, Note 3 to the Parent Company accounts, Accounting policies. New accounting policies applicable from 1 January 2021 has had no significant effect on the Parent Company’s financial statements. January – December 2021 A condensed income statement and balance sheet for the Parent Company are presented below. • Net sales amounted to SEK 40,045 million (41,969). • Profit before appropriations and income taxes was SEK -4,219 million (10,786). • Lower operating profit are attributable to changes in market value for energy derivates. • Dividend received from subsidiaries amounted to SEK 2,231 million (408), mainly from Vattenfall B.V. • Lower financial income due to exchange rate effects impacted earnings negatively. • The balance sheet total was SEK 468,482 million (305,916). • Investments during the period amounted to SEK 7,303 million (11,917), whereof 5,417 pertains to group internal asset transactions. • Cash and cash equivalents, and short-term investments amounted to SEK 145,743 million (53,043). • The equity has been adjusted with SEK -900 million per January 1st of 2020 due to nuclear related commitments previously not accounted for. Profit before appropriations and income taxes 2020 has been adjusted with SEK -376 million for the same reason. • Dividend paid to the owner of SEK 4,000 million (3,623). Presentation of Parent Company income statements See Note 1 to the consolidated accounts, Accounting policies, risks and uncertainties. Risks and uncertainties See Note 1 to the consolidated accounts, Accounting policies, risks and uncertainties. Other Significant related-party transactions are described in Note 44 to the consolidated accounts, Related party disclosures, in Vattenfall’s 2020 Annual and Sustainability Report. No material changes have taken place in relations or transactions with related parties compared with the description in Vattenfall’s 2020 Annual and Sustainability Report.
  • 30. 30 VATTENFALL YEAR-END REPORT 2021 Parent Company income statement Full year Full year Amounts in SEK million 2021 2020 Net sales 40 045 41 969 Cost of purchases - 37 035 - 23 929 1 Other external expenses - 5 250 - 4 966 1 Personnel expenses - 2 247 - 2 116 Other operating incomes and expenses, net - 52 170 Operating profit before depreciation, amortisation and impairment losses (EBITDA) - 4 539 11 128 1 Depreciation, amortisation and impairments - 629 - 596 Operating profit (EBIT) - 5 168 10 532 1 Result from participations in subsidiaries 2 231 408 Result from participations in associated companies 1 — Other financial income 1 537 2 593 Other financial expenses - 2 820 - 2 747 1 Profit before appropriations and income taxes - 4 219 10 786 1 Appropriations 5 086 - 394 Profit before income taxes 867 10 392 1 Income taxes 445 - 2 243 Profit for the period 1 312 8 149 1 1 The period has been adjusted according to IAS 8, please refer to the comments on the Parent company income statement and balance sheet for additional information
  • 31. 31 VATTENFALL YEAR-END REPORT 2021 Parent Company balance sheet 31 Dec 31 Dec Amounts in SEK million 2021 2020 Assets Non-current assets Intangible assets: non-current 330 356 Property, plant and equipment 7 003 6 618 Shares and participations 166 802 161 474 Deferred tax assets 2 272 313 Other non-current receivables 71 123 69 078 Total non-current assets 247 530 237 839 Current assets Inventories 342 411 Intangible assets: current 9 38 Current receivables 73 157 14 585 Current tax assets 1 701 — Short-term investments 101 877 29 301 Cash and cash equivalents 43 866 23 742 Total current assets 220 952 68 077 Total assets 468 482 305 916 Equity, provisions and liabilities Equity Restricted equity Share capital (131,700,000 shares with a share quota value of SEK 50) 6 585 6 585 Revaluation reserve 37 989 37 989 Other reserves 1 370 1 492 Non-restricted equity Retained earnings 64 911 60 640 1 Profit for the period 1 312 8 149 1 Total equity 112 167 114 855 Untaxed reserves 7 168 13 342 Provisions 5 621 5 376 Non-current liabilities Hybrid capital 20 421 19 305 Other interest-bearing liabilities 39 475 36 544 1 Other noninterest-bearing liabilities 12 869 12 762 Total non-current liabilities 72 765 68 611 Current liabilities Other interest-bearing liabilities 252 315 95 706 Current tax liabilities — 122 Other noninterest-bearing liabilities 18 446 7 904 Total current liabilities 270 761 103 732 Total equity, provisions and liabilities 468 482 305 916 1 The period has been adjusted according to IAS 8, please refer to the comments on the Parent company income statement and balance sheet for additional information
  • 32. 32 VATTENFALL YEAR-END REPORT 2021 Definitions and calculations of key ratios Alternative Performance Measures In order to ensure a fair presentation of the Group’s operations, the Vattenfall Group uses a number of Alternative Performance Measures that are not defined in IFRS or in the Swedish Annual Accounts Act. The Alternative Performance Measures that Vattenfall uses are described below, including their definitions and how they are calculated. The Alternative Performance Measures used are unchanged compared with earlier periods. Definition EBIT: Operating profit (Earnings Before Interest and Tax) EBITDA: Operating profit before depreciation, amortisation and impairment losses (Earnings Before Interest, Tax, Depreciation and Amortisation) Items affecting comparability: Capital gains and capital losses from shares and other non-current assets, impairment losses and reversed impairment losses and other material items that are of an infrequent nature. Also included here are, for trading activities, unrealised changes in the fair value of energy derivatives, which according to IFRS 9 cannot be recognised using hedge accounting and unrealised changes in the fair value of inventories. See Consolidated income statement for a specification of items affecting comparability. Underlying EBITDA: Underlying operating profit before depreciation, amortisation and impairment losses. This measure is intended to provide a better view on the operating result by excluding items affecting comparability that are of an infrequent nature, while also excluding non-cash depreciation and amortisation. Underlying operating profit: Operating profit (EBIT) excluding items affecting comparability. This measure is intended to provide a better view on the operating result by excluding items affecting comparability that are of an infrequent nature. FFO: Funds From Operations, see Consolidated statement of cash flow Free cash flow: Cash flow from operating activities less maintenance investments Interest-bearing liabilities See Consolidated balance sheet - Supplementary Information Net debt: See Consolidated balance sheet - Supplementary Information Adjusted net debt: See Consolidated balance sheet - Supplementary Information Capital employed: Total assets less financial assets, noninterest-bearing liabilities and certain other interest-bearing provisions not included in adjusted net debt. see Consolidated balance sheet - Supplementary Information Other definitions Definition Hybrid Capital: Perpetual subordinated securities, junior to all Vattenfall’s unsubordinated debt instruments. LTIF: Lost Time Injury Frequency (LTIF) is expressed in terms of the number of lost time work injuries (per 1 million hours worked), i.e., work-related accidents resulting in absence longer than one day, and accidents resulting in fatality. CALCULATION OF EBITDA, UNDERLYING EBITDA AND UNDERLYING EBIT Full year Full year Oct-Dec Oct-Dec Amounts in SEK million 2021 2020 2021 2020 Operating profit (EBIT) 60 271 15 276 7 750 5 246 Depreciation, amortisation and impairment losses - 15 519 - 31 231 - 2 476 - 6 875 Operating profit before depreciation, amortisation and impairment losses (EBITDA) 75 790 46 507 10 226 12 121 Items affecting comparability excl. impairment losses and reversed impairment losses - 27 206 - 2 466 3 226 294 Underlying operating profit before depreciation, amortisation and impairment losses 48 584 44 041 13 452 12 415 Operating profit (EBIT) 60 271 15 276 7 750 5 246 Items affecting comparability - 29 090 10 514 1 342 2 741 Underlying operating profit 31 181 25 790 9 092 7 987
  • 33. 33 VATTENFALL YEAR-END REPORT 2021 The key ratios are presented as percentages (%) or times (x). KEY RATIOS BASED ON CONTINUING OPERATIONS AND LAST 12-MONTH VALUES JANUARY 2021– DECEMBER 2021 Operating margin, % = 100 x EBIT 60 271 = 33.5 Net sales 180 119 Operating margin excl. items = 100 x Underlying EBIT 31 181 = 17.3 affecting comparability, % Net sales 180 119 Pre-tax profit margin, % = 100 x Profit before income taxes 59 373 = 33.0 Net sales 180 119 Pre-tax profit margin excl. items = 100 x Profit before income taxes excl. items affecting comparability 30 289 = 16.8 affecting comparability, % Net sales 180 119 Return on equity, % = 100 x Profit for the period attributable to owner of the Parent Company 46 828 = 36.9 Average equity for the period attributable to owner of the 126 811 Parent Company excl. the Reserve for cash flow hedges Return on capital employed, % = 100 x EBIT 60 271 = 22.2 Capital employed, average 271 674 Return on capital employed excl. = 100 x Underlying EBIT 31 181 = 11.5 items affecting comparability, % Capital employed, average 271 674 EBIT interest cover, (x) = EBIT + financial income 61 054 = 15.8 Financial expenses excl. discounting effects attributable to 3 873 provisions EBIT interest cover excl. Items = Underlying EBIT + financial income 31 964 = 8.3 affecting comparability, (x) Financial expenses excl. discounting effects attributable to 3 873 provisions FFO + financial expenses excl. FFO interest cover, (x) = discounting effects attributable to provisions 49 969 = 12.9 Financial expenses excl. discounting effects attributable to 3 873 provisions FFO + financial items net excl. discounting effects attributable FFO interest cover, net, (x) = to provisions and return from the Swedish Nuclear Waste Fund 49 186 = 15.9 Financial items net excl. discounting effects attributable to 3 090 provisions and return from the Swedish Nuclear Waste Fund
  • 34. 34 VATTENFALL YEAR-END REPORT 2021 Cash flow from operating activities less maintenance investments + financial expenses excl. Discounting Cash flow interest cover after = effects attributable to provisions and interest components related to pension costs 92 554 = 27.0 maintenance investments, (x) Financial expenses excl. discounting effects attributable to 3 434 provisions and interest components related to pension costs FFO/gross debt, % = 100 x FFO 46 096 = 36.5 Interest-bearing liabilities 126 408 FFO/net debt, % = 100 x FFO 46 096 = -103.1 Net debt -44 703 FFO/adjusted net debt, % = 100 x FFO 46 096 = 171.2 Adjusted net debt 26 922 EBITDA/net financial = EBITDA 75 790 = 24.5 items, (x) Financial items net excl. discounting effects attributable to 3 090 provisions and return from the Swedish Nuclear Waste Fund EBITDA excl. items affecting = EBITDA excl. items affecting comparability 48 584 = 15.7 comparability/net financial Financial items net excl. discounting effects attributable to 3 090 items, (x) provisions and return from the Swedish Nuclear Waste Fund KEY RATIOS BASED ON THE BALANCE SHEET PER 31 DECEMBER 2021 Equity/total assets, % = 100 x Equity 197 182 = 25.2 Balance sheet total 782 358 Gross debt/equity, % = 100 x Interest-bearing liabilities 126 408 = 64.1 Equity 197 182 Net debt/equity, % = 100 x Net debt -44 703 = -22.7 Equity 197 182 Gross debt/gross debt = 100 x Interest-bearing liabilities 126 408 = 39.1 equity, % Interest-bearing liabilities + equity 323 590 Net debt/net debt plus = 100 x Net debt -44 703 = -29.3 equity, % Net debt + equity 152 479 Net debt/EBITDA, (x) = Net debt -44 703 = -0.6 EBITDA 75 790 Adjusted net debt/ = Adjusted net debt 26 922 = 0.4 EBITDA, (x) EBITDA 75 790
  • 35. 35 VATTENFALL YEAR-END REPORT 2021 This is information is such that Vattenfall AB is obliged to make public in accordance with the EU Market Abuse Regulation. The information was submitted for publication, through the agency of the contact persons set out above, at 08.00 CET on 3 February 2022. This report has been prepared in both Swedish and English versions. In the event of discrepancies between the two versions, the Swedish version shall govern. Dividend In accordance with Vattenfall’s dividend policy, the Board of Directors proposes a dividend of SEK 23,414 million. Annual General Meeting The Annual General Meeting will be held on 28 April 2022. The Annual General Meeting is open to the general public. The Annual Report (in both Swedish and English versions) is expected to be published on www.vattenfall.se and www.vattenfall.com, respectively, on 29 March 2022. Year-end report signature Solna, 3 February 2022 Vattenfall AB (publ) The Board of Directors This year-end report has not been reviewed by the company’s auditor. Financial calendar Annual General Meeting, 28 April 2022 Interim report January-March, 29 April 2022 Interim report January-June, 22 July 2022 Interim report January-September, 27 October 2022 Contact information Vattenfall AB (publ) SE-169 92 Stockholm Corporate identity number 556036-2138 T +46-8-739 50 00 www.vattenfall.com www.vattenfall.se Anna Borg President and CEO T +46-8-739 64 28 Kerstin Ahlfont CFO T +46-8-739 51 67 Johan Sahlqvist Head of Group Control & Investor Relations T +46-8-739 72 51 Vattenfall’s press office T +46-8-739 50 10 press@vattenfall.com