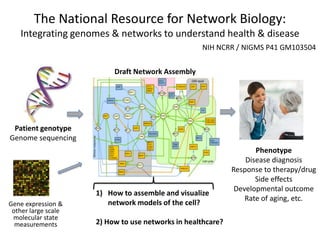
The National Resource for Network Biology (NRNB) held its External Advisory Council meeting on December 12, 2012. The NRNB is focused on developing network biology tools and collaborating with investigators. It oversees various technology research and development projects, software releases including Cytoscape 3.0, collaboration projects, and outreach/training events. The meeting agenda covered progress updates and sought advice on future plans.
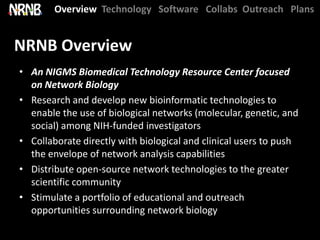
![Overview Technology Software Collabs Outreach Plans
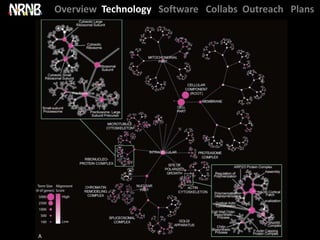
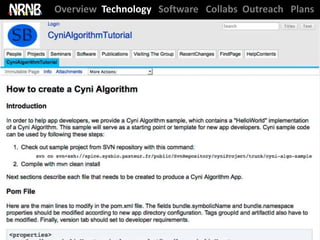
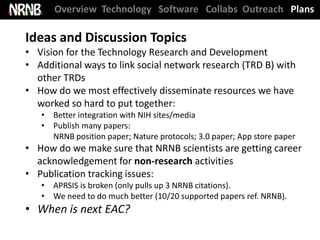
NRNB statistics ‘at-a-glance’
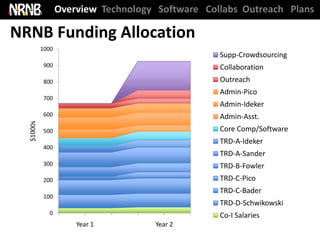
Year 3 of 5 funded years, $700,000 per year direct + $175,000 supplement
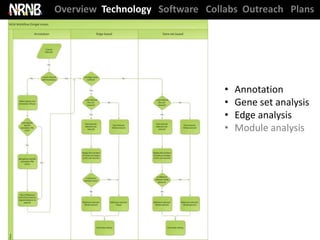
4 technology projects with matched driving biology
20 NRNB-supported publications since start of funding
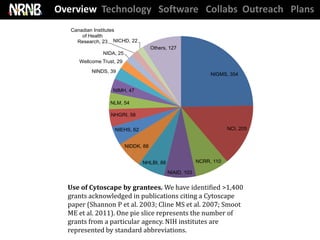
Cytoscape used in ~250 pubs / year and has supported ~1400 NIH grants
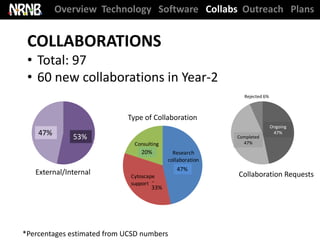
96 collaborations with NIH-funded investigators (60 new this year)
27 training events over 7 countries, 32 academic courses by NRNB staff
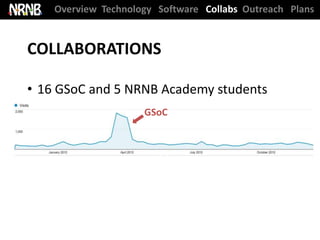
16 Google Summer of Code Students = $80,000 invested by Google
Representative Publications:
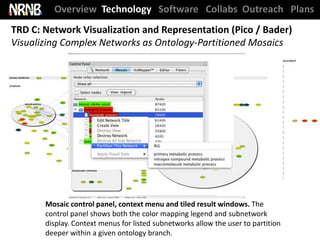
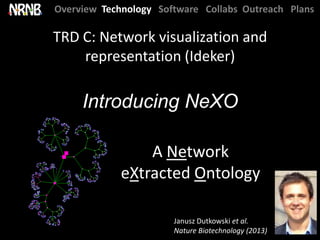
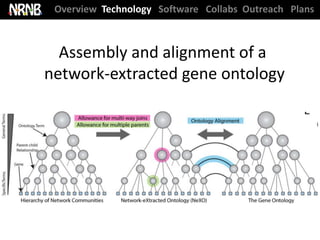
Dutkowski et al. A gene ontology inferred from molecular networks. Nature Biotech. (2013) [cover]
Rügheimer et al. Applications of Intelligent Data Analysis for the Discovery of Gene Regulatory
Networks. Computational Intelligence in Intelligent Data Analysis (2013)
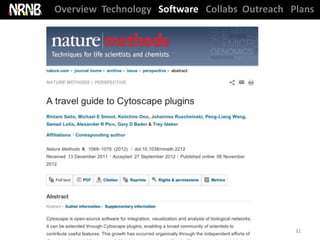
R Saito et al. A travel guide to Cytoscape plugins. Nature Methods (2012)
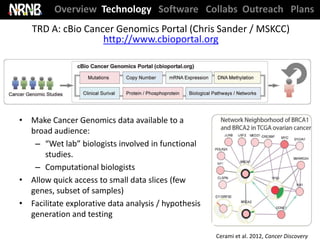
Cerami et al. The cBio Cancer Genomics Portal. Cancer Discovery (2012)
Morris, S. et al. ClusterMaker: multi-algorithm clustering for Cytoscape. BMC Bioinformatics (2011)
Ideker, T. et al. Boosting signal-to-noise in complex biology: prior knowledge is power. Cell (2011)
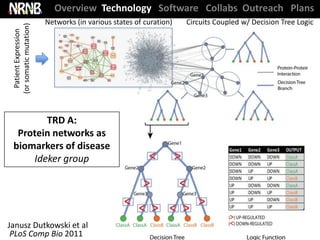
Dutkowski et al. Protein networks as logic functions in development and cancer. PLoS Comp Bio (2011).
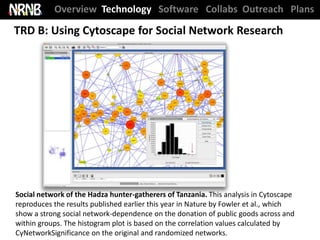
Fowler et al. Correlated genotypes in friendship networks. PNAS (2011)
Bandyopadhyay and Ideker. Integrated Systems Biology [Poster], Nature Genetics (2010)](https://image.slidesharecdn.com/nrnbmain12dec2012-121217192848-phpapp01/85/NRNB-EAC-Meeting-2012-5-320.jpg)
![Overview Technology Software Collabs Outreach Plans
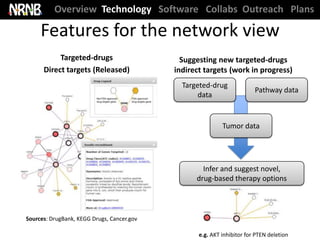
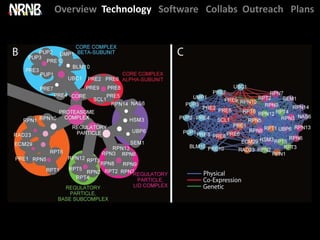
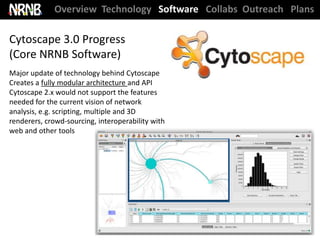
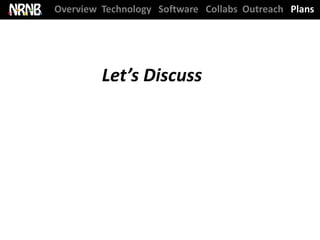
TRD A: Network Biomarkers (Ideker); DBP 2 (Kipps)
Publication: Chuang et al. Blood (2012) [cover article]](https://image.slidesharecdn.com/nrnbmain12dec2012-121217192848-phpapp01/85/NRNB-EAC-Meeting-2012-12-320.jpg)


![Community Finding with Applications on Phylogenetic Networks [Extended Abstract]](https://cdn.slidesharecdn.com/ss_thumbnails/extendedabstract-190703140727-thumbnail.jpg?width=640&height=640&fit=bounds)