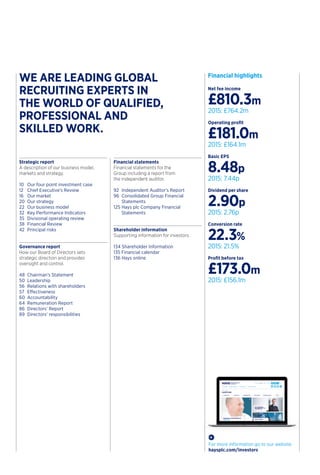
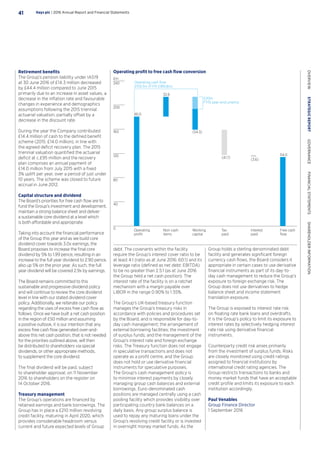
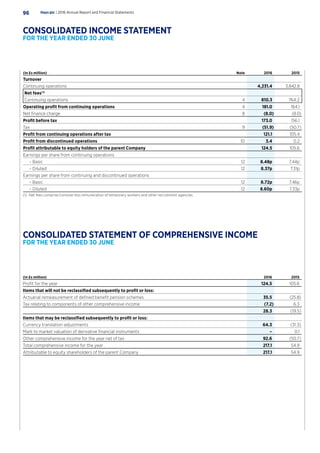
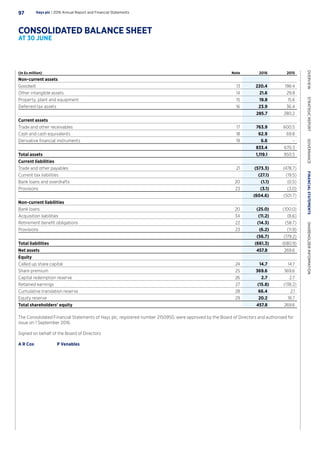
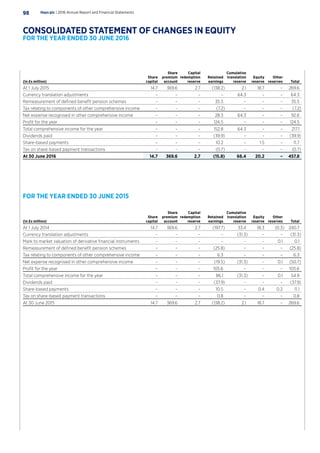
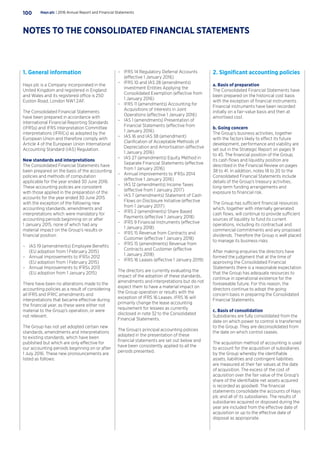
THE ULTIMATE
PEOPLE BUSINESSHays plc Annual Report & Financial Statements 2016
Financial highlights
Net fee income
£810.3m
2015: £764.2m
Operating profit
£181.0m
2015: £164.1m
Basic EPS
8.48p
2015: 7.44p
Dividend per share
2.90p
2015: 2.76p
Conversion rate
22.3%
2015: 21.5%
Profit before tax
£173.0m
2015: £156.1m
For more information go to our website
haysplc.com/investors
Strategic report
A description of our business model,
markets and strategy.
10	 Our four point investment case
12	 Chief Executive’s Review
16	 Our market
20	 Our strategy
22	 Our business model
32	 Key Performance Indicators
35	 Divisional operating review
38	 Financial Review
42	 Principal risks
Governance report
How our Board of Directors sets
strategic direction and provides
oversight and control.
48	 Chairman’s Statement
50	Leadership
56	 Relations with shareholders
57	Effectiveness
60	Accountability
64	 Remuneration Report
86	 Directors’ Report
89	 Directors’ responsibilities
Financial statements
Financial statements for the
Group including a report from
the independent auditor.
92	 Independent Auditor’s Report
96	Consolidated Group Financial
Statements
125	Hays plc Company Financial
Statements
Shareholder information
Supporting information for investors.
134 Shareholder Information
135 Financial calendar
136 Hays online
WE ARE LEADING GLOBAL
RECRUITING EXPERTS IN
THE WORLD OF QUALIFIED,
PROFESSIONAL AND
SKILLED WORK.
Divisional operating review
page 35
Our strategy
page 20
Our business model
page 22
1. IT 20%
2. Accountancy  Finance 15%
3. Construction  Property 15%
4. Engineering 8%
5. Office Support 8%
6. Other 34%
1. Permanent 42%
2. Temporary 58%
1.
2.
3.
4.
5.
6.
1.
2.
Asia Pacific
Continental Europe  Rest of World
UK  Ireland
What we do
We place candidates into temporary, contractor and permanent
roles across 20 specialist areas of skilled work.
Split of net fees by
specialism
Split of net fees by
contract type
Where we do it
We operate in 33 countries across our three divisions.
Hays is powered by our people around the world. We focus on
hiring, training and developing the best people in our industry.
Employees
9,214
2015: 9,023
Consultants
6,268
2015: 6,113*
Employee engagement
83%
2015: 84%
Hays internal international
transfers
59
2015: 41
*	2015 consultant headcount has been restated to include 144 resourcers
previously not reported as consultants in Germany and Switzerland.
1.
THE BREADTH OF OUR
BUSINESS MODEL ACROSS
SECTOR AND CONTRACT TYPE
2.
A BALANCED EXPOSURE TO
BOTH MATURE AND STRUCTURAL
GROWTH MARKETS
3.
OUR ABILITY TO DELIVER
SUPERIOR FINANCIAL
PERFORMANCE THROUGH
THE CYCLE
4.	
OUR POTENTIAL TO GENERATE
SIGNIFICANT CASH FLOW
AND DIVIDENDS
Permanent jobs filled
last year
67,000
Net fee income
£810m
Temporary and contractor
roles filled last year
220,000
For more information go to page 35 For more information go to page 10
Facts and figures The ultimate people business
Our four point investment case
We believe that there are four simple and compelling reasons to
invest in Hays:
EVERY DAY, IN 33 COUNTRIES,
FROM NEW ZEALAND TO CHILE,
252 OFFICES COME TO LIFE,
UNDERSTANDING WHAT POWERS THE
WORLD OF WORK, ANTICIPATING OUR
CLIENTS’ VARYING NEEDS, AND HELPING
DRIVE CANDIDATES’ CAREERS.
AS RECRUITING EXPERTS IN 20 SECTORS
WE RECEIVE OVER 20,000 CVs AND MEET
100s OF CLIENTS EVERY DAY FROM
BREAKFAST SEMINARS TO WORKING
LUNCHES AND 1,000s OF INTERVIEWS.
WE WORK AROUND THE CLOCK TO BRING
OUR EXPERTISE TO LIFE, FINDING THE
PERFECT FIT TO HELP BUSINESSES AND
THEIR PEOPLE FLOURISH.
WE ARE HAYS.
THE ULTIMATE
PEOPLE BUSINESS.
Hays plc | 2016 Annual Report and Financial Statements1
OVERVIEW  STRATEGICREPORT  GOVERNANCE  FINANCIALSTATEMENTS  SHAREHOLDERINFORMATION
290,000
Lives transformed
Every working day last year we placed
over 1,000 people into the next job, that’s
290,000 over the course of the year. We
also saw over 50 of our own people transfer
around the world and promoted 2,800
people across the Group. Transforming
lives through our expertise: it’s what we do.
“AT HAYS WE ARE
CHANGING LIVES
ON A DAILY BASIS.”
Hays plc | 2016 Annual Report and Financial Statements2
“I FEEL LIKE I
HAVE FINALLY
FOUND THE JOB
THAT SUITS ME.”
6 million
CVs received last year
Like many businesses, the amount of
data we need to deal with has increased
dramatically in recent years. The key for us
is having the systems and tools in place to
enable us to understand, interrogate and
search that data quickly and effectively.
Hays plc | 2016 Annual Report and Financial Statements3
OVERVIEW  STRATEGICREPORT  GOVERNANCE  FINANCIALSTATEMENTS  SHAREHOLDERINFORMATION
1 million
Individuals looking to flourish
We seek to personally meet all candidates
we plan to put forward to our clients to make
sure we fully understand their needs and can
match them to the most suitable roles. Last
year our consultants conducted over 1 million
candidate interviews.
“HAYS HAS JUST
DELIVERED
THREE AMAZING
CANDIDATES IN
A SHORT PERIOD
OF TIME.”
Hays plc | 2016 Annual Report and Financial Statements4
“WE HAVE THE
RIGHT TOOLS
AND TRAINING
TO ALLOW US
TO SUCCEED.”
9,214
Passion fuelled experts
Key to our success is our ability to hire, train
and develop the best people in our industry.
We expect them to be experts in their local
market, understanding the evolving challenges
and needs of clients and candidates.
Hays plc | 2016 Annual Report and Financial Statements5
OVERVIEW  STRATEGICREPORT  GOVERNANCE  FINANCIALSTATEMENTS  SHAREHOLDERINFORMATION
LAST YEAR, WE PLACED
67,000 PEOPLE IN
PERMANENT JOBS AND
OVER 220,000 PEOPLE
IN TEMPORARY ROLES...
Hays plc | 2016 Annual Report and Financial Statements6
...OR TO PUT IT
ANOTHER WAY,
WE PUT A SMILE
ON 290,000 FACES.
Hays plc | 2016 Annual Report and Financial Statements7
OVERVIEW  STRATEGICREPORT  GOVERNANCE  FINANCIALSTATEMENTS  SHAREHOLDERINFORMATION
Hays plc | 2016 Annual Report and Financial Statements8
Strategic report
A review of our business and
an analysis of our performance
throughout the financial year.
In this section:
10	 Our four point investment case
12	 Chief Executive’s Review
16	 Our market
20	 Our strategy
22	 Our business model
26	 Resources and relationships
32	 Key Performance Indicators
35	 Divisional operating review
38	 Financial Review
42	 Principal risks
Hays plc | 2016 Annual Report and Financial Statements9
OVERVIEW  STRATEGICREPORT  GOVERNANCE  FINANCIALSTATEMENTS  SHAREHOLDERINFORMATION
Our business philosophy
centres on the need to
invest to support long-
term growth, but also
to generate profits and
cash along the way.
In practical terms, this
means we continually
focus on: consultant and
business productivity;
profitability; strategic
reinvestment of our profits
to support growth; cash
generation and returns
to shareholders.
In addition, we believe
there are four simple
and compelling reasons
to invest in Hays.
Hays plc | 2016 Annual Report and Financial Statements10
OUR FOUR POINT
INVESTMENT CASE
Group net fees
1. Mature markets 61%
2. Structural growth markets 39%
1.
2.
1.
THE BREADTH OF OUR
BUSINESS MODEL ACROSS
SECTOR AND CONTRACT TYPE
–– We have built a global platform with unrivalled
scale, balance and diversity.
–– We have exposure across permanent, temporary
and contractor recruitment markets at a scale,
which is unique amongst our peers.
–– We focus on execution in each of our local
markets delivered by the best people, sector-
leading technology, tools and a world-class
single brand.
–– We have strong and experienced operational
and senior regional management teams
across the Group.
–– We focus on developing and delivering the best
services and products for clients and candidates,
meeting their evolving needs.
3.
OUR ABILITY TO DELIVER
SUPERIOR FINANCIAL
PERFORMANCE THROUGH
THE CYCLE
–– Three years into our five-year plan, we are where
we expected to be in terms of our aspiration to
broadly double 2013’s operating profit of £125
million to £250 million in 2018.
–– We have a balanced exposure across countries,
specialist areas and contract forms (between
temp, contracting and perm).
–– We believe this balance adds relative resilience to
our earnings throughout the economic cycle and
drives the outperformance of our business versus
the peer group.
–– Despite this existing balance we remain focused
on further diversifying our earnings, building scale
across our existing global platform.
2.
A BALANCED EXPOSURE TO
BOTH MATURE AND STRUCTURAL
GROWTH MARKETS
–– Many of the 33 countries across our global platform
represent clear structural growth opportunities,
where the use of agencies such as Hays to source
skilled employees is a relatively new practice.
–– 39% of our Group net fees are generated in
these structural growth markets which include
Germany, Latin America and Japan.
–– The remaining 61% of net fees come from more
mature markets, such as the UK, the US or
Australia, where the use of agencies is a long-
established practice in the skilled jobs market.
4.
OUR POTENTIAL TO GENERATE
SIGNIFICANT CASH FLOW
AND DIVIDENDS
–– Delivering our plan would allow us to generate
material cash returns, increase our net cash
position and grow the Group’s dividend.
–– We target core dividend cover of 3.0x earnings
and are building cover towards this level, with
this year’s at 2.9x.
–– It is our intention that once we have built a net
cash position of c.£50 million, any free cash
generated over and above this level will be
distributed to shareholders annually, at year end,
assuming a positive outlook, most likely as a
special dividend, supplementing the core dividend.
–– This year we achieved our long-standing ambition
of eliminating net debt, a significant milestone for
the Group.
Sectors
20
FY16 operating profit
£181.0m
Net cash
£36.8m
Countries
33
Earnings per share
8.48p
Dividend per share
2.90p
Hays plc | 2016 Annual Report and Financial Statements11
OVERVIEW  STRATEGICREPORT  GOVERNANCE  FINANCIALSTATEMENTS  SHAREHOLDERINFORMATION
Conversion rate progression since FY13
2013 2014 2015 2016
19.4%
17.5%
%
21.5%
22.3%
15
20
25
I was also very pleased with our good
underlying cash performance, meaning that we
achieved our long-standing goal of eliminating
the Group’s net debt – and again we delivered
this ahead of when the market expected us to
do so. We achieved this despite paying £40
million in dividends to shareholders in the year
and investing rapidly to drive organic growth
around the world. Becoming debt-free means
we face the future with our balance sheet
healthier than it has been for many years.
That gives me even greater reassurance in
our ability to deal with future market ups and
downs, having the firepower to both invest
where appropriate as well as continue to
reward our shareholders via the dividend.
Our Chief Executive,
Alistair Cox, discusses
the Group’s performance
in 2016 and looks ahead
to our areas of focus for
2017 and beyond.
Q.Was the financial performance of the
business this year in line with your
expectations?
A.I was pleased with our strong set of financial
results for the year, particularly as we
delivered a performance that was above
market consensus expectations. We grew
our net fees by 7%(1)
and very importantly
converted that into strong operating profit
growth of 13%(1)
, thereby further improving
our conversion rate by 80bps to 22.3%(2)
.
The conversion rate is the key measure of how
effectively we convert net fees into operating
profits, so it is an important indicator as to
how efficiently and productively the business
is performing around the world. We have long
enjoyed the leading conversion rate amongst
our peers in the industry, so it was very
rewarding to see it continue to grow.
Hays plc | 2016 Annual Report and Financial Statements12
CHIEF EXECUTIVE’S
REVIEW
Alistair Cox
Chief Executive
Q.What were your key areas of operational
focus during the year, and what progress
did you make against your non-financial
objectives?
A.The two routes to grow our business
organically are by adding additional capacity
via headcount investment and by further
improving the productivity of our existing
consultant base. Our focus is to strike the
right balance between these two. Many of
our markets offer significant structural growth
opportunities, so we invest to build capacity
to exploit those opportunities for the long
term. However, we also believe it is vital to
deliver meaningful profits along the way and
productivity improvements play a large part
in achieving that. During the year, many of our
markets were very supportive so we invested
in additional capacity and grew our headcount
by 3% globally, helping to drive our net fee
growth around the Group. A good example is
Germany where we ramped up investment in
the summer of 2015, with a specific emphasis
on targeting the SME client sector. Over the
year we increased headcount in Germany by
11%(3)
to over 1,200 consultants at year-end.
As the German market improved during the
course of the year, this investment delivered
quick returns, as we had in place the capacity
to meet the growing demand and our fee
growth accelerated accordingly.
between these candidates and current client
opportunities and we have invested in growing
our internal capabilities in data analysis and
digital marketing accordingly. This team’s role
is to analyse our data, unlocking insights which
will allow us to focus our consultants’ efforts
and expertise into the most fertile areas. Above
all though, all of these initiatives are designed
to make our consultants even more productive
and profitable than they might be otherwise.
This data-focused team works very closely
with our well-established Innovation group,
whose primary focus is on understanding the
many new and emerging business models
in the recruitment space. Again, where we
see a potential threat or challenge to our
existing core business or indeed when a new
opportunity or route to market arises we want
to ensure we fully understand that change,
forge relationships where we can, and also
build, test and learn from our own new tools
and products. This approach is designed to
ensure we can quickly identify and mitigate any
risk or threat to our business and fully capitalise
on any new opportunities that come our way.
We made significant progress diversifying our
business by further expanding our Contractor
business into newer markets, using the
experience and expertise that has been at
the heart of our success in Germany. The
worldwide Contractor market is benefiting
from a structural shift towards highly skilled
freelancer roles in a number of sectors, and is
set for long-term growth as we discuss in more
detail on page 18. It also provides us greater
earnings resilience, particularly when markets
are more uncertain. However, it requires
different skills, systems and business models to
the permanent recruitment market. As a leader
and expert in both permanent and contracting
recruitment, we are well positioned to leverage
both opportunities, and that is a unique
positioning in today’s recruitment industry
as our peers tend to focus on one or other
of these two sectors. I expect Contracting to
become a more important part of many of our
businesses around the world. For example,
from a standing start just a few years ago, our
French business now generates over one-third
of its net fees from temporary and contractor
recruitment and we are continuing to invest
to grow these businesses further.
Finally, we made good progress developing
the Veredus business in the US, following
its acquisition in December 2014. All post-
acquisition integration plans were successfully
completed including implementation of
the Hays proprietary front office system
OneTouch, introduction of the Hays brand
and harmonisation of the finance and
controls systems under the Veredus
management. We also expanded the core
IT business as well as investing in the recently
launched Construction  Property and Life
Sciences specialisms.
One of the
key challenges we
face is the fast-
moving economic
environment
to deliver excellent profit leverage, even as the
market then did soften, as we’d predicted as
macroeconomic concerns intensified and the
EU Referendum approached. These actions
allowed us to grow UK profits by 14%(1)
or
£6.4 million even though net fees were flat
on the prior year – an excellent result. These
are both examples of how the combination of
strong local management teams supported
by powerful management information
systems equips our business to take rapid and
informed decisions that are fundamental to
our financial performance.
Consultant headcount
2013 2014 2015 2016
5,037
5,357
6,113 6,268
0
1,000
2,000
3,000
4,000
5,000
6,000
7,000
Over the year we further improved consultant
productivity by 1%(1)
. This alone added
£6 million to our operating profit. Key to
achieving this was our investment in consultant
training and the development of more tools
that would enable our consultants to become
even more expert and effective in their roles.
Over the year we delivered 4,000 days of
training across our business, designed to
make our consultants expert in their jobs and
to further develop our management teams to
run ever-larger businesses. We also continued
to invest in new and emerging technologies,
designed to assist our consultants find exactly
the right candidates for their clients and to do
that faster than ever before. An example of
this is our recent partnership in Australia with
SEEK, the leading job board in that region.
Such partnerships, blending the skills, systems
and insights of other organisations with those
of our own are an important element of
our own development and I am proud of the
relationships we have built with enterprises
such as Google, LinkedIn, Oracle, the
Confederation of British Industry and
Manchester City Football Club. I expect more
such collaborations to flourish over time.
This year we made further inroads in
understanding how we can best use the
massive quantities of data our business holds
in order to deliver even better service to our
clients and candidates. Our business has a
relationship with literally millions of highly
skilled individuals and organisations around the
world. Data science has a role to play assisting
our consultants make the very best match
One of the key challenges we face is the
fast-moving economic environment, and
how changes in the world around us can
very quickly and materially impact trading
conditions in our markets. For example,
this year our forward indicators in the UK
suggested a softening market in Autumn 2015.
Consequently, we took quick action to reduce
costs and capacity. This allowed us to continue
Hays plc | 2016 Annual Report and Financial Statements13
OVERVIEW  STRATEGICREPORT  GOVERNANCE  FINANCIALSTATEMENTS  SHAREHOLDERINFORMATION
Q.Three years into your five-year plan, are
you on track? Do you still feel confident
in delivering on those aspirations?
A.Three years into our five-year plan, we are
in line with where we expected to be at this
stage, having delivered £56 million of headline
profit growth since 2013. I am delighted with
that progress, not least because over the first
three years we have faced significant currency
headwinds of £22 million, which materially
reduced our reported sterling profits, and
it is very encouraging that our strong
trading has mitigated these adverse forex
movements. However, as expected in a
cyclical business such as ours, after three
years the geographic source of profit
growth has been different to that which
we envisaged, with Australia and Germany
slightly behind track, largely as result of
currency headwinds, while the UK and the
rest of the world are well ahead of plan due to
strong trading and operational performances.
In Australia this year, we benefited from
a gradual improvement in sentiment in the
private sector, led by the eastern states of New
South Wales and Victoria, as well as increasing
demand from the public sector. The mining
sector continued to prove very challenging but
stabilised towards the end of the year. These
dynamics enabled us to modestly increase our
fee growth rate through the year and increase
consultant headcount by 5%.
In Germany, we grew headcount to take
advantage of improved market conditions,
as mentioned earlier. This allowed us to
gradually accelerate our net fee growth rate
through the year, reaching an underlying
17%(1)
in the final quarter. At these growth
levels, Germany now has the potential to
deliver on the 2018 profit range we originally
targeted, which had a mid point of £100
million, and continues to represent a material
structural growth opportunity for our Group.
The UK is worth a specific mention as we
have made significantly more progress there
than we might have originally expected. The
exceptional operating leverage the team have
delivered is particularly impressive. In fact,
over the last three years, we have converted
over 90% of our incremental net fees into
operating profits, way ahead of our historical
norms or any of our competitors.
Finally, our remaining 30 countries have
collectively performed beyond our initial
expectations and several countries are
now reaching real scale, including France,
Q.How do you think about the uses of cash
within the business?
A.Over and above the investment we make
into people, our business has very low capital
requirements and is highly cash generative.
This year we converted 88%(4)
of our
operating profits into operating cash flow,
generating over £159 million of cash in
the process. We believe in rewarding our
shareholders and have a clear distribution
policy in place, designed to be appropriate
for the cyclicality inherent in our industry.
The primary element of distribution is the
core dividend, which is set at a level which
we believe to be secure under all predictable
scenarios. Over the last few years, we have
built the core dividend cover up towards our
target of 3x EPS, and when we reach this
level of cover, the core dividend will grow
in line with earnings.
Now we have eliminated our net debt,
our next goal is to build a net cash position
of around £50 million, which we expect to
achieve in FY17. Once this is achieved, it is
our intention that any excess cash that is
generated over and above this level will be
distributed to shareholders, provided our
market outlook is positive. The most likely
form of distribution will be via a special
dividend, supplementing the existing core
dividend. We believe this combination
of secure, progressive core dividend
supplemented by regular and material
special dividends in the good years is an
effective way of distributing our cash returns
to shareholders. Our policy also ensures
the business remains securely financed
and appropriately invested and reflects
both the cyclicality as well as the attractive
cash generation capability of our business.
Q.What will be the main areas of focus for
you and your management team in the
year ahead?
A.We have a clearly defined long-term strategy
and objectives so in the year ahead our focus
and priorities will be largely unchanged as
we seek to make further progress against
those established goals. We will continue to
focus on driving profitable, cash generative
fee growth, as well as investing to deliver on
Switzerland and Japan. Equally we are
benefiting from many smaller businesses
which are growing rapidly and are collectively
delivering meaningful profits, including Spain,
China, Belgium and New Zealand.
Our five-year plan was based on a set of clear
assumptions for the market backdrop; steady
overall economic growth over the plan period,
with no recessions in any of our major markets
and a modest acceleration in growth in the final
two years. We also assumed that while there
may be the occasional minor economic
‘shock’, no major shock such as those we’ve
experienced previously including the Global
Banking crisis or Eurozone crisis would occur.
Three years into the plan, these assumptions
have been proven valid. However, the UK’s
decision to leave the EU at the end of our last
financial year has undoubtedly created greater
economic uncertainty. It remains to be seen
how this will impact our important economies
and what the implications might be on our
financial performance for the remaining two
years of the plan period. What I can say though
is that our business is adaptable and managed
by a strong and stable team around the world
who are experienced in managing our business
to maximum effect in any market environment.
Operating
profit
£181m
2015: £164m
Three-year operating
profit growth(1)
£78m
FY13 FX
impact
Operating
profit
growth(1)
FY16
125
£m
(22)
78 181
0
40
80
120
160
200
Hays plc | 2016 Annual Report and Financial Statements14
CHIEF EXECUTIVE’S
REVIEW
CONTINUED
The success
of our business
is based on the
expertise of our
colleagues
our long-term strategic ambitions.
Day-to-day, this means continuing to
invest in improving consultant productivity,
adding additional capacity where demand
warrants and rapidly investing in the
longer-term initiatives that will become
large and important aspects of our business
in the future. This single-minded focus on our
core business, supplemented by a continual
strive to improve and expand that core, has
served us well and will continue to be our
primary theme.
The success of our business is based on the
quality and expertise of all of our colleagues
across Hays worldwide. Key to our growth
and continuing success therefore will remain
our ability to hire, train, motivate and retain
the best people in our industry. That’s why
people risk is one of the key challenges we
face. It’s why we are so focused on the global
mobility of our people (which we discuss
on page 27), moving high performers from
established businesses to help grow and
develop newer ones. We address the risk of
losing key people through industry-leading
training and development programmes,
succession planning and incentive schemes
(discussed on page 26). Over the years, we
have invested to build the resources and
infrastructure to manage these things well
but we will continue to invest in upgrading
this capability. For example, we will add
additional training and development
resources into the US to enable faster
growth and we will roll out new leadership
development programmes, to equip our
global management to deal with larger
and more complex businesses.
and where current productivity has reached
an acceptable level to justify adding more
capacity. Clearly the UK vote to leave the
EU has increased uncertainty in that market,
at least in the short term. And although it
remains too early to tell what the longer-term
impact may be, we are, as ever, monitoring
activity levels closely. Regardless, the UK
remains a large and important skilled labour
market, despite the current uncertainty and
we will continue to reinforce our market-
leading position there as the exit negotiations
and implications unfurl. In terms of newer
market areas, we will continue to ramp up
our Contracting business in a number of
countries as discussed earlier. Similarly, we
have already started to invest in new niche
specialisms in the technology sector, serving
the rapidly growing market for advanced
digital skills across the technology and
marketing sectors, and this investment will
be accelerated across key countries including
the UK, Australia, Germany, North America
and Asia. Finally, the US market offers
significant opportunities for us to build a
very large business over time. Our priorities
there remain to grow our core IT business as
well as launch and rapidly expand additional
specialisms. We will accelerate investment
in the recently launched Construction 
Property and Life Sciences specialisms for
example and will also explore opportunities
to invest in other areas including Accounting
 Finance.
Technology impacts every industry so we
will continue to explore how we can best
exploit the evolving technology landscape
to make our own business ever more
productive and valuable. As discussed
earlier, we have in place the internal
resources to focus on this but will also
continue to build relationships with external
partners where we see benefit. This market
moves so quickly that it is impossible to
predict the future. Rather, our approach
is to be deeply involved in its evolution,
working alongside our partners so that we
keep abreast of developments, adapt our
business where we see competitive threats
and exploit new ideas and tools where they
provide us with competitive advantage.
Above all, these investments are all designed
to enhance the expertise and capability of
all Hays employees. Our recipe is simple:
hire the very best people to work for Hays,
provide them with world-class training and
career development opportunities, equip
them with state-of-the-art technology
tools to be better at their jobs than their
competitors and reward them based on
their performance. All our investments are
designed so that our teams can better help
our clients find the scarce talent they need
and help millions of candidates we are
connected to secure the perfect next role
in their career. That’s why I believe Hays
is the ultimate people business.
Alistair Cox
Chief Executive
(1)	LFL (like-for-like) growth represents
organic growth of continuing operations
at constant currency.
(2)	Conversion rate is the proportion of net fees
converted into operating profit (before
exceptional items).
(3)	Consultant headcount at June 2015 has been
restated to include 144 resourcers previously
not reported as consultants in Germany
and Switzerland.
(4)	Cash conversion is the conversion of operating
profit into operating cash flow (before
exceptional items and capital expenditure).
Most of our markets are supportive today
so we will capitalise on this by investing
both in additional consultant capacity in
our existing businesses as well as more
rapid investment in newer areas that
offer longer-term opportunities. If current
market trends continue, I expect us to
grow headcount next year, but only in those
markets where we see a positive outlook
Hays plc | 2016 Annual Report and Financial Statements15
OVERVIEW  STRATEGICREPORT  GOVERNANCE  FINANCIALSTATEMENTS  SHAREHOLDERINFORMATION
The stage of the
macroeconomic cycle
and outlook, and prevailing
sentiment in each of our
markets, have a direct and
often significant impact
on activity levels within
our business. This can be
both positive and negative,
particularly with respect
to the confidence levels
of businesses to invest
in hiring, and candidates
to move jobs. We call this
‘job churn’, and it is the
primary driver of activity
in the short term.
lowered. As the year ended, there was
a General Election in Australia and the
incumbent Government was re-elected, albeit
with a slim majority. In Asia, China grew at the
slowest rate in 25 years as the transition to
move towards an economy led by consumption
and services, rather than one driven by
exports, continued. In the rest of Asia subdued
banking markets weighed down on sentiment,
especially in the second half of the year in Hong
Kong and Singapore.
Continental Europe  Rest of World
Overall, Europe continued its broad-based
recovery during the year, with falling
unemployment, rising incomes and supportive
monetary policy measures from the ECB
all strengthening consumer and business
confidence, which in turn supported activity
levels in many markets. In the Americas,
economic conditions were more mixed, with
heightened political and economic instability
in Brazil, while in North America although
the Canadian economy remained subdued,
hampered by falls in commodity prices, the US
enjoyed a more robust economic performance.
This was most evident in the jobs market,
where non-farm payroll, a key employment
measure, rose by an average of 206,000 per
month, leading the Federal Reserve to increase
interest rates for the first time in nine years.
To see how we performed across our three
divisions go to page 35
The macroeconomic environment
UK  Ireland
For most of the year, especially the first half,
the UK economic and market backdrop was
broadly stable and supportive. As we started
the second half, however, we saw increased
caution amongst clients as geopolitical
instability in parts of Europe and worries about
the state of the Chinese economy weighed on
sentiment. Confidence was also impacted by
the UK Referendum on EU membership which,
although it did not take place until June 2016,
created further increased uncertainty, adding
to the sense that the UK was experiencing
a ‘pause for breath’. As we exited the year,
following the vote to leave the EU, this level
of uncertainty (notably amongst clients)
increased significantly and so remains a key
factor in the market, though it is too early
to tell what the longer-term impact may be.
In the year, UK unemployment fell further,
employment levels hit all-time records, and
the Bank of England held interest rates at
historically low levels.
Asia Pacific
In Australia, while the resources-driven parts
of the economy remained subdued, overall
sentiment improved steadily over the year
despite some concerns over the impact of a
China slowdown on the economy. Consumer
confidence levels in the non-mining regions
improved, there was an uptick in public sector
backed investment and interest rates were
Key economic and political events in our major markets during FY16
UK market sentiment
was impacted by the EU
Referendum poll and its result.
Unemployment fell further,
employment levels hit all
time records.
Asia Pacific
UK  Ireland
Continental Europe 
Rest of World
Australia
Consumer confidence
levels, especially in the
non-mining regions,
improved.
There was a General
Election in Australia
and the incumbent
Government was
re-elected.
China
Experienced a slowdown
in the economy which
impacted consumer
and business sentiment
worldwide.
Europe
Continued broad-based
recovery with falling
unemployment.
US
The US enjoyed a stronger
economic performance,
notably in the jobs market.
Americas
Economic conditions
were more mixed in the
Americas, with heightened
political and economic
instability in Brazil.
Hays plc | 2016 Annual Report and Financial Statements16
OUR MARKET
£130k
£20k
Indicativesalaryrange
ofHaysplacements
Net fee pool
Marketsegment
Hays focus
Executive search
Specialist recruitment
Contingent fee model
focused on highly skilled
roles in clear structural
growth markets
Generalist ‘blue
collar’ staffing
Group net fees excluding Germany,
Australia and the UK
Perm
Temp
2011 2016
78% 67%
33%
%
22%
0
20
40
60
80
100
The main UK listed specialist recruitment
businesses we identify are PageGroup,
Robert Walters and SThree, all of which have
varying exposures and business mix, but do
have a presence in many of the markets in
which we operate (though do not have the
scale of Hays’ operations in some of the
more technical recruitment markets such
as Construction  Property). We also identify
many other competitors across each of our
local markets. These include larger, so called
‘generalist’ recruiters such as Adecco,
Randstad and Manpower, who also have
operations in the specialist recruitment
space, but are predominantly focused on
lower-salary ‘blue collar’ segment of the
market. There are also several other sector
or region-specific businesses such as KForce
in the US or Amadeus FiRe in Germany.
We have deliberately built a business that is
well-balanced and exposed to both mature,
cyclical markets and emerging structural
markets. In FY16 61% of our net fees were
generated in mature markets and 39% in more
immature markets. The latter have significant
structural growth opportunities and are less
impacted by the economic cycle. We believe
this balance, as well as our mix of temporary,
contractor and permanent recruitment
combined with genuine scale across a range of
20 specialist areas and 33 countries, is unique
to the specialist recruitment space, adds
relative resilience to our business model
through the economic cycle and acts as
a genuine differentiator in our industry.
The competitive environment
We focus on the segment of the recruitment
market referred to as professional, ‘white collar’
skilled or specialist recruitment. The salary of
the candidates we place ranges from roughly
£20,000 to £130,000 p.a. and we operate
across 20 different areas of specialism,
including white collar professions such as
Accountancy  Finance and IT, and more
technical disciplines such as Engineering
and Construction  Property. The competitive
landscape across most of our markets is
extremely fragmented and characterised by
a large number of companies, which are often
very small and focus on local, niche markets,
and with a few large global players.
Despite the fragmented nature of the
industry, however, in the majority of our
markets the main competition we face is
from in-house recruiting teams within the
HR function of corporates. While we estimate
that in more mature markets like the UK or the
US around 80% of addressable skilled jobs are
filled via recruitment agencies, in less mature
markets like Germany that figure is only
around 20% according to our analysis. The
first time outsourcing of the recruitment of
professional staff is therefore a key driver
of growth in many of our businesses.
The structure of the global recruitment market
In FY16 58% of our fees came from the
Temp and Contracting market, although
this is weighted towards just three countries
where Hays has a market-leading position:
Germany, Australia and the UK. In most
of the other countries in the Group we
have historically been predominantly perm
focused, however where market conditions
and local legislation have allowed it, we
have successfully been pursuing a strategy
to build a meaningful temp and contractor
business, which today represents one-third
of our business outside of the three
core markets.
Hays plc | 2016 Annual Report and Financial Statements17
OVERVIEW  STRATEGICREPORT  GOVERNANCE  FINANCIALSTATEMENTS  SHAREHOLDERINFORMATION
Longer-term market trends
In addition to these short-term macroeconomic
conditions and competitive trends, we see
many other factors that influence our business,
which can represent opportunities and/or risks
or challenges to our existing business model.
The emergence of structural growth
markets in specialist recruitment, skills
shortages in certain recruitment markets
and the globalisation of the flow of labour
all have an influence. In addition, we identify
four ‘mega trends’ which also have an impact
on the future shape and direction of our
industry and inform how we run the business
and develop our strategy:
Mega trend 1: Labour force evolutions
These include the rise of the digital economy
driving new job creation in more niche areas
such as social media, increased IT spend and
demand for more flexible, project-based
work or greater mobility of experienced
workers and globalisation of labour.
Many of the factors above are why we
believe Contracting is a key structural
growth market and has become one of our
fastest-growing business sectors. We have
made further strategic progress rolling out
our market-leading IT Contracting business
from Germany into other markets where
we believe the model can be successful,
including Canada, France and Japan. This,
coupled with the established IT contracting
business we now have in the US following
the acquisition of Veredus, means we are at
the forefront of this evolving market trend.
Opportunities for Hays
–– Further build scale within our
Contractor business
–– Offer a truly globally-integrated
service to respond to increased
candidate global mobility, capitalise
on cross border client relationships
–– Continue to build our brand in new
emerging country markets and
industry niches
Potential challenges or threats
–– Sourcing highly-skilled contractors
to place with clients
–– Jobs are created in new, niche specialisms
in which Hays has limited presence
–– Being able to quickly understand and
adapt to changing regulatory
environments in many local markets
–– Technological and demographic factors
which may constrain growth
Mega trend 2: Changing client behaviour
Many companies are increasingly employing
skilled people on a contract or project basis,
introducing more flexibility in their cost base
and benefiting from a workforce with a wide
portfolio of relevant experience. For an
increasing number of businesses therefore,
contract and temporary workers make up an
essential, and in some cases substantial, part
of their workforce. Hays act as intermediary
for highly skilled professionals searching for
short-term vacancies.
Opportunities for Hays
–– Work with existing clients to help them
manage and shape their skilled Temp
 Contractor workforces
–– Establish new client relationships as more
businesses adopt this model
–– Bring the expertise of our existing Temp
 Contractor businesses to bear in new
and opening markets
Potential challenges or threats
–– The risk of more ‘in-house’ recruitment
and direct sourcing of temp and
contractor labour by corporates
–– Adverse changes in local market
regulations governing the Temp
 Contractor markets
Mega trend 3: Changing business practices
These include increased outsourcing of
recruitment in many immature markets
around the world where most professional
recruitment is still done by in-house HR
teams, as well as the increased levels of
centralised procurement seen in large
corporates in more mature markets
Opportunities for Hays
–– Open-up markets where the majority
of recruitment is still performed by
in-house teams
–– Drive growth over-and-above the
economic cycle, capitalising on first
time outsourcing
Potential challenges or threats
–– Margin pressure as more recruitment
purchasing decisions are actioned by
procurement teams
–– The need to continue to invest in
developing new tools and resources to
provide first-class large-scale HR services
–– The risk of disintermediation by newly
developed technology tools embedded
within our clients
–– Sourcing and retaining skilled people and
management depth in newer markets
We operate in both mature, cyclical and
less mature structural-growth markets.
We have been building a strong presence in
markets like Germany which, despite being
a developed economy, has a low penetration
rate when it comes to the outsourcing
of recruitment services. Therefore,
notwithstanding our market-leading position
there we still see many growth opportunities
as more businesses start to outsource their
recruitment of skilled labour. Our services
must be tailored to these different client
needs, whether SMEs or large corporates
and the way we provide those services
has to be adapted to match those unique
requirements. For instance we offer
Managed Service Programme (MSP)
services, where we manage contingent
workforces, as well as Recruitment Process
Outsourcing (RPO) services, where we
manage all permanent recruitment needs.
Additionally, to help clients of any size
tracking all aspects of their contingent
workforce we also offer technology-
enabled solutions like our 3 Story Software,
a cloud-based vendor management and
workforce management software solution.
Mega trend 4: Evolving technology
Technology is in many ways transforming
how people work, enabling remote working
and impacting on how clients and candidates
engage and interact with the jobs market
and with Hays. Also, the digitalisation of both
supply and demand creates vast quantities
of data to be analysed and put to use.
Opportunities for Hays
–– Leverage our IT architecture to efficiently
handle the increasing volumes of data
in our business, enabling our consultants
to focus on the relationships with clients
and candidates
–– Understand and manage the data within
our business to drive better results for
clients and candidates
Potential challenges or threats
–– Invest in understanding and responding
to new trends, routes to market and
disruptive technologies
–– Continue to develop our systems and
capabilities to interact with external data
sources, new routes to market and to be
able to offer clients and candidates the
products and systems they demand such
as mobile and social media technologies
Our sector-leading technology and
partnerships help us drive growth by
improving our consultants’ productivity.
We also have an Innovation team which
is tasked with assessing the technology
landscape, identifying new industry trends,
opportunities and threats and building
partnerships with key emerging players.
Hays plc | 2016 Annual Report and Financial Statements18
OUR MARKET
CONTINUED
Like many things at Hays, our German IT
Contracting business is based on strong, long-
lasting relationships we build with clients and
candidates. Arno has been a business partner
of Hays for more than 10 years. He is a Senior
IT Consultant, specialising in the migration
of core banking systems. “In my previous
projects at Deutsche Bank and Commerzbank
I was in touch with Hays on a regular basis and
had a personal recruitment expert who looked
after me throughout my various assignments.
I enjoy the opportunity and the flexibility to
shape my career according to my own needs
and I am looking forward to the new project
I am about to start with Hays.”
Arno Mathiszik
Senior IT Consultant, Germany
Over the last few years the roll-out of our
market-leading Contracting business into
France has enabled us to capitalise on a
macro shift in the French skilled workforce
marketplace towards more flexible working
arrangements. David Michelin has been part
of this trend. He is an IT Project Director and
over the last three years Hays has helped him
secure positions with clients including
Publicis, Pixmania and Isobar. “Over the
years, I have created a strong relationship
with Hays, who have given me the
opportunity to grow professionally in
projects which matched my expectations.”
David Michelin
IT Project Director, France
Acquisition of Veredus Corp.
In 2014 Hays acquired Veredus Corp., a
pure play IT staffing company that generates
c.80% of its net fees from Contracting and
Temporary assignments. The ingredients for
success in the Veredus business were the
same as those in our other major contracting
businesses around the world: acting as
trusted long-term career advisers to
highly-skilled professionals, finding them the
roles to develop and match their skills. Bobby
Higbea has been a Veredus contractor for
over 10 years. He is a Senior .Net Developer
who has been placed on assignment through
Veredus with clients including Tech Data,
Elsevier and PwC.
Our consultants have built a real
understanding for what Bobby’s
requirements are and how they’ve changed
over time and have been successfully
matching them with our clients’ evolving
needs. “I’ve worked with Veredus for over
10 years, and have a genuine two-way
relationship with them. They have always
taken a genuine interest in the development
of my career, which has shown with each
assignment as well as the advice they are
able to give. They understand my career
goals as well as the way I work and have
consistently offered attractive roles that
suited my skillset and lifestyle.”
Bobby Higbea
Senior .Net Developer, USA
Market trends case study:
DRIVING MANY OF
THESE MEGA-TRENDS
IS THE WAY THAT
FLEXIBLE PROJECT-
BASED WORK AND
INCREASED GLOBAL
MOBILITY OF SKILLED
CANDIDATES HAS
CHANGED THE WAY
WE WORK.
Hays understand
my career goals as
well as the way I work
Bobby Higbea
Senior .Net Developer, USA
Hays plc | 2016 Annual Report and Financial Statements19
OVERVIEW  STRATEGICREPORT  GOVERNANCE  FINANCIALSTATEMENTS  SHAREHOLDERINFORMATION
Our ultimate aim is
to be the undisputed
leader in global specialist
recruitment. As we build
towards this, we have a set
of four, long-established
strategic priorities which
remain unchanged
throughout the various
stages of the economic
cycle. They are informed
and driven by our aims,
as well as the long-term
mega-trends we identify
in our marketplace,
described on page 18.
Strategic roadmap
We have a clear and disciplined
approach to the prioritisation
of investment to deliver on our
long-term goals.
Prioritised pipeline
2. Build critical mass and
diversity across our
global platform
Increased geographic and sectoral diversification and
exposure to perm, temp and contractor markets across
the business reduces the relative volatility of earnings
through the various stages of the economic cycle.
We invest to rapidly build our own headcount, office
capacity and introduce new specialisms where and when
appropriate. Our investment approach is driven by the
long-term opportunity to reach significant scale where
we see the potential, as well as the shorter-term need to
deliver profits along the way.
We are now three years into our five-year plan to broadly
double and materially diversify the Group’s profits by
2018. We have a clear framework for how we prioritise
investment in order to build towards these aspirations,
outlined above. Our plan is underpinned by some clear
assumptions: a continued gradual economic recovery,
no material economic shocks or recessions in any of our
major markets and a modest acceleration of growth in
the outer two years of the plan.
We believe that hiring, training and developing the best
people in our industry is key to our success. We also think
that by equipping those people with the most advanced
tools and technology products, we can make them even
more effective and better serve our customers. We
recognise that our operating environment and the
demands of our customers is evolving constantly, with
new routes to market emerging and the amount and type
of data we need to interact with constantly increasing.
We are proactive in responding to these changes investing
in internal expertise, processes and technology as well as
seeking to form mutually beneficial external relationships.
Our business is highly cash generative with low capital
requirements and we have a clear policy in place when
It comes to shareholder distributions. We have a core
dividend which is set to a level which we believe to be
secure under all predictable scenarios, is well covered
by earnings and therefore appropriately reflects the
cyclicality inherent in our business. We also have a
long-standing goal of eliminating the Group’s net debt,
and building a net cash position of around £50 million.
Once this is achieved, we anticipate that any free cash flow
which is generated every year over-and-above this level
will be distributed to shareholders, assuming a positive
outlook, most likely in the form of a special dividend.
1. Materially increase and
diversify Group profits
3. Invest in people and
technology, responding
to change and build
relationships
4. Generate and distribute
meaningful cash returns
See also our Resources and relationships
section where we describe in detail how our
values give us a competitive advantage on
page 26
Timeline
Strategic priority Description
Hays plc | 2016 Annual Report and Financial Statements20
OUR STRATEGY
–– Further expansion of our temp/contracting business,
which now represents a material proportion of Group
net fee income
–– Material increase in the percentage of non-perm net fees
generated in the Group, excluding the UK, Germany and
Australia (from 22% in 2011 to 33% in 2016)
–– Successfully completed the integration of our
contractor-focused Veredus business and expanded
our footprint in the US by opening one new office
–– Three years into the plan period, we are in line with
where we expected to be at this stage
–– The mix of profitability is different to that which we
had assumed, but given the lack of visibility inherent
in our business, this was always likely to be the case.
In particular, after three years, the UK has
outperformed expectations
–– So far over the three years to date, we’ve experienced
material FX headwinds of £22 million in our
International business, but this has been mitigated
ahead-of-plan operating performance
–– There is material increased uncertainty in the UK
market as a result of the vote to leave the EU and this
is likely to have an impact on our UK earnings in the
current year, though it remains too early to fully
assess what that impact may be, and we will continue
to monitor activity levels closely
–– In our international businesses, where markets remain
supportive, we will continue to focus on driving fee
and profit growth as we work towards our objectives
–– We have continued to develop external relationships
across a range of areas, most recently with SEEK
in Australia, adding to existing relationships with
LinkedIn and Google, amongst others. We discuss
this more on page 30
–– We established a dedicated Data Analytics 
Marketing function, working alongside our existing
RD function and Corporate Development teams
–– We made further progress with a project to automate
our German back office, ensuring it is fit for purpose in
a growing contractor business, and could drive further
profit efficiencies in our business
–– We will continue to explore and develop mutually
beneficial relationships and partnerships with other
organisations, and further develop our internal
capabilities and expertise in terms of data science
and analytics, bringing those to bear to improve
our business efficiency and service to clients
and candidates
–– Further explore new and emerging business models
to ensure we understand all new market
opportunities, and ways to make our own business
more effective, as well as potential threats to our
existing model
–– Strong profit growth and a good underlying cash
performance meant that we achieved our long-
standing aim of eliminating the Group’s net debt
this year, finishing the year with a net cash balance
of £36.8 million, ahead of expectations
–– We increased the core dividend this year by 5%, with a
full year dividend of 2.90 pence, and cover of 2.9x EPS,
in line with our policy of building cover towards 3x
–– Once core dividend cover reaches 3x earnings, we
intend to grow the core dividend in line with growth
in earnings
–– Build our net cash position to £50 million. Once we
achieve this net cash position, it is our intention that
any excess cash that is generated over and above
this level will be distributed to shareholders, provided
our market outlook is positive
–– We will focus on organic growth and further investment
in headcount where conditions are supportive
–– Continue to expand the percentage of net fee
income generated outside of our largest businesses
(the UK, Germany and Australia)
–– Drive further growth in our contracting business in
newer markets and invest to grow the US business
Core profit drivers
These businesses
are, and will remain,
our largest profit
contributors.
Germany
United Kingdom
Australia
0-5 years
0-10 years
Ongoing
Future material
profit drivers
Each have the potential
to develop into significant
profit contributors.
France		 Japan
Canada		 US
Meaningful contributors
High quality businesses but market
size, or reinvestment to drive
growth, limits short-term profits.
Switzerland		 New Zealand
Belgium			 China
Brazil				 Mexico
Network critical
Vital to our global business,
serving clients and candidates
locally and cross-border and
developing people.
20 other countries
1
1
5
1
6
2
2
8
8
7
4
3
What we achieved in FY16 Our objectives for FY17 Link to relevant KPIs
Hays plc | 2016 Annual Report and Financial Statements21
OVERVIEW  STRATEGICREPORT  GOVERNANCE  FINANCIALSTATEMENTS  SHAREHOLDERINFORMATION
We earn fees on a
contingent basis, when
we successfully place a
candidate in a role with
a client. These fees, paid
by the client, are derived
as a percentage of the
candidate’s salary.
Our consultants develop
long-term relationships
with clients and candidates
to understand their local
markets and are equipped
with the latest technology,
tools and data to match
candidates to roles.
We understand the
needs and challenges
of our clients and
candidates locally and
employ the power of
our integrated global
business to meet them
quickly and effectively.
People and culture
Hays is the ultimate people business and as
such our ability to attract, develop, enable and
retain the very best consultants and managers
in our industry is vital to our success.
For more information go to page 26
Technology and data
Our sector-leading global technology platform
is able to interact with other applications
and third-party technologies to enable our
consultants to make sense of the vast amount
of data generated in today’s world, source
real-time, accurate information on their market
and ultimately to get the best candidates to
clients faster than anyone else.
For more information go to page 29
Brand
Our reputation as a world-leader in the
specialist recruitment market is supported
and reinforced by our world-class global
brand, which is consistent in each of our
markets around the world. We constantly
focus on building and enhancing our
reputation by supplementing our core
brand with thought-leadership publications,
such as The Hays Journal, Hays Global
Skills Index, salary guides, white papers
and market reports.
For more information go to page 30
Relationships and collaborations
Our philosophy is to form and maintain
strong relationships not only with
clients and candidates, but also with
other like-minded organisations,
creating mutually-beneficial
collaborations which help us better
understand and serve our customers.
For more information go to page 30
Environment and community
We believe that what we do makes a big
difference to the world around us. We
help hundreds of thousands of people
every year to secure the next leg on their
personal career journey, and companies
source the skilled employees they need
to grow. This all contributes to the wider
growth and success of the economies
and communities in which we operate.
For more information go to page 31
Our resources and relationships
What we need to make our
business model work
Hays plc | 2016 Annual Report and Financial Statements22
OUR BUSINESS MODEL
HOW IT WORKS
Macr
oeconomy
Competitiveen
vironm
ent
Recruitment market mega trends
Global integrated platform
Local expertise and delivery
Candidate
relationships
Understanding
client needs
Market
expertise
Data, tools
and products
Placing
people in roles
Clients
We work closely with our clients to help
them find the skilled people they need to
drive growth in their businesses. We work
with thousands of companies every year, with
no single client representing more than 1% of
Group net fees. Whether it is local SMEs or
global multinationals, we help companies deal
with skills shortages in certain markets, whilst
reshaping workforces in others.
Candidates
We help candidates securing their next
permanent job or temporary assignment.
We connect our candidates with the world
of work through an array of events, debates,
seminars and networking opportunities
across our network of 33 countries. Last year
we filled 67,000 permanent jobs and over
220,000 temporary assignments.
Employees
We invest a significant amount of time
and effort to ensure Hays is a great place
to work. We offer our consultants the best
training to become experts in their market
and develop their careers, along with the
best technology and tools in the industry
to enable them to be as productive and
successful as possible.
Shareholders
We are working towards our objective of
building the world’s pre-eminent specialist
recruitment business and in doing so we aim
to create long-term sustainable value for our
shareholders. The breadth, scale and balance
of our business model, together with our
industry-leading operating leverage, allow
us to deliver superior financial performance
through the cycle. This, combined with our
focus on working capital management and
the cash generative nature of our business,
means we have the potential to generate
meaningful shareholder returns as our
business grows.
How we create value
As the ultimate people business,
everything we do is focused on placing
the right people into the right roles
Stakeholder benefits
The value we create not only creates
returns for our shareholders, but
also for our other stakeholders
Hays plc | 2016 Annual Report and Financial Statements23
OVERVIEW  STRATEGICREPORT  GOVERNANCE  FINANCIALSTATEMENTS  SHAREHOLDERINFORMATION
A balanced and diverse model
We have deliberately and strategically built
a business which is balanced and diverse.
We have exposure to both more cyclical,
mature markets such as the UK and more
immature, structural growth markets such as
Germany. We are exposed to the temporary,
contractor and permanent recruitment
markets and have long-established scale
and expertise in 20 specialist areas of skilled
employment.
We have public sector and private sector
clients, and work on one-off placements for
SMEs and global multi-nationals as well as
contract-based higher volume recruitment
for our larger clients.
The balance, breadth and scale of our business
is unique in the world of specialist recruitment.
This is a key differentiator, and we believe
it is important as it makes our business
and its earnings relatively more resilient
to today’s ever changing macroeconomic
and political landscape.
Exposure to mature and less-mature markets
Structural growth markets are those where
the use of agencies like Hays to source
skilled candidates is a relatively new practice.
Traditionally in these markets, this recruitment
is undertaken by companies themselves,
using hiring teams within their own HR
functions. A key driver of our growth is
therefore the first time outsourcing of this
recruitment to third parties. This means that
these markets are relatively less cyclical by
nature, and less driven by the prevailing
economic backdrop, or short-term sentiment.
More mature markets are those where the
use of agencies is a well established, long-
standing norm. Here, clients will use agencies
to help them fill roles in the majority of cases.
As such, these markets tend to be more
cyclical in nature, with activity levels
dependant far more on the amount of job
churn occurring at any particular time. That is,
the confidence of clients to replace leavers in
their businesses, or hire extra people, and the
confidence amongst candidates to move jobs.
We have a business
with scale, breadth and
diversity of exposure,
which is built to take
into account the mega-
trends driving change
in our industry, the short-
term market movements
we experience and
positions us to work
towards our long-term
aims and strategy.
Hays plc | 2016 Annual Report and Financial Statements24
OUR BUSINESS MODEL
WHAT IT GIVES US
17%
Public
c.15%
Top 40
58%
Temporary
42%
Permanent
c.85%
Other clients83%
Private
22%
Asia Pacific
33%
UK and
Ireland
45%
Continental
Europe and
Rest of World
20%
Information
Technology
15%
Accountancy
and Finance
15%
Construction
and Property
8%
Office support
8%
Engineering
34%
Other
Structural/immature
39% Group net fees
Cyclical/more mature
61% Group net fees
32%
Temp
68%
Perm
11%
Temp
89%
Perm
88%
Temp
12%
Perm
65%
Temp
35%
Perm
44%
Temp
56%
Perm
57%
Temp
43%
Perm
LatAm, Russia 
CERoW
Asia Germany Australia  New ZealandFrance, US, Canada
 Netherlands
UK  Ireland
0-30% market penetration 30-70% penetration 70% penetration
Balanced exposure across markets is key to our model
Breadth of expertise
Net fees by geography, type and market maturity
Hays plc | 2016 Annual Report and Financial Statements25
OVERVIEW  STRATEGICREPORT  GOVERNANCE  FINANCIALSTATEMENTS  SHAREHOLDERINFORMATION
People and culture
Hays is the ultimate people business and
our ability to attract, retain and develop
the best people is vital to our success.
To achieve this we focus on:
–– reward, with commission structures
to ensure that team and individual
contributions are competitively rewarded;
–– providing attractive career development
paths for new recruits, starting with
a structured induction programme
and ongoing training as they progress
their careers;
–– equipping consultants with the latest
technology, tools and products and
embrace digital technology as an
enabler to make them as effective
as possible;
–– encouraging employees to develop
their careers by moving internationally;
–– continually investing in our leadership
and development programmes which
are aligned with the Group’s business
strategy. 240 senior managers have
now attended our ‘Fast Forward’ and
‘Advanced Management Development’
programmes; and
–– promoting a strong sense of corporate
social responsibility at Hays. After all,
everything we do contributes to finding
people jobs, changing people’s lives,
and fuelling the wider economy. CSR
is embedded in our academically
recognised leadership development
programme in which a cadre of senior
leaders work with a charity to solve real
strategic problems.
Hays programmes to boost performance
and recognise achievement include:
–– our international ‘Hays Elite’ competition
which rewards the 50 top fee-earners
from around the world with company-
wide recognition and an all-expenses
paid trip to a popular holiday destination;
–– our ‘Summer Boot Camp’ where
consultants are invited to enlist for
a 12-week ‘workout’ and complete
designated activities to boost their
fees by 20% and qualify for attendance
at a prestigious finishing event; and
–– monthly themed ‘National Business
Development Days’ on which
consultants compete to see who can
generate the most new business leads.
In this section we
discuss the drivers of our
business: the resources
and relationships we
have around the world.
Achieving our goals requires a mixture of
components all working together. Key to our
success is our ability to attract the very best
talent and provide an attractive career path
that will make them experts in their fields.
We also equip our consultants with a
powerful, global brand and with sector-
leading technology tools and products
so that they can interact with clients and
candidates in multiple ways, using various
different channels. Our philosophy is not just
to invest in technology solutions, but more
importantly to build strong collaborations
with leading providers and innovators
and influential organisations, creating
long-term relationships which help us
better understand our markets and serve
our customers. All of this is key to enabling
our model to function, and our ability to
respond to a fast-moving market and
deliver on our strategic aims.
Formal training days last year
4,000
Hays plc | 2016 Annual Report and Financial Statements26
OUR BUSINESS MODEL
OUR RESOURCES AND RELATIONSHIPS
After spending the first three years of my
Hays career in the UK, I took the opportunity
to move to Australia in 1998, where I worked
across various different specialisms, firstly
in Sydney and then Perth. After 11 years
in Australia, I was promoted to be the
Managing Director of our new business
in Japan. This was an exciting opportunity,
given the relative immaturity of the market
there, which is a key strategic growth
business for the Group. Since 2012 I’ve seen
my role expand to cover the whole of the
Asia region reporting into the Group CEO,
with the task of overseeing Hays’ organic
expansion in one of the most exciting,
fast-growing markets in the world.
Christine Wright
Asia Managing Director, Hays
I joined Hays in 2008, as an Associate on the
Construction  Property desk in Melbourne.
Following the acquisition of Veredus, in
the US, in 2014, an opportunity arose to
establish and build a team focused on the
Construction  Property market in Orlando,
Florida, a large and established Veredus
office. I took on a Senior Manager role
there, and have responsibility for building
a market-leading business in an area which
is new for us in the USA, but in which we
are expert global leaders across the rest
of our Group. It’s also an exciting challenge
to take experiences I gained in more
established parts of the Group and apply
them in a new country for our business.
Shen Walker
Senior Manager, Hays US
My Hays career has taken me across three
countries and has been a fulfilling and
a varied one. I began in London in 1995,
before moving to Dublin a year later to help
expand the Irish business. Having proven
my capabilities I was quickly promoted to
regional manager and I was then asked to
join a task force of fee-earners to lead Hays’
entry into the Canadian market in 2001.
I then returned to Hays in Ireland in
2004, but not long after that I had the
opportunity to return to Canada and
make a contribution on a much bigger
scale as Managing Director.
Rowan O’Grady
Canada Managing Director, Hays
People and culture case study:
ATTRACTING,
MOTIVATING AND
RETAINING THE BEST
PEOPLE AT HAYS.
Individuals relocated internationally
within our business in the last three years
175
Hays plc | 2016 Annual Report and Financial Statements27
OVERVIEW  STRATEGICREPORT  GOVERNANCE  FINANCIALSTATEMENTS  SHAREHOLDERINFORMATION
1.
2.
1. Male 6 (67%)
2. Female 3 (33%)
1.
2.
1. Male 46 (73%)
2. Female 17 (27%)
1.
2.
1. Male 3,528 (38%)
2. Female 5,686 (62%)
Diversity at Hays
At Hays, diversity means understanding
and reflecting the community in which
we operate, building loyalty with our
colleagues, candidates and clients.
Differences such as age, gender, ethnicity,
physical appearance, religion, education
and beliefs are valued and everyone has
the opportunity to contribute to the
Company and fulfil their potential.
Respect for people and becoming an
‘Employer of Choice’ are the core values
in our approach. Our aim is to create an
open, honest and unprejudiced working
environment and to ensure that all our
colleagues feel part of Hays and are
respected as individuals.
We value and utilise the differences that
our people bring to our business and in
the competitive environment in which we
operate it is essential that we attract and
retain the best people and those that
reflect the client and candidate groups
we serve.
At Hays, our culture is meritocratic; we
share a passion for creating opportunities
for our people to flourish and succeed,
whatever their background. We know that
diversity of perspective and an inclusive
approach is great for business and careers
with us. By reflecting our marketplace and
embracing difference we can continue to
drive an outstanding organisation culture
that impacts business results and delivers
world-class service to our customers.
Fundamental to our leading expertise
is a shared commitment to equality and
to harnessing the dynamism that diversity
and inclusion bring to our workplace.
We were named as one of the Best
Places to Work in the UK
In the 2016 Glassdoor Employees’ Choice
Award we ranked second overall in the Best
Places to Work, and the top rated recruiter
listed. The Employees’ Choice Awards
programme relies solely on the input of
employees, who provide feedback on their
jobs, work environments and companies
via Glassdoor’s anonymous online company
reviews survey.
Gender diversity within Hays
Split of PLC Board members
Split of Senior Management
team members
Split of employees
Glassdoor Employees’
Choice Award winners
We were named as one of
the Best Places to Work in
the UK in 2016.
No.2
Hays plc | 2016 Annual Report and Financial Statements28
OUR BUSINESS MODEL
OUR RESOURCES AND RELATIONSHIPS
CONTINUED
Technology and data
In today’s digitally-enabled and data-rich
world it is essential that we equip our people
with the latest technology tools and
products to maximise their productivity
and to ultimately get the best candidates
to clients faster than anyone else.
Use of data
The amount and variety of data that
is being generated in our industry has
increased exponentially over recent years.
We now receive over six million CVs a year
and around three million hits on our jobs
websites every month. Capturing, analysing
and making sense of this wealth of data has
become a strategic imperative.
Clients and candidates interact with us in
multiple and evolving ways, using various
channels and it is part of our philosophy
to recognise and quickly respond to these
trends. For example, candidate profiles
have moved away from traditional printed
formats, first to email and now increasingly
onto various social media platforms. We
have responded to this online world, but
equally we recognise that data must be
managed in an integrated manner with our
own proprietary database, OneTouch, to
give us a competitive edge. This is why we
ensured that OneTouch was built not only
to be fully integrated internally within our
business, but that it would also have the
ability to interact and connect with external
platforms, as they evolve.
This not only enables us to have an up-to-
date list of active candidates ready to be
placed into jobs, but also to maintain
relationships with the passive candidate pool.
At the heart of our business is the protection
of candidate personal data and client
confidential information. We respect the
trust individuals and companies place in us
to look after the information they provide
us on a daily basis. Hays has systems and
processes in operation to best ensure that
this information is held and transferred,
where appropriate, in a secure manner. Hays
recognises the importance of complying
with all relevant data protection and privacy
laws in each of our local markets.
As well as investing in technology solutions
for the front office, we also recognise the
importance of having a largely-automated
back office, which has driven significant
financial benefit to the profitability of the
Group. Equally important is having access
to our real-time, detailed management
information system, which allows
management teams to make accurate
and timely business decisions.
Capturing,
analysing and
making sense of this
wealth of data has
become a strategic
imperative
Hays plc | 2016 Annual Report and Financial Statements29
OVERVIEW  STRATEGICREPORT  GOVERNANCE  FINANCIALSTATEMENTS  SHAREHOLDERINFORMATION
Key relationships and
collaborations
We believe that it is important to be
outward-looking and to develop strong
relationships not only with clients
and candidates, but also with other
organisations, where we see an
opportunity to deliver mutual benefit.
Our long-standing arrangement with
Google allows our consultants to index
20 million documents across 33 countries
in real time, giving us a competitive
edge when it comes to sourcing the
perfect candidate for any given role.
Our relationship with LinkedIn means
that our consultants have access to
LinkedIn’s member database so they
can search LinkedIn and our own
database, OneTouch, side-by-side.
This Cross System Awareness allows us
to connect millions of people globally
with relevant job opportunities, materials
and employment-related content. Most
recently, we have partnered with SEEK,
the world’s biggest online employment
marketplace, to create a leading and
innovative position in the use of cloud-
computing and data science in the
recruiting industry, bringing value to
hirers and jobseekers alike. Additionally,
we recognise that there are a number of
smaller, innovative organisations that are
working on developing new technology
solutions to challenge and improve the
landscape of the recruitment world. We
are a committed partner to Seedcamp,
a pan European Founder’s First Round
Fund, helping to identify and support
the next generation of market leaders
powering the world of work.
Our relationships are not limited to the
technology sector however. We have been
working with research consultancy Oxford
Economics since 2012 to develop the Hays
Global Skills Index, an annual Index that
looks at the labour market dynamics
across 31 countries, giving a clear picture
of the dynamics that are playing a role
in the global labour markets and the
changing nature of the global skills
landscape. We have also been a strategic
partner of the CBI’s Annual Conference
since 2013. The CBI is the UK’s premier
business lobbying organisation. Its
flagship event, the Annual Conference,
attracts over 1,000 influential business
professionals and political leaders to
discuss the state of the economy and
the most critical issues affecting global
business today.
LinkedIn followers
over1.4million
Twitter followers
75,000
Facebook likes
80,000
Brand
We have focused on building the reputation
of Hays as the respected industry standard
in the specialist recruitment market, and
also as being the leading commentator
on issues impacting the world of work.
Our brand lies at the heart of
everything we do
We have been building wider recognition
and awareness of Hays as a market leader
through partnerships with the CBI and
Manchester City Football Club, amongst
others, and by building a portfolio of high
quality and respected publications that
demonstrate the thought-leadership
credentials of Hays and our people.
These include the Hays Journal, the Hays
Global Skills Index as well as white papers
and industry-leading content that we publish
via our corporate blog, Viewpoint, and on
social media platforms such as LinkedIn,
where Hays is the most followed recruitment
company, with over 1.4 million followers.
We believe that establishing a powerful,
global brand helps us drive net fee income,
as it opens doors for our consultants
and makes it easier for them to build
relationships. People also aspire to work for
the leading brand in any industry sector, so
the strength of our brand helps us attract
the very best new recruits to join Hays.
Hays plc | 2016 Annual Report and Financial Statements30
OUR BUSINESS MODEL
OUR RESOURCES AND RELATIONSHIPS
CONTINUED
Environment and community
Human rights
At Hays we are committed to our Code of
Conduct and Ethics Policy which reflects
the way we operate including in relation
to human rights. All staff within Hays are
expected to act with integrity and honesty
and behave in a way that is above reproach,
as well as treat people fairly, with courtesy
and respect, be responsible, respect
diversity and communicate openly.
Included in our Code of Conduct is an Equal
Opportunity Policy. We make every effort
to ensure that no discrimination arises
during the recruitment, employment and
period after employment of any employee
for reasons of gender, sexual orientation,
marital status, creed, colour, race, nationality,
ethnic or national origin, religious or other
belief, political opinion, spent convictions,
disability or age, and all employees are
expected to deal with all persons with the
same attention, courtesy and consideration.
This support of equal opportunities applies
not only as a direct employer but also in
our introduction of candidates to clients.
Supplier Code of Conduct
We expect our suppliers to operate
in an ethical, legally compliant and
professional manner.
The standards we expect are detailed in our
Supplier Code of Conduct, a copy of which
can be found on our website, haysplc.com.
Community support
As the ultimate people business, our
employees are keen to support their local
communities and charities in any way they
can. This effort is operated on local and
national levels to great effect through
volunteering, fundraising activities and
donations. The many activities undertaken
during the year include collections and
fundraising to provide food for those at risk
of social exclusion in Spain and to refugees
in Germany; a five city cycle ride, over
700km, in Ireland for charity partner Aware;
various sporting and other fundraising
activities for Make-A-Wish Australia;
supporting young people living with cancer
in New Zealand; and funding 6,000 hours
of children’s hospice care in the UK for
charity partner Together for Short Lives,
exceeding our two-year fundraising target
in the first year of our partnership.
The environment in which we work
Hays in the UK has ISO 14001
environmental management certification,
which demonstrates our commitment
to environmental management.
Hays gathers data from every office
around the world in order to calculate
our greenhouse gas (GHG) emissions
in accordance with the World Resources
Institute (WRI) Greenhouse Gas Protocol.
Our data is independently verified by
Carbon Smart Ltd who conduct the
verification engagement in accordance
with the ISO 14064 part 3 standard with
guidance for the validation and verification
of greenhouse gas assertions.
We measure our annual emissions in
relation to employees (our ‘intensity ratio’).
As a people-based business, number of
employees is a quantifiable factor associated
with our activities. Our reporting year for
GHG emissions is 1 April 2015 to 31 March
2016, and this year our employee intensity per
tonne CO2e was 1.58 (against 1.98 last year).
Every day we provide our clients
and candidates around the world with
industry-leading content, with the aim
of helping them to succeed in their
careers and source the right talent
for their businesses. The key platform
which enables us to do this is Viewpoint,
our global careers advice blog.
Viewpoint currently hosts over 500
blogs, authored by over 30 experts
from various fields.
Last year, our content generated over
855,000 views and almost 200,000
social shares. By sharing our targeted
and relevant content with our audience
this way, we are able to both demonstrate
the expertise of our people and strengthen
the unique positioning of our brand.
Impact Scope Resource
2016 2015
Total
GHGs
(tonnes
CO2e)(1)
%
contribution
to total
Total
GHGs
(tonnes
CO2e)(1)
%
contribution
to total
Direct Scope 1 Operational fuel 245 2 199 1
Vehicle fuel 4,331 28 4,201 24
Refrigerant 344 2 264 2
Indirect Scope 2 Electricity(2)
5,775 38 6,546 37
District heating 396 2 370 2
Scope 3 Air travel 3,219 21 4,569 26
Rail travel 329 2 611 3
Electricity TD losses 570 4 602 3
Private cars (business use) 153 1 377 2
Total direct and indirect 15,362 100 17,739 100
(1)	Greenhouse gas emissions are stated in tonnes of CO2e (carbon dioxide equivalent, comprising carbon
dioxide, methane and nitrous oxide) for the 12-month period ended 31 March 2016. Out of scope Indirect
emissions, which were the biogenic part of vehicle fuels, totalled 167 tonnes of CO2e (106 tonnes in FY15).
(2)	All electricity totals are calculated using 2015 government location-based conversion factors.
Brand case study:
BUILDING A
BRAND THAT
PEOPLE LOVE.
Hays plc | 2016 Annual Report and Financial Statements31
OVERVIEW  STRATEGICREPORT  GOVERNANCE  FINANCIALSTATEMENTS  SHAREHOLDERINFORMATION
2016
2015
2013
2014
7
9
-1
5
2016
2015
2013
2014
83
84
84
85
Our long-term aim is
to be the undisputed
leader in global specialist
recruitment. Along the
way, we are focused on
delivering well-diversified,
profitable and cash-
generative net fee growth.
We measure our progress
in this respect, as well
as against our areas of
operational focus, using
a series of KPIs.
Why we have chosen these KPIs
We have chosen a range of KPIs which are
both financial and non-financial. They are
focused on the overall Group financial
performance, as well as changes we are
making within the Group, such as the
internationalisation of the business. As well
as growth, we measure KPIs which illustrate
the efficiency of our operations, such as the
Conversion Rate and Cash Conversion.
As we work towards our aims, and the
shape and size of our business, or our strategic
priorities evolve, then our KPIs will evolve too.
Measured against our strategy
We clearly link each of our KPIs to our four
strategic priorities, which are outlined on
page 20.
Strategic priority 1:
Materially increase and diversify group profits
Strategic priority 2:
Build critical mass and diversity across our
global platform
Strategic priority 3:
Invest in people and technology, responding
to change and build relationships
Strategic priority 4:
Generate and distribute meaningful
cash returns
On page 68 we reference how we link our
strategic priorities and KPIs to the Group’s
remuneration policy.
(1)	LFL (like-for-like) growth represents organic growth
of continuing operations at constant currency.
Measure
How the Group’s business is developing
and growing over time, measured as net
fee growth on a constant currency basis.
Progress made in 2015–16
We delivered good net fee growth of 7%(1)
,
primarily driven by our European businesses.
The rate of growth slowed versus last year
due mainly to slower growth in the UK.
Link to relevant strategic priority
1. Like-for-like net fee growth (%)
Measure
Based on the results of our internal employee
engagement survey which tracks their sense
of belonging, discretionary effort, personal
motivation and job satisfaction.
Progress made in 2015–16
Over 80% of our employees again engaged
in our annual TALKback survey this year,
reflecting our continuous efforts to focus
on employee training, retention and
effectiveness. See overleaf for more
detail on this process.
See case study on page 34
Link to relevant strategic priority
5. Employee engagement (%)
1
3
2
Hays plc | 2016 Annual Report and Financial Statements32
KEY PERFORMANCE
INDICATORS
2016
2015
2013
2014
66
64
69
66
2016
2015
2013
2014
128
127
123
127
2016
2015
2013
2014
539
492
497
479
2016
2015
2013
2014
22.3
21.5
17.5
19.4
2016
2015
2013
2014
14
21
-6
19
2016
2015
2013
2014
88
116
109
125
Measure
The Group’s relative exposure to markets
which are typically more immature and
underpenetrated than the UKI, calculated
as the percentage of non-UKI net fees.
Progress made in 2015–16
66% of Group net fees were generated
outside of the UKI this year, led by a
material increase in net fee coming from
our European businesses.
Link to relevant strategic priority
2. Proportion of Group net fees generated
by our international business (%)
Measure
The productivity of the Group’s fee earners.
Calculated as total Group net fees divided
by average consultant numbers.
Progress made in 2015–16
Group like-for-like(1)
net fees per consultants
increased by 1% in the year. In the UK
productivity rose by 2%, driving excellent
operating leverage and profit growth.
Link to relevant strategic priority
6. Like-for-like net fees per consultant
(£000s)
Measure
The absolute scale of the non-UKI
businesses in net fee terms (Asia Pacific
and Continental Europe  RoW).
Progress made in 2015–16
Like-for-like(1)
net fees in the international
business grew by 13% in the year. Australia
continued to grow, and we saw strong,
broad-based growth across many European
markets and much of the Americas.
Link to relevant strategic priority
3. Headline international net fee base (£m)
Measure
Calculated as operating profit divided by net
fees. Measures the Group’s effectiveness in
managing our level of investment for future
growth and controlling costs.
Progress made in 2015–16
Conversion rate improved to 22.3% as
a result of this good net fee growth, the
ongoing benefit of our largely automated
back office platform and our continued
strong control of operating costs.
Link to relevant strategic priority
7. Conversion rate (%)
Measure
The underlying profitability of the Group,
measured by the Earnings per share of the
Groups continuing operations.
Progress made in 2015–16
Basic earnings per share increased by 14%
to 8.48 pence, reflecting the Group’s higher
operating profit and lower effective tax rate.
Growth slowed on last year primarily due to
the lower rate of profit growth in the UK.
Link to relevant strategic priority
4. Basic continuing earnings per
share growth (%)
Measure
The Group’s ability to convert profit into
cash. Calculated as cash generated by
operations as a percentage of operating
profit from continuing operations.
Progress made in 2015–16
88% cash conversion was a result of good
working capital management, especially
considering the strong growth of our
working-capital intensive German
contracting business, and the reversal
of an FY15 £20 million benefit due to the
favourable day on which that year end fell.
Link to relevant strategic priority
8. Cash conversion (%)
1
1 1 4
122
3
Hays plc | 2016 Annual Report and Financial Statements33
OVERVIEW  STRATEGICREPORT  GOVERNANCE  FINANCIALSTATEMENTS  SHAREHOLDERINFORMATION
Employee engagement KPI case study:
SUSTAINING HIGH
ENGAGEMENT
AT HAYS.
Hays plc first implemented TALKback – our
global employee engagement survey – in
2009. The survey tracks our employees’
sense of belonging, discretionary effort,
personal motivation and job satisfaction.
Hays is a cyclical business and constantly
exposed to the prevailing economic climate.
It is therefore essential that we maintain
engagement to ensure retention and
productivity. Despite the amount of change
that employees have experienced since 2009
for instance with new systems and ways of
working, as well as fast changing economic
environments, continued high levels of
individual engagement and performance have
enabled Hays to outperform our competitors
and retain our position as the market leader
in specialist recruitment services.
Employee engagement is a key performance
indicator which measures our success in
attracting, training and developing people.
Therefore a primary objective for Hays has
been to sustain this high level of engagement
across all regions – a challenge that has
spawned a multitude of approaches to
achieving ongoing employee commitment
and driving performance.
Results
In 2016 our global engagement score
was 83% and employee participation in
the annual TALKback survey was 84%,
which is an excellent response rate for
an international support services business.
There is a clear
focus on culture,
quality of leadership
and reward.
Hays plc | 2016 Annual Report and Financial Statements34
KEY PERFORMANCE
INDICATORS
CONTINUED
1. 3. 4. 5. 6. 7.2.
1. Construction 
Property 21%
2. Accountancy 
Finance 14%
3. Office Support 11%
4. IT 11%
5. Sales  Marketing 6%
6. Resources 
Mining 3%
7. Other 34%
1. Australia 69%
2. Japan 9%
3. New Zealand 7%
4. China 6%
5. Singapore 4%
6. Hong Kong 4%
7. Malaysia 1%
2. Perm 48%1. Temp 52%
2. Public sector 26%1. Private sector 74%
Net fees by specialism
1. 3. 4. 5. 6. 7.2.
Net fees by country
1. 2.
1. 2.
Net fees by contract type
Net fees by sector
Facts and figures Hays is the market-leading
specialist recruitment
company in Australia,
having been a pioneer
of the industry in the
country since 1976.
In Asia Pacific, net fees decreased by 1% (but
increased 4% on a like-for-like basis(1)
) to £176.1
million and operating profit increased 1% (up
8% on a like-for-like basis(1)
) to £50.2 million,
representing a conversion rate of 28.5% (2015:
27.8%). The difference between actual growth
and like-for-like growth rates is primarily the
result of the depreciation in the average rate
of exchange between the Australian Dollar and
Japanese Yen versus sterling during the year,
which reduced net fees in the division by £9.4
million and operating profits by £3.4 million.
In Australia  New Zealand net fees were up
4%(1)
and operating profit was up 8%(1)
. Our
Perm business grew by 5%(1)
and Temp, which
represented 65% net fees in the year, grew by
4%(1)
. In Australia we delivered good net fee
growth of 5%(1)
, with market conditions and
performances varying between states and
specialisms. Our largest regions of New
South Wales and Victoria, which accounted
for 56% of Australia net fees, were up 12%(1)
,
and ACT delivered excellent growth of 21%(1)
,
driven by continued strength in our public
sector business.
Western Australia was down 33%(1)
as
reduced activity in the Resources  Mining
sector continued to significantly impact
trading across the state, although we were
sequentially stable in the latter part of the
year. Excluding Western Australia, net fees
in Australia were up 11%(1)
, with activity led by
the technical specialisms such as Construction
 Property, our largest specialism, which was
up 9%(1)
and IT, up 10%(1)
. Overall, our public
sector business delivered growth of 18%(1)
,
while the private sector declined by 2%(1)
. Net
fees in New Zealand were flat(1)
in the year.
In Asia, which accounted for 24% of the
division’s net fees, we delivered solid net fee
growth of 4%(1)
and operating profits increased
by 10%(1)
to £6.2 million. Overall market
conditions worsened as the year progressed,
particularly in the banking sector. Despite this,
net fees increased by 4%(1)
in Japan, 12%(1)
in
China, 3%(1)
in Hong Kong and 7%(1)
in Malaysia,
with all four countries posting record net
fees for the year. In Singapore net fees were
down 7%(1)
.
Consultant headcount in the Asia Pacific
division increased by 1% year-on-year.
Consultant headcount in Australia 
New Zealand increased by 5%. In Asia,
consultant headcount fell by 6% during the
year as we responded to more challenging
market conditions.
Operating performance
Year ended 30 June 2016 2015 Actual growth LFL growth(1)
Net fees (£m) 176.1 178.5 (1%) 4%
Operating profit (£m) 50.2 49.7 1% 8%
Conversion rate(2)
28.5% 27.8%
Period-end consultant headcount(3)
1,210 1,195 1%
(1)	 LFL (like-for-like) growth represents organic growth of continuing operations at constant currency.
(2)	Conversion rate is the proportion of net fees converted into operating profit (before exceptional items).
(3)	Closing consultant headcount as at 30 June.
Consultants
1,210
2015: 1,195
Offices
49
2015: 45
Net fees (£m)
176.1
2015: 178.5
Operatingprofit (£m)
50.2
2015: 49.7
Australia
delivered good
net fee growth led
by excellent public
sector growth
Hays plc | 2016 Annual Report and Financial Statements35
OVERVIEW  STRATEGICREPORT  GOVERNANCE  FINANCIALSTATEMENTS  SHAREHOLDERINFORMATION
DIVISIONAL OPERATING REVIEW
ASIA PACIFIC
1. 3. 4. 5. 6. 7.2.
Net fees by specialism
1. 3. 4. 5. 6. 7.2.
Net fees by country/sub-group
1. 2.
Net fees by contract type
1. 2
Net fees by sector
1. Germany 48%
2. France 11%
3. Benelux 8%
4. USA 7%
5. Switzerland 5%
6. Canada 4%
7. Other 17%
1. IT 32%
2. Engineering 18%
3. Accountancy 
Finance 12%
4. Construction 
Property 9%
5. Life Sciences 7%
6. Sales  Marketing 4%
7. Other 18%
2. Perm 38%1. Temp 62%
2. Public sector 3%1. Private sector 97%
Facts and figures We entered the German
market in 2003 and we
have built a business that is
today our largest contributor
to Group operating profits.
It still represents a unique
structural opportunity for
Hays and our focus remains
on making Germany a
£100 million operating
profit business.
In Continental Europe  RoW, we delivered
excellent net fee growth of 16% (15% on a
like-for-like basis(1)
) to £362.5 million, driving
strong operating profit growth of 15% (16%
on a like-for-like basis(1)
) to £78.7 million.
The difference between actual and like-for-
like growth rates is primarily the result of
the depreciation in the average rate of
exchange between the Euro versus sterling,
which reduced net fees by £6.9 million
and operating profit by £1.1 million. The
conversion rate of the division at 21.7% (2015:
21.9%), reduced slightly as we continued to
invest in new consultant headcount, notably
across several continental European markets,
including Germany and France and in the US.
In Germany, which represented 48% of the
division’s net fees, we saw an acceleration in
growth to 13%(1)
and an all-time net fee record
performance in the year. Growth was strong
across Contracting and Temp, which together
grew by 12%(1)
, while Perm net fees grew by
an excellent 24%(1)
. We saw strong growth in
our newer specialisms, which now represent
27% of Germany net fees, particularly
Accountancy  Finance, Sales  Marketing
and Legal which all grew by more than 10%(1)
.
Net fees in IT, which represents 42% of
Germany business, grew by 16%(1)
and net fees
in Engineering increased by 8%(1)
. Consultant
headcount was up 11%(3)
year-on-year as
we invested significantly to continue to
build critical mass and scale in our IT and
Engineering specialisms as well as expanding
our offering to our mid-size client base.
Across the rest of the division, net fees were
up 17%(1)
and operating profit increased by
£5.7 million(1)
. In France, our second largest
country in the division, we grew 17%(1)
and posted an all-time record net fees
performance, outperforming the market
and taking clear market share. In addition,
we delivered strong growth and all-time record
net fee performances in each of Switzerland,
up 19%(1)
, Belgium, up 20%(1)
and Spain,
up 34%(1)
.
In North America, our US business delivered
strong net fee growth of 15%(1)
, while our
business in Canada was flat(1)
, due primarily
to continued challenging conditions in the
resources-focused regions. In Latin America,
Chile, Colombia and Mexico all continued to
perform well, delivering strong growth. In
Brazil, although market conditions remained
challenging, net fees were flat(1)
, and we
returned to growth in the second half.
Within the division, 11 countries delivered net
fee growth of 20%(1)
or more, and the region
as a whole delivered an all-time record net
fee performance.
Consultant headcount in the division increased
by 12%(3)
year-on-year, including increases
of 11%(3)
in Germany and 10% in France.
Operating performance
Year ended 30 June 2016 2015 Actual growth LFL growth(1)
Net fees (£m) 362.5 313.8 16% 15%
Operating profit (£m) 78.7 68.7 14% 16%
Conversion rate(2)
21.7% 21.9%
Period-end consultant headcount(3)(4)
3,034 2,715 12%
(1)	 LFL (like-for-like) growth represents organic growth of continuing operations at constant currency.
(2)	Conversion rate is the proportion of net fees converted into operating profit (before exceptional items).
(3)	Closing consultant headcount as at 30 June.
(4)	Consultant headcount at June 2015 has been restated to include 144 resourcers previously not reported
as consultants in Germany and Switzerland.
Consultants
3,034
2015: 2,715
Offices
103
2015: 96
Net fees (£m)
362.5
2015: 313.8
Operatingprofit (£m)
78.7
2015: 68.7
Strong broad-
based growth across
many European
markets and much
of the Americas
Hays plc | 2016 Annual Report and Financial Statements36
DIVISIONAL OPERATING REVIEW
CONTINENTAL EUROPE  REST OF WORLD
1. 3. 4. 5. 6. 7.2.
Net fees by specialism
1. 3. 4. 5. 62.
Net fees by region
1. 2.
1. 2.
1. London 35%
2. North  Scotland 25%
3. Midlands 
East Anglia 17%
4. Home Counties 11%
5. South West 
Wales 9%
6. Ireland 3%
1. Accountancy 
Finance 21%
2. Construction 
Property 19%
3. Office Support 11%
4. Education 10%
5. IT 9%
6. Banking  Financial
Services 9%
7. Other 21%
2. Perm 43%1. Temp 57%
2. Public sector 28%1. Private sector 72%
Net fees by contract type
Net fees by sector
Facts and figures We entered our home
market in 1968 and
today we are the leading
specialist recruiter in what
is the world’s most mature
and competitive market.
In the United Kingdom  Ireland we
delivered an excellent profit performance,
with operating profit up 14%(1)
to £52.1
million (2015: £45.7 million) as a result of
a combination of further improvements in
the productivity of our consultants, which
increased by 2%(1)
, and active cost control
throughout the business. This is despite the
fact that net fees were flat(1)
at £271.7 million.
As a result, the conversion rate of the United
Kingdom  Ireland increased to 19.2% (2015:
16.8%). Our Temp business decreased by
1%(1)
, largely as a result of a more challenging
public sector market, while Perm grew 2%(1)
.
We saw more uncertainty across the
UK market, notably in the second half,
as increased risks regarding the
macroeconomic outlook impacted negatively
on private sector sentiment, especially
amongst clients. This uncertainty increased
in the period leading up to, and immediately
after, the EU Referendum and we saw
activity levels weaken significantly at the
end of the financial year.
Against this backdrop, our private sector
business, which represented 72% of the
division’s net fees, grew 2%(1)
, while net
fees in our public sector business decreased
by 4%(1)
as conditions became increasingly
challenging in that market, particularly
in local Government and Healthcare
focused markets.
Over the course of the year, London ex-City
grew 11%, with mid-single digit growth in
Scotland, the North and the Midlands. Our
City business was down 3%, with a tough
banking market. In Ireland our business
delivered excellent net fee growth of 24%(1)
.
At the specialism level, Office Support
delivered good growth of 6%(1)
, IT grew
3%(1)
while Banking, where markets remain
difficult, decreased by 12%(1)
. Net fees across
the rest of our major specialisms, including
Accountancy  Finance and Construction
 Property, performed in line with the
overall UK  Ireland business and were
broadly flat(1)
, although we saw trends
weakening towards the end of the financial
year, particularly in our Construction 
Property business.
Consultant headcount in the division was
down 8% year-on-year (average consultant
headcount down 2%), all by natural attrition,
as we reacted to the decrease in activity
levels and focused on consultant
productivity, cost control and maximising
our UK  Ireland financial performance.
Operating performance
Year ended 30 June 2016 2015 Actual growth LFL growth(1)
Net fees (£m) 271.7 271.9 0% 0%
Operating profit (£m) 52.1 45.7 14% 14%
Conversion rate(2)
19.2% 16.8%
Period-end consultant headcount(3)
2,024 2,203 (8%)
(1)	 LFL (like-for-like) growth represents organic growth of continuing operations at constant currency.
(2)	Conversion rate is the proportion of net fees converted into operating profit (before exceptional items).
(3)	Closing consultant headcount as at 30 June.
Consultants
2,024
2015: 2,203
Offices
100
2015: 99
Net fees (£m)
271.7
2015: 271.9
Operating profit (£m)
52.1
2015: 45.7
Excellent
operating leverage
drives strong
profit growth
Hays plc | 2016 Annual Report and Financial Statements37
OVERVIEW  STRATEGICREPORT  GOVERNANCE  FINANCIALSTATEMENTS  SHAREHOLDERINFORMATION
UK  IRELAND
Introduction
Turnover for the year to 30 June 2016 was
up 10% (12% on a like-for-like basis(1)
) and net
fees increased by 6% (7% on a like-for-like
basis(1)
). Growth in turnover exceeded
growth in net fees due to a large number
of MSP contracts won in the year primarily in
Germany, where we inherited a large number
of long-term contractors/interims previously
paid directly by the client. Operating profit
increased by 10% (13% on a like-for-like
basis(1)
). Exchange rate movements
decreased net fees and operating profit by
£16.4 million and £4.5 million respectively,
primarily as a result of a material
depreciation in the average rate of exchange
of the major currencies to which the Group
has exposure versus sterling, most notably
the Australian Dollar and the Euro which
remain significant sensitivities for the Group.
Operating costs were 5% higher than prior
year (5% higher on a like-for-like basis(1)
),
primarily due to a rise in commission
payments in line with net fees and costs
associated with the 6% average increase
in Group consultant headcount.
For more information on our strategy go to
page 20
Performance highlights
Strong 13%(1)
operating profit growth, with
a 40%(1)
drop-through of incremental net
fees into operating profit
Sector-leading conversion rate, the
proportion of net fees converted into
operating profit, further improved by
80 basis points to 22.3%
Consultant headcount up 3%(3)
, with targeted
investment in markets such as Europe and
the USA partially offset by reductions in the
UK, all through natural attrition
Good underlying cash performance with 88%
conversion of operating profit into operating
cash flow driving the elimination of net debt,
with year-end cash position of £36.8 million
Strong EPS growth of 14%, reflecting strong
operating profit growth and lower effective
tax rate
Full year dividend up 5% to 2.90 pence,
with cover of 2.9x, in line with our strategy
to build cover towards 3.0x earnings
Increase in Group
net fees(1)
+7%
2015: +9%
Conversion rate of
Group net fees into
operating profit(2)
+22.3%
2015: +21.5%
Increase in
operating profit(1)
+13%
2015: +25%
Group consultant
headcount up 3%(3)
year-on-year
6,268
2015: 6,113
Hays plc | 2016 Annual Report and Financial Statements38
FINANCIAL REVIEW
Paul Venables
Group Finance Director
The Group’s conversion rate, which is the
proportion of net fees converted into operating
profit, improved by 80 basis points to 22.3%
(2015: 21.5%) as a result of this good net fee
growth, the ongoing benefit of our largely
automated back office platform and our
continued strong control of operating costs.
Operating profit
2013 2014 2015 2016
125.5
£m
140.3
164.1
181.0
0
40
80
120
160
200
Consultant headcount at the end of June 2016
was 6,268, up 3% year-on-year but down 3%
versus December 2015. In our UK  Ireland
business consultant headcount was down 8%
year-on-year, all by natural attrition, as we
Net fees in the Temp business, which
represented 58% of Group net fees, also
increased by 7%(1)
. This was driven by an
increase in volumes, up 5%, and a 4%
increase in the mix/hours worked over the
year. Underlying Temp margins(2)
were down
20 bps at 16.7% (2015: 16.9%), primarily in
Australia  New Zealand.
Net fees by contract type
2013 2014 2015 2016
%
Perm
Temp
0
20
40
60
80
100 41%
59%
41%
59%
42%
58%
42%
58%
Movements in consultant headcount
Consultant headcount ended June at
6,268, up 3% year-on-year. In our Continental
Europe  Rest of World (RoW) division we
increased consultant headcount by 12%(3)
year-on-year, including Germany which
was up 11% and France which was up 10%.
In Asia Pacific, consultant headcount was
up 1% year-on-year, within which Australia
consultant headcount was up 6%, while in
Asia consultant headcount decreased by 6%,
mainly in response to challenging conditions
in the banking market. In the UK  Ireland
consultant headcount was down 8%, all by
natural attrition, as we focused on consultant
productivity and maximising our financial
performance. Over the last six months,
Group consultant headcount was down 3%
(versus December 2015), primarily in the UK.
Summary income statement
Year ended 30 June (£m) 2016 2015 Actual growth LFL growth(1)
Turnover(5)
4,231.4 3,842.8 10% 12%
Net fees(5)
810.3 764.2 6% 7%
Operating profit from continuing operations 181.0 164.1 10% 13%
Cash generated by operations 159.3 189.8 (16%)
Profit before tax 173.0 156.1 11%
Basic earnings per share 8.48p 7.44p 14%
Dividend per share 2.90p 2.76p 5%
(1)	 LFL (like-for-like) growth represents organic growth of continuing operations at constant currency.
(2)	Conversion rate is the proportion of net fees converted into operating profit (before exceptional items).
(3)	Consultant headcount at 30 June 2015 has been restated to include 144 resourcers previously not reported as consultants in Germany and Switzerland.
(4)	The underlying Temp gross margin is calculated as Temp net fees divided by Temp gross revenue and relates solely to Temp placements in which Hays generates net
fees and specifically excludes transactions in which Hays acts as agent on behalf of workers supplied by third-party agencies and arrangements where the Company
provides major payrolling services.
(5)	Net fees of £810.3 million (2015: £764.2 million) are reconciled to statutory turnover of £4,231.2 million (2015: £3,842.8 million) in note 5 to the Consolidated
Financial Statements.
controlled costs in response to worsening
market conditions. In our International
business, we increased consultant headcount
by 9% year-on-year.
Foreign exchange
Currency movements versus sterling
represented a significant headwind for
the reported performance in the year.
Over the course of the year to June 2016,
the total combined operating profit impact
of average exchange rate movements was
£4.5 million negative.
Exchange rate movements remain a material
sensitivity and by way of illustration, each 1
cent movement in annual exchange rates of the
Australian Dollar and Euro impacts net fees by
£0.8 million and £2.5 million respectively per
annum; and operating profits by £0.3 million
and £0.8 million respectively per annum.
The rate of exchange between the Australian
Dollar and sterling over the year ended
30 June 2016 averaged AUD2.0392 and
closed at AUD1.7877. As at 30 August 2016
the rate stood at AUD1.7421. The rate of
exchange between the Euro and sterling
over the year ended 30 June 2016 averaged
€1.3373 and closed at €1.1989. As at 30
August 2016 the rate stood at €1.1744.
The impact of these material movements
in foreign exchange rates means that if we
retranslate the Group’s full-year operating
profit of £181.0 million at current exchange
rates, the actual reported result would
increase by c.£26 million to c.£207 million.
Good growth in both Perm and Temp
Net fees in the Perm business increased by
7%(1)
, as volumes increased 6%, driven by
improved client and candidate confidence,
especially in Europe. This was supported
by an increase in the average fee per
placement of 1%(1)
.
Another strong
financial performance
as we delivered
excellent operating
profit growth
Hays plc | 2016 Annual Report and Financial Statements39
OVERVIEW  STRATEGICREPORT  GOVERNANCE  FINANCIALSTATEMENTS  SHAREHOLDERINFORMATION
Current trading
At this early stage in our new financial year,
we see solid overall net fee growth. In most of
our markets, we see many clear opportunities
to grow further and we will continue to invest
in a targeted way to capitalise on these
opportunities. In the UK, following a step
down in Perm activity immediately after the
EU Referendum, conditions are tough but
broadly sequentially stable and it is too early
to have a clear view on the extent to which
the post-Brexit uncertainty will impact our
business in the current financial year.
Movements in the rates of exchange of
the Group’s key currencies, notably the
Australian Dollar and the Euro, remain a
material sensitivity to our reported financial
performance, and we have seen significant
movements since the EU Referendum
in the UK. If we retranslate the Group’s
full-year operating profit of £181.0 million at
current exchange rates, the actual reported
result would increase by c.£26 million to
c.£207 million.
Asia Pacific
We continue to see good levels of growth
in Australia overall, as market confidence
continues to recover gradually. Growth in
New South Wales, Victoria and ACT is good,
and conditions are stable in the mining-
dominated state of Western Australia.
We continue to see strong growth in our
public sector business and growth is solid
in the private sector. In Asia markets such
as Hong Kong and Singapore, which have
a high exposure to banking, remain
subdued. We expect headcount to increase
modestly in the first half of the year,
mainly in Australia.
Continental Europe  ROW
In Continental Europe  RoW, growth
remains strong overall, albeit against tough
comparators. In Germany and France we
continue to see strong growth and in the
rest of Europe and the Americas conditions
remain strong in most markets. To date,
we have seen no evidence of contagion into
Europe following the outcome of the EU
Referendum. Overall we expect headcount
in the division to increase significantly in
Germany and France and on a selective
basis elsewhere.
United Kingdom  Ireland
In the UK, the market is tough but broadly
sequentially stable. We saw a step down
in Perm activity immediately after the EU
Referendum, but since then activity levels
have been broadly stable. In Temp, activity
levels have remained broadly at pre-
referendum levels. It is too early to determine
whether these trends will continue beyond
the summer period.
We continue to review underlying activity
levels, but having taken action to reduce
headcount in the last financial year, we
expect headcount to remain broadly flat
in the early part of the new financial year.
See also our divisional operating review
on page 35
Net finance charge
The net finance charge for the year was
£8.0 million (2015: £8.0 million). The average
interest rate on gross debt during the period
was 2.3% (2015: 2.5%), generating net bank
interest payable including amortisation
of arrangement fees of £2.9 million (2015:
£4.1 million) with the reduction primarily
due to the lower levels of average net debt
compared to the prior year. The net interest
charge on defined benefit pension scheme
obligations was £3.9 million (2015: £3.0
million) and the Pension Protection Fund
levy was £0.3 million (2015: £0.5 million).
The unwind of the discount applied to
the future Veredus acquisition liability
is recorded within interest, and was
£0.9 million (2015: £0.4 million). We expect
the net finance charge for the year ending
30 June 2017 to be around £7.0 million.
Included within the net finance charge
is an unrealised gain of £6.6 million on
the derivative current asset, offset by
a £6.6 million revaluation loss on the Euro
denominated overdraft within the Group’s
European cash pool arrangements, the net
impact of which is £Nil. There was no such
gain in 2015.
Taxation
Taxation for the year was £51.9 million (2015:
£50.7 million), representing an effective tax
rate of 30.0% (2015: 32.5%). The effective tax
rate reflects the Group’s geographical mix
of profits, with the reduction in the rate due
to the material improvement of profitability
in the UK and the reduction in the UK
corporation tax rate. The Group’s effective
tax rate for the year to June 2017 will be
driven by the mix of profits generated during
the year. We currently expect the rate to be
between 30% and 35%.
Earnings per share
Basic earnings per share increased by 14%
to 8.48 pence (2015: 7.44 pence), reflecting
the Group’s higher operating profit and lower
effective tax rate.
2013 2014 2015 2016
5.14
p
6.13
7.44
8.48
0
2
4
6
8
10
Cash flow and balance sheet
Good underlying cash performance with 88%
conversion of operating profit into operating
cash flow (2015: 116%). This was a result
of good working capital management
throughout the year, especially considering
the strong growth in our German and
European contracting businesses, which are
relatively working capital-intensive, and the
reversal of the £20 million cash flow benefit
reported in FY15 due to the favourable day
upon which that year-end fell.
Net capital expenditure was £14.9 million
(2015: £11.9 million). We expect capital
expenditure to be around £15 million for
the year to June 2017.
Dividends paid in the year totalled £39.9 million
and pension deficit contributions were
£14.4 million. Net interest paid was £3.6 million
and the cash tax payment was £41.7 million.
We eliminated net debt, which stood
at £30.7 million at the start of the year,
achieving a net cash position of £36.8 million
at the end of the year.
Closing net cash/(net debt)
2012 2013 2014 2015 2016
(132.9)
(105.2)
£m
(62.7)
(30.7)
36.8
-150
-120
-90
-60
-30
0
30
60
Hays plc | 2016 Annual Report and Financial Statements40
FINANCIAL REVIEW
CONTINUED
Operating
profit
Operating cash flow
£159.3m (FY15 £189.8m)
£20m
FY15 year-end unwind
Free cash
flow
Interest
paid
Tax
paid
Working
capital
Non-cash
items
181.0
32.6
(54.3)
(41.7)
(3.6)
114.0
£m
0
40
80
120
160
200
240
Retirement benefits
The Group’s pension liability under IAS19
at 30 June 2016 of £14.3 million decreased
by £44.4 million compared to June 2015
primarily due to an increase in asset values, a
decrease in the inflation rate and favourable
changes in experience and demographics
assumptions following the 2015 triennial
actuarial valuation, partially offset by a
decrease in the discount rate.
During the year the Company contributed
£14.4 million of cash to the defined benefit
scheme (2015: £14.0 million), in line with
the agreed deficit recovery plan. The 2015
triennial valuation quantified the actuarial
deficit at c.£95 million and the recovery
plan comprises an annual payment of
£14.0 million from July 2015 with a fixed
3% uplift per year, over a period of just under
10 years. The scheme was closed to future
accrual in June 2012.
Capital structure and dividend
The Board’s priorities for free cash flow are to
fund the Group’s investment and development,
maintain a strong balance sheet and deliver
a sustainable core dividend at a level which
is both affordable and appropriate.
Taking into account the financial performance
of the Group this year and as we build core
dividend cover towards 3.0x earnings, the
Board proposes to increase the final core
dividend by 5% to 1.99 pence, resulting in an
increase to the full year dividend to 2.90 pence,
also up 5% on the prior year. As such, the full
year dividend will be covered 2.9x by earnings.
The Board remains committed to this
sustainable and progressive dividend policy
and will continue to review the core dividend
level in line with our stated dividend cover
policy. Additionally, we reiterate our policy
regarding the uses of excess free cash flow as
follows. Once we have built a net cash position
in the region of £50 million and assuming
a positive outlook, it is our intention that any
excess free cash flow generated over-and-
above this net cash position, that is not needed
for the priorities outlined above, will then
be distributed to shareholders via special
dividends, or other appropriate methods,
to supplement the core dividend.
The final dividend will be paid, subject
to shareholder approval, on 11 November
2016 to shareholders on the register on
14 October 2016.
Treasury management
The Group’s operations are financed by
retained earnings and bank borrowings. The
Group has in place a £210 million revolving
credit facility, maturing in April 2020, which
provides considerable headroom versus
current and future expected levels of Group
Operating profit to free cash flow conversion
debt. The covenants within the facility
require the Group’s interest cover ratio to be
at least 4:1 (ratio as at June 2016: 60:1) and its
leverage ratio (defined as net debt: EBITDA)
to be no greater than 2.5:1 (as at June 2016
the Group held a net cash position). The
interest rate of the facility is on a ratchet
mechanism with a margin payable over
LIBOR in the range 0.90% to 1.55%.
The Group’s UK-based treasury function
manages the Group’s treasury risks in
accordance with policies and procedures set
by the Board, and is responsible for day-to-
day cash management; the arrangement of
external borrowing facilities; the investment
of surplus funds; and the management of the
Group’s interest rate and foreign exchange
risks. The Treasury function does not engage
in speculative transactions and does not
operate as a profit centre, and the Group
does not hold or use derivative financial
instruments for speculative purposes.
The Group’s cash management policy is
to minimise interest payments by closely
managing group cash balances and external
borrowings. Euro-denominated cash
positions are managed centrally using a cash
pooling facility which provides visibility over
participating country bank balances on a
daily basis. Any group surplus balance is
used to repay any maturing loans under the
Group’s revolving credit facility or is invested
in overnight money market funds. As the
Group holds a sterling denominated debt
facility and generates significant foreign
currency cash flows, the Board considers it
appropriate in certain cases to use derivative
financial instruments as part of its day-to-
day cash management to reduce the Group’s
exposure to foreign exchange risk. The
Group does not use derivatives to hedge
balance sheet and income statement
translation exposure.
The Group is exposed to interest rate risk
on floating rate bank loans and overdrafts.
It is the Group’s policy to limit its exposure to
interest rates by selectively hedging interest
rate risk using derivative financial
instruments.
Counterparty credit risk arises primarily
from the investment of surplus funds. Risks
are closely monitored using credit ratings
assigned to financial institutions by
international credit rating agencies. The
Group restricts transactions to banks and
money market funds that have an acceptable
credit profile and limits its exposure to each
institution accordingly.
Paul Venables
Group Finance Director
1 September 2016
Hays plc | 2016 Annual Report and Financial Statements41
OVERVIEW  STRATEGICREPORT  GOVERNANCE  FINANCIALSTATEMENTS  SHAREHOLDERINFORMATION
Our risk appetite
Hays has a proactive approach to measuring
performance and considers risk as an integral
part of decision-making, both about current
and future performance throughout the
global businesses. With the Board being
responsible for the level of risk that the
Group is willing to accept, the Board
manages this by linking risk appetite to its
strategic objectives, being mapped against
defined impact and likelihood scales, in order
to define where the level of risk sits.
The principal risks have all been mapped
through the risk appetite process in order
to identify both position and tolerance levels
and to assess the mitigating actions.
Hays operates a measured risk appetite
position due to the nature of the recruitment
market, being a cyclical business and highly
sensitive to macroeconomic conditions, which
results in a lack of forward visibility of fees
and increases the overall risk environment.
Risk attributes
When considering the risk appetite the
Board considers this in terms of the
following attributes:
–– Experienced and stable management
team globally;
–– Strong balance sheet, including the level
of operational gearing;
–– Clear and open communication channels.
Risk governance – identifying, evaluating
and managing risk
The Board has overall responsibility for the
Group’s internal control systems and for
reviewing their effectiveness. This has been
designed to assist the Board in making
better, more risk-informed, strategic
decisions with a view to creating and
protecting shareholder value. In practice, the
Board delegates the task of implementing its
policy on risk and control to management
and needs to assure itself on an ongoing
basis that management is responding
appropriately to these risks and controls.
Managing risks so we
achieve our strategic
growth targets.
We focus on key risks
which could impact
on the achievement
of our strategic goals
and therefore on
the performance
of our business.
How we monitor our progress – three lines of defence
Board  Audit Committee
Management Board
Ownership 
Management
Monitor  Oversight Independent Assurance
First line of defence:
–– Management Controls
–– Policies and
Procedures
–– Internal Control
Measures
Second line of defence:
–– Financial Control
–– Security
–– Risk Management
–– KPIs
–– Compliance
–– Group Risk
Committee
Third line of defence:
–– Internal Audit
–– External Advisers
The Board delegates to management
ownership and responsibility for operating
risk management and controls, and
management need to provide leadership
and direction to the employees to ensure
the organisation’s overall risk-taking activity
is managed in relation to the agreed level of
risk appetite.
To manage the effectiveness of this the
Board and management need to rely on
adequate line functions – including
monitoring and assurance functions – within
the organisation. As such the organisation
operates the ‘Three Lines of Defence’ model
as a way of explaining the relationship
between these functions and demonstrating
how responsibilities are allocated:
–– The first line of defence – responsibility
to own and manage risk;
–– The second line of defence – responsibility
to monitor and oversee risk;
–– The third line of defence – functions that
provide independent assurance.
The Group Risk Committee, chaired by the
Group Finance Director and comprising
senior operational, IT, legal and finance
representatives, assists in the strategic
management of risk in the Group.
Risk identification and impact – Hays’
principal risks are analysed on a gross
(pre-mitigation) and net (post-
mitigation) basis
The Management Board oversees an
enterprise risk management framework,
which allows for a holistic, top-down and
bottom-up view of key risks facing the
business. These are recorded in a Group risk
register, which is reviewed at least annually by
the Management Board and submitted to the
Board thereafter to enable it to carry out its
risk oversight responsibility. This exercise
involves a current and forward look at various
risks affecting the business and prioritising
them according to risk magnitude and
likelihood. Risks covered include operational,
financial and reputational risks, as well as
compliance and people-related risks. Each risk
is assigned an owner with current and future
risk mitigation procedures detailed, with the
continuing monitoring of these undertaken
on an ongoing basis.
Viability statement
In accordance with provision C.2.2 of the
UK Corporate Governance Code 2014 the
directors have assessed the prospects
of the Group over a period longer than
the 12 months from the approval of the
financial statements.
The directors have determined that the
three-year period ending 30 June 2019 is
the most relevant time period over which
to provide the viability statement. This is
because it is aligned with the strategic
planning cycle and, given the fast moving
nature of the industry, using a three-year
period it is possible to form a reasonable
expectation as to the Group’s longer-term
viability.
Process to assess the Group’s prospects
As in prior years, the Board undertook a
strategic business review in the current
year taking into account the Group’s current
position and the potential impact of the
principal risks set out on pages 43 to 45
of the Annual Report.
In addition and in making this statement,
the Board carried out a robust assessment
of the principal risks facing the Group,
including those that would threaten the
Group’s business model, future performance
and liquidity. While the review has
considered all the principal risks identified
by the Group, the resilience of the Group to
the occurrence of these risks in severe yet
plausible scenarios has been evaluated.
Hays plc | 2016 Annual Report and Financial Statements42
PRINCIPAL RISKS
Stress testing
The Board approves an annual budget and
reviews monthly management reports and
quarterly forecasts. The output of the
strategic planning and budgeting processes
has been used to perform a sensitivity
analysis to the Group’s cash flow to model
the potential effects should principal risks
actually occur either individually or in unison.
The sensitivity analysis included loss of
business arising from a prolonged global
downturn, material movements in foreign
exchange rates, and a detailed assessment
of a range of possible outcomes arising from
the UK’s vote to leave the European Union.
Set against these downside risks the Board
considered key mitigating factors including
the geographic diversity of the Group, its
balanced business model across temporary,
permanent and contract recruitment
services, and the significant working capital
inflows which arise in periods of severe
downturn, particularly in the temporary
recruitment business, thus protecting
liquidity as was the case during the global
financial crisis of 2008-09.
In addition, the Group’s history of strong
cash generation, tight cost control and flexible
workforce management provide further
protection. The Group also has in place a
£210 million revolving credit facility with a
suite of banks until 2020, and has recently
signed a new actuarial valuation of its defined
benefit pension scheme which maintains cash
outflows broadly at their existing level.
Confirmation of longer-term viability
Based on the above assessment the
directors confirm that they have a reasonable
expectation that the Company will be able to
continue in operation and meet its liabilities
as they fall due over the three-year period to
30 June 2019.
Going concern
The Group’s business activities, together
with the factors likely to affect its future
development, performance and position are
set out in the Strategic Report. The financial
position of the Group, its cash flows and
liquidity position are described in the
Financial Review, with details of the Group’s
treasury activities, long-term funding
arrangements and exposure to financial
risk included in notes 18 to 20 to the
Consolidated Financial Statements.
The Group has sufficient financial resources
which, together with internally generated
cash flows, will continue to provide sufficient
sources of liquidity to fund its current
operations, including its contractual and
commercial commitments and any proposed
dividends. The Group is therefore well placed
1. Macroeconomic/cyclical
business exposure
Movement in year
Risk description
The performance of the Group is
significantly impacted by changes to
underlying economic activity, particularly
in the UK, Germany and Australia, the
levels of business confidence as
businesses consider permanent and
temporary hiring decisions and levels of
candidate confidence which impact their
propensity to change jobs.
Risk impact
–– Financial
Risk mitigation
Hays has continued to diversify its
operations to include a balance of both
temporary and permanent recruitment
services to private and public sector
markets, and operates across 33 countries
and 20 sector specialisms. Progress is
being made to further diversify the
business to reduce the Group’s reliance
on the UK, Germany and Australia, which
currently represent 70% of the Group’s
net fees.
Hays’ cost base is highly variable and
carefully managed to align with business
activity, and can be focused and scaled
accordingly to react to the individual
markets, with temporary recruitment
being more resilient in times of economic
uncertainty or downturn.
Hays is highly cash generative, requiring
low levels of asset investment. Cash
collection is a priority and the Group has
made appropriate investment in its credit
control and working capital management
processes, resulting in the elimination of
Group net debt and a year-end net cash
positive position.
It is too early to have a clear view on the
impact of Brexit on our UK business, but
its potential to have an impact is fully
acknowledged.
Link to relevant strategic priority
2
to manage its business risks. After making
enquiries, the directors have formed the
judgment at the time of approving the
financial statements, that there is a reasonable
expectation that the Group has adequate
resources to continue in operational existence
for the foreseeable future. For this reason,
they continue to adopt the going concern
basis of accounting in preparing the
Consolidated Financial Statements.
Risk trends
The ongoing review of the Group’s principal
risks focuses on how these risks may evolve.
Since the publication of last year’s Annual
Report, our principal risks have changed
as follows:
Increased risks
Risk 1
Macroeconomic/cyclical
business exposure
The Brexit decision has increased the level
of uncertainty and thus risk to the trading
performance of our UK business and
potentially to the broader European market.
Risk 2
Business model
The pace of change in social media and
internet-enabled digital dynamics, allied to
changes in the structure of the professional
workforce, is increasing the potential risk of
insourcing and disintermediation.
Risks 5 and 6
Reliance on technology
Data governance
The increasing prevalence of cyber attack
across the world, means that along with all
large corporates, our business systems are
under increasing level of attack. Over the last
two years as explained in the detailed risk
sections, we have invested significantly in
this area both in upgrading all aspects of our
systems and our internal resources and also
using external consultants to perform regular
external and internal penetration tests and
using the results to drive a continuous
improvement programme.
Decreased risks
While foreign exchange remains a risk to the
Group, in light of the assessment under the
annual review and the elimination of net
debt, it has been removed from the list of
the Group’s Principal Risks.
Hays plc | 2016 Annual Report and Financial Statements43
OVERVIEW  STRATEGICREPORT  GOVERNANCE  FINANCIALSTATEMENTS  SHAREHOLDERINFORMATION
Link to relevant strategic priority
3
Link to relevant strategic priority.
3
Risk description
The Group is reliant on its ability to recruit,
develop and retain staff to protect the
business it has today and to deliver its future
growth plans, especially internationally
both at a manager and consultant level.
Its strategy is to grow and nurture talent
internally into senior roles wherever possible.
Risk description
The Group operates in 33 countries,
with each operating its own legislative,
regulative, compliance and tax rules,
especially for temporary workers, with
any non-compliance increasing the
Group’s exposure to potential legal,
financial and reputational risk.
Risk impact
–– People
–– Financial
Risk impact
–– Compliance
–– Financial
–– Reputational
Risk mitigation
Hays provides a defined and sustainable
career development path for new hires,
starting with a structured induction
programme and ongoing training as
they advance their careers, supported by
formalised performance and career tracking.
Development Centres focus on the progress
of high-potential individuals, providing
further development opportunities and
also helping to identify any talent gaps
and training needs. Leadership and
development programmes are aligned
with the Group’s business strategy.
Overall remuneration packages are
competitive, including an employee benefit
programme, together with a long-term
incentive scheme that is offered to some
320 senior managers, which encourages a
performance led culture and aids retention.
Succession plans identify future potential
leaders of the business and produce
individual development plans in which
to harness and cultivate talent.
The Group’s standard employment
contracts include notice periods and
non-solicitation provisions in the event
of an employee leaving.
Risk mitigation
Compliance processes and monitoring
are tailored to specific specialisms,
ensuring additional focus is given to
higher-risk specialisms such as Education
and Healthcare in the UK, Construction
 Property in Australia and specialised
corporate contracts through Hays Talent
Solutions.
Employees receive training in respect of
the operating standards applicable to their
role, with additional support provided by
compliance functions, regional legal teams
and, where necessary, external advisers.
All staff receive regular training to ensure
that legal and compliance updates are
understood and applied. In territories where
legislation sets out additional compliance
requirements, specialists are employed.
Dedicated compliance auditors conduct
sample checks to ensure that the
appropriate candidate vetting checks and
due diligence obligations are carried out in
line with legal and contractual requirements.
The Group holds all standard business
insurance cover, including employers’
liability, public liability and professional
indemnity insurance.
4. Compliance
Movement in year
3. Talent
Movement in year
Risk description
The Group faces competition from
the increasing use of social media for
recruitment purposes and a growing trend
towards outsourced recruitment models
with associated margin pressures, which
may impact on the business should Hays
not continue to take appropriate actions
and respond effectively.
Risk impact
–– Operational
–– Financial
Risk mitigation
Hays monitors industry trends and
opportunities, including social media and
insourcing, and continues to invest in our
online presence to provide a high-quality
customer experience.
Our key relationships (such as with SEEK
in Australia) increase our exposure to
online professional networking and
recruitment portals and enhance our value
proposition to clients and candidates.
Our expert and specialised consultants are
trained in utilising social media to enhance
their day-to-day activities in providing the
best quality candidates for our clients.
We continue to leverage our broad
geographical and sectoral footprint to
win and maintain a significant number
of multi-specialism contracts with large
corporate organisations, which has
strengthened our relationship with these
clients and increased our share of their
recruitment spend.
We have made a significant investment
in FY16 to address data analytics in order
to significantly improve our candidate
acquisition strategy. The initiative is
supported by increasing our digital
capability with the appointment of
a Group Data Marketing Director.
Link to relevant strategic priority
3
2. Business model
Movement in year
Hays plc | 2016 Annual Report and Financial Statements44
PRINCIPAL RISKS
CONTINUED
Link to relevant strategic priority
3
Risk description
Our dependence on technology in our
day-to-day business means that systems
failure due to technical issues or cyber
attack, may have a significant impact on
our operations and ability to deliver our
services if it continued for a period of days
and as such could negatively impact our
financial performance and reputation.
Risk impact
–– Operational
–– Financial
–– Reputational
Risk mitigation
The Group’s technology strategy is
continually reviewed to ensure that the
systems it operates across the Group
support its strategic direction.
Ongoing asset lifecycle management
programmes mitigate risks of hardware
and software obsolescence.
Technology systems are housed in various
data centres and the Group has capacity
to cope with a data centre’s loss through
the establishment of disaster recovery
sites, that are physically based in separate
locations to the ongoing operations,
intrinsically linked to the country business
continuity plans.
Across the regions we have established
dedicated security teams in order to
ensure that the systems are protected
from unauthorised access, both externally
and internally, and includes ensuring that
anti-virus software is in place and
up-to-date, with regular testing of these
environments by external providers.
We use external advisers to perform
regular external and internal physical
and logical penetration tests on all major
systems and operations and implement
any required improvements coming out
of such tests as part of a continuous
improvement process.
Link to relevant strategic priority
2
By order of the Board
Doug Evans
Company Secretary
1 September 2016
Link to relevant strategic priority
3
Risk description
The business works with personal data in
all 33 countries on a daily basis under a
variety of laws and regulations. A material
data breach or data loss could expose the
Group to potential legal, financial and
reputational risks in the form of penalties
and loss of business.
Risk description
The Group enters into contractual
arrangements with clients, some
of which can be on onerous terms
and/or impacted by local regulatory
requirements, especially in relation
to temp/contracting markets.
Risk impact
–– Operational
–– Financial
–– Reputational
Risk impact
–– Operational
–– Financial
–– Reputational
Risk mitigation
Robust procedures for handling, storing
and transfer of personal data are in place
across the Group, on both a physical and
logical security basis.
Comprehensive data protection and
information security policies and
procedures are in place across the Group
and, where data protection and privacy
legislation allows, protective email
monitoring programmes are undertaken
to address potential areas of concern, to
best protect our confidential information
and candidates’ personal data.
Attention has been focused in this area,
with the increased threat of cyber crime
globally, and security vulnerability is
assessed as part of the ongoing IT
strategy across the Group.
Hays is preparing for the implementation
of the EU General Data Protection
Regulations in May 2018.
We use external advisers to perform
regular external and internal physical
and logical penetration tests on all major
systems and operations and implement
any required improvements coming out
of such tests as part of a continuous
improvement process.
Risk mitigation
During contract negotiations management
seeks to minimise risk and ensure that the
nature of risks and their potential impact
is understood.
Our global legal team has the depth
of knowledge and experience to enable
them to advise management on the
level of risk presented in increasingly
onerous contracts, with clear guidelines
in operation.
The Group Finance Director reviews
all commercial contracts with onerous
non-standard terms in accordance with
the Group’s risk appetite. In addition the
Group’s Insurance Manager reviews and
where necessary engages with insurance
providers to ensure that risks are covered.
Reviews are performed on a risk basis
across key contracts to identify compliance
and agree improvements to the way in
which we deliver services to clients.
Assurance work is undertaken in key
countries by Internal Audit to ensure
contractual obligations are appropriately
managed.
7. Contracts
Movement in year
6. Data governance
Movement in year
5. Reliance on technology
Movement in year
Hays plc | 2016 Annual Report and Financial Statements45
OVERVIEW  STRATEGICREPORT  GOVERNANCE  FINANCIALSTATEMENTS  SHAREHOLDERINFORMATION
Hays plc | 2016 Annual Report and Financial Statements46
Governance
How the Hays Board sets
strategic direction and provides
oversight and control.
In this section:
48	 Chairman’s Statement
50	Leadership
56	 Relations with shareholders
57	Effectiveness
60	Accountability
64	 Remuneration Report
86	 Directors’ Report
89	 Directors’ responsibilities
Hays plc | 2016 Annual Report and Financial Statements47
OVERVIEW  STRATEGICREPORT  GOVERNANCE  FINANCIALSTATEMENTS  SHAREHOLDERINFORMATION
Dear Shareholder
I am pleased to present to you the
Governance section of our 2016 Annual
Report. The solid corporate governance
framework which underpins the way your
Board operates is well established, but
remains dynamic and adaptable to the ever
changing corporate and social landscape we
face globally. I am fortunate that I get to visit
many of our business locations around the
world; within the last financial year as a
Board we have visited Japan and Australia,
in addition to a number of UK sites, and what
is clear from speaking with senior management
and leaders across the business is that the
same factors are embedded into their modus
operandi wherever they are in the world.
I and my Board colleagues live by the
principles of good governance in the way
we operate and endeavour to cascade that
in all our dealings with and, on behalf of,
the Company, so it is rewarding to see that
this culture exists throughout the business.
Operating within a robust governance
framework, I believe, makes us a stronger
business, where we have integrity and
respect at the heart of what we do. I am
proud that, during the year, the Board have
taken decisions that, when considered
against broad criteria, have had ethical
considerations very much at the forefront,
and as such were ones that were felt to be
the right fit for our business.
2016 was notable for us as a Board as we
undertook an external evaluation of our
own performance. What you get out of these
exercises is often only a product of what
you put in and I was most grateful, as the
principal Board ‘sponsor’ of this activity,
for the commitment shown by my colleagues
to the process and what it was designed
to achieve. Further information on the
evaluation can be found within the
following pages.
Richard Smelt retired from the Board at our
AGM last year. In December 2015 we were
very pleased to welcome MT Rainey as a
valuable addition to the Board. MT is an
experienced media and marketing
professional, who has worked extensively in
the UK and US. MT founded the advertising
Operating within
a robust governance
framework makes
us a stronger
business
Hays plc | 2016 Annual Report and Financial Statements48
CHAIRMAN’S STATEMENT
Alan Thomson
Chairman
agency Rainey Kelly Campbell Roalfe, which
she grew to a top 20 agency before it was
sold to YR, a subsidiary of WPP plc, and
where MT was CEO then Chair until 2005.
MT has considerable digital and marketing
knowledge and understanding and a strong
customer focus and her skill set is a
complementary fit to our Board.
November 2016 will mark nine years since
Paul Harrison was first elected to the Board.
During the year we have considered Paul’s
independence and regard him not only as
independent of character and judgment, but
also free of any connections that may lead to
conflicts of interest. Paul will therefore stand
for re-election at this year’s AGM.
As we continue to assess the skills and
attributes required to ensure the Board
membership has the right mix of skills
and knowledge required for the evolving
business landscape we’re faced with, we will
continue our policy of appointing the most
appropriate candidate based on their skills
and experience.
I look forward to meeting any shareholders
who can join us at our AGM in November,
and extend my thanks to you all for your
continued support as we look forward to
the year ahead.
Alan Thomson
Chairman
1 September 2016
Responsibility for good governance rests
with the Board; this is underpinned by an
effective governance framework which,
the Board believes, fits the requirements
of Hays’ business.
The Board retains certain matters for its
own preserve; other specific responsibilities
are delegated to its principal Committees,
namely the Audit Committee, the
Remuneration Committee and the
Nomination Committee. Each of these
Committees operates within defined terms
of reference, which are available on the
Our governance framework
Company’s website. The Board has also
delegated to a sub-committee certain
matters which are routine in nature, or
which have been agreed in principle by the
Board; such matters require a meeting of
three directors, with an appropriate mix
of executives and non-executives. Such
matters are reported to the full Board.
The Chairman of each Committee reports
to the Board on its proceedings, and
minutes of the meetings are available
as appropriate.
Hays plc is subject to the UK Corporate
Governance Code (the Code) issued by
the Financial Reporting Council (available
at frc.org.uk), which was published in
September 2014. As a listed company,
Hays is required to report on how it has
applied the principles of the Code and
this is set out in the following pages. The
Board is pleased to report that Hays has
complied with all of the provisions of the
Code throughout the year ended 30 June
2016 and to the date of this document.
Statement of Code Compliance
Board of Directors
–– Set standards, values, policies and strategic aims
–– Ensures we have the resources in place to meet our objectives
–– Monitors and reviews material strategic issues, financial performance and
risk management
See page 52
Audit Committee
–– Reviews and monitors
financial statements
–– Oversees external
audit
–– Reviews internal
audit plans
See page 60
Remuneration
Committee
–– Sets, reviews and
recommends overall
remuneration policy
and strategy
–– Reviews and approves
remuneration
arrangements for
executive directors and
senior management
See page 64
Nomination Committee
–– Makes
recommendations
to the Board on its
composition and that
of its Committees
See page 57
Chief Executive
Management Board
–– Day-to-day management of our business and
operations, responsibility for monitoring detailed
performance of all aspects of our business
See page 52
Group Risk Committee
–– Provide strategic leadership, direction and oversight
of risk
See page 55
Hays plc | 2016 Annual Report and Financial Statements49
OVERVIEW  STRATEGICREPORT  GOVERNANCE  FINANCIALSTATEMENTS  SHAREHOLDERINFORMATION
1. Alan Thomson (69)
Non-Executive Chairman
Appointed: 1 October 2010 (and as
Chairman on 10 November 2010)
Committees: Nomination (Chairman)
Skills and experience: A post-graduate
of Glasgow University and a Chartered
Accountant, Alan’s early career was with
Arthur Andersen and Price Waterhouse.
This was followed by senior management roles
with Rockwell International plc, Raychem Ltd
and Courtaulds plc, after which he became
Finance Director of Rugby Group plc and
then Smiths Group plc. Alan is a former
Non-Executive Director of Johnson Matthey
plc, former Chairman of Polypipe Group plc
and a past President of the Institute of
Chartered Accountants of Scotland.
Principal external appointments: Chairman
of Bodycote plc; Non-Executive Director of
Alstom SA; Non-Executive Director and
Chairman designate of Oxford Instruments plc.
2. Alistair Cox (55)
Chief Executive
Appointed: 1 September 2007
Skills and experience: A Chartered Engineer
with an MBA from Stanford University,
Alistair’s early career was in various field
engineering, management and research
science roles with British Aerospace and then
Schlumberger. Following his MBA, Alistair
worked for McKinsey  Company before
joining Blue Circle Industries, where he was
the Group Strategy Director and then the
Regional Director for Asia. Prior to joining
Hays, Alistair was Chief Executive of Xansa
plc. Alistair was, until November 2015, a
Non-Executive Director of 3i Group plc.
A strong team
with a broad and
complementary mix
of skills and
experience
3. Paul Venables (54)
Group Finance Director
Appointed: 2 May 2006
Skills and experience: A Chartered
Accountant and also US-qualified, Paul
started his career at Deloitte  Touche where
he was a Senior Manager in its USA practice.
This was followed by a 13-year career at Exel
plc where he held a number of senior finance
and operational roles including Deputy
Group Finance Director and was a member
of the Executive Board of Exel plc and
Chairman of their Acquisitions and Project
Review Board. Following the acquisition of
Exel plc by Deutsche Post, Paul worked in its
DHL Logistics division before joining Hays.
Paul was, until July 2015, Senior Independent
Non-Executive Director of Wincanton plc.
4. Paul Harrison (52)
Senior Independent Non-Executive Director
Appointed: 8 May 2007 (and Senior
Independent Director on 9 November 2011)
Committees: Remuneration (Chairman),
Audit and Nomination
Skills and experience: Paul trained as a
Chartered Accountant with Price
Waterhouse. He joined The Sage Group plc
as Financial Controller in 1997 and was
Group Finance Director from 2000 to 2013.
In September 2013, Paul joined WANdisco
plc as Chief Financial Officer.
Principal external appointments: Paul is
also a Non-Executive Director of Ascential plc.
	Executive Board member
	Senior Independent Non-Executive Director
	Non-Executive Director
9
5
3
8 4 6
7 10
12
Hays plc | 2016 Annual Report and Financial Statements50
LEADERSHIP
BOARD OF DIRECTORS
1. Male 67%
2. Female 33%
Board diversity
1.
2.
1. 0-3 years 22%
2. 3-5 years 33%
3. 5+years 45%
Board tenure
1. Finance 22%
2. Engineering and technology 45%
3. Media and marketing 22%
4. Operations 11%
Board experience
4.
1.
2.
3.
1. Non-Executive 67%
2. Chairman 11%
3. Executive 22%
Board composition
1.
2.
3.
1.
2.
3.
5. Victoria Jarman (44)
Independent Non-Executive Director
Appointed: 1 October 2011
Committees: Audit (Chairman), Nomination
and Remuneration
Skills and experience: An engineering
graduate of the University of Leicester and
a Chartered Accountant, Victoria started her
career with KPMG before moving to Lazard
Corporate Finance, where she was Chief
Operating Officer of Lazard’s London and
Middle East operations and a member of its
European Management Committee. Victoria
was, until July 2016, a Non-Executive
Director of De La Rue plc.
Principal external appointments: Victoria
is a Non-Executive Director of Equiniti Group
plc where she is the Chairman of the Audit
Committee and a member of the Risk
Committee, and a non-executive adviser
to Knight Frank’s group executive board.
6. Torsten Kreindl (53)
Independent Non-Executive Director
Appointed: 1 June 2013
Committees: Audit, Nomination and
Remuneration
Skills and experience: A graduate from
Johannes Kepler University in Linz, Austria
with a PhD in industrial engineering and
technical chemistry. Torsten has held senior
executive positions for Booz Allen Hamilton
and Deutsche Telekom AG and was, until April
2016, a member of the Swisscom AG board.
Principal external appointments: He is a
partner in Grazia Equity, a Munich-based
capital firm.
7. MT Rainey (60)
Independent Non-Executive Director
Appointed: 14 December 2015
Committees: Audit, Nomination and
Remuneration
Skills and experience: An experienced
media and marketing professional, MT
Rainey has worked extensively in the UK
and the US. MT founded the advertising
agency Rainey Kelly Campbell Roalfe, which
she grew to a top 20 agency before it was
sold to YR, a subsidiary of WPP plc, and
where MT was CEO then Chair until 2005. In
addition she was Chair of the leading digital
strategy agency Th_nk Ltd from 2008-2015.
Previous non-executive directorships held by
MT include WH Smith plc and STV Group plc.
MT has Masters degrees from Aston
University and Glasgow University.
Principal external appointments: MT is a
Non-Executive Director of Pinewood Group
plc and Channel 4 Television.
8. Pippa Wicks (52)
Independent Non-Executive Director
Appointed: 1 January 2012
Committees: Audit, Nomination and
Remuneration
Skills and experience: A post-graduate
of Oxford University with a diploma in
corporate finance from the London Business
School, Pippa started her career with Bain 
Company. She subsequently became Chief
Financial Officer of Courtauld Textiles plc
and then Chief Executive Officer of FT
Knowledge, the corporate training division
of Pearson plc. Her previous non-executive
directorships have been with Ladbrokes plc,
Hilton International plc and Arcadia plc.
Principal external appointments: Pippa is
presently the Chief Operating Officer of the
Co-op Group and Chairman of AlixPartners
UK Turnaround and Restructuring.
9. Peter Williams (63)
Independent Non-Executive Director
Appointed: 24 February 2015
Committees: Audit, Nomination and
Remuneration
Skills and experience: Peter has a Law
degree from Cambridge University and is
a Chartered Accountant. He was, until 2011,
Group Finance Director of Daily Mail 
General Trust plc, a role he performed for
19 years, making him one of the longest
serving CFOs in the FTSE.
Principal external appointments: Since 2011
Peter has been a Non-Executive Director of
Perform Group, a leading digital sports media
company; he is also a Trustee of the Royal
Academy and a member of the Industrial
Advisory Board of GVQ Asset Management,
a UK equity management company.
10. Doug Evans (53)
Company Secretary and General Counsel
Appointed: 4 February 2013
Skills and experience: A law graduate from
Rhodes University who began his career with
Webber Wentzel in South Africa, specialising
in corporate and commercial law before
moving in-house. Doug has previously held
the posts of Company Secretary  Corporate
Legal Director at Exel plc and Group General
Counsel at Royal Mail Limited. Prior to joining
Hays, Doug was an Executive Director,
Company Secretary  General Counsel
at Mitchells  Butlers plc.
Hays plc | 2016 Annual Report and Financial Statements51
OVERVIEW  STRATEGICREPORT  GOVERNANCE  FINANCIALSTATEMENTS  SHAREHOLDERINFORMATION
The Hays Board
Composition of the Board
The Board is currently made up of two
executive directors and seven non-executive
directors, including the Chairman. Their
biographies, including prior experience,
are set out on pages 50 and 51.
Board changes during the year
Richard Smelt retired from the Board at
the conclusion of our 2015 Annual General
Meeting (AGM); MT Rainey was appointed
to the Board in December 2015.
Election and re-election of directors at the
2016 AGM
In accordance with the Company’s Articles
of Association and the principles of the Code,
all Directors of the Company will offer
themselves for election or re-election at
the 2016 AGM. Having received advice from
the Nomination Committee, the Board is
satisfied that each director is qualified for
election or re-election by virtue of their skills,
experience and commitment to the Board.
Operational governance
The Management Board
Responsibility for the day-to-day
management of our business and operations
rests with the Chief Executive, who operates
through the Management Board – the
principal executive committee within Hays.
In performing this role, the Management Board
also has responsibility for monitoring detailed
performance of all aspects of our business.
The Management Board, which meets monthly,
is chaired by the Chief Executive and also
comprises the Group Finance Director, the
Company Secretary  General Counsel, the
Chief Marketing Officer, the Group Technology
Director and the Managing Directors of the
Group’s three main operating divisions and is
attended by the Group Head of People and
Culture. Each Management Board member
has a clearly defined remit, business objectives
and financial budget within which they operate.
Our organisational structure is built around
three regions globally: UK  Ireland;
Continental Europe  Rest of World; and Asia
Pacific. Regional Managing Directors operate
their business through regional boards, which
comprise key business and functional managers
with specific responsibilities within those
regions. Each business is given operational
autonomy, as far as possible, within a well-
established internal control framework which
consists of, among other things, a Group-wide
set of policies and procedures, operational
delegated authorities and policies on anti-
bribery and corruption, competition compliance,
conduct and ethics, and whistleblowing.
The role of the Hays plc Board
The Board is collectively responsible to the
Company’s shareholders for the long-term
success of the Company. It sets the Company’s
strategic objectives and determines the risk
appetite and control framework within which
those objectives are achieved. The Board
provides effective oversight of the Company
and its businesses within a robust governance
structure that helps achieve the long-term
success of the Company and deliver
sustainable shareholder value.
The Board also provides leadership of the
Company and direction for management,
ensuring that the necessary resources
are in place for the Company to meet
its objectives and it keeps under review
management’s performance in regard
to achieving those objectives.
Our aim is to be the world’s pre-eminent
specialist recruitment business. In pursuit of
that aim, our employees across the globe work
towards achieving our Strategic Priorities, set
out on page 20. The Board closely monitors
management and its delivery of a sustainable
and profitable business, ensuring it continues
to operate within the appropriate risk-reward
culture. The Board has established a core set
of values, which it adheres to and promotes
throughout the Group. These values, which
underpin our skills, behaviours and way of
doing business, are being ambitious, being
passionate about people, being expert at what
we do and being inquisitive about the world
of work. These values serve to engender an
entrepreneurial culture within Hays, which
is critical to our continued success without
promoting excessive risk-taking.
Role of the Non-Executive Directors
Hays’ non-executive directors have a broad
and complementary mix of business skills,
knowledge and experience acquired across
sectors and geographies. This allows them
to provide strong, independent and external
perspectives to Board discussions, which
complement the skills and experience of
the executive directors. In turn, this leads
to a diversity of views being aired at Board
meetings, robust and constructive debate
and optimal decision-making. At the same
time, it also reduces the likelihood of any one
perspective prevailing unduly.
A key role performed by the non-executive
directors is the scrutiny of executive
management in meeting agreed objectives and
monitoring the reporting of performance. They
also ensure that financial controls and systems
of risk management are both rigorous and
appropriate for the needs of the business.
The terms and conditions of appointment
of non-executive directors, including the
expected time commitment, are available
for inspection at the Company’s registered
office, and a pro forma letter of appointment
is also available on the Company’s website.
During the year, the Board considered the
independence of each of the non-executive
directors, save for the Chairman who was
deemed independent by the Board at the
date of his appointment. In doing so, it
concluded that each non-executive director
remained independent of management
and free from any relationship that could
interfere with the exercise of their
independent judgment. In making the
assessment, the Board recognised that
15 November 2016 will represent nine years
since Paul Harrison was first elected by
shareholders; notwithstanding the length of
his tenure, the Board believe Paul Harrison
continues to demonstrate independence of
thought and judgment and as such the Board
will continue to deem him independent for
the purposes of the Code. All of Hays’
directors are expected to act in the best
interests of the Company.
Chairman and Chief Executive
The roles of the Chairman and Chief Executive
are separate, with a clear division of
responsibilities between them which is set out
in writing; the responsibility for this separation
of duties rests formally with the Board.
As Chairman, Alan Thomson presides
over the Board and is responsible for its
leadership and overall effectiveness. In doing
so, he fosters and helps to maintain an effective
working relationship between the executive
and non-executive directors.
As Chief Executive, Alistair Cox has
responsibility for the day-to-day
management of the Company’s business
and the implementation and delivery of
the Board strategy.
This separation of roles enhances the
independent oversight of executive
management by the Board and more
closely aligns the Board with shareholders.
It also means that no one individual within
the Company has unfettered powers of
decision making.
Hays plc | 2016 Annual Report and Financial Statements52
LEADERSHIP
CONTINUED
Senior Independent Director
The Board appointed Paul Harrison to the
position of Senior Independent Director
on 9 November 2011. In performing this role
Paul provides shareholders with someone
to whom they can turn if ever they have
concerns which they cannot address through
the normal channels, for example with the
Chairman or executive directors. Similarly,
as Senior Independent Director Paul is
available as an intermediary between his
fellow directors and the Chairman. While
there were no requests from directors or
shareholders for access to the Senior
Independent Director during the year,
the role serves as an important check
and balance in Hays’ governance process.
In the fulfilment of his role Paul ensures he
maintains a thorough understanding of the
views of the Company’s shareholders.
Key roles and responsibilities of these
positions, and that of the Company
Secretary, are provided opposite.
 
Matters reserved for the Board
A schedule of formal matters reserved for the
Board’s decision and approval is available on
our website, haysplc.com. These largely relate
to matters of governance and business where
independence from executive management
is important, and include the following:
–– Approving financial results and other
financial, corporate and governance
matters;
–– Approving Group strategy;
–– Approving appointments to the Board;
–– Approving and recommending dividends
as appropriate and deciding dividend
policy;
–– Reviewing material litigation;
–– Approving major capital projects,
acquisitions and disposals;
–– Approving material contracts;
–– Reviewing annually the effectiveness of
internal control and the nature and extent
of significant risks identified by
management and associated mitigation
strategies; and
–– Approving the annual budget.
No changes to the schedule of matters were
made during the year. Board decisions are
usually by consensus at Board meetings. On
occasion, decisions may be taken by a majority
of Board members. In the case of an equality of
votes, Hays’ Articles of Association provide the
Chairman with a second or casting vote.
Alan Thomson
Non-Executive Chairman
–– Leadership and the effective
operation of the Board
–– Chairing the Board and Nomination
Committee
–– Setting the agenda, style and tone
of Board discussions including
promoting openness, debate and
effective individual contribution
–– Ensuring that all directors receive
clear and accurate information on
a timely basis
–– Ensuring the effectiveness of the
Board through induction, ongoing
training and regular evaluations
–– Effective communications with
shareholders
Paul Harrison
Senior Independent Director
–– Acting as a sounding board for
the Chairman
–– Serving as an alternative contact and
intermediary for other directors and
shareholders
–– Leading the Chairman’s annual
performance appraisal and ultimate
succession
Alistair Cox
Chief Executive
–– Day-to-day management of the
Group’s business
–– Formulating strategic business
objectives for Board approval and
implementing approved strategic
objectives and policies
–– Managing and optimising the operational
and financial performance of the business
in conjunction with the Group Finance
Director
–– Fostering a good working relationship
with the Chairman
–– Chairing the Management Board and
developing senior talent within the
business for succession planning
Key roles and responsibilities
Board commitment
The Board has established a policy permitting
its executive directors to hold only one external
non-executive directorship, subject to any
possible conflict of interest. This ensures that
executive directors retain sufficient time for
and focus on the Company’s business, whilst
allowing them to gain external Board exposure
as part of their leadership development.
Executive directors are permitted to retain
any fees paid for such services. Details of the
annual rate of fees payable to each of the
executive directors for their tenure during the
year ended 31 March 2016 (the year-end date
of the relevant companies) are shown below:
Director Fee
External
appointment
Alistair Cox* £80,000 3i Group plc
Paul Venables** £53,000 Wincanton plc
*	Stepped down as a non-executive director on
10 November 2015.
**	Stepped down as a non-executive director on
16 July 2015.
While the Company does not have a similar
policy for non-executive directors, their key
external commitments are reviewed each year
to ensure that they too have sufficient time
commitment for the fulfilment of their Board
responsibilities. Key external commitments of
the Board are included within their biographies
on pages 50 and 51.
The Board considered the commitments
of the Chairman and is satisfied that he has
sufficient time to devote to his Board
responsibilities with Hays.
Doug Evans
Company Secretary and General Counsel
–– Acting as Secretary to the Board, its
Committees and the Management Board
–– Providing legal and governance
support to the Board as a whole and
directors individually
–– Ensuring that the Group complies with
all relevant legal, regulatory and
governance requirements
Hays plc | 2016 Annual Report and Financial Statements53
OVERVIEW  STRATEGICREPORT  GOVERNANCE  FINANCIALSTATEMENTS  SHAREHOLDERINFORMATION
1. Developing a successful strategy 30%
2. Ensuring appropriate financial management 30%
3. Implementing governance and ethics and
monitoring risk 25%
4. Stakeholder engagement 15%
Percentage of time spent by the Board
1.
3.
4.
2.
Board focus during 2016 – What the Board has done in the year
1.	 Developing a successful strategy
–– Attended a Group strategy day, with
members of the Management Board and
other senior executives, to consider key
strategic priorities and challenges faced
across the business
–– Approved the Group strategy and
reviewed associated performance
–– Visited operations in Australia, Japan
and the UK, receiving presentations
from senior management on business
performance, the state of the market,
strategy, succession planning and
opportunities
–– Reviewed strategy plans and received
reports on the operational performance
for the Group’s regions
–– Received reports on technology
and innovation and related industry
developments
–– Reviewed Group risk
2.	Ensuring appropriate financial
management
–– Received and considered regular reports
on the Group’s financial performance
–– Approved financial announcements for
publication
–– Approved the annual budget
–– Approved dividend policy, payments
and recommendations as appropriate,
including consideration of a special
dividend
–– Reviewed and approved the Group’s
refinancing of its new revolving credit
facility
–– Met with the Company’s financial adviser
and corporate brokers
–– Considered ad hoc property and
finance-related transactions	
3.	Implementing governance and ethics
and monitoring risk
–– Performed the annual review of the
effectiveness of internal control and
the nature and extent of risks identified
together with mitigation plans
–– Reviewed regular reports on legal and
compliance matters from the Company
Secretary
–– Received formal training updates
on corporate reporting, legal and
regulatory matters
–– Reviewed Board and Committee
effectiveness
–– Reviewed and approved minor changes
to the terms of reference of the Board
Committees
–– Reviewed the Directors’ Conflicts
of Interest procedures
–– Reviewed the Company’s compliance
with the Code
–– Received updates and reviewed
procedures in connection with the
implementation of the Market Abuse
Regulation
4.	 Stakeholder engagement
–– Considered the results from TALKback,
the Group’s employee engagement
survey
–– Considered and approved invitations
under the Company’s all-employee
share plans
–– Received regular updates on views
and feedback from investors
–– Considered the Company’s investor
relations strategy
–– Considered and reviewed the leadership
and development strategy
–– Reviewed the Group’s succession plans
and assessed risks and options
Information and support
The Board meets regularly throughout
the year and agrees a forward calendar
of matters that it wishes to discuss at
each meeting. Standing items, including
operational, functional and financial reviews
and Committee updates are considered
at each scheduled Board meeting, with
unplanned items such as commercial or
property-related decisions being considered
as and when required. The Chairman, in
conjunction with the Chief Executive and
Company Secretary, plans the agenda
for each Board meeting and ensures that
supporting papers are clear, accurate, timely
and of sufficient quality to enable the Board
to discharge its duties.
All Board directors have access to the
Company Secretary, who advises them on
Board and governance matters. As well as
the support of the Company Secretary, there
is a procedure in place for any director to
take independent professional advice at the
Company’s expense in the furtherance of
their duties, where considered necessary.
Our culture
Hays is a people business and people are at
the core of what we do. As such we foster
a meritocratic and entrepreneurial culture,
which is reflected in our four brand values of:
–– Expert
–– Ambitious
–– Passionate about People; and
–– Inquisitive
To support this culture we maintain an open
style of communication, which is designed
to both identify issues early, and also to
recognise potential opportunities, so that in
both cases appropriate action can be taken
in terms of reducing any negative impact on
the business whilst ensuring opportunities
are exploited.
These characteristics and brand values are
core to our Group culture and are supported
via the following mediums and underpinned
by the Hays Group Policies and Procedures:
–– Corporate communications
–– Global intranet
–– Hiring, induction, training and promotion
criteria
Hays plc | 2016 Annual Report and Financial Statements54
LEADERSHIP
CONTINUED
Board attendance
The Board met a total of seven times during the year. In addition, the Board attended an annual Strategy Review meeting with the
Management Board being present. Six Board meetings were held in the UK and one in Sydney, Australia.
Board and Committee attendance for scheduled meetings during the year are shown below.
Board and Committee attendance Board
Audit
Committee
Nomination
Committee
Remuneration
Committee
Alan Thomson 7 of 7 – 4 of 4 –
Alistair Cox 7 of 7 – – –
Paul Venables(1)
6 of 7 – – –
Paul Harrison 7 of 7 4 of 4 4 of 4 4 of 4
Victoria Jarman 7 of 7 4 of 4 4 of 4 4 of 4
Torsten Kreindl 7 of 7 4 of 4 4 of 4 4 of 4
MT Rainey(2)
3 of 3 2 of 2 1 of 1 2 of 2
Richard Smelt(3)
3 of 4 2 of 2 1 of 2 2 of 2
Pippa Wicks(4)
7 of 7 4 of 4 2 of 4 4 of 4
Peter Williams 7 of 7 4 of 4 4 of 4 4 of 4
(1)	 Unable to attend one Board meeting due to a prior commitment.
(2)	Appointed 14 December 2015.
(3)	Retired from the Board on 11 November 2015. Unable to attend one Board and Nomination Committee meeting due to a prior commitment.
(4)	Unable to attend two Nomination Committee meetings due to prior commitments.
Risk management and internal control
The Board has overall responsibility for the
Group’s internal control systems and for
reviewing their effectiveness. This has been
designed to assist the Board in making
better, more risk-informed, strategic
decisions with a view to creating and
protecting shareholder value. In practice,
the Board delegates the task of implementing
its policy on risk and control to management.
Further support and assistance is provided
by an independent Internal Audit function,
details of which are provided in the Audit
Committee Report.
The Management Board oversees an
enterprise risk management system which
allows for a holistic, top-down and bottom-
up view of key risks facing the business.
These are recorded in a Group risk register,
which is reviewed at least annually by the
Management Board and submitted to the
Board thereafter to enable it to carry out
its risk oversight responsibility. This exercise
involves a current and forward look at
various risks affecting the business and
prioritising them according to risk magnitude
and likelihood. Risks covered include
operational, business and compliance risks
as well as financial risks. Each risk is assigned
an owner with current and future risk
mitigation procedures detailed, with the
continuing monitoring of these undertaken
on an ongoing basis. The principal risks
currently facing the business are detailed
in the Strategic Report.
The Group Risk Committee assists the
Management Board in providing strategic
leadership, direction, reporting and oversight
of the Group’s risk framework. The
Committee is chaired by the Group Finance
Director and membership includes
representation across the global network
and comprises operational, IT and finance
functions. Meetings are held three times a
year, with activities and recommendations
reported to the Management Board. The
Hays plc Board also has oversight of the
Committee and its activities.
The Board reviews the Group strategy
and approves a budget for the organisation
each year, to ensure that the performance
of the business is in line with the plan and
financial and operating reporting procedures
are in place. Comprehensive annual budgets
and forecasts are approved by the
Management Board and business divisions.
Monthly progress and variances are reported
to the Management Board and subsequently
to the Board at each meeting as part of the
control process.
Complementing these financial controls is
a set of Group-wide policies and procedures
addressing non-quantifiable risks. These
include the Group’s Code of Conduct and
Ethics, Anti-Bribery and Corruption Policy,
and whistleblowing arrangements. The
Board regularly receives management and
Committee reports which also form part of
the internal control system.
The Group’s internal control procedures are
subject to regular review and provide an
ongoing process for identifying, evaluating
and managing significant risks. This is in
accordance with the Guidance on Risk
Management and Internal Control and
Related Financial and Business Reporting
(September 2014). The Board recognises
that such a system has its limitations in that
risk management requires independent
judgment on the part of directors and
executive management. Internal controls are
designed to manage rather than eliminate
the risk of failure to achieve business
objectives, and can provide only reasonable
and not absolute assurance against material
misstatement or loss.
In accordance with its regulatory obligations,
the Board, with the assistance of the Audit
Committee, carried out an annual assessment
of the effectiveness of the Group’s risk
management and internal control system
during the reporting period. During the
course of its review, the Board did not
identify or hear of any failings or weaknesses
that it determined to be significant and
it therefore concluded that they are
operating effectively.
Conflicts of interest
Procedures are in place for the disclosure
by directors of any interest that conflicts,
or possibly may conflict, with the Company’s
interests and for the appropriate authorisation
to be sought if a conflict arises, in accordance
with the Company’s Articles of Association.
In deciding whether to authorise a conflict
or potential conflict of interest only those
directors that have no interest in the matter
under consideration will be able to take the
relevant decision; in taking such a decision
the directors must act in a way they consider,
in good faith, will be most likely to promote
the success of the Company and may impose
such limits or conditions as they think fit. The
Board has reviewed the procedures in place
and considers that they continue to operate
effectively. There were no actual or potential
conflicts of interest which were required to
be authorised by the Board during the year
under review or to the date of this report.
Hays plc | 2016 Annual Report and Financial Statements55
OVERVIEW  STRATEGICREPORT  GOVERNANCE  FINANCIALSTATEMENTS  SHAREHOLDERINFORMATION
1. United Kingdom 53%
2. Continental Europe 28%
3. North America 19%
Geographic breakdown of investor meetings
1.
2.
3.
Engagement with investors
Responsibility for shareholder relations
rests with the Chairman, Chief Executive
and Group Finance Director. They ensure
that there is effective communication with
shareholders on matters such as governance
and strategy, and are responsible for
ensuring that the Board understands the
views of major shareholders on such matters.
The Company’s investor relations
programme is supported by a dedicated
Investor Relations team which acts as the
primary point of contact with the investor
community and is responsible for managing
ongoing relations with investors and
shareholders. The Board receives regular
reports from the Investor Relations team.
Feedback from meetings held between
executive management, or the Investor
Relations team, and institutional
shareholders is also reported to the Board.
As a part of a comprehensive investor
relations programme, formal meetings are
scheduled with investors and analysts to
discuss the Group‘s interim and final results.
In the intervening periods, Hays continues
its dialogue with the investor community
by meeting key investor representatives,
holding investor roadshows and participating
in conferences. Meetings with debt providers,
principally the Company’s banks, also take
place on a regular basis. During the year, the
executive directors and senior management
met with almost two hundred institutions
around the world, interacting with
shareholders and potential shareholders.
Presentations to analysts are posted on the
Company’s website at haysplc.com and if
you would like to know more about our
relations with shareholders please contact
ir@hays.com.
As a reflection of the success of Hays’
investor relations efforts, Hays was ranked
No. 3 in the 2016 Extel Survey for best
investor relations by a listed company in
the European Support  Business Services
category. Within the survey, Alistair Cox, Paul
Venables and David Walker were also ranked
in the top three of their respective categories
of best Chief Executive Officer, best Chief
Financial Officer and best IR Professional.
Additionally, the Hays investor relations
team ranked No. 3 in the equivalent 2016
Institutional Investor Survey, within which
Alistair Cox, Paul Venables and David Walker
ranked in the top two spots of their
respective categories.
Investor meetings held in FY16
United
Kingdom
Continental
Europe
North
America Total
Alistair Cox 34 18 18 70
Paul Venables 78 43 23 144
Investor Relations team 127 68 47 242
Other senior management 17 4 5 26
Annual General Meeting
The Board uses the Company’s AGM to
communicate with investors and welcomes
their participation. All shareholders are
entitled to attend the AGM, at which the
Board members are present. The Board
views the AGM as a good opportunity to
meet with its smaller, private shareholders.
A summary presentation of results is given
by the Chief Executive before the formal
business of the meeting is conducted.
All shareholders present can question the
Chairman, the Chairmen of the Committees
and the rest of the Board both during the
meeting and informally afterwards.
The Notice of AGM and related papers are
sent to shareholders at least 20 working days
before the meeting. Voting on all resolutions
at the AGM is by means of a poll, which,
reflecting the number of voting rights
exercisable by each member, is considered
by the Board to be a more democratic
method of voting. As soon as practicable
following the conclusion of the AGM, the
proxy votes cast, including details of votes
withheld, are announced to the London
Stock Exchange via the Regulatory News
Service and published on our website.
Hays plc | 2016 Annual Report and Financial Statements56
RELATIONS WITH SHAREHOLDERS
Main Committee activities during the financial year
Role of the Nomination Committee
The role of the Committee is summarised
below and detailed in full in its terms of
reference, a copy of which is available on
the Company’s website (haysplc.com) under
Corporate Governance.
The main responsibilities of the Committee
are to:
–– Review the structure, size and
composition (including skills, knowledge,
experience, diversity and balance of
executive and non-executive directors)
Membership and meetings
–– Considered Board succession plans
–– Reviewed the composition of the Board
and its Committees
–– Reviewed the Committee’s terms
of reference
The Committee is appointed by the Board.
It is chaired by the Chairman of the Board
and comprises the non-executive directors,
all of whom are independent, save for
the Chairman who was independent on
appointment. The names and qualifications
of the Committee’s current members are
set out in the directors’ biographies on
pages 50 and 51.
August
2015
October
2015
November
2015
May
2016
Number of scheduled meetings in FY16
Committee member Meeting attendance FY16
Alan Thomson (Chairman)
Paul Harrison
Victoria Jarman
Torsten Kreindl
MT Rainey(1)
Richard Smelt(2)
Pippa Wicks
Peter Williams
(1)	 MT Rainey was appointed to the Board on 14 December 2015.
(2)	Richard Smelt retired from the Board on 11 November 2015.
–– Considered the appointment of a further
non-executive director
–– Considered and recommended the
election and re-election of each director,
as appropriate, at the AGM
Dear Shareholder
The Nomination Committee has continued to
support the Board during the year in ensuring
its composition has the right balance of skills,
experience, independence and knowledge
to best serve the business and fulfil the
Board’s responsibility to shareholders in the
ever-changing environment in which the
Company operates.
An ongoing area of focus for the Committee is
succession planning. As Chairman of both the
Committee and the Company, I am acutely
aware of the need to ensure there are no gaps
in skills or experience as Board members reach
the end of their relevant terms, whether three
years, six years, or longer. Paul Harrison will
reach the ninth anniversary of his election by
shareholders to our Board shortly after this
year’s Annual General Meeting in November.
The Committee have considered carefully
whether there are any factors, circumstances
or relationships, that could be considered to
compromise Paul’s independence and it
concluded that he remains independent in
character and judgment. I am therefore
delighted that Paul has agreed to remain as a
non-executive director at Hays plc for a further
year. Planning for his succession, and that in
future years of fellow directors, continues.
With Richard Smelt having retired during the
year, the Nomination Committee worked on
the profile of the individual required to be
The Committee meets as required and did
so on four occasions during the year and all
members were in attendance except Pippa
Wicks who could not attend two meetings
and Richard Smelt who could not attend
one meeting, due to prior commitments.
Other regular attendees at Committee
meetings include the Company Secretary
and, on invitation, the Chief Executive and
Group Finance Director.
recruited to fill that vacancy and also to ensure
the Board has the right skills and experience to
fulfil the Board’s aim for Hays to be the world’s
pre-eminent specialist recruitment business.
The Zygos Partnership was appointed to
facilitate the appointment of MT Rainey, who
was appointed by the Board on 14 December
2015, and we will continue to work with them
as we consider further opportunities as
vacancies arise.
of the Board and its Committees and
make recommendations to the Board
with regard to any changes;
–– Consider succession planning for
directors and other senior executives;
–– Identify and nominate for the approval
of the Board, candidates to fill Board
vacancies; and
–– Keep under review the time commitment
expected from the Chairman and the
non-executive directors.
Ongoing succession
planning remains an
area of focus for the
Committee
Board appointments will continue to be made
on merit, and the Committee recognises the
benefits of diversity and, provided we remain
true to our key principles, we will aim to build on
our existing diverse composition in the future.
Alan Thomson
Nomination Committee Chairman
1 September 2016
Hays plc | 2016 Annual Report and Financial Statements57
OVERVIEW  STRATEGICREPORT  GOVERNANCE  FINANCIALSTATEMENTS  SHAREHOLDERINFORMATION
EFFECTIVENESS
NOMINATION COMMITTEE REPORT
Alan Thomson
Chairman of the Nomination Committee
Non-executive director appointment process
The Company adopts a formal, rigorous and
transparent procedure for the appointment
of new directors and senior executives with
due regard to diversity. Prior to making an
appointment, the Committee will evaluate
the balance of skills, knowledge, experience
and diversity on the Board and, in light of this
evaluation, will prepare a description of the
role and capabilities required, with a view to
appointing the best-placed individual for the
role. In identifying suitable candidates, the
Committee uses open advertising or the
services of external advisers to facilitate the
search and considers candidates on merit
and against objective criteria and ensuring
that appointees have sufficient time to
devote to the position, in light of other
significant commitments, and no conflicts
of interest.
A long-list of potential candidates would
be drawn up, from which an appropriate
number would be shortlisted for interview
based upon their fulfilment of the
appointment criteria. The Committee
would then recommend to the Board the
appointment of the preferred candidate
(or candidates, if there is more than one
considered suitable) for subsequent
appointment.
During the year the Committee retained
The Zygos Partnership in respect of MT
Rainey’s appointment and they remain
engaged as further non-executive director
appointments are considered. The Zygos
Partnership is an independent executive
search consultancy and it has no other
connection with the Company.
In the year ahead, the Committee will
continue to assess the Board’s composition
and how it may be enhanced and will
consider diversity (gender and experience)
and geographic representation and continue
to use independent consultants as
appropriate to ensure a broad search
for suitable candidates.
Board composition is routinely reviewed to
ensure that the balance of skills, knowledge
and experience of the Hays Board remains
appropriate to its business.
Hays’ Group policy is to hire the best
candidates for all positions at all levels
throughout the business, irrespective of
gender, including candidates at Board level.
Board induction and development
On appointment, each director takes part
in a tailored and comprehensive induction
programme which is designed to give him or
her a deep understanding of the Company’s
business, governance and stakeholders.
Elements of the programme include:
–– Senior management briefings to provide
a business overview, current trading
conditions and strategic commercial
issues;
–– Meetings with the Company’s key
advisers and major shareholders, where
necessary;
–– Business site visits across regions;
–– A legal and regulatory briefing on the
duties of directors of listed companies;
–– Details of the Group corporate structure,
Board and Committee structures and
arrangements, and key policies and
procedures; and
–– The latest statutory financial reports and
management accounts.
The Board has not set any specific
aspirations in respect of gender diversity
at Board level and supports fully the Code
principles in respect of diversity. However,
the Board is of the view that diversity is less
about quotas, and recognises the benefits
of diversity, of which gender is one aspect,
and it will continue to ensure that this is
taken into account when considering any
particular appointment, whilst ensuring
appointments are made on merit and ability
to enhance the performance of the business.
Succession planning
A key task of the Committee is to keep
under review the Company’s succession
plans for members of the Board over the
short, medium and longer term, to ensure
the Board remains appropriately balanced
between new and innovative thinking and
longer-term stability. The focus during the
2016 financial year has been on identifying
a suitable replacement for Richard Smelt, as
well as planning for the succession of other
Board members.
Board appointment criteria are considered
automatically as part of the Committee’s
approach on succession planning. The
Committee believes that limited tenure and the
subsequent enforced retirement of directors
is not always appropriate for sound business
leadership. Accordingly, matters of director
tenure are viewed on a case-by-case basis.
At present, the Board has not set any specific
aspirations in respect of gender diversity
though it believes that refreshment of the
Board should take into account the need to
consider diversity in all forms.
Tenure of non-executive directors
Appointments to the Board are made for
initial terms not exceeding three years and
are ordinarily limited to three such terms
in office.
Director performance
Having reviewed the independence and
contribution of directors, the Committee
confirms that the performance of each of the
directors standing for election or re-election
at the 2016 AGM continues to be effective
and demonstrates commitment to their
roles, including independence of judgment,
commitment of time for Board and
Committee meetings and any other duties.
Accordingly, the Committee has recommended
to the Board that all current directors of
the Company be proposed for election
or re-election, at the forthcoming AGM.
The Board has a
clear understanding
of its role and interacts
effectively with
management
The Chairman, in conjunction with the
Company Secretary, ensures that directors
are provided with updates on changes in
the legal and regulatory environment in
which the Company operates. These are
incorporated into the annual agenda of the
Board’s activities along with wider business
and industry updates; the Chairman also
keeps under review the individual training
needs of Board members. The Company’s
principal external advisers provide updates
to the Board, at least annually, on the latest
developments in their respective fields, and
relevant update sessions are included in the
Board’s strategy meetings. The Company
Secretary presents corporate governance
reports to the Board as appropriate, together
with any relevant technical directives issued
by the Company’s auditor. In this way, each
director keeps their skills and knowledge
current so they remain competent in fulfilling
their role both on the Board and on any
Committee of which they are a member.
Hays plc | 2016 Annual Report and Financial Statements58
EFFECTIVENESS
CONTINUED
Board evaluation
During the 2016 financial year in accordance
with Code Provision B.6.2, the effectiveness
of the Board was assessed through an
external Board evaluation process,
conducted by ICSA Board Evaluation (ICSA).
ICSA has no other connection with the
Company (the Company uses ICSA Software
Limited for entity management and Board
portal solutions). One-to-one meetings were
held between the ICSA evaluator and the
directors and the Company Secretary. During
the meetings, seven broad topics were
considered and the evaluator ensured that
pre-defined constituent elements of each
topic were covered to ensure consistency
in the evaluation. The topic areas were Board
responsibilities, oversight, meetings, Board
support, Board composition, working
together and outcome and achievements.
Committee effectiveness was also assessed
separately. Results were presented to the
Board by the external evaluator and areas for
improved operation identified and agreed.
The outcome of the evaluation, with few
recommendations being made and which
are discussed below, indicated that the
Board is performing well.
The report noted that the Board has a clear
understanding of its role and responsibilities
and fulfils its oversight role effectively.
The interaction by the Board with
management is effective and within the
Board itself the executive and non-executive
members engage well. The division of
responsibilities between the Chairman and
Chief Executive are well understood and
matters that are reserved to the Board are
considered appropriate and regularly and
properly reviewed.
Board composition was considered to be
well balanced in terms of both numbers and
the executive to non-executive ratio. Whilst
Board membership has evolved with the
Company, the need to remain dynamic in
addressing the needs of the business moving
forward was acknowledged. In terms of
working together, the Board is considered
cohesive, with an open style and no one
individual or group dominating and displays
good chemistry.
Support for the Board is considered to be
a strength and the relationship between
the Company Secretary and the Board is
good. Access to professional advice is readily
available and Board members receive regular
updates on legal and regulatory matters,
with the Chairman taking a close interest
in Board education and Board development
generally.
Whilst the Board calendar had undergone
some change in recent years, it was
considered that further refinements could
be made to improve performance generally.
The Board continues to refine its approach
to risk, as identified in prior evaluations,
and the executive’s steps in this area had
brought matters more into focus for the
Board. One area of recommendation for
the Board as part of the evaluation was to
consider what measures could be taken to
enhance its reviews of the effectiveness of
the risk management process. Consideration
was given to the further review of risk
either within the Board or Audit Committee
calendar or, as suggested, through the
establishment of a separate Board risk
committee. The Board did not consider
that this would be necessary or appropriate
at this time.
In addition to the Board and Committee
evaluation, the Chairman evaluated the
individual performance and effectiveness
of each director. The Senior Independent
Director led a separate appraisal of the
Chairman’s performance with his fellow
non-executive directors, which took into
consideration both the executive and
non-executive directors’ views.
Hays plc | 2016 Annual Report and Financial Statements59
OVERVIEW  STRATEGICREPORT  GOVERNANCE  FINANCIALSTATEMENTS  SHAREHOLDERINFORMATION
The Audit Committee has supported the
Board in ensuring the Annual Report is fair,
balanced and understandable; in ensuring
the integrity of the Group’s financial
statements and the effectiveness of internal
control, shareholders are in turn able to
assess the Company’s performance, business
model and strategy.
Dear Shareholder
I am pleased to present to you the Audit
Committee report prepared in accordance
with the 2014 edition of the Code.
We have revised the Committee’s Terms
of Reference to bring them in line with the
2016 edition of the Code, under which it
is operating for future financial years.
You will be aware from prior years’ Reports
that we committed to undertake a full tender
of the Company’s external audit contract
this year, which commenced in early 2016.
Following a comprehensive process the
Committee recommended to the Board
that PwC be put forward to shareholders
for appointment at the Company’s 2016
AGM. I would like to record my thanks to
all those involved in the process, including
the unsuccessful tenderers, as the time
and effort invested by all was significant.
On behalf of the Company my thanks also
go to Deloitte for their role as the Company’s
auditor over many years.
In some way a reflection of the world in
which we live, the Committee has spent
time during the year assessing the potential
for, and impact of, the various forms of
cybercrime that may befall us. As a company,
technology is very important to us and
the way we operate, but technology
also represents a significant risk and it is
important we keep on top of such risks and
the Committee, along with the Board, keep
this very much in focus. On the subject of
risk, I am pleased with the progress being
made by the Group Risk Committee.
The Committee provides oversight of the
Company’s enterprise risk management
framework and continues to be satisfied that
the Board maintains sound risk management
and internal controls.
Another aspect of the Committee’s work
this year, also touching on the risk landscape,
has been in supporting the directors in their
assessment of the long term viability of
the Company for the purposes of the Code.
The work built on the existing robust process
we have in place around risk assessment
and mitigation and will hopefully provide
shareholders with further comfort in the way
the Company is managed and operated.
Role of the Audit Committee
The Committee’s terms of reference are
available on the Company’s website
(haysplc.com) under Corporate Governance.
The key responsibilities of the Committee
are to:
–– Monitor the integrity of the financial
statements of the Company, including
annual and half year reports, interim
management statements, and other
formal announcements relating to its
financial performance, and reviewing
and reporting to the Board on significant
financial reporting issues and judgments;
–– Where requested by the Board, review
the content of the Annual Report and
advise the Board whether, taken as
a whole, it is fair, balanced and
understandable and provides the
information necessary for shareholders
to assess the Company’s performance,
business model and strategy;
–– Recommend to the Board for approval
by shareholders, the appointment,
reappointment or removal of the
external Auditor;
–– Monitor the relationship with the
Company’s external Auditor, including
consideration of fees, audit scope and
terms of engagement;
–– Review the effectiveness and objectivity
of the external audit and the Auditor’s
independence;
–– On engagement of the external Auditor,
review the policy for the provision
of non-audit services and monitor
compliance;
–– Monitor and review the Company’s
internal control and risk management
systems;
–– Monitor and review the effectiveness
of the Company’s Internal Audit
function; and
–– Ensure compliance with laws,
regulations, ethical and other issues,
including that the Company maintains
suitable arrangements for employees
to raise concerns in confidence.
Technology is
very important
to us but can
also present
significant risk
In addition to discharging its financial
reporting, internal control and risk
management responsibilities, including
supporting the Board in ensuring the
Annual Report, as a whole, is fair, balanced
and understandable, during the course of
the year the Committee also considered,
amongst other matters, audit effectiveness
(both internal and external), non-audit
services policy and the Group’s
whistleblowing policy and procedures.
Further detail on the Committee’s activities
during the year under review is provided
below, which I hope will provide shareholders
with the necessary information for them to
assess the Company’s performance, business
model and strategy.
Victoria Jarman
Audit Committee Chairman
1 September 2016
Hays plc | 2016 Annual Report and Financial Statements60
ACCOUNTABILITY
AUDIT COMMITTEE REPORT
Victoria Jarman
Chairman of the Audit Committee
Main Committee activities during the financial year
Membership and meetings
–– Approved the annual Committee
programme
–– Reviewed financial results for publication
–– Considered the external audit plan and
reviewed the results of the audit
–– Approved the internal audit plan and
reviewed its findings
–– Reviewed the new requirements relating
to external auditor appointments and audit
partner rotation
–– Undertook a tender process for the
selection of the external audit
–– Reviewed the non-audit services provided
by the external auditor
–– Reviewed the risk management and
controls framework and its effectiveness,
together with the Group’s principal risks
–– Considered all aspects of IT operations
and risks including cyber
–– Reviewed the performance and
effectiveness of the external auditor
–– Reviewed the performance and
effectiveness of the internal audit function
The Committee is appointed by the Board from its independent non-executive directors.
Biographies of the Committee’s current members are set out on pages 50 and 51.
August
2015
November
2015
February
2016
May
2016
Number of scheduled meetings in FY16
Committee member Meeting attendance FY16
Victoria Jarman (Chairman)
Paul Harrison
Torsten Kreindl
MT Rainey(1)
Richard Smelt(2)
Pippa Wicks
Peter Williams
(1)	 MT Rainey was appointed to the Board on 14 December 2015.
(2)	Richard Smelt retired from the Board on 11 November 2015.
The Chairman of the Committee and its
financial expert, Victoria Jarman, is a
Chartered Accountant, who also chairs the
Audit Committee of Equiniti Group plc. All
Committee members are financially literate.
The Committee discharges its responsibilities
through a series of scheduled meetings
during the year, the agenda of which is linked
to events in the financial calendar of the
Company. The Committee met four times
during the financial year and all members
were in attendance at all meetings during
their tenure.
The Committee commissions reports, either
from external advisers, the Head of Internal
Audit, or Group management, as required,
to enable it to discharge its duties. The
Group Finance Director and the Group
Financial Controller attend its meetings,
as do the external Auditor and the Head
of Internal Audit, both of whom have the
opportunity to meet privately with the
Committee Chairman, in the absence of
Group management. The Chairman of the
Board and the Chief Executive are also
invited to, and regularly attend, Committee
meetings.
–– Reviewed the Group’s whistleblowing
arrangements
–– Carried out a review of the Committee’s
effectiveness and reviewed progress
on matters arising from previous
assessments
–– Considered the Code requirements
concerning fair, balanced and
understandable reporting
–– Considered the Company’s long-term
viability
–– Recommended the Audit Committee
Report for approval by the Board
–– Reviewed senior finance personnel
across the Group
–– Held discussions with the external
auditor and the Head of Internal Audit
without management being present
Annual Report review
In addition to its work described here, the
Committee has reviewed the financial and
narrative disclosures in this year’s Annual
Report. It has advised the Board that, in its
view, taken as a whole, the Annual Report
is fair, balanced and understandable and
provides the information necessary for
shareholders to assess the Group’s
performance, business model and strategy.
Fair, balanced and understandable
In making its recommendation to the Board
that the Annual Report, taken as a whole,
is fair, balanced and understandable, the
Committee’s robust governance approach,
included:
–– Comprehensive Group and subsidiary
accounts process, with written
confirmations provided by the regional
senior management teams on the health
of the financial control environment;
–– Reviews of the Annual Report undertaken
at different levels of the Group and by the
senior management team that aim to
ensure consistency and overall balance;
–– External audit review;
–– Clear guidance and instruction of the
requirement provided to contributors;
–– Written confirmation that information
provided has been done so on a fair
and balanced basis;
–– Additional scrutiny by senior
management; and
–– Additional reviews by the Committee
Chairman of the draft Annual Report in
advance of the final sign-off in the context
of the revised Code provision.
Final sign-off is provided by the Board, on
the recommendation of the Committee.
Significant issues considered during
the year
In reviewing both the half and full year financial
statements, the following issues of significance
were considered by the Committee and
addressed as described. These matters are
described in more detail in note 3 to the
Consolidated Financial Statements.
Debtor and accrued income recoverability
The recoverability of trade debtors, accrued
income and the level of provisions for bad debt
are considered to be areas of significant
judgment due to the pervasive nature of these
balances to the financial statements and the
importance of cash collection in the working
capital management of the business. The
Committee considered the level and ageing of
debtors and accrued income, together with the
appropriateness of provisioning, by reviewing
previous experience of bad debt exposure and
the consistency of judgments made year-on-
year. The Committee was satisfied that the
level of provision and the carrying value of
debtors and accrued income is appropriate.
Hays plc | 2016 Annual Report and Financial Statements61
OVERVIEW  STRATEGICREPORT  GOVERNANCE  FINANCIALSTATEMENTS  SHAREHOLDERINFORMATION
As reported previously, the Committee has
undertaken a full tender of the Company’s
external audit contract. The Committee
is pleased to report that the Board has
approved the proposed appointment of
PricewaterhouseCoopers LLP as the
Company’s auditor for the coming financial
year. This appointment remains subject to
approval by shareholders at the next Annual
General Meeting. The Competition and
Markets Authority Statutory Audit Services
Order 2014 sets out certain regulations in
respect of audit tendering and appointments
and related audit committee responsibilities
which came into effect for financial years
commencing on or after 1 January 2015.
The Company has complied with the
provisions of the Order for the financial
year ended 30 June 2016.
Auditor Independence and Non-Audit
Services Policy
The Committee believes that the issue of
non-audit services to Hays is closely related
to external Auditor independence and
objectivity. The Committee recognises
that the independence of the external
Auditor may reasonably be expected
to be compromised if they also act as
the Company’s consultants and advisers.
Having said that, the Committee accepts
that certain work of a non-audit nature is
best undertaken by the external Auditor.
To keep a check on this, the Committee has
adopted a policy to ensure that the provision
of any non-audit services by Deloitte does
not impair its independence or objectivity.
The key features of the non-audit services
policy are as follows:
–– The provision of non-audit services
provided by the Company’s external
Auditor be limited to a value of 70% of
the average audit fees over a three-year
period;
–– Any non-audit project work which could
impair the objectivity or independence of
the external Auditor may not be awarded
to the external Auditor; and
–– Delegated authority by the Committee for
the approval of non-audit services by the
external Auditor is as follows:
Authoriser
Value of services per
non-audit project
Group Financial
Controller
Up to £25,000
Group Finance Director Up to £150,000
Audit Committee Above £150,000
Deloitte’s fee in respect of its 2016 financial
year audit of Hays was £0.9 million.
Accordingly, the maximum value of non-
audit services that Deloitte could have been
engaged by Hays to provide during the
financial year 2016 was £0.7 million. The total
audit fee for non-audit services provided by
Deloitte during the 2016 financial year was
£0.7 million (2015: £0.4 million). The main
components of the £0.7 million non-audit
services were as follows:
–– Half year review: £0.1 million;
–– Taxation compliance: £0.1 million; and
–– Tax advice and other services: £0.5
million, of which £0.3 million related
to a transfer pricing project.
Tax advice and other services include the
completion of a comprehensive review of
our transfer pricing framework to enhance
existing arrangements such that the Group
will continue to conform to best practice
under OECD guidelines. The Group’s existing
arrangements are well known to Deloitte
both in the UK and globally. This, together
with the expertise within the firm, meant that
they were best placed to partner us in this
piece of work.
No single non-audit project undertaken
by Deloitte during the 2016 financial year
exceeded £302,000. The Company did
not pay any non-audit fees to Deloitte on a
contingent basis. A summary of the fees paid
to the external Auditor is set out in note 6 to
the Consolidated Financial Statements.
Having reviewed Hays’ non-audit services
policy this year, the Committee is satisfied
that adequate procedures are in place to
safeguard the external Auditor’s objectivity
and independence.
Effectiveness of the external Auditor
The annual effectiveness review was
conducted under the guidance of the
Committee Chairman, on behalf of the
Committee, and covered amongst other
things a review of the audit partners, audit
resource, planning and execution, Committee
support and communications, and Deloitte’s
independence and objectivity. Overall
feedback was positive with resulting
improvements, which were largely country-
specific, discussed and implemented. On the
basis of this review, the Committee was
satisfied with the performance of Deloitte in
the fulfilment of its obligations as external
Auditor and of the effectiveness of the audit
process.
Revenue recognition
The main areas of judgment in revenue
recognition relate to (i) cut-off as we
recognise permanent placement income
on the day a candidate starts work, and
temporary placement income over the
duration of the placement; and (ii) the
recognition of temporary contractual
arrangements where we act as principal
on a gross basis rather than net basis. The
Committee discussed and reviewed these
areas with both management and the
Auditor and remains satisfied that Group
accounting policies with regard to revenue
recognition have been adhered to and that
judgments made remain appropriate.
Goodwill
The Committee assessed the carrying
value of goodwill by reviewing a report
by management which set out the values
attributable to each cash-generating unit
(CGU), compiled using projected cash flows
based on assumptions related to discount
rates and future growth rates. The Committee
also considered the work undertaken by
Deloitte and management’s sensitivity
analysis on key assumptions. In the case
of Veredus the Committee considered the
disclosure in respect of this CGU. After
discussion, the Committee was satisfied that
the assumptions used were appropriate.
Pension accounting
Pension accounting is complex and contains
areas of significant judgment, most notably
those in respect of the discount and inflation
rates used in the valuation of the net deficit
disclosed in note 22. The Committee
reviewed the pension items, including those
relating to the adoption of IAS 19 Employee
Benefits (Revised), by discussing a report
prepared by management based on work
performed by the Company’s actuary
which set the key assumptions used in the
calculation of the deficit and related income
statement items. The Committee also
considered the work performed by Deloitte’s
specialist pension team in testing the
assumptions and was satisfied that the
assumptions used and the disclosures in
the financial statements are appropriate.
External Auditor
Both the Committee and the Board keep
the external Auditor’s independence and
objectivity under close scrutiny, particularly
in regard to its reporting to shareholders.
Deloitte LLP has been the external Auditor
of the Group since listing in October 1989.
Professional rules require that the Company’s
audit partner at Deloitte be rotated every
five years; the current lead partner, Stephen
Griggs, was appointed following the 2011
year-end results.
Hays plc | 2016 Annual Report and Financial Statements62
ACCOUNTABILITY
CONTINUED
Risk management and internal control
The Board is responsible for the adequacy
and effectiveness of the Group’s internal
control system and risk management
framework, which in order to fulfil its
responsibilities the Board has delegated
authority to the Committee.
In order to establish an assessment from
both a financial and operational control
perspective, the Committee looks to the
work of the Internal Audit function,
specifically to consider whether significant
process and control weaknesses are
identified, improved and monitored and
that risks have been identified, evaluated
and managed.
The Committee considered the Group’s
risk assessment process, which included
coverage across the regions, businesses
and functions within the Group, primarily
IT and treasury, reviewing the effectiveness
of the risk methodology employed, the risk
mitigation measures implemented and future
risk management and monitoring.
Internal Audit
The Committee oversees and monitors
the work of the Internal Audit function,
which reviews key controls and processes
throughout the Group on a rolling basis,
including resources, scope and effectiveness
of the function.
The Group Head of Internal Audit has direct
access to the Committee, and meets regularly
with both the Committee and its Chairman
without the presence of management to
consider the work of Internal Audit.
The Committee approved the programme
of work for the Internal Audit function in
respect of the 2016 financial year, which
was focused on addressing both financial and
overall risk management objectives across
the Group. During the year, 39 Internal Audit
reviews were undertaken, with the findings
reported to both the Management Board
and the Committee, with recommendations
tracked and progress subsequently reported
back to the Committee.
No significant weaknesses were identified
as a result of risk management and internal
control reviews undertaken by Internal Audit
during the reporting period.
The Committee believes that the Group’s
enterprise risk management framework
needs to continue to evolve in accordance
with the growth of the Hays’ business around
the world. Throughout the financial year the
Internal Audit team has continued to
enhance the enterprise risk management
framework and work with the Group Finance
Director and the operating companies across
the globe to further develop and embed the
framework methodology at a local level.
The formation of a Group Risk Committee
chaired by the Group Finance Director and
comprising senior operators from each
region will assist in the management of risk
in the Group.
Raising concerns at work
The whistleblowing procedure in place
across the Group ensures that employees are
able to raise any concerns about any possible
improprieties in business practices, or other
matters, in confidence; this is managed and
reported through an external third party.
The disclosures under this arrangement are
investigated promptly by Internal Audit and
escalated to the Management Board and the
Committee as appropriate, with follow-up
action being taken as soon as practicable
thereafter.
The Committee, as part of its overall review
of the Group’s system of internal control,
reviewed the procedures in place during the
reporting period and is satisfied that they are
appropriate to the size and scale of the Group.
Anti-bribery and corruption
Hays has a zero-tolerance approach to
bribery and corruption. The Group Anti-
Bribery and Corruption Policy (with specific
reference to the UK Bribery Act 2010) is
issued to all employees. Overall responsibility
for, and oversight of, the Policy lies with
the plc Board. Training is provided to all
employees annually in local languages
and ongoing support is provided when
and where necessary. In addition, risk
assessments are carried out on an ad hoc
basis, for example when new countries are
under consideration (whether they are
considered to be low or high risk) or prior
to entry into new public sector markets. The
Committee reviewed the effectiveness of the
Policy during the year and concluded that it
was sufficient for managing the anti-bribery
and corruption risks faced by the Group.
Audit Committee effectiveness
The Committee considered its effectiveness
in discharging its duties during the year. The
Committee looked at the work it had carried
out during the year and considered that its
performance during the year was effective
when measured against its terms of
reference and general audit committee best
practice. Details of the main activities of the
Committee and its role and responsibilities
have been detailed earlier in this Report.
The Chairman of the Committee will be
available at this year’s AGM to answer any
questions on the work of the Committee.
Hays plc | 2016 Annual Report and Financial Statements63
OVERVIEW  STRATEGICREPORT  GOVERNANCE  FINANCIALSTATEMENTS  SHAREHOLDERINFORMATION
performance indicators together with
longer-term strategic initiatives, and take
into account Group risk. We also consider
the relationship between executive reward
and the reward structures in place for other
Group employees. The Committee is always
mindful to ensure the strength of the link of
performance to reward and that it does not
reward for failure.
A Remuneration Policy fit for the future and
long-term sustainability of the business
In December 2015, the Committee began
an in-depth review of the overall executive
remuneration policy and structure with a view
to ensuring that it is still fit for purpose in light of
our future strategy over the coming years and
the continuing cyclical nature of our business.
While we have a diversified portfolio designed
to try and mitigate any substantial swings
in business performance by embracing
both temporary and permanent candidate
placements, wide-ranging business specialisms
and a global geographical footprint, we
nevertheless are subject to the volatility and
vagaries of the economic markets which can
create sudden changes within the recruitment
industry. In recent months, this has manifested
itself through the general uncertainty triggered
by the ‘Brexit’ referendum in the UK and wider
global unrest underpinned by changes in
countries’ political leadership and general
instability in certain geographical areas.
In looking to the future therefore, the Committee
wants to ensure that our reward structure and
remuneration policy complement our future
strategy and incentivise our executives to
ensure the long-term sustainability of our
business in a challenging environment.
Shareholder consultation and support on any
proposed changes are very important to us
This important review of the Remuneration
Policy, which is mentioned above, will continue
during FY17, with the Committee being mindful
that the next shareholder binding vote on our
Remuneration Policy is due at the November
2017 AGM.
We strongly value the support of our
shareholders and are very aware of the views
and guidelines issued by investor bodies on
corporate governance, remuneration structures
and good practice. The Committee will take into
consideration the ongoing debate on executive
pay, together with publications issued on these
subjects, and will ensure that it allows the
appropriate time to discuss and consult with
our shareholders should the Committee
decide to seek future changes to the Policy.
The Committee is committed to an open and
honest dialogue in this respect.
The main objective of the Remuneration
Committee is:
To promote the long-term success of the
Company by attracting, motivating and
retaining highly skilled executives, while
strongly advocating and ensuring a
culture of high performance and sound
values linked to appropriate reward.
During 2016 the Committee:
Began an in-depth review of the executive
remuneration structure in order to
determine whether the current policy will
continue to complement our future strategy
and recognises the challenges relating to
the cyclical nature of our business.
The Committee’s priorities and actions
for FY17 are:
To continue the review of the executive
remuneration structure in preparation for
the next shareholder binding vote on the
Executive Remuneration Policy at the FY17
AGM. The Committee will ensure adequate
time for appropriate consultation and
discussion with shareholders if any changes
are felt to be required.
To conduct a full tender for an independent
adviser to the Committee as a result of
PwC stepping down with effect from 30
June 2016 due to their successful bid to be
our independent external Auditor.
This is the third year in a row that Hays has
delivered strong profit performance. Such
strong results, allied to outperformance in
Hays’ share price over the last three years
relative to its competitors, has directly
contributed towards the reward outcomes for
the executive directors both in the annual and
long-term incentives, as will be covered below.
Our executive reward for 2016 reflects these
strong results and links pay to performance
Annual Bonus
Annual Bonus awards reflected the 2016
performance and were 65.76% of the
maximum award (82.20% of base salary) for
the CEO and the CFO. Maximum opportunity
was 125% of base salary. 40% of each award
will be deferred into shares for three years.
2013 Performance Share Plan (‘PSP’)
The 2013 PSP vested at 85.59% of the award
(149.78% of salary out of a maximum of
175%) reflecting the three-year performance
period that ended on 30 June 2016.
Full details of the executive directors’
remuneration for 2016 can be found in the
Single Figure on page 70 and the full Annual
Report on Remuneration on pages 70 to 85.
The Committee takes very seriously its duty
to exercise judgment and ensure outcomes
are reflective of the Company’s underlying
performance and shareholder experience.
No discretion on any element of remuneration
was exercised during FY16.
Remuneration for FY17
The executive directors received base salary
increases of 2.0% effective from 1 July 2016.
This was in line with the average pay increase
for other UK relevant employees.
Executive directors will receive an FY17 PSP grant
of 175% of base salary which will vest in 2019
dependentontheperformancecriteriabeingmet.
Our Chairman’s fee and the base fee for the
other non-executive directors (NEDs) were
also increased by 2.0% from 1 July 2016.
Details of the Chairman’s and NEDs’ fees can
be found on page 83.
Our Committee activities
During 2016, the Committee formally met
four times as well as maintained ongoing
dialogue via email or telephone discussion.
Our key regular agenda items include
reviewing the basic pay, bonus and PSP awards
for the executive directors and other senior
executives. The Committee ensures that their
targets and objectives are suitably stretching,
include the principal Company financial
Dear Shareholder
I am pleased to introduce our Directors’
Remuneration Report for 2016.
Our business continues to deliver
strong results
2016 has been another strong year for Hays.
With our markets outside of the UK broadly
supportive, management invested to drive
good growth of 7% in net fees and, through
effective operational management and strong
cost control especially in the UK, delivered
strong operating profit leverage, with profits
up 13% and good cash conversion.
Hays plc | 2016 Annual Report and Financial Statements64
REMUNERATION REPORT
CHAIRMAN’S ANNUAL STATEMENT AND SUMMARY
Paul Harrison
Chairman of the Remuneration Committee
July
2015
August
2015
December
2015
May
2016
Number of scheduled meetings in FY16
Senior independent non-executive director Attendance at scheduled meetings
Paul Harrison (Chairman)
Independent non-executive directors
Torsten Kreindl
Victoria Jarman
Pippa Wicks
Richard Smelt(1)
Peter Williams
MT Rainey(2)
(1)	Richard Smelt stood down from the Board at the 2015 AGM.
(2)	MT Rainey joined the Remuneration Committee on 14 December 2015.
Section What it includes
Letter from the Remuneration
Committee Chairman
Page 64
Our key results, remuneration decisions,
Committee activities for FY16 and plans
for FY17.
Remuneration At A Glance
Page 66
The key aspects of our Remuneration
Structure, how we have performed and
how we applied our policy during FY16.
How Remuneration links to strategy
and risk
Page 68
How our reward elements link to our
strategic pillars and take account of risk.
Annual Report on Remuneration
Page 70
1.	 Single Figure of Remuneration
2.	 Long Term Value Creation
3.	 Remuneration in the Broader Context
4.	Statement of Implementation of the
Remuneration Policy in the Following
Financial Year
5.	Governance
Our full Remuneration Policy This can be found on our website at
haysplc.com. A summary of relevant
aspects can be found throughout this report.
See the Committee’s Terms of Reference
online at haysplc.com
Membership and meetings
This report is structured as follows:
Annual Bonus and PSP Targets for FY17
When the Committee met in August 2016
to finalise the targets for FY17, it was in the
context of a more uncertain economic
outlook, especially in the UK following the
‘Brexit’ referendum result. The Committee
carefully considered the targets it should
apply to incentive awards (i.e. both annual
bonus and PSP awards) for FY17.
We decided to widen the range around the
EPS targets for the FY17 annual bonus to
reflect the increased uncertainty on FY17
earnings and to ensure that any maximum
bonus target would require a level of profit
achievement materially above the then
consensus external forecast and that achieved
in FY16. The annual bonus targets for FY17
will be disclosed in our FY17 annual report.
In setting the EPS target (which represents
one-third of the PSP award) for the FY17 PSP
award, noting that the mechanics for this are
consistent with prior years, it is recognised that
the EPS target range is lower in absolute terms
than the target applied to the awards made in
FY16. However the Committee is comfortable
that these targets are no less challenging in
relative terms than the targets applied to the
FY16 PSP awards and are consistent with
external forecasts at that time.
Renewal of the Deferred Annual Bonus
(DAB) Plan
Our current approved Remuneration Policy
requires executive directors to defer 40%
of any annual bonus award into shares for
a period of three years. During this period,
the deferred awards are subject to Malus
conditions. The deferral is made under
the terms of the Deferred Annual Bonus
Plan (DAB). This plan was adopted by
shareholders in April 2007 and therefore
expires in April 2017. In order for us to
continue to operate the current policy in
relation to any bonus award made in relation
to FY17 (which would be considered at
the August 2017 Remuneration Committee
meeting), we need to renew the DAB plan.
Therefore, it is proposed to put forward a
Resolution to renew the DAB at the 2016
AGM. There will be no changes to the current
policy operation.
Our independent remuneration adviser
During 2016, the Committee engaged the
services of PwC as its independent adviser.
Following the successful tender by PwC
to become the Company’s new external
Auditor, PwC ceased to advise the
Committee from 30 June 2016. During FY17 a
full, formal tender process will be conducted
to appoint a new independent adviser.
For more information on our Terms of Reference, Meetings held in 2016 and the Advisers
to the Remuneration Committee go to page 85
We aim to be clear, concise and
straightforward in our reporting
We aim to make the Directors’ Remuneration
Report clear, concise and easy to follow.
As there is no change this year to our formal,
approved Remuneration Policy, it can be found
on our website haysplc.com. This complements
our approach to becoming more digital.
To help with understanding the FY16
remuneration outcomes in relation to our
Policy, we have summarised the key features
of our reward components alongside the
actions we have taken or awards made.
We have also included a Remuneration At
A Glance page and a table to show how our
reward links to our strategy and Group risk.
We hope that readers will find this helpful.
We trust that this report demonstrates
how we balance performance, reward and
underlying associated behaviours and that
we place great importance on our duty to
shareholders.
Paul Harrison
Chairman of the Remuneration Committee
1 September 2016
Hays plc | 2016 Annual Report and Financial Statements65
OVERVIEW  STRATEGICREPORT  GOVERNANCE  FINANCIALSTATEMENTS  SHAREHOLDERINFORMATION
The key elements of our Remuneration Policy How we have performed
–– Provide a balanced package with a strong link between reward
and individual and Group performance;
–– Encourage a material, personal stake in the business to give
a long-term focus on sustained growth; and
–– Operate a consistent reward and performance philosophy
throughout the business.
Annual Bonus
Metrics measure the success of the day-to-day management
of a volatile and cyclical business.
Metric Target Maximum Actual
% of max
achieved
EPS 8.12p 8.60p 8.19p* 66.50%
Cash conversion 86% 101% 80.11% 44.29%
Personal CEO 85%
Personal CFO 85%
*	Both the target and actual performance were based on Budget exchange
rates. Therefore the actual performance for bonus purposes is lower than the
reported performance due to movements in exchange rates during the year.
September 2013 PSP award
Metrics measure the success of managing the long-term sustainability
of the business and the outcome reflects the success in delivering
strong results through the three-year cycle. 85.59% of the maximum
award vested i.e. 149.78% of base salary (maximum is 175%).
Metric and weighting
Maximum
Target Actual
% of max
achieved
Relative TSR against
comparator group
(50%)
Upper
quartile
(UQ)
46% 71.17%
EPS (50%) 20.09p(1)
22.05p 100%
Key general business highlights in FY16
–– Like-for-like net fee growth of 7%(2)
–– Operating profit up 13%(2)
–– Good cash conversion
(1)	Adjusted for actual RPI.
(2)	Like-for-like growth represents organic growth of continuing operations
at constant currency.
Reward linked closely to performance
EPS – Above Target
Cash conversion – Between
Threshold and Target
Personal objectives – 85% for
both CEO and CFO
Fixed elements
Variable elements
Shareholding requirements
Definition
Set in relation to
skills, expertise and
experience.
Definition
Maximum 125% of base
salary. 40% of any award
is deferred into shares for
three years. The cash
element is subject to
clawback for three years
from award. Malus applies
to the deferred element.
Definition
200% of base salary for CEO
and 100% of salary for CFO.
Definition
Includes pension,
health cover, life
assurance and car
allowance.
Definition
Maximum 175% of base
salary. Three-year
performance period.
Malus applies during the
performance period and
clawback for two years
post vesting.
Base
salary
Annual
bonus
Annual
bonus
PSP
Return to
shareholders
Core
benefits
Total
Reward
For more information go to pages 72 and 73
EPS – Outperformed
TSR – Close to Upper Quartile
Note:
2013 PSP had no cash conversion metric.
Dividend
2.90p
Performance
Share Plan
(PSP)
Hays plc | 2016 Annual Report and Financial Statements66
REMUNERATION REPORT
REMUNERATION AT A GLANCE
Our Remuneration Policy and structure and how this was applied
Key reward component Key features What we have done
Base salary and
core benefits
Competitive salary and benefits to attract
right calibre of executive.
Increased salaries for Chief Executive
and Group Finance Director by 2.0% with
effect from 1 July 2016.
New salaries:
Alistair Cox, Chief Executive:
£723,480
Paul Venables, Group Finance Director:
£521,628
Increase in line with budget set for
relevant UK employees of 2.0%.
There were no changes to benefits during
the year.
Annual Bonus
1. 60% EPS
2. 20% Cash conversion
3. 20% Personal
1.
2.
3.
–– Max potential 125% of salary.
–– Key financial KPIs and personal objectives.
–– 60% paid in cash (Clawback applies for
three years from payment).
–– 40% deferred in shares for three years
(Malus applies for the three deferral years).
Alistair Cox, Chief Executive:
65.76% of maximum, i.e. 82.20% of salary
equating to £583,022.
Paul Venables, Group Finance Director:
65.76% of maximum, i.e. 82.20% of salary
equating to £420,358.
40% of the above awards deferred into
shares for three years.
Performance Share Plan (PSP)
1. 1/3 EPS
2. 1/3 Cash conversion
3. 1/3 TSR
1.
2.
3.
–– Max potential 175% of salary.
–– KPIs focused on long-term sustainability
and shareholder returns.
–– Three year performance period.
–– Malus applies during the performance
period, Clawback applies for two years
post vesting.
175% of salary awarded.
Shareholding requirements Ensure material personal stake in the business.
Alistair Cox, Chief Executive:
200% of salary
Paul Venables, Group Finance Director:
100% of salary
Shareholdings at 30 June 2016:
Alistair Cox, Chief Executive:
481% of salary
Paul Venables, Group Finance Director:
308% of salary
For more information on the Single Figure go to page 70
Hays plc | 2016 Annual Report and Financial Statements67
OVERVIEW  STRATEGICREPORT  GOVERNANCE  FINANCIALSTATEMENTS  SHAREHOLDERINFORMATION
Key remuneration component Time horizon (years)
Fixed element 1 2 3 4
Base salary
and core
benefits
Variable elements 1 2 3 4
Annual bonus:
Cash element
Annual bonus:
Deferred element
Performance
Share Plan
Shareholding
requirements
Our Remuneration Policy was approved
by shareholders at the Company’s AGM
on 12 November 2014 and received strong
support with a favourable vote of 92.62%.
There is no change to the Remuneration Policy
this year. Our full Remuneration Policy can
be found on our website at haysplc.com
and in our FY14 Annual Report. However,
we have included a policy summary for each
remuneration element alongside the detailed
disclosure of the Single Figure of Remuneration
and beside other tables throughout this report
which we hope will help understanding.
As stated in our FY15 report, in line with the
revised UK Corporate Governance Code (the
Code) issued in September 2014, we included
clawback provisions in our incentive plans
during 2015. In accordance with the Code,
these are effective in relation to all awards
made in the financial year 2016 and thereafter.
Clawback provisions therefore apply to the PSP
awards granted in September 2015 for two
years post any vesting, with malus provisions
in place during the performance period.
Clawback provisions also apply for a period
of three years to the cash element of the
bonus awarded in 2016 in relation to FY16
performance and malus provisions apply to
the deferred element.
Our Annual Report on Remuneration for
the financial year 2015 received a positive
vote of 96.69% indicating support for our
approach towards the application of our
Remuneration Policy.
–– Votes for – 962,720,176 (96.69%)
–– Votes against – 32,968,188 (3.31%)
–– Votes withheld – 10,632,042
The table adjacent shows how we link our
Remuneration Policy to our strategy and
take into account risk.
Links to strategy
Strategic priority 1
Materially increase and diversify Group profits.
Strategic priority 2
Build critical mass and diversity across our
global platform.
Strategic priority 3
Invest in people and technology, responding
to change and building relationships.
Strategic priority 4
Generate and distribute meaningful cash
returns.
For more details on strategy please go to
pages 20 and 21
Hays plc | 2016 Annual Report and Financial Statements68
REMUNERATION REPORT
HOW REMUNERATION LINKS TO STRATEGY AND RISK
How our Remuneration Policy links to our strategy How our Remuneration Policy takes into account risk
Base salary, associated benefits and variable pay
elements combine to attract, retain and motivate the
calibre of executives required to shape and execute
strategy and generate superior shareholder returns.
Link to relevant strategic priority:
1 32
A principal risk is the loss of specialised talent.
This is mitigated by offering a competitive package against businesses of a
comparable size and comparable peer group as well as recognising the breadth
of the role and individual experience the role-holder brings to the Company.
Financial and personal objectives are set with reference
to our business strategy approved by the Board.
Current weighting and measures are:
–– 60% Earnings per share*
–– 20% Cash conversion*
–– 20% Personal
*	Key Performance Indicators (KPIs).
Link to relevant strategic priority:
1 3 42
In establishing the annual Group budget, the Board seeks to ensure that
achievable, yet stretching, goals are properly balanced with risk. Financial targets
for reward are then linked to budget.
The financial metrics chosen are KPIs of the business and therefore reflect how
well management mitigates our principal financial and reputational business risks
which include:
–– Its cyclical nature, closely linked to the economy;
–– Ensuring we have the right business model to deal with market changes;
–– The importance of compliance and data governance when operating across
33 countries with multiple regulatory and legal frameworks; and
–– Increased reliance on technology and the associated risk of data loss or
system failure.
Personal objectives are linked to the delivery of key projects designed to
enhance the Group’s operational strength and competitiveness in line with
future strategy. They include operating within our Group risk framework.
Bonus deferral into shares helps focus on long-term outcomes.
The annual bonus also has malus provisions during the three-year deferral
period and clawback provisions (new for the cash element of the bonus made in
relation to FY16 and going forward, and applicable for three years post award).
Deferred bonus is awarded in shares and therefore
helps align future focus with that of shareholders and
longer-term strategy.
Link to relevant strategic priority:
1 3 42
Key financial performance metrics are set in line with the
Company’s long-term strategy approved by the Board.
Current performance conditions are:
–– One-third based on total shareholder return (TSR)
relative to a comparator group, with vesting subject
to satisfactory financial performance over the
period, as determined by the Committee;
–– One-third based on cumulative earnings per share
(EPS); and
–– One-third based on cash conversion
Link to relevant strategic priority:
1 3 42
The PSP metrics mitigate risk by providing a balanced approach of actual
financial performance and business efficiency over a longer time period,
together with relative performance against comparable businesses and
longer-term alignment with shareholders.
The TSR metric measures the relative return from Hays shares against a basket
of comparator companies and the result is underpinned by the Company’s
underlying financial performance.
The EPS metric targets are calculated taking into account the Company budget
for Year 1 plus growth around an assumed rate of RPI.
The cash conversion metric indicates the continuous focus on ongoing
business cash efficiency whatever the trading circumstances of the business.
The award in shares focuses on alignment with shareholders.
Malus provisions (during the three-year performance period) and clawback
provisions (new for awards from FY16 and applicable for two years post
vesting) are also in place to mitigate risk.
Shareholding requirements ensure that executive
directors’ interests are aligned with shareholders over
a longer time horizon.
Link to relevant strategic priority:
1 3 42
Encouraging a material, personal stake in the business through substantial
shareholding requirements helps to align executives with shareholders and
focus on delivering long-term shareholder value which includes risk mitigation.
Hays plc | 2016 Annual Report and Financial Statements69
OVERVIEW  STRATEGICREPORT  GOVERNANCE  FINANCIALSTATEMENTS  SHAREHOLDERINFORMATION
Section 1 – Total reward for FY16
In this section:
1.1	 FY16 Single Figure for executive directors
1.1.1	Salary
1.1.2	Benefits
1.1.3	Pension
1.1.4	Other benefits
1.1.5	 Annual bonus
1.1.6	PSP
1.2	 FY16 fees for non-executive directors (NEDs)
1.1 FY16 Single Figure for executive directors
Single Figure of remuneration (audited)
The following table shows the single total figure of remuneration for each executive director in respect of qualifying services for the 2016
financial year. Comparative figures for the 2015 financial year have also been provided. Details of NEDs’ fees are set out in 1.2 on page 75.
£000s
Executive director
Salary
Note 1
Benefits
Note 2
Pension
Note 3
Other
Note 4
Annual
Bonus
Note 5
Total
remuneration
excluding PSP
PSP(1)
Note 6
Total
remuneration(1)
2016
Alistair Cox
Chief Executive
709 44 213 0 583 1,549 1,194 2,743
Paul Venables
Group Finance Director
511 34 153 2 420 1,120 861 1,981
2015
Alistair Cox 695 43 208 0 852 1,798 2,168 3,966
Paul Venables 501 33 150 0 608 1,292 1,563 2,855
(1)	2015 PSP figures now reflect the actual vesting price and the value of the dividend equivalent shares relating to the dividend which was subject to approval at the
2015 AGM, and for which the awards qualified.
Components of the Single Figure and how the calculations are worked
The following tables explain how the Single Figure has been derived.
1.1.1 Salary – note 1 (audited)
Policy summary
–– Set in relation to skills, expertise and experience.
–– Reviewed annually from 1 July.
–– Broadly aligned with salary increases for relevant
UK employees.
What has happened
Salaries were increased by 2.0% with effect from 1 July 2015.
This increase was the same as the wider budget set for relevant
UK employees.
Name
Salary for
FY16
%
increase over
FY15
Salary for
FY15
Alistair Cox £709,294 2.0% £695,386
Paul Venables £511,400 2.0% £501,373
1.1.2 Benefits – note 2 (audited)
Policy summary
–– Core benefits align with those for other UK employees.
What has happened
There have been no changes to the benefits during FY16.
£000s
Executive director PMI
Life
assurance
Income
protection
Travel and
mileage
Car
allowance Total
2016
Alistair Cox 3 8 9 4 20 44
Paul Venables 3 4 9 – 18 34
2015
Alistair Cox 2 8 9 4 20 43
Paul Venables 2 4 9 – 18 33
PMI, life assurance and income protection figures represent the annual premiums.
Hays plc | 2016 Annual Report and Financial Statements70
REMUNERATION REPORT
ANNUAL REPORT ON REMUNERATION
1.1.3 Pension – note 3 (audited)
Policy summary
–– Other than a cash payment in lieu of pension at the rate of
30% of base salary, there are no other pension arrangements
for the directors.
–– For the sake of clarity, neither executive director has any
defined benefit pension provision.
What has happened
There has been no change to the structure of pension provision
during FY16.
£000s
Executive director Pension
2016
Alistair Cox 213
Paul Venables 153
2015
Alistair Cox 208
Paul Venables 150
1.1.4 Other benefits – note 4 (audited)
Policy Summary
–– The executive directors are able to participate in the
Hays UK Sharesave Scheme in the same way as other
eligible employees.
What has happened
Paul Venables had a ‘theoretical’ gain on date of exercise which
is shown below. However, he did not sell the shares.
No options were due for exercise by Alistair Cox.
Paul Venables participated in the March 2016 Hays Sharesave
Scheme and has options which are due for exercise from 1 May
2019 to 31 October 2019. Details are shown on page 76.
Neither Alistair Cox nor Paul Venables participated in the 2015
SAYE as they were already saving at the maximum limit permitted
under the Scheme at that time.
£000s
Executive director Other
2016
Alistair Cox 0
Paul Venables 2
2015
Alistair Cox 0
Paul Venables 0
Hays plc | 2016 Annual Report and Financial Statements71
OVERVIEW  STRATEGICREPORT  GOVERNANCE  FINANCIALSTATEMENTS  SHAREHOLDERINFORMATION
1.1.5 Annual bonus – note 5 (audited)
Policy summary
–– Maximum bonus potential is 125% of base salary, of which
60% is paid in cash and 40% is deferred into shares.
–– Bonus is based on financial KPIs and personal objectives.
What has happened
The figure shown is the total bonus awarded in relation to
performance in the year, including the portion that is deferred.
For bonus awarded in relation to 2016 and 2015 performance, 40%
of the figure shown is deferred into shares for three years. There are
no further performance conditions but leaver terms apply.
The cash element of the bonus award in relation to performance
in 2016 is subject to Clawback for three years from award. The deferred
element is subject to Malus for the three-year holding period.
For detailed information on performance against targets see
page 73
Summary
£000s
Executive director
Annual
Bonus
Of which
cash – 60%
Of which
deferred–40%
% of salary
achievement
2016
Alistair Cox 583 350 233 82.20%
Paul Venables 420 252 168 82.20%
2015
Alistair Cox 852 511 341 122.50%
Paul Venables 608 365 243 121.25%
Details of the FY16 annual bonus
The performance metrics and objectives Assessment Achievement and what happens now
60% on earnings per share (EPS):
focuses on shareholder returns;
20% on cash conversion:
ensures ongoing business efficiency; and
20% on personal objectives: safeguard and
plan for the Company’s future.
Personal objectives for FY16 included:
Alistair Cox:
–– Successful expansion of our US business
following the acquisition of Veredus.
–– Driving the business through use of
digital marketing.
–– Further embedding strong risk
management processes and mitigation
into the business.
Paul Venables:
–– Further embedding the enterprise risk
management process.
–– Implementation of the German back
office transformation project.
–– Managing all aspects of the external
Auditor retender process.
Due to the strategic nature of the personal
objectives for the Chief Executive and
Group Finance Director, the Company feels
that other objectives, which are ongoing in
nature and about developing our business,
are commercially sensitive and so will not
be disclosed.
The Committee reviews both the
Company’s results and executive directors’
performance against their personal
objectives.
The basic EPS targets and actual
performance were measured at budget
exchange rates.
Cash conversion is the operating cash flow
of the Company after deducting net capital
expenditure items for the financial year,
stated as a percentage of operating profit
before exceptional items.
In addition to assessment of the individual
executives’ overall performance against key
objectives, the Committee also takes into
account its view of the directors’ regulatory
compliance and approach to risk (including
environmental, social or governance
(ESG) risks).
The Committee has not exercised any
discretion in relation to bonus outcomes.
Alistair Cox
Achieved 82.20% of salary (out of 125%
maximum potential i.e. 65.76% of maximum).
This equates to a bonus of £583,022
(as stated in the Single Figure) of which:
–– 60% or £349,813 will be paid as cash; and
–– 40% or £233,209 will be deferred into
shares for three years. There are no
further performance conditions.
Paul Venables
Achieved 82.20% of salary (out of 125%
maximum potential, i.e. 65.76% of maximum).
This equates to a bonus of £420,358
(as stated in the Single Figure) of which:
–– 60% or £252,215 will be paid as cash; and
–– 40% or £168,143 will be deferred into
shares for three years. There are no
further performance conditions.
Clawback and malus
The cash element of the bonus is subject to
clawback for three years from the date of
award. The deferred element is subject to
malus for the three-year deferral period.
Hays plc | 2016 Annual Report and Financial Statements72
REMUNERATION REPORT
ANNUAL REPORT ON REMUNERATION
CONTINUED
Calculation of actual results (audited)
Annual Bonus 2016 outcome Alistair Cox Paul Venables
Performance
condition Weighting
Threshold
performance
required
Maximum
performance
required
Actual
performance
Annual bonus
value for meeting
threshold and
maximum
performance
(% salary)
Achievement
% salary
Bonus
value
£000s
Achievement
% salary
Bonus
value
£000s
EPS 60% 7.63p 8.60p 8.19p 15 – 75 49.88% 354 49.88% 255
Cash conversion 20% 71% 101% 80.11% 5 – 25 11.07% 78 11.07% 56
Personal 20% – 100% 85% 0 – 25 21.25% 151 21.25% 109
Total 2016 100% These totals are in the 2016
Single Figure
82.20% 583 82.20% 420
*	Both the target and actual performance for bonus purposes were based on budget
exchange rates. Therefore actual performance is lower than the reported
performance due to movements in exchange rates during the year.
Note both Alistair Cox and Paul Venables achieved 85% of their personal objectives.
Of which cash 350 Of which cash 252
Of which
deferred – 40% 233
Of which
deferred – 40% 168
Total bonus
achieved in 2015 122.5% 852 121.25% 608
Of which cash 511 Of which cash 365
Of which
deferred – 40% 341
Of which
deferred – 40% 243
The personal objectives outlined on page 72 were primarily achieved.
1.1.6 PSP – note 6
Policy Summary
–– Normal maximum potential for executive directors is 175%
of base salary.
–– Normally granted annually.
–– KPIs are focused on long-term sustainability and shareholder
returns.
–– Performance period is three years.
–– Threshold performance equates to 25% of the award,
i.e. 43.75% of salary.
–– Award is subject to Malus provisions prior to vesting.
–– Awards made from FY16, are subject to clawback
provisions for up to two years post vesting.
What has happened
85.59% of the 2013 award vested in 2016, i.e. 149.78% of base salary
(maximum 175%). No malus was exercised.
PSP 2013 (granted in FY14) vesting in 2016
The value of the 2013 PSP (vesting in September 2016) is based on a share price of 126.1 pence, which was calculated using an average for the
final quarter of the financial year in accordance with the Regulations as the vesting will occur after the date of this Report. The share price on
award was 113.9 pence. The award vested at 85.59% of the maximum, i.e. 149.78% of salary.
See page 74 for detailed information on performance against targets.
£000s
Executive director
Value in 2016 Single Figure
based on share price of
126.1p Restatement
2016 Value will be restated in
FY17 report when vesting
share price is known.
Alistair Cox 1,194
Paul Venables 861
Hays plc | 2016 Annual Report and Financial Statements73
OVERVIEW  STRATEGICREPORT  GOVERNANCE  FINANCIALSTATEMENTS  SHAREHOLDERINFORMATION
Details of PSP 2013 (granted in FY14) vesting in 2016
Summary
The performance metrics
(Legacy Plan prior to 2014 Policy) Assessment Achievement and what happens now
Three-year plan
Performance period: 1 July 2013 to
30 June 2016.
Granted: 12 September 2013 and will
vest 12 September 2016.
Metrics
50% on cumulative earnings per share
(EPS): focuses on longer-term shareholder
returns.
50% on relative total shareholder return
(TSR):
Ranks the performance of Hays against a
sector group of comparator companies:
–– Adecco SA
–– CDI Corporation
–– Kelly Services, Inc.
–– ManpowerGroup Inc.
–– Michael Page International plc
(now Page Group plc)
–– Randstad Holdings nv
–– Robert Half International Inc
–– Robert Walters plc
–– SThree plc
–– USG People N.V.(1)
(1)	During FY16, USG People N.V. was purchased by
Recruit Holdings Co. Ltd and its shares delisted.
The TSR calculation was conducted in line with the
Plan rules under these circumstances.
Cumulative Earnings Per Share is the
consolidated basic earnings per share of
the Company calculated in accordance with
IAS 33 for each financial year cumulative
over the performance period. Goodwill
impairments arising from acquisitions prior
to 30 June 2006 are excluded from the
earnings per share calculation.
The Committee may make adjustments to
the calculations of cumulative earnings per
share, including taking into account unusual
or non-recurring items that do not reflect
underlying performance.
TSR for each company is the difference
between the average market values (in
sterling terms) of a notional shareholding
(including dividends) in that company on all
dealing days for the three-month period prior
to the start and the end of the performance
period, divided by the average market values
(in sterling terms) of a notional shareholding
in that company on all dealing days for
three-month period prior to the start of the
performance period. The TSR for Hays shares
is ranked against the respective TSR
performances of the comparator group.
Vesting will be subject to satisfactory
financial performance over the performance
period as determined by the Committee.
The Committee has not exercised any
discretion in relation to PSP outcomes.
Alistair Cox
Awarded 1,042,356 shares in 2013.
85.59% of the award has vested.
947,182 shares will be released in
September 2016 which includes accrued
dividend equivalent shares.
This equates to a value of £1.194 million
using a preliminary share price of £1.261 –
see opposite.
This value will be restated in 2017’s Report
once the final share price and number of
dividends are known.
Paul Venables
Awarded 751,538 shares in 2013.
85.59% of the award has vested.
682,918 shares will be released in
September 2016 which includes accrued
dividend equivalent shares.
This equates to a value of £861,000 using
a preliminary share price of £1.261 –
see opposite.
This value will be restated in 2017’s Report
once the final share price and number of
dividends are known.
Actual results (audited)
PSP 2013 (granted in FY14) vesting 2016
Performance period 1 July 2013 to 30 June 2016
Grant date 12 September 2013
Release date 12 September 2016
PSP value as % of salary for:
Performance
condition Weighting
Threshold
performance
required
Maximum
performance
required
Below
threshold Threshold Maximum
Actual
performance
PSP value
achieved as %
of salary
Relative TSR 50% Median of the
comparator group
Upper quartile of the
comparator group
0 21.875 87.5 46% 62.28%
EPS(1)
50% 17.16p 20.09p 0 21.875 87.5 22.05p 87.50%
Total 100% 0 43.75 175 – 149.78%
25% of award 100% of award
(1)	For the FY14 PSP award the three-year cumulative target was calculated such that Year 1 target growth was based on the Reuters consensus forecast for FY14 of
5.66 pence, established on the working day preceding the date of grant of the awards. FY14 threshold and maximum range around this target was -/+ 4% respectively.
Years 2 and 3 required further growth on FY14 of RPI + 4% to 12% per annum for threshold and maximum growth respectively. The initial targets assumed RPI was 3.0%
per annum. The final threshold and maximum figures shown above reflect actual RPI.
Hays plc | 2016 Annual Report and Financial Statements74
REMUNERATION REPORT
ANNUAL REPORT ON REMUNERATION
CONTINUED
Name
% of
2013
salary
awarded
Face
value at
award
£000s
Share
price at
award
£
Maximum
number of
shares
excluding
dividends
Maximum
number
of shares
including
dividends
Number of
shares that
vested
including
dividend
equivalent
shares Release date
Value (figure
shown in Single
Figure of
remuneration)
£000s(1)
2012 award
value that
vested in 2015
as stated in
2015 Single
Figure
£000s
2012 award
value restated
using share
price at
release date
£000s(2)
Alistair Cox 175% 1,187 1.139 1,042,356 1,106,652 947,182 12 September 2016 1,194 2,464 2,168
Paul Venables 175% 856 1.139 751,538 797,896 682,918 12 September 2016 861 1,777 1,563
(1)	The value of the 2013 PSP is based on a share price of 126.1 pence which was calculated using an average for the final quarter of the 2016 financial year in accordance
with the Regulations as the vesting will occur after the date of this Report.
(2)	The value of the 2012 PSP disclosed in the 2015 Single Figure was based on a share price of 161.26 pence which was calculated using an average for the final quarter
of the 2015 financial year in accordance with the Regulations as the vesting occurred after the date of the report. The share price on award was 81.55 pence. The actual
share price on the date of vesting on 9 November 2015 was 141.849 pence. This price has been used to restate the value of the 2012 PSP awards in the Single Figure for
2015 in the table above. Additional Dividend Equivalent shares ‘vested’ on 11 November 2015 at a price of 141.55 pence.
Performance conditions
The Remuneration Committee believes that performance conditions for all incentives are:
–– Suitably demanding;
–– Have regard to business strategy;
–– Incorporate an understanding of business risk;
–– Consider shareholder expectations; and
–– Take into account, to the extent possible, the cyclicality of the recruitment markets in which the Group operates.
To the extent that any performance condition is not met, the relevant part of the award will lapse. There is no retesting of performance.
PSP 2012 (granted in FY13) vesting in 2015
The value of the 2012 PSP (which vested in 2015 and was disclosed in the 2015 Single Figure) was based on a share price of 161.26 pence which
was calculated using an average for the final quarter of the 2015 financial year in accordance with the Regulations as the vesting occurred
after the date of the Report. The share price on award was 81.55 pence. The actual share price on the date of vesting on 9 November 2015
was 141.849 pence. This price has been used to restate the value of the 2012 PSP awards in the Single Figure for 2015 in the table on page 70.
Additional Dividend Equivalent shares ‘vested’ on 11 November 2015 at a price of 141.55 pence.
£000s
Executive director
Value in 2015 Single Figure
based on share price of
161.26p
Value restated based on
actual share price at vesting of
141.849p
2015
Alistair Cox 2,464 2,168
Paul Venables 1,777 1,563
1.2 Non-executive directors FY16 fees
The table below shows the current fee structure and actual fees paid in 2016. There were no taxable benefits paid in 2016 or 2015.
Non-executive directors (audited)
£000s
Alan
Thomson
Paul
Harrison
MT
Rainey(2)
Victoria
Jarman
Torsten
Kreindl
Richard
Smelt(3)
Pippa
Wicks
Peter
Williams
Chairman SID
R R R R R R R
N N N N N N N N
A A A A A A A
Base 245 54 27 54 54 18 54 54
Committee fee – – – – – – – –
Committee Chairman(1)
– 12 – 12 – – – –
SID – 10 – – – – – –
Total fee 2016 245 76 27 66 54 18 54 54
Total fee 2015 240 70 0 65 53 53 53 18
Key
R 	 Remuneration Committee member
A 	 Audit Committee member		
N 	 Nomination Committee member
SID	Senior Independent Director
R N A	 Chairman of relevant Committee
(1)	 There is no additional Committee Chair fee for the Nomination Committee.
(2)	MT Rainey joined the Board on 14 December 2015 and her fee represents the period from that date to 30 June 2016.
(3)	Richard Smelt stood down from the Board on 11 November 2015 and his fee represents the period from 1 July 2015 to that date.
Hays plc | 2016 Annual Report and Financial Statements75
OVERVIEW  STRATEGICREPORT  GOVERNANCE  FINANCIALSTATEMENTS  SHAREHOLDERINFORMATION
Section 2 – Long-term value creation
In this section:
2.1	 Outstanding deferred annual bonus
2.2	 Share options
2.3	 Outstanding PSP awards
2.4	 Statement of directors’ shareholdings
2.5	 TSR chart and table
2.6	Payments to past directors/payment for loss of office
during FY16
2.1 Outstanding deferred annual bonus (DAB) awards (audited)
The table below shows the shares held under the DAB and those that were awarded or vested during the financial year 2016. The shares that
vested related to deferred annual bonus from previous years. The shares awarded in the financial year 2016 relate to deferred annual bonus
in relation to performance in the financial year 2015. Dividend equivalent shares which accrue under the DAB have been ignored in the table
below. There are no further performance conditions.
Name
Awards outstanding
at 1 July 2015
Awards granted in
FY16
Grant price
(market price at
date of award)
£
Face value of award
granted in FY16
(at grant price)
£
Awards vesting in
FY16
Awards outstanding
as at 30 June 2016
Alistair Cox 709,737 210,983 1.615 340,738 164,334 756,386
Paul Venables 511,720 150,567 1.615 243,166 118,485 543,802
2.2 Share options
Both executive directors participate in the UK Sharesave Scheme (approved by HMRC) on the same terms as other eligible employees.
The following table shows outstanding options over Ordinary shares held by the executive directors during the year ended 30 June 2016.
Name
Scheme
date of grant
Balance
1 July 2015 Exercised
Balance
30 June 2016
Option
Price
£ Exercise date
Market price
on date of
exercise
£
Gain(1)
£000
Date from
which
exercisable Expiry date
Alistair Cox 31 March 2014 6,870 – 6,870 1.31 – – – 1 May 2017 31 October 2017
Paul Venables(2)
31 March 2016 0 – 3,364 1.07 – – – 1 May 2019 31 October 2019
Paul Venables 31 March 2014 4,122 – 4,122 1.31 – – – 1 May 2017 31 October 2017
Paul Venables 28 March 2013 4,090 4,090 0 0.88 12 May 2016 1.259 2 1 May 2016 31 October 2016
(1) 	The gain shown is ‘theoretical’ as at the date of exercise. Paul Venables did not sell the shares.
(2)	The face value of the option at grant is £3,599.
2.3 Outstanding PSP awards
The tables below show the outstanding PSP awards where vesting will be determined according to the achievement of performance
conditions that will be tested in future reporting periods. The awards were made in line with the PSP in the Remuneration Policy approved
by shareholders at the 2014 AGM.
PSP 2014 (granted in FY15) vesting 2017 (audited)
The share price used to calculate the award is 124.6 pence, being the closing price on the day preceding the grant date.
Performance period 1 July 2014 to 30 June 2017
Grant date 14 November 2014
Release date 14 November 2017
Threshold
performance
required
Maximum
performance
required
PSP value as % of salary for:
Performance condition Weighting
Below
threshold Threshold Maximum
Relative TSR 1/3 Median of the
comparator group
Upper quartile of the
comparator group
0 14.583 58.33
EPS(1)
1/3 21.67p 25.35p 0 14.583 58.33
Cash conversion 1/3 71% 101% 0 14.583 58.33
Total 100% 0 43.75 175
25% of award 100% of award
See notes below.
Name
% of FY15
salary awarded
Face value
at award
£000s
Share price
at award
£
Maximum
number of shares
Threshold
number of shares
Alistair Cox 175 1,217 1.246 976,666 244,166
Paul Venables 175 877 1.246 704,175 176,043
Hays plc | 2016 Annual Report and Financial Statements76
REMUNERATION REPORT
ANNUAL REPORT ON REMUNERATION
CONTINUED
2015 PSP (granted in FY16) vesting 2018
The share price used to calculate the award is 1.622 pence, being the closing price on the day preceding the grant date.
Performance period 1 July 2015 to 30 June 2018
Grant date 10 September 2015
Release date 10 September 2018
Threshold
performance
required
Maximum
performance
required
PSP value as % of salary for:
Performance condition Weighting
Below
threshold Threshold Maximum
Relative TSR(1)
1/3 Median of the
comparator group
Upper quartile of the
comparator group
0 14.583 58.33
EPS(2)
1/3 25.06p 29.32p 0 14.583 58.33
Cash conversion 1/3 71% 101% 0 14.583 58.33
Total 100% 0 43.75 175
25% of award 100% of award
Name
% of FY16
salary awarded
Face value
at award
£000s
Share price
at award
£
Maximum
number of shares
Threshold
number of shares
Alistair Cox 175 1,241 1.622 765,268 191,317
Paul Venables 175 895 1.622 551,757 137,939
Notes to both 2014 and 2015 awards
(1)	TSR is measured against a bespoke comparator group, with vesting subject to satisfactory financial performance as determined by the Committee.
The comparator group for both awards is: Adecco SA, CDI Corporation, Kelly Services Inc., Manpower Inc., Michael Page International Plc (now Page Group), Randstad
Holdings nv, Robert Half International Inc., Robert Walters Plc, SThree Plc, USG People NV (delisted during 2016 following purchase by Recruit Holdings Co. Ltd.
The TSR calculation will take this into account in line with the plan rules).
(2)	The Committee took into account the following factors when setting the EPS targets for an award:
	 –	 Budget (the setting of which is a robust and transparent process).
		 –	 Company budget for FY15 and FY16 respectively and the expectations for performance;
		 –	 Strategic direction of the business over the period covered by the PSP award;
		 –	 Market conditions and visibility of future trading.
	 –	 Real growth around an assumed RPI of 3% p.a. The final threshold and maximum figures will be adjusted to reflect the actual RPI once known.
	 –	 Analyst forecasts.
Hays plc | 2016 Annual Report and Financial Statements77
OVERVIEW  STRATEGICREPORT  GOVERNANCE  FINANCIALSTATEMENTS  SHAREHOLDERINFORMATION
2.4 Statement of directors’ shareholdings and share interests (audited)
Policy summary
–– Shareholding requirements in operation at Hays are currently
200% of base salary for the Chief Executive and 100% of base
salary for the Group Finance Director. Both are required to
build up their shareholdings over a reasonable amount of
time which would normally be five years.
What has happened
The number of shares of the Company in which current executive
directors had a beneficial interest and details of long-term
incentive interests as at 30 June 2016 are set out in the table below.
Name
Shareholding
requirement
% of salary
Number of shares
owned outright/
vested shares
Share price as at
30 June 2016
Base salary as at
1 July 2015
Actual share
ownership as % of
base salary Guidelines met
Alistair Cox 200% 3,496,719 97.65p £709,294 481 Yes
Paul Venables 100% 1,615,262 97.65p £511,400 308 Yes
Shares used for the above calculation exclude those with performance conditions, i.e. those awarded under the PSP which are still within their
performance period, any unexercised options, those shares subject to a period of deferral and any shares held in a private Trust where the
executive director is not a Trustee. They include vested shares where the executive directors have beneficial ownership, shares independently
acquired in the market and those held by a spouse or civil partner or dependent child under the age of 18 years. The executive directors’ total
shareholdings, including shares subject to deferral but excluding Sharesave Options, are shown below.
Name
Number of
owned
outright/
vested shares
Value of
owned
outright/
vested
shares(2)
£
Number of
shares subject
to deferral/
holding
period(1)
Value of
shares subject
to deferral/
holding period(2)
£
Number of
total vested and
unvested shares
(excludes any shares
with performance
conditions)
Value of total vested
and unvested shares
(excludes any shares
with performance
conditions)(2)
£
Share
ownership as %
of base salary
using vested
and unvested
shares
PSP share
interests
excluding
dividends
subject to
performance
conditions
Alistair Cox 3,496,719 3,414,546 756,386 738,611 4,253,105 4,153,157 585% 2,784,290
Paul Venables 1,615,262 1,577,303 543,802 531,023 2,159,064 2,108,326 412% 2,007,470
(1)	 Unvested shares will be subject to payroll deductions for tax and social security on vesting. Number excludes dividend equivalent shares.
(2)	Share price as at 30 June 2016 and used in the above table was 97.65 pence.
The table below shows the NEDs’ shareholdings as at 30 June 2016 – this table has been audited.
Non-executive director
Shares held at
30 June 2016
Shares held at
30 June 2015
or date of
joining if later
Alan Thomson 250,000 200,000
Paul Harrison 8,678 8,678
Victoria Jarman 14,000 14,000
Torsten Kreindl – –
Pippa Wicks – –
Peter Williams 6,946 6,946
MT Rainey(1)
– –
(1)	 MT Rainey joined the Board on 14 December 2015.
Hays plc | 2016 Annual Report and Financial Statements78
REMUNERATION REPORT
ANNUAL REPORT ON REMUNERATION
CONTINUED
30 June
2009
30 June
2010
30 June
2011
30 June
2012
30 June
2013
30 June
2014
30 June
2015
30 June
2016(1)
Since 30 June 2009,
Total Shareholder Return has
increased by 47.2%, or 5.7% p.a.
(i.e. on an annualised basis).
Since 30 June 2013, Total
Shareholder Return has increased
by 16.7% or 5.3% p.a. driven in part
by our Strategic plan to double
the Group’s profits.
0
50
100
150
200
250
300
2.5 Total Shareholder Return (TSR)
The graph shows the value of £100 invested
in the Company’s shares compared to the
FTSE 350 index. The graph shows the total
shareholder return generated by both the
movement in share value and the reinvestment
over the same period of dividend income.
The Committee considers that the FTSE 350
is the appropriate index because the Company
has been a member of this index throughout
the period. This graph has been calculated
in accordance with the Regulations.
(1)	Following the UK Referendum to leave the EU,
Hays’ share price fell from 136.9 pence on 23 June
2016 to 97.65 pence on 30 June 2016.
	Hays plc
	FTSE 350
Chief Executive historic remuneration
The table below sets out the total
remuneration delivered to the Chief
Executive over the last seven years, valued
using the methodology applied to the total
single figure of remuneration. The 2015 figure
has been restated to take into consideration
the actual share price on date of PSP vesting,
as previously explained on page 75.
Chief Executive 2010 2011 2012 2013 2014 2015 2016
Total Single Figure (£000s) 1,634 2,157 1,328 2,012 2,826 3,966 2,743
Annual bonus payment level achieved (% of
maximum opportunity)
89% 80% 37% 95% 98% 98% 65.76%
PSP vesting level achieved (% of maximum
opportunity)
0% 50% 0% 22% 50% 100% 85.59%
DAB match vesting level achieved (% of
maximum opportunity)
N/A 59% 60% N/A N/A N/A N/A
2.6 Payments to past directors/payment for loss of office during FY16
There were no payments made in relation to either of the above in the financial year 2016.
Hays plc | 2016 Annual Report and Financial Statements79
OVERVIEW  STRATEGICREPORT  GOVERNANCE  FINANCIALSTATEMENTS  SHAREHOLDERINFORMATION
Section 3 – Remuneration in the broader context
In this section:
3.1	 Remuneration for employees below Board
3.2	Change in Chief Executive’s remuneration compared
to other employees
3.3	 External appointments
3.4	 Relative importance of spend on pay
3.1 Remuneration for employees below Board
Our remuneration philosophy is cascaded throughout the organisation. Our Management Board have an annual bonus scheme that is
measured against Group and Regional (where relevant) financial targets and personal and strategic objectives. 40% of any award is deferred
into shares for three years and subject to Malus provisions. Members of the Management Board also participate in the PSP with the same
performance conditions as the executive directors. Members of the Management Board are encouraged to build up a Hays’ shareholding
equivalent to 100% of their base salary.
Employees below the Management Board receive salary and benefits which are benchmarked to the local markets and countries in which they
work. These are reviewed annually. There is a strong tie of performance to reward which is recognised through annual bonuses, commission or
other non-financial recognition. Employees who hold key strategic positions or are deemed critical to the business through their performance
are also offered the opportunity to participate in the PSP with performance conditions based on Group EPS results measured over one year.
Any shares that crystallise at the end of the performance period have a further two-year holding period prior to vesting. During this time
there is also a personal performance underpin. In addition nine countries offer a Sharesave plan to employees. A Resolution will be put to
Shareholders at the 2016 AGM to introduce a US Stock Purchase Plan for employees in the USA.
As stated in our Remuneration Policy, each year, prior to reviewing the remuneration of the executive directors and the members of the Management
Board, the Committee considers a report prepared by the Group Head of Reward detailing remuneration practice across the Group. The report
provides a regional overview of how employee pay compares to the market, any material changes during the year and includes detailed analysis
of basic pay and variable pay changes within the UK where all of the executive directors and most of the Management Board are based.
While the Company does not directly consult with employees as part of the process of reviewing executive pay and formulating the remuneration
policy, the Company takes account of feedback from the broader employee population on an annual basis using the engagement survey
which includes a number of questions relating to remuneration.
The table below summarises the above.
Hays plc | 2016 Annual Report and Financial Statements80
REMUNERATION REPORT
ANNUAL REPORT ON REMUNERATION
CONTINUED
Principles Components
Operate a consistent reward
and performance philosophy
throughout the business.
Provide a balanced package
with a strong link between
reward and individual and
Group performance.
Encourage a material, personal
stake in the business to give a
long-term focus on sustained
growth.
Base salary
Based on skill and experience
and benchmarked to local
market
Annual bonus
Employees who hold positions
that influence the business
strategy and direction, or hold
key roles that have a direct effect
on business results, have annual
bonuses based on a combination
of Group, Regional and/or local
business targets and personal
or strategic objectives.
For members of the Management
Board, 40% of any bonus earned
is deferred into shares for three
years and is subject to Malus.
Performance Share Plan (‘PSP’)
and Sharesave
Members of the Management
Board participate in the same
PSP Plan as executive directors
subject to Remuneration
Committee approval. The PSP
is subject to Malus provisions.
Management Board members
are encouraged to retain shares
and build up a holding of 100%
of Base Salary.
Below the Management Board,
broadly 300 key employees each
year participate in a PSP which
has a one-year performance
period and two-year holding
period. Financial targets are
based on Group EPS results.
Nominations are reviewed and
approved by the Remuneration
Committee.
Employees in nine countries can
participate in a Sharesave scheme
with the ability to purchase
options after three years.
Benefits
Benchmarked to local market
and can include pension, life
assurance, health cover and
discounted voluntary benefits.
In the UK the executive directors
participate in the same plans as
other UK employees.
Commission
Client facing employees have
annual bonuses based on
personal objectives and/or
commission directly related to
personal business performance.
TALKback Survey
An annual global employee
engagement survey is conducted
across all Hays’ employees in all
countries to ascertain overall
engagement. This includes a
number of questions relating
to remuneration.
Timeline
Fixed
Variable	
Long-term/Ongoing
3.2 Change in Chief Executive’s remuneration compared to other employees
The following table sets out the change in the remuneration paid to the Chief Executive from 2015 to 2016 compared with the average
percentage change for relevant UK employees.
The Chief Executive’s remuneration disclosed in the table below has been calculated to take into account base salary, taxable benefits,
excluding his allowance in lieu of pension, and annual bonus (including any amount deferred). The UK employee pay (on which the average
percentage change is based) is calculated using the increase in the earnings of UK-based, full-time employees who are eligible for increases
in salary/benefits and who participate in the standard discretionary (i.e. not commission based) annual bonus plans (employees who receive
bonuses on a monthly or other time-scale basis are excluded). It uses P11d data from tax years 2015 and 2016. Part-time employees have been
excluded from the analysis as many will have experienced material changes in pay during the period due to their change of hours.
Hays plc | 2016 Annual Report and Financial Statements81
OVERVIEW  STRATEGICREPORT  GOVERNANCE  FINANCIALSTATEMENTS  SHAREHOLDERINFORMATION
The comparison figures are based on relevant UK employees (as described above) as both executive directors and most of the Management
Board are UK based and this is considered to be an appropriate comparison.
% change
salary
FY16 vs FY15
% change
taxable benefits
FY16 vs FY15
% change
variable pay
FY16 vs FY15
Chief Executive 2% 2% -32%
Other relevant employees 5% 13% -14%
3.3 External appointments
The Company considers that certain external appointments can help to broaden the experience and contribution to the Board of the executive
directors. Any such appointments are subject to prior agreement by the Company and must not be with competing companies. Subject to the
Company’s agreement, any fees may be retained by the individual.
For the 12 months ended 31 March 2016, the annual rate of fees earned and retained by the executive directors was as follows:
–– Alistair Cox: £80,000 p.a. (3i Group plc) – he stepped down on 10 November 2015.
–– Paul Venables: £53,000 p.a. (Wincanton plc) – he stepped down on 16 July 2015.
3.4 Relative importance of spend on pay
The table below sets out the relative importance of the spend on pay in the 2016 financial year and the 2015 financial year compared with
other disbursements. All figures are taken from the relevant Hays Annual Report.
Disbursements
from profit in 2016
financial year
£m
Disbursements
from profit in 2015
financial year
£m % change
Profit distributed by way of dividend 41.7 39.3 6.1 %
Overall spend on pay including directors 476.3 440.6 8.1 %
Section 4 – Statement of implementation of Remuneration Policy in the following financial year
In this section:
4.1	 Executive directors 4.2	 Non-executive directors
Below are the Remuneration Policy decisions implemented for the financial year 2017.
There have been no changes to our Remuneration Policy during FY16.
4.1 Executive directors
Summary
Position Name
Base salary
from 1 July 2016
Maximum bonus potential
as % of salary
Maximum PSP award
as % of salary
Benefits and
pension
CEO Alistair Cox £723,480 125% 175% No change
CFO Paul Venables £521,628 125% 175% No change
The salaries for the CEO and
CFO were increased by 2.0%,
in line with the pay review
budget for other relevant
employees in the UK
See below for
performance conditions
See grant summary below
Bonus performance conditions	
The weighting of the performance conditions remain as follows for FY17:
Performance condition Weighting
EPS 60% The operation of the Bonus Plan is otherwise as set out on page 72. It should be noted that the
Committee views the disclosure of the actual performance targets as commercially sensitive.
The Committee will provide retrospective disclosure of the performance targets for the
financial measures to allow shareholders to judge the bonus earned in the context of the
performance delivered. The Committee believes that some of the personal objectives may
continue to be commercially sensitive.
Cash conversion 20%
Personal 20%
Total 100%
Hays plc | 2016 Annual Report and Financial Statements82
REMUNERATION REPORT
ANNUAL REPORT ON REMUNERATION
CONTINUED
2016 PSP performance conditions (to be granted in FY17)
Performance period 1 July 2016 to 30 June 2019
Grant date 12 September 2016
Release date 12 September 2019
PSP value as % of salary for:
Performance condition Weighting
Threshold
performance
required
Maximum
performance
required
Below
threshold Threshold Maximum
Relative TSR(1)
1/3 Median of the
comparator group
Upper quartile of the
comparator group
0 14.583 58.33
EPS(2)
1/3 22.01p 25.75p 0 14.583 58.33
Cash conversion 1/3 71% 101% 0 14.583 58.33
Total 100% 0 43.75 175
25% of award 100% of award
(1)	TSR is measured against a bespoke comparator group, with vesting subject to satisfactory financial performance as determined by the Committee. The comparator
group is: Adecco SA, CDI Corporation, Kelly Services Inc., Manpower Inc., Michael Page International Plc (now Page Group), Randstad Holdings nv, Robert Half
International Inc., Robert Walters Plc, and SThree Plc. During FY16 USG People NV was purchased by Recruit Holdings Co. Ltd and its shares delisted. It is therefore
no longer in the comparator group.
(2)	The Committee took into account the following factors when setting the EPS targets for the award:
	 –	 Budget (the setting of which is a robust and transparent process).
		 –	 Company budget for FY17 and the expectations for performance;
		 –	 Strategic direction of the business over the period covered by the PSP award;
		 –	 Market conditions and visibility of future trading.
	 –	 An assumed RPI of 3.0%.	
	 –	 The final threshold and maximum targets will be adjusted to reflect the actual RPI once known.
	 –	 Analyst forecasts.
(3)	The award is subject to Malus for the three-year performance period and Clawback for two years post vesting.
When the Committee met in August 2016 to finalise the targets for FY17, it was in the context of a more uncertain economic outlook,
especially in the UK following the ‘Brexit’ referendum result. The Committee carefully considered the targets it should apply to incentive
awards (i.e. both annual bonus and PSP awards) for FY17.
In setting the EPS target (which represents one-third of the PSP award) for the FY17 PSP award, noting that the mechanics for this are
consistent with prior years, it is recognised that the EPS target range is lower in absolute terms than the target applied to the awards made in
FY16. However the Committee is comfortable that these targets are no less challenging in relative terms than the targets applied to the FY16
PSP awards and are consistent with external forecasts at that time.
4.2 Non-executive directors
The Committee reviewed the Group Chairman’s fee during FY16 and determined that it should increase by 2.0% for FY17. This is in line with the
pay review for other employees in the Company.
The Board reviewed the fees for the other non-executive directors (NEDs) during FY16. They determined that their base fee should increase
by 2.0% for FY17 in line with other increases across the Company. All increases are effective from 1 July 2016.
The table below shows the changes.
Position
Fee for FY17
£000s
Fee for FY16
£000s
Chairman 250 245
Base fee 55 54
Committee Chairman 12 12
SID 10 10
Hays plc | 2016 Annual Report and Financial Statements83
OVERVIEW  STRATEGICREPORT  GOVERNANCE  FINANCIALSTATEMENTS  SHAREHOLDERINFORMATION
Section 5 – Governance
In this section:
5.1	 Service contracts
5.2	 Remuneration Committee members and attendees
5.3	 Terms of reference
5.4	 Meetings in FY16
5.5	 Advisers to the Remuneration Committee
5.6	 Engagement with shareholders
5.7	 Considering risk
5.8	 General governance
5.1 Service contracts
A maximum 12-month notice period applies for executive directors.
Current contract
start date
Unexpired
term
Notice period
from Company
Notice period
from executive
Alistair Cox September 2007 Indefinite One year One year
Paul Venables May 2006 Indefinite One year Six months
The non-executive directors do not have service contracts with the Company, but are appointed to the Board under letters of appointment
for an initial three-year period. They have agreed to annual retirement and reappointment by shareholders at the Company’s Annual General
Meeting and, with the exception of the Chairman, appointments can be terminated immediately by the Company. Letters of appointment
are available for review from the Company Secretary and a pro forma letter of appointment can be viewed on the Company’s website,
haysplc.com.
Non-executive director Date appointed to the Board
Date of current
letter of appointment Notice period
Alan Thomson 1 October 2010 14 July 2010 (Renewed) Three months
Paul Harrison 8 May 2007 31 August 2011 (Renewed) None
Victoria Jarman 1 October 2011 31 August 2011 (Renewed) None
Torsten Kreindl 1 June 2013 30 May 2013 (Renewed) None
Richard Smelt 15 November 2007 31 August 2011 (Renewed) Stood down at 2015 AGM
Pippa Wicks 1 January 2012 30 November 2011 (Renewed) None
Peter Williams 24 February 2015 24 February 2015 None
MT Rainey 14 December 2015 14 December 2015 None
5.2 Remuneration Committee members and attendees
The table below shows the members and attendees of the Remuneration Committee during 2016.
Remuneration
Committee members Position Comments
Paul Harrison Chairman of the Remuneration Committee Independent
Victoria Jarman Member from 1 October 2011 Independent
Torsten Kreindl Member from 1 June 2013 Independent
Richard Smelt Member from 15 November 2007 – stood down at 2015 AGM Independent
Pippa Wicks Member from 1 January 2012 Independent
Peter Williams Member from 24 February 2015 Independent
MT Rainey Member from 14 December 2015 Independent
Remuneration
Committee attendees Position Comments
Alan Thomson Group Chairman and standing attendee by invitation Independent upon appointment on 1 October 2010.
Alistair Cox Chief Executive Attends by invitation but does not participate in any
discussion directly about his own reward.
Other executives The Group Head of Reward Attends by invitation as the executive responsible
for advising on the Remuneration Policy.
The Company Secretary Acts as Secretary to the Committee.
The former Group HR Director Attended until his departure from the Company
in November 2015.
PwC Committee’s independent adviser until 30 June 2016. Attended by invitation. Stood down as independent
adviser on 30 June 2016 following their appointment
as Group external Auditor.
No person is present during any discussion directly relating to his or her own remuneration.
Hays plc | 2016 Annual Report and Financial Statements84
REMUNERATION REPORT
ANNUAL REPORT ON REMUNERATION
CONTINUED
5.3 Terms of reference
The Board has delegated to the Committee, under agreed Terms of Reference, responsibility for the remuneration policy and for determining
specific packages for the executive directors, the Chairman and other senior executives. The Company consults with key shareholders in
respect of remuneration policy and the introduction of new incentive arrangements. The Terms of Reference for the Committee are available
on the Company’s website, haysplc.com, and from the Company Secretary at the registered office.
5.4 Meetings in 2016
The Committee normally meets at least four times per year. During 2016, it formally met four times as well as having ongoing dialogue via
email or telephone discussion. The meetings principally discussed the following key issues and activities:
–– A review of the basic pay, bonus and PSP awards of the executive directors and other senior executives;
–– Consideration of the appropriateness of the existing arrangements for the 2017 financial year;
–– A review of the reward strategy in the context of Group risk;
–– Consideration of the relationship between executive reward and the reward structures in place for other Group employees;
–– A review of the Committee’s Terms of Reference; and
–– Initial review of the future structure and appropriateness of the remuneration for executive directors in the light of being a cyclical business
and in consideration of the new binding vote in 2017.
5.5 Advisers to the Remuneration Committee
The Committee has continued to engage the services of PricewaterhouseCoopers LLP (PwC) as its independent adviser, who were appointed
in 2014 following a formal tender process. During the financial year, PwC advised the Committee on all aspects of remuneration policy for
executive directors and members of the Management Board. PwC also provided advice to the Company in relation to corporate tax, indirect
tax and legal services. This work is carried out by an entirely separate group within PwC and is not felt to be in conflict with the independence
and objectivity of the work carried out for the Committee.
The Committee is satisfied that the advice received was objective and independent. PwC is a member of the Remuneration Consultants’
Group and the voluntary code of conduct of that body is designed to ensure objective and independent advice is given to Remuneration
Committees.
The total fee for 2016 in relation to Committee work was £198,700 excluding VAT. While fee estimates are generally required for each piece
of work, fees are calculated based on time, with hourly rates in line with the level of expertise and seniority of the adviser concerned.
Following the successful tender by PwC to become the Company’s new external Auditor, from 1 July 2016 PwC no longer act as the
independent adviser to the Remuneration Committee. A new tender process will be conducted during FY17.
5.6 Engagement with shareholders
The Committee seeks to maintain an active and productive dialogue with investors on developments in the remuneration aspects of corporate
governance generally and any changes to the Company’s executive pay arrangements in particular. As the next binding vote on our executive
Remuneration Policy approaches, the Committee is very mindful of the importance of having pro-active discussions with shareholders should
there be any material changes to its remuneration structure or approach.
5.7 Considering risk
Each year, the Committee considers the executive remuneration structure in the light of its key areas of risk. The summary table on page 69
indicates how the Remuneration Policy takes into account these risks. The Committee takes into consideration whether the achievement of
objectives and any payment from plans have taken into account the overall risk profile of the Company when it evaluates the executives’
performance.
5.8 General governance
The Directors’ Report on Remuneration has been prepared in accordance with Schedule 8 to The Large and Medium-sized Companies and
Groups (Accounts and Reports) (Amendment) Regulations 2013, the revised provisions of the Code and the Listing Rules.
By order of the Board
Doug Evans
Company Secretary
1 September 2016
Hays plc | 2016 Annual Report and Financial Statements85
OVERVIEW  STRATEGICREPORT  GOVERNANCE  FINANCIALSTATEMENTS  SHAREHOLDERINFORMATION
Hays is incorporated in the UK and registered
as a public limited company in England and
Wales. Its headquarters are in London and
it is listed on the main market of the London
Stock Exchange.
Strategic Report
A description of the Company’s business
model and strategy is set out in the Strategic
Report along with the factors likely to
affect the Group’s future development,
performance and position. Information
on environmental, employee, social and
community matters, including information
on gender diversity within the Group,
and an overview of the principal risks
and uncertainties faced by the Group are
also provided in the Strategic Report.
The Statement of Compliance with the Code
for the reporting period is contained in the
Corporate Governance Statement.
Information relating to matters addressed
by the Audit, Remuneration and Nomination
Committees, which operate within clearly
defined terms of reference, are set out within
the Audit, Remuneration and Nomination
Committee Reports.
All of the matters above are incorporated
by reference into this Directors’ Report.
The purpose of this Report is to provide
information to the members of the Company,
as a body. The Company, its directors,
employees, agents or advisers do not accept
or assume responsibility to any other person
to whom this document is shown or into
whose hands it may come and any such
responsibility or liability is expressly
disclaimed. This Report contains certain
forward-looking statements with respect
to the operations, performance and financial
condition of the Group. By their nature, these
statements involve uncertainty since future
events and circumstances can cause results
and developments to differ from those
anticipated. The forward-looking statements
reflect knowledge and information available
at the date of preparation of this Report.
Nothing in this Report should be construed
as a profit forecast.
Related party transactions
Details of the related party transactions
undertaken during the reporting period are
contained in note 31 to the Consolidated
Financial Statements.
Post balance sheet events
There have been no significant events to
report since the date of the balance sheet.
Dividends
An interim dividend of 0.91 pence (2015:
0.87 pence) per Ordinary share was paid
to shareholders on 5 April 2016. The Board
recommends the payment of a final dividend
of 1.99 pence (2015: 1.89 pence) per Ordinary
share, representing a total dividend of 2.90
pence (2015: 2.76 pence) for the financial
year ended 30 June 2016. Subject to the
shareholders of the Company approving this
recommendation at the 2016 AGM, the final
dividend will be paid on 11 November 2016 to
those shareholders appearing on the register
of members as at 14 October 2016. The
ex-dividend date is 13 October 2016.
Financial instruments
Details of the financial instruments used
by the Group are set out in notes 18 to 20
to the Consolidated Financial Statements.
A general outline of Hays’ use of financial
instruments is set out in the treasury
management section on page 41 of the
Financial Review of this Report.
Directors
Biographies of the serving directors of Hays
are provided on pages 50 and 51 of this
Report. They all served on the Board
throughout the 2016 financial year, with the
exception of MT Rainey, who joined the Board
on 14 December 2015. In addition, Richard
Smelt served on the Board during the year
until his retirement on 11 November 2015.
General powers of the directors
The powers of the directors are contained in
the Company’s Articles of Association. These
powers may be exercised by any meeting
of the Board at which a quorum of three
directors is present. The power of the Board
to manage the business is subject to any
limitations imposed by the Companies Act
2006, the Articles of Association (Articles) or
any directions given by special resolution of
the shareholders applicable at a relevant time.
The Articles contain an express authority for
the appointment of executive directors and
provide the directors with the authority to
delegate or confer upon such directors any
of the powers exercisable by them upon such
terms and conditions and with such restrictions
as they see fit. The Articles contain additional
authorities to delegate powers and discretions
to committees and sub-committees.
Directors’ powers to allot and buy
back shares
The directors have the power to authorise
the issue and buy-back of the Company’s
shares by the Company, subject to authority
being given to the directors by the
shareholders in general meeting, applicable
legislation and the Articles.
Appointment and replacement of directors
Shareholders may appoint any person who
is willing to act as a director by ordinary
resolution and may remove any director by
ordinary resolution. The Board may appoint
any person to fill any vacancy or as an
additional director, provided that they are
submitted for election by the shareholders
at the AGM following their appointment.
Specific conditions apply to the vacation
of office, including cases where a director
becomes prohibited by law or regulation
from holding office, or is persistently absent
from directors’ meetings, or if three-quarters
of appointed directors request his or her
resignation or in the case of mental
incapacity or bankruptcy.
Directors’ interests
Details of the interests of Hays’ directors
and their connected persons in the Ordinary
shares of the Company are outlined in the
Remuneration Report.
Directors’ indemnities
The Company continues to maintain
third-party directors’ and officers’ liability
insurance for the benefit of its directors.
This provides insurance cover for any claim
brought against directors or officers for
wrongful acts in connection with their
positions. The directors have also been
granted qualifying third-party indemnities,
as permitted under the Companies Act
2006, which remain in force. Neither the
insurance nor the indemnities extend to
claims arising from fraud or dishonesty
and do not provide cover for civil or criminal
fines or penalties provided by law.
Share capital
Hays has one class of Ordinary shares
which carry no right to fixed income or
control over the Company. These shares
may be held in certificated or uncertificated
form. On 30 June 2016, the Company had
1,464,096,566 fully paid Ordinary shares in
issue, of which 31,163,744 Ordinary shares
were held in treasury by the Company.
Hays plc | 2016 Annual Report and Financial Statements86
DIRECTORS’ REPORT
The rights and obligations attaching to the
Company’s Ordinary shares are contained
in the Articles. In brief, the Ordinary shares
allow holders to receive dividends and to
exercise one vote on a poll per Ordinary share
for every holder present in person or by proxy
at general meetings of the Company. They
also have the right to a return of capital on
the winding up of the Company.
There are no restrictions on the size of
holding or the transfer of shares, which
are both governed by the general provisions
of the Company’s Articles and legislation.
Under the Articles, the directors have the
power to suspend voting rights and the right
to receive dividends in respect of Ordinary
shares and to refuse to register a transfer of
Ordinary shares in circumstances where the
holder of those shares fails to comply with
a notice issued under Section 793 of the
Companies Act 2006. The directors also
have the power to refuse to register any
transfer of certificated shares that does not
satisfy the conditions set out in the Articles.
The Company is not aware of any
agreements between shareholders that
might result in the restriction of transfer of
voting rights in relation to the shares held
by such shareholders.
Treasury shares
As Hays has only one class of share in issue,
it may hold a maximum of 10% of its issued
share capital in treasury. As at 30 June 2016,
2.13% of the Company’s shares were held in
treasury. Legislation restricts the exercise
of rights on Ordinary shares held in treasury.
The Company is not allowed to exercise
voting rights conferred by the shares whilst
they are held in treasury. It is prohibited
from paying any dividend or making any
distribution of assets on treasury shares.
Once in treasury, shares can only be sold
for cash, transferred to an employee share
scheme or cancelled. During the 2016
financial year, Hays transferred 11,898,607
shares out of treasury to satisfy the award
of shares under the Company’s employee
share schemes.
Shares held by the Employee Benefit Trust
The Hays plc Employee Share Trust (the
Trust) is an employee benefit trust which
is permitted to hold Ordinary shares in the
Company for employee share schemes
purposes. No shares were held by the Trust
as at the year end. Shares held in the Trust
may be transferred to participants of the
various Group share schemes. No voting
rights are exercisable in relation to shares
unallocated to individual beneficiaries.
Dilution limits in respect of share schemes
The current Association of British Insurers
(ABI) guidance (responsibility for which
now rests with the Investment Association)
on dilution limits provide that the overall
dilution under all share plans operated by
a company should not exceed 10% over a
10-year period in relation to the Company’s
share capital, with a further limitation of 5%
in any 10-year period on executive plans. The
Company’s share plans operate within ABI
recommended guidelines on dilution limits.
Major shareholders
As at 30 June 2016, the following shareholders
held an interest of 3% or more of the
Company’s issued share capital:
% of total
voting rights
Cedar Rock Capital
Limited 7.8%
BlackRock Inc 7.2%
Virtus Trust 7.2%
Baillie Gifford  Co 6.5%
Marathon Asset
Management 6.4%
Heronbridge
Investment
Management LLP 4.0%
Majedie Asset
Management 3.8%
Columbia Threadneedle
Investments 3.5%
Employees
Our goal is for our people to reach their
full potential and to give of their best as
individuals and in teams. In this context,
we are committed to never discriminating
on the grounds of race, colour, creed,
disability, religion, ethnic origin, gender,
sexual orientation or age. All Hays employees
are required to abide by these principles
which are set out in the Group’s Equal
Opportunities Policy and Code of Conduct.
Hays gives full consideration to applications
for employment from disabled persons
where they have the right skills and abilities
for the role. Should an employee become
disabled whilst working for the Group, Hays
would make every effort to accommodate
them, to assist them in any re-training or to
find suitable alternative employment within
the Group.
Employee involvement
Ongoing communication forms the basis of
the partnership between Hays’ leadership
and its employees. Employees receive
business performance updates from Alistair
Cox, the Chief Executive, and from their
respective regional Managing Directors,
by email on a four-weekly basis. These are
posted on the Group’s intranet, which acts
as a source of reference for the Group’s
brand, values, policies and procedures.
Regular presentations are also made to
employees by the Chief Executive and
regional Managing Directors during office
visits made over the course of the year.
Hays continues to provide tailored training
to the people who are in the front line of
delivering recruitment solutions as well
as in management and leadership roles.
These programmes take a number of
different guises across the Group’s regional
businesses but all share the common goal of
improving the service we provide to clients.
To ensure that employees remain engaged
in our business, an annual employee
engagement survey, known as TALKback, is
carried out each year. This allows employees
to voice their views and opinions on all
aspects of their workplace environment,
training and development, work culture,
leadership and client relations. The results,
which indicate employee engagement
levels and highlight any areas of concern,
are presented to the Management Board
and to the Board.
Hays believes in the value of loyalty and
considers its employee incentive programme
of commission schemes, performance-
related cash bonuses and share schemes
to be important factors in keeping its
employees motivated. The employee share
schemes have been running successfully
since inception and provide many employees
with an additional stake in the business.
Articles of Association
The Company’s Articles may only be
amended by special resolution of the
shareholders.
Disclosure of information to the Auditor
So far as the directors who held office at
the date of approval of this Report are aware,
there is no relevant audit information of
which the external Auditor is unaware and
each director has taken all steps that he
or she ought to have taken as a director to
make himself or herself aware of any relevant
audit information and to establish that the
external Auditor is aware of that information.
This confirmation should be interpreted
in accordance with Section 418 of the
Companies Act 2006.
Hays plc | 2016 Annual Report and Financial Statements87
OVERVIEW  STRATEGICREPORT  GOVERNANCE  FINANCIALSTATEMENTS  SHAREHOLDERINFORMATION
2016 Annual Report and Financial
Statements
On the recommendation of the Audit
Committee and having considered all
matters brought to the attention of the
Board during the financial year, the Board
is satisfied that the Annual Report and
Financial Statements, taken as a whole,
is fair, balanced and understandable. The
Board believes that the disclosures set out
in the Annual Report provide the information
necessary for shareholders to assess the
Company’s performance, business model
and strategy.
Annual General Meeting
The Company’s AGM will be held at 12 noon
on 9 November 2016 at the offices of UBS,
5 Broadgate, London EC2M 2QS.
The Notice of Meeting sets out the
resolutions to be proposed at the AGM
and gives details of the voting record date
and proxy appointment deadline for that
Meeting. The Notice of Meeting is contained
in a separate circular to shareholders which
is being mailed or otherwise provided to
shareholders at the same time as this Report.
Auditor
Resolutions 13 and 14 at the forthcoming
AGM will respectively propose the
appointment of PricewaterhouseCoopers
LLP as Auditor of the Company and
authorise the directors to determine its
remuneration. These resolutions will be
proposed as ordinary resolutions and shall
have effect until the conclusion of the next
general meeting of the Company at which
accounts are laid.
Political donations
The Company made no political donations
during the year and intends to maintain its
policy of not making such payments. It will
however as a precautionary measure to
avoid inadvertent breach of the law, seek
shareholder authority at the 2016 AGM
to make limited donations or incur limited
political expenditure, although it has no
intention of using the authority.
Resolution 15 will be proposed as an ordinary
resolution to seek authority to make political
donations, and if passed, such authority shall
expire at the conclusion of the 2017 AGM.
Authority to allot shares
At the 2015 AGM, shareholders authorised
the directors, subject to the Companies Act
2006, to allot Ordinary shares or grant rights
to subscribe for or grant rights to subscribe
for or convert any securities into shares
without the prior consent of shareholders.
This authority expires at the conclusion of
the 2016 AGM.
Accordingly, Resolution 16 will be proposed
as an ordinary resolution to renew this
authority for a period expiring at the
conclusion of the 2017 AGM. The directors
have no present intention of exercising
this authority.
Disapplication of pre-emption rights
Also at last year’s meeting, a special
resolution was passed under the Companies
Act 2006 empowering the directors to
allot equity securities for cash without
first being required to offer such shares
to existing shareholders. Resolution 17 will
seek to renew this authority. If approved,
the resolution will authorise directors in
accordance with the Articles to issue
shares in connection with a rights issue and
otherwise to issue shares for cash up to a
specified maximum nominal amount which
includes the sale on a non pre-emptive basis
of any shares held in treasury.
Resolution 17 will be proposed as a special
resolution to renew this authority for a
period expiring at the conclusion of the
2017 AGM.
Authority to purchase own shares
A special resolution was also passed at
last year’s meeting enabling the Company
to purchase its own shares in the market.
Resolution 18 will seek to renew this
authority. The directors intend only to
exercise this authority if to do so would,
in their opinion, enhance shareholder value.
The Company will have the option of holding,
as treasury shares, any of its own shares
that it purchases pursuant to the authority
conferred by this resolution. This would
give the Company the ability to sell treasury
shares, providing the Company with
flexibility in the management of its employee
shares schemes. No dividends will be paid on
shares whilst held in treasury and no voting
rights will attach to the treasury shares.
The price paid for Ordinary shares will not
be less than the nominal value of 1 pence per
share and not more than the higher of 5%
above the average of the middle market
quotations of the Company’s Ordinary shares
as derived from the London Stock Exchange.
Resolution 18 will be proposed as a special
resolution to renew this authority for a period
expiring at the conclusion of the 2017 AGM.
Notice of general meetings
The notice period required by the
Companies Act 2006 for general meetings
of the Company is 21 clear days, unless
shareholders approve a shorter notice
period, which cannot however be less than
14 clear days.
At last year’s AGM, shareholders authorised
the calling of general meetings other than
an AGM on not less than 14 clear days’
notice and Resolution 19 will be proposed
as a special resolution and seeks to renew
this authority. The authority granted by this
resolution, if passed, will be for a period
expiring at the conclusion of the 2017 AGM.
The flexibility offered by this resolution
will be used where, taking into account the
circumstances, the directors consider this
appropriate in relation to the business to
be considered at the meeting and in the
interests of the Company and shareholders
as a whole.
New share schemes
Resolutions 20 and 21 seek shareholders’
approval to two share plans. One is
replacement, on the same terms, of the
Company’s existing Deferred Annual Bonus
Plan, awards under which will continue
to be made in accordance with the policy
approved by shareholders at the 2014 AGM;
the existing plan expires before the next
AGM in 2017. The second plan is a US S423
Stock Purchase Plan, which is an all-
employee share plan similar to that offered
to employees under our Sharesave Plans in
the UK and certain other countries, approved
by shareholders in 2009. Resolutions 20 and
21 will be proposed as ordinary resolutions.
Recommendation
The directors consider that all the
resolutions to be put to the meeting are in
the best interests of the Company and its
shareholders as a whole. Your Board will be
voting in favour of them and unanimously
recommends that you do so as well.
By order of the Board
Doug Evans
Company Secretary
1 September 2016
Hays plc | 2016 Annual Report and Financial Statements88
DIRECTORS’ REPORT
CONTINUED
The directors are responsible for
preparing the Annual Report and Financial
Statements in accordance with applicable
law and regulations.
Company law requires the directors to
prepare financial statements for each
financial year. Under that law the directors
are required to prepare the Consolidated
Financial Statements in accordance with
International Financial Reporting Standards
(IFRSs) as adopted by the European Union
and Article 4 of the IAS Regulation and they
have elected to prepare the parent Company
financial statements in accordance with
United Kingdom Generally Accepted
Accounting Practice (United Kingdom
Accounting Standards and applicable law).
Under company law the directors must not
approve the financial statements unless they
are satisfied that they give a true and fair
view of the state of affairs of the Company
and of the profit or loss of the Company
for that period.
In preparing the parent Company financial
statements, the directors are required to:
–– select suitable accounting policies and
then apply them consistently;
–– make judgments and accounting estimates
that are reasonable and prudent;
–– state whether applicable UK Accounting
Standards have been followed, subject
to any material departures disclosed and
explained in the financial statements; and
–– prepare the financial statements on the
going concern basis unless it is
inappropriate to presume that the
Company will continue in business.
In preparing the Consolidated Financial
Statements, International Accounting
Standard 1 requires that directors:
–– properly select and apply accounting
policies;
–– present information, including accounting
policies, in a manner that provides
relevant, reliable, comparable and
understandable information;
–– provide additional disclosures when
compliance with the specific requirements
in IFRSs are insufficient to enable users
to understand the impact of particular
transactions, other events and conditions
on the entity’s financial position and
financial performance; and
–– make an assessment of the Company’s
ability to continue as a going concern.
The directors are responsible for keeping
adequate accounting records that are
sufficient to show and explain the Company’s
transactions and disclose with reasonable
accuracy at any time the financial position
of the Company and enable them to ensure
that the financial statements comply with
the Companies Act 2006. They are also
responsible for safeguarding the assets
of the Company and hence for taking
reasonable steps for the prevention and
detection of fraud and other irregularities.
The directors are responsible for the
maintenance and integrity of the corporate
and financial information included on the
Company’s website. Legislation in the United
Kingdom governing the preparation and
dissemination of financial statements may
differ from legislation in other jurisdictions.
Responsibility statement
The Board confirms to the best of its
knowledge that:
–– the Financial Statements, prepared in
accordance with the relevant financial
reporting framework, give a true and
fair view of the assets, liabilities, financial
position and profit or loss of the Company
and the undertakings included in the
consolidation taken as a whole;
–– the Strategic Report, including any
matters incorporated by reference in the
Directors’ Report, includes a fair review of
the development and performance of the
business and the position of the Company
and the undertakings included in the
consolidation taken as a whole, together
with a description of the principal risks
and uncertainties that they face; and
–– the Annual Report and Financial
Statements, taken as a whole, are fair,
balanced and understandable and provide
the information necessary for shareholders
to assess the Company’s performance,
business model and strategy.
By order of the Board
Alistair Cox
Chief Executive
Paul Venables
Group Finance Director
1 September 2016
Hays plc | 2016 Annual Report and Financial Statements89
OVERVIEW  STRATEGICREPORT  GOVERNANCE  FINANCIALSTATEMENTS  SHAREHOLDERINFORMATION
DIRECTORS’ RESPONSIBILITIES
Hays plc | 2016 Annual Report and Financial Statements90
Financial Statements
Financial Statements for the
Group including the report
from the independent Auditor.
In this section:
92	 Independent Auditor’s Report
96	Consolidated Group Financial Statements
125	Hays plc Company Financial Statements
Hays plc | 2016 Annual Report and Financial Statements91
OVERVIEW  STRATEGICREPORT  GOVERNANCE  FINANCIALSTATEMENTS  SHAREHOLDERINFORMATION
Opinion on financial statements of Hays plc
In our opinion:
–– the financial statements give a true and
fair view of the state of the Group’s and
of the parent Company’s affairs as at
30 June 2016 and of the Group’s profit
for the year then ended;
–– the Group financial statements have
been properly prepared in accordance
with International Financial Reporting
Standards (IFRSs) as adopted by the
European Union;
–– the parent Company financial statements
have been properly prepared in
accordance with United Kingdom
Generally Accepted Accounting Practice,
including FRS 101 ‘Reduced Disclosure
Framework’; and
–– the financial statements have been
prepared in accordance with the
requirements of the Companies Act 2006
and, as regards the Group financial
statements, Article 4 of the IAS Regulation.
The financial statements comprise the
Consolidated Income Statement, the
Consolidated Statement of Comprehensive
Income, the Consolidated and Parent
Company Balance Sheets, the Consolidated
Statement of Changes in Equity, the
Consolidated Cash Flow Statement and the
related notes 1 to 35 for the Consolidated
financial statements and the related notes
1 to 15 for the parent Company financial
statements. The financial reporting
framework that has been applied in
the preparation of the Group financial
statements is applicable law and IFRSs
as adopted by the European Union. The
financial reporting framework that has
been applied in the preparation of the parent
Company financial statements is applicable
law and United Kingdom Accounting
Standards (United Kingdom Generally
Accepted Accounting Practice), including
FRS 101 ‘Reduced Disclosure Framework’.
Going concern and the directors’
assessment of the principal risks that
would threaten the solvency or liquidity
of the Group
As required by the Listing Rules we have
reviewed the directors’ statement regarding
the appropriateness of the going concern
basis of accounting contained within note 2b
to the financial statements and the directors’
statement on the longer-term viability of the
Group contained within the Strategic Report
on pages 42 and 43.
We have nothing material to add or draw
attention to in relation to:
–– the directors’ confirmation on page 89
that they have carried out a robust
assessment of the principal risks facing
the Group, including those that would
threaten its business model, future
performance, solvency or liquidity;
–– the disclosures on pages 42 to 45 that
describe those risks and explain how
they are being managed or mitigated;
–– the directors’ statement in note 2b to the
financial statements about whether they
considered it appropriate to adopt the
going concern basis of accounting in
preparing them and their identification of
any material uncertainties to the Group’s
ability to continue to do so over a period
of at least 12 months from the date of
approval of the financial statements;
–– the directors’ explanation on pages 42
and 43 as to how they have assessed the
prospects of the Group, over what period
they have done so and why they consider
that period to be appropriate, and their
statement as to whether they have a
reasonable expectation that the Group
will be able to continue in operation
and meet its liabilities as they fall due
over the period of their assessment,
including any related disclosures drawing
attention to any necessary qualifications
or assumptions.
We agreed with the directors’ adoption of the
going concern basis of accounting and we did
not identify any such material uncertainties.
However, because not all future events or
conditions can be predicted, this statement is
not a guarantee as to the Group’s ability to
continue as a going concern.
Independence
We are required to comply with the Financial
Reporting Council’s Ethical Standards for
Auditors and we confirm that we are
independent of the Group and we have
fulfilled our other ethical responsibilities in
accordance with those standards. We also
confirm we have not provided any of the
prohibited non-audit services referred to
in those standards.
Our assessment of risks of material
misstatement
The assessed risks of material misstatement
described below are those that had the
greatest effect on our audit strategy, the
allocation of resources in the audit and
directing the efforts of the engagement team:
Risk How the scope of our audit responded to the risk
Debtor and accrued income recoverability
The recoverability of trade receivables,
accrued income and the level of provisions for
bad debts are considered to be a significant
risk due to the pervasive nature of these
balances to the financial statements, and the
importance of cash collection with reference
to the working capital management of the
business. At 30 June 2016, the total
receivables and accrued income balances
net of provisions included in note 17 was
£695.8 million (2015: £558.9 million).
Refer to the provisions in respect of
recoverability of trade receivables critical
accounting judgment and note 17 to the
financial statements for further detail.
We have:
–– assessed the design and implementation of key controls around the monitoring
of recoverability;
–– challenged management regarding the level and ageing of receivables and accrued
income, along with the consistency and appropriateness of receivables and accrued
income provisioning by assessing recoverability with reference to cash received in respect
of debtors and billings raised against accrued income. In addition we have considered the
Company’s previous experience of bad debt exposure, the individual counter-party credit
risk, the level of provision held by other recruitment businesses and the general economic
environment in each jurisdiction;
–– critically assessed the recoverability of overdue unprovided debt with reference
to the historical levels of bad debt expense and credit profile of the counter-parties;
–– tested these balances on a sample basis through agreement to post period end invoicing,
post period end cash receipt or agreement to the terms of the contract in place, as
appropriate; and
–– considered the consistency of judgments regarding the recoverability of trade
receivables and accrued income made year on year to consider whether there is
evidence of management bias through discussion with management on their rationale
and obtaining evidence to support judgment areas.
Hays plc | 2016 Annual Report and Financial Statements92
INDEPENDENT AUDITOR’S REPORT
TO THE MEMBERS OF HAYS PLC
Risk How the scope of our audit responded to the risk
Revenue recognition
The key risks on revenue recognition are:
–– cut-off where revenue is not recognised in
line with Group policy, which is to recognise
revenue associated with temporary
placements over the period that temporary
workers are provided, and permanent
placements on the start date; and
–– the presentation of revenue from
temporary placements where Hays acts
as a principal and revenue is recognised
and presented on a gross rather than
a net basis.
The risks noted above in relation to revenue
are areas that can involve management
judgment, therefore they are considered
to be significant risks.
Refer to the revenue recognition critical
accounting judgment in note 3 to the
financial statements for further detail.
We have:
–– assessed the design and implementation and operating effectiveness of key controls
around all streams of revenue recognised;
–– considered the appropriateness and accuracy of any cut-off adjustments processed
by considering the start date of permanent placements and the term of a temporary
placement with reference to the year end date;
–– evaluated whether revenue has been recognised in accordance with IAS 18 ‘Revenue’
and with Hays’ accounting policy by reviewing details of the Group revenue recognition
policy, the application of this, and any significant new contracts; and
–– confirmed that all material temporary worker contractual arrangements where Hays
acts as a principal and maintains the majority of the risk and rewards associated with the
underlying agreement have been recognised and presented on a gross revenue basis in
the financial statements.
Goodwill impairment
The total goodwill balance at 30 June 2016
was £220.4 million (2015: £198.4 million).
Management is required to carry out an
annual impairment test. This process is
complex and highly judgmental given the
indefinite nature of the goodwill. It is based
on assumptions about future growth and
discount rates, which can be sensitive
particularly in certain jurisdictions where the
growth rates are typically linked to individual
country GDP and country wage inflation.
Therefore, a risk exists that goodwill is
overstated on the balance sheet should any
judgments or assumptions be considered
inappropriate.
Refer to the goodwill impairment critical
accounting judgment and note 13 to the
financial statements for further detail.
We have:
–– assessed the design and implementation of key controls around the impairment
review process;
–– performed a detailed review and challenge of the models used including the
macroeconomic assumptions used;
–– compared key assumptions (including discount rates and growth rates) used across the
Group, used in the model to external data and, where possible, to information provided
by Deloitte Valuations experts;
–– assessed the reasonableness of forecast future cash flows by comparison to historical
performance and future outlook;
–– performed sensitivity analysis on key assumptions, including discount rates adopted; and
–– performed a detailed review of the disclosures in respect of impairments and impairment
testing adopted by management.
Pension accounting
Pension accounting is complex and contains
areas of significant judgment, notably the
discount and inflation rates and demographic
assumptions used in the valuation of the
net liability. Therefore, a risk exists that
inappropriate assumptions are used resulting
in an inaccurate pension valuation at year-end.
The net pension liability balance at 30 June
2016 was £14.3 million (2015: £58.7 million).
The net pension liability recognised is lower
than the present value of future contributions
to fund the existing deficit.
Refer to the pension accounting critical
accounting judgment and note 22 to the
financial statements for further detail.
We have:
–– assessed the design and implementation of key controls around the pension accounting;
–– assessed the actuarial assumptions (discount rate, inflation rates, and mortality
assumptions) adopted by the Group for the valuation of its retirement benefit
obligations, with specific focus on changes to demographic assumptions and rates
in the year;
–– utilised internal specialists to consider these assumptions and benchmarked them
against a relevant comparator group;
–– reviewed the pension scheme liability. Whilst the scheme is currently in a net deficit
position, the net pension liability recognised is lower than the present value of future
contributions to fund the existing deficit. In order to assess whether an additional liability
would need to be recognised, we reviewed the pension scheme trust documents
to assess whether Hays has an unconditional right to any scheme surplus; and
–– reviewed the disclosures made in note 22 and compared these to the requirements
of IAS 19 ‘Employee Benefits’.
Hays plc | 2016 Annual Report and Financial Statements93
OVERVIEW  STRATEGICREPORT  GOVERNANCE  FINANCIALSTATEMENTS  SHAREHOLDERINFORMATION
Last year our report included one other risk
which is not included in our report this year:
acquisition accounting in respect to the
acquisition of Veredus (the acquisition
accounting period has now ended and
we no longer see this as a specific risk area).
The description of risks above should be
read in conjunction with the significant issues
considered by the Audit Committee discussed
on pages 61 and 62.
These matters were addressed in the context
of our audit of the financial statements as a
whole, and in forming our opinion thereon,
and we do not provide a separate opinion
on these matters.
Our application of materiality
We define materiality as the magnitude of
misstatement in the financial statements
that makes it probable that the economic
decisions of a reasonably knowledgeable
person would be changed or influenced.
We use materiality both in planning the
scope of our audit work and in evaluating
the results of our work.
We determined materiality for the Group
to be £8.0 million (2015: £7.4 million), which is
approximately 5% (2015: 5.0%) of profit before
tax, and below 3% (2015: 3%) of equity.
Profit before tax has been selected as the
basis for materiality as this is the measure
by which key stakeholders and the market
assess the performance of the Group.
We agreed with the Audit Committee that
we would report to the Committee all audit
differences in excess of £160,000 (2015:
£150,000), as well as differences below
that threshold that, in our view, warranted
reporting on qualitative grounds. We also
report to the Audit Committee on disclosure
matters that we identified when assessing
the overall presentation of the financial
statements.
An overview of the scope of our audit
1. Full scope audit 90%
2. Specified procedures 2%
3. Head office review 8%
Net fees
1.
3.2.
1. Full scope audit 95%
2. Specified procedures 1%
3. Head office review 4%
Profit before tax
1.3.
2.
Our Group audit was scoped by obtaining
an understanding of the Group and its
environment, including Group-wide
controls, and assessing the risks of material
misstatement at the Group level. Based on
that assessment, we focused our Group audit
scope primarily on the audit work at 32
(2015: 33) locations. 19 (2015: 19) of these were
subject to a full audit, whilst the remaining 13
(2015: 14) were subject to an audit of specified
account balances/specified audit procedures
where the extent of our testing was based on
our assessment of the risks of material
misstatement and of the materiality of the
Group’s operations at those locations. These
19 locations represent the principal business
units within the Group’s three reportable
segments and account for 90% (2015: 90%)
of the Group’s net fees and 95% (2015: 92%)
of profit before tax. The three key locations
are Australia (APAC), Germany (CERoW)
and UK (UK  Ireland) which account for 70%
of net fees and 81% of profit before tax. Our
audit work at the 32 locations were executed
at levels of materiality applicable to each
individual entity which were lower than Group
materiality and ranged from £1.3 million to
£5.0 million (2015: £1.2 million to £4.7 million).
At the parent entity level we also tested
the consolidation process and carried
out analytical procedures to confirm our
conclusion that there were no significant
risks of material misstatement of the
aggregated financial information of the
remaining components not subject to audit
or audit of specified account balances.
The Group audit team continued to follow
a programme of planned visits that has
been designed so that the Senior Statutory
Auditor or a senior member of the Group
audit team visits each of the material
locations where the Group audit scope
was focused at least once every two years.
During the 2016 audit, the Senior Statutory
Auditor visited the UK, Australia and Hong
Kong. In addition, senior members of the
audit team visited Germany and the USA.
In years when we do not visit a significant
component we will include the component
audit team in our team planning and risk
briefing, discuss their risk assessment,
participate in the close meeting and
review documentation of the findings
from their work.
Opinion on other matters prescribed by
the Companies Act 2006
In our opinion:
–– the part of the Directors’ Remuneration
Report to be audited has been properly
prepared in accordance with the
Companies Act 2006; and
–– the information given in the Strategic
Report and the Directors’ Report for
the financial year for which the financial
statements are prepared is consistent
with the financial statements.
Hays plc | 2016 Annual Report and Financial Statements94
INDEPENDENT AUDITOR’S REPORT
TO THE MEMBERS OF HAYS PLC
CONTINUED
Matters on which we are required to report
by exception
Adequacy of explanations received and
accounting records
Under the Companies Act 2006 we are
required to report to you if, in our opinion:
–– we have not received all the information
and explanations we require for our audit;
or
–– adequate accounting records have not
been kept by the parent Company, or
returns adequate for our audit have not
been received from branches not visited
by us; or
–– the parent Company financial statements
are not in agreement with the accounting
records and returns.
We have nothing to report in respect of
these matters.
Directors’ remuneration
Under the Companies Act 2006 we are also
required to report if in our opinion certain
disclosures of directors’ remuneration have
not been made or the part of the Directors’
Remuneration Report to be audited is not in
agreement with the accounting records and
returns. We have nothing to report arising
from these matters.
Corporate Governance Statement
Under the Listing Rules we are also required to
review the part of the Corporate Governance
Statement relating to the Company’s
compliance with certain provisions of the UK
Corporate Governance Code. We have nothing
to report arising from our review.
Our duty to read other information in the
Annual Report
Under International Standards on Auditing
(UK and Ireland), we are required to report
to you if, in our opinion, information in the
Annual Report is:
–– materially inconsistent with the
information in the audited financial
statements; or
–– apparently materially incorrect based
on, or materially inconsistent with, our
knowledge of the Group acquired in the
course of performing our audit; or
–– otherwise misleading.
In particular, we are required to consider
whether we have identified any inconsistencies
between our knowledge acquired during the
audit and the directors’ statement that they
consider the Annual Report is fair, balanced
and understandable and whether the Annual
Report appropriately discloses those matters
that we communicated to the Audit Committee
which we consider should have been disclosed.
We confirm that we have not identified any
such inconsistencies or misleading statements.
Respective responsibilities of directors
and Auditor
As explained more fully in the Directors’
Responsibilities Statement, the directors are
responsible for the preparation of the financial
statements and for being satisfied that they
give a true and fair view. Our responsibility is
to audit and express an opinion on the financial
statements in accordance with applicable law
and International Standards on Auditing (UK
and Ireland). We also comply with International
Standard on Quality Control 1 (UK and Ireland).
Our audit methodology and tools aim to
ensure that our quality control procedures are
effective, understood and applied. Our quality
controls and systems include our dedicated
professional standards review team, and
independent partner reviews.
This report is made solely to the Company’s
members, as a body, in accordance with
Chapter 3 of Part 16 of the Companies Act
2006. Our audit work has been undertaken
so that we might state to the Company’s
members those matters we are required
to state to them in an auditor’s report and
for no other purpose. To the fullest extent
permitted by law, we do not accept or
assume responsibility to anyone other than
the Company and the Company’s members
as a body, for our audit work, for this report,
or for the opinions we have formed.
Scope of the audit of the financial statements
An audit involves obtaining evidence about
the amounts and disclosures in the financial
statements sufficient to give reasonable
assurance that the financial statements are
free from material misstatement, whether
caused by fraud or error. This includes an
assessment of: whether the accounting
policies are appropriate to the Group’s
and the parent Company’s circumstances
and have been consistently applied and
adequately disclosed; the reasonableness of
significant accounting estimates made by the
directors; and the overall presentation of the
financial statements. In addition, we read all
the financial and non-financial information
in the Annual Report to identify material
inconsistencies with the audited financial
statements and to identify any information
that is apparently materially incorrect based
on, or materially inconsistent with, the
knowledge acquired by us in the course of
performing the audit. If we become aware
of any apparent material misstatements or
inconsistencies we consider the implications
for our report.
Stephen Griggs
(Senior Statutory Auditor), FCA
for and on behalf of Deloitte LLP
Chartered Accountants and
Statutory Auditor
London, United Kingdom
1 September 2016
Hays plc | 2016 Annual Report and Financial Statements95
OVERVIEW  STRATEGICREPORT  GOVERNANCE  FINANCIALSTATEMENTS  SHAREHOLDERINFORMATION
(In £s million) Note 2016 2015
Turnover
Continuing operations 4,231.4 3,842.8
Net fees(1)
Continuing operations 4 810.3 764.2
Operating profit from continuing operations 4 181.0 164.1
Net finance charge 8 (8.0) (8.0)
Profit before tax 173.0 156.1
Tax 9 (51.9) (50.7)
Profit from continuing operations after tax 121.1 105.4
Profit from discontinued operations 10 3.4 0.2
Profit attributable to equity holders of the parent Company 124.5 105.6
Earnings per share from continuing operations
	 – Basic 12 8.48p 7.44p
	 – Diluted 12 8.37p 7.31p
Earnings per share from continuing and discontinued operations
	 – Basic 12 8.72p 7.46p
	 – Diluted 12 8.60p 7.33p
(1)	 Net fees comprise turnover less remuneration of temporary workers and other recruitment agencies.
(In £s million) 2016 2015
Profit for the year 124.5 105.6
Items that will not be reclassified subsequently to profit or loss:
Actuarial remeasurement of defined benefit pension schemes 35.5 (25.8)
Tax relating to components of other comprehensive income (7.2) 6.3
28.3 (19.5)
Items that may be reclassified subsequently to profit or loss:
Currency translation adjustments 64.3 (31.3)
Mark to market valuation of derivative financial instruments – 0.1
Other comprehensive income for the year net of tax 92.6 (50.7)
Total comprehensive income for the year 217.1 54.9
Attributable to equity shareholders of the parent Company 217.1 54.9
Hays plc | 2016 Annual Report and Financial Statements96
CONSOLIDATED INCOME STATEMENT
FOR THE YEAR ENDED 30 JUNE
CONSOLIDATED STATEMENT OF COMPREHENSIVE INCOME
FOR THE YEAR ENDED 30 JUNE
(In £s million) Note 2016 2015
Non-current assets
Goodwill 13 220.4 198.4
Other intangible assets 14 21.6 29.8
Property, plant and equipment 15 19.8 15.6
Deferred tax assets 16 23.9 36.4
285.7 280.2
Current assets
Trade and other receivables 17 763.9 600.5
Cash and cash equivalents 18 62.9 69.8
Derivative financial instruments 19 6.6 –
833.4 670.3
Total assets 1,119.1 950.5
Current liabilities
Trade and other payables 21 (573.3) (478.7)
Current tax liabilities (27.1) (19.5)
Bank loans and overdrafts 20 (1.1) (0.5)
Provisions 23 (3.1) (3.0)
(604.6) (501.7)
Non-current liabilities
Bank loans 20 (25.0) (100.0)
Acquisition liabilities 34 (11.2) (8.6)
Retirement benefit obligations 22 (14.3) (58.7)
Provisions 23 (6.2) (11.9)
(56.7) (179.2)
Total liabilities (661.3) (680.9)
Net assets 457.8 269.6
Equity
Called up share capital 24 14.7 14.7
Share premium 25 369.6 369.6
Capital redemption reserve 26 2.7 2.7
Retained earnings 27 (15.8) (138.2)
Cumulative translation reserve 28 66.4 2.1
Equity reserve 29 20.2 18.7
Total shareholders’ equity 457.8 269.6
The Consolidated Financial Statements of Hays plc, registered number 2150950, were approved by the Board of Directors and authorised for
issue on 1 September 2016.
Signed on behalf of the Board of Directors
A R Cox		 P Venables
Hays plc | 2016 Annual Report and Financial Statements97
OVERVIEW  STRATEGICREPORT  GOVERNANCE  FINANCIALSTATEMENTS  SHAREHOLDERINFORMATION
CONSOLIDATED BALANCE SHEET
AT 30 JUNE
(In £s million)
Share
capital
Share
premium
account
Capital
redemption
reserve
Retained
earnings
Cumulative
translation
reserve
Equity
reserve
Other
reserves Total
At 1 July 2015 14.7 369.6 2.7 (138.2) 2.1 18.7 – 269.6
Currency translation adjustments – – – – 64.3 – – 64.3
Remeasurement of defined benefit pension schemes – – – 35.5 – – – 35.5
Tax relating to components of other comprehensive income – – – (7.2) – – – (7.2)
Net expense recognised in other comprehensive income – – – 28.3 64.3 – – 92.6
Profit for the year – – – 124.5 – – – 124.5
Total comprehensive income for the year – – – 152.8 64.3 – – 217.1
Dividends paid – – – (39.9) – – – (39.9)
Share-based payments – – – 10.2 – 1.5 – 11.7
Tax on share-based payment transactions – – – (0.7) – – – (0.7)
At 30 June 2016 14.7 369.6 2.7 (15.8) 66.4 20.2 – 457.8
(In £s million)
Share
capital
Share
premium
account
Capital
redemption
reserve
Retained
earnings
Cumulative
translation
reserve
Equity
reserve
Other
reserves Total
At 1 July 2014 14.7 369.6 2.7 (197.7) 33.4 18.3 (0.3) 240.7
Currency translation adjustments – – – – (31.3) – – (31.3)
Mark to market valuation of derivative financial instruments – – – – – – 0.1 0.1
Remeasurement of defined benefit pension schemes – – – (25.8) – – – (25.8)
Tax relating to components of other comprehensive income – – – 6.3 – – – 6.3
Net expense recognised in other comprehensive income – – – (19.5) (31.3) – 0.1 (50.7)
Profit for the year – – – 105.6 – – – 105.6
Total comprehensive income for the year – – – 86.1 (31.3) – 0.1 54.9
Dividends paid – – – (37.9) – – – (37.9)
Share-based payments – – – 10.5 – 0.4 0.2 11.1
Tax on share-based payment transactions – – – 0.8 – – – 0.8
At 30 June 2015 14.7 369.6 2.7 (138.2) 2.1 18.7 – 269.6
Hays plc | 2016 Annual Report and Financial Statements98
CONSOLIDATED STATEMENT OF CHANGES IN EQUITY
FOR THE YEAR ENDED 30 JUNE 2016
FOR THE YEAR ENDED 30 JUNE 2015
(In £s million) Note 2016 2015
Operating profit from continuing operations 181.0 164.1
Adjustments for:
	 Depreciation of property, plant and equipment 7.7 8.7
	 Amortisation of intangible assets 14.2 13.7
	 Net movements in provisions (1.2) (0.5)
	 Share-based payments 11.9 10.8
32.6 32.7
Operating cash flow before movement in working capital 213.6 196.8
Movement in working capital:
Increase in receivables (98.8) (53.0)
Increase in payables 44.5 45.9
(54.3) (7.1)
Cash generated by operations 159.3 189.7
Pension scheme deficit funding (14.4) (14.0)
Income taxes paid (41.7) (43.6)
Net cash inflow from operating activities 103.2 132.1
Investing activities
Purchase of property, plant and equipment (10.3) (7.8)
Proceeds from sales of business assets 0.1 0.2
Purchase of intangible assets (4.7) (4.3)
Acquisition of subsidiaries – (35.7)
Cash paid in respect of acquisitions made in previous years – (1.6)
Interest received 0.5 0.5
Net cash used in investing activities (14.4) (48.7)
Financing activities
Interest paid (4.1) (5.7)
Equity dividends paid (39.9) (37.9)
Proceeds from exercise of share options 1.5 1.8
Decrease in bank loans and overdrafts (74.4) (10.2)
Net cash used in financing activities (116.9) (52.0)
Net (decrease)/increase in cash and cash equivalents (28.1) 31.4
Cash and cash equivalents at beginning of year 33 69.8 48.0
Effect of foreign exchange rate movements 21.2 (9.6)
Cash and cash equivalents at end of year 33 62.9 69.8
Hays plc | 2016 Annual Report and Financial Statements99
OVERVIEW  STRATEGICREPORT  GOVERNANCE  FINANCIALSTATEMENTS  SHAREHOLDERINFORMATION
CONSOLIDATED CASH FLOW STATEMENT
FOR THE YEAR ENDED 30 JUNE
1. General information
Hays plc is a Company incorporated in the
United Kingdom and registered in England
and Wales and its registered office is 250
Euston Road, London NW1 2AF.
The Consolidated Financial Statements
have been prepared in accordance with
International Financial Reporting Standards
(IFRSs) and IFRS Interpretation Committee
interpretations (IFRICs) as adopted by the
European Union and therefore comply with
Article 4 of the European Union International
Accounting Standard (IAS) Regulation.
New standards and interpretations
The Consolidated Financial Statements have
been prepared on the basis of the accounting
policies and methods of computation
applicable for the year ended 30 June 2016.
These accounting policies are consistent
with those applied in the preparation of the
accounts for the year ended 30 June 2015
with the exception of the following new
accounting standards, amendments and
interpretations which were mandatory for
accounting periods beginning on or after
1 January 2015, none of which had any
material impact on the Group’s results or
financial position.
–– IAS 19 (amendments) Employee Benefits
(EU adoption from 1 February 2015)
–– Annual Improvements to IFRSs 2012
(EU adoption from 1 February 2015)
–– Annual Improvements to IFRSs 2013
(EU adoption from 1 January 2015)
There have been no alterations made to the
accounting policies as a result of considering
all IFRS and IFRIC amendments and
interpretations that became effective during
the financial year, as these were either not
material to the Group’s operation, or were
not relevant.
The Group has not yet adopted certain new
standards, amendments and interpretations
to existing standards, which have been
published but which are only effective for
our accounting periods beginning on or after
1 July 2016. These new pronouncements are
listed as follows:
–– IFRS 14 Regulatory Deferral Accounts
(effective 1 January 2016) 	
–– IFRS 10 and IAS 28 (amendments)
Investment Entities Applying the
Consolidated Exemption (effective from
1 January 2016)
–– IFRS 11 (amendments) Accounting for
Acquisitions of Interests in Joint
Operations (effective 1 January 2016)
–– IAS 1 (amendments) Presentation of
Financial Statements (effective from
1 January 2016)
–– IAS 16 and IAS 38 (amendment)
Clarification of Acceptable Methods of
Depreciation and Amortisation (effective
1 January 2016)
–– IAS 27 (amendments) Equity Method in
Separate Financial Statements (effective
from 1 January 2016)
–– Annual Improvements to IFRSs 2014
(effective 1 January 2016)
–– IAS 12 (amendments) Income Taxes
(effective from 1 January 2017)
–– IAS 7 (amendments) Statement of Cash
Flows on Disclosure Initiative (effective
from 1 January 2017)
–– IFRS 2 (amendments) Share Based
Payments (effective 1 January 2018)	
–– IFRS 9 Financial Instruments (effective
1 January 2018)
–– IFRS 15 Revenue from Contracts and
Customer (effective 1 January 2018)
–– IFRS 15 (amendments) Revenue from
Contracts and Customer (effective
1 January 2018)
–– IFRS 16 Leases (effective 1 January 2019)
The directors are currently evaluating the
impact of the adoption of these standards,
amendments and interpretations but do not
expect them to have a material impact on
the Group operation or results with the
exception of IFRS 16 Leases. IFRS 16 will
primarily change the lease accounting
requirement for lessees as currently
disclosed in note 32 to the Consolidated
Financial Statements.
The Group’s principal accounting policies
adopted in the presentation of these
financial statements are set out below and
have been consistently applied to all the
periods presented.
2. Significant accounting policies
a. Basis of preparation
The Consolidated Financial Statements have
been prepared on the historical cost basis
with the exception of financial instruments.
Financial instruments have been recorded
initially on a fair-value basis and then at
amortised cost.
b. Going concern	
The Group’s business activities, together
with the factors likely to effect its future
development, performance and viability are
set out in the Strategic Report on pages 9
to 45. The financial position of the Group,
its cash flows and liquidity position are
described in the Financial Review on pages
38 to 41. In addition, notes 18 to 20 to the
Consolidated Financial Statements include
details of the Group’s treasury activities,
long-term funding arrangements and
exposure to financial risk.
The Group has sufficient financial resources
which, together with internally generated
cash flows, will continue to provide sufficient
sources of liquidity to fund its current
operations, including its contractual and
commercial commitments and any proposed
dividends. Therefore the Group is well placed
to manage its business risks.
After making enquiries the directors have
formed the judgment that at the time of
approving the Consolidated Financial
Statements there is a reasonable expectation
that the Group has adequate resources to
continue in operational existence for the
foreseeable future. For this reason, the
directors continue to adopt the going
concern basis in preparing the Consolidated
Financial Statements.
c. Basis of consolidation
Subsidiaries are fully consolidated from the
date on which power to control is transferred
to the Group. They are deconsolidated from
the date on which control ceases.
The acquisition method of accounting is used
to account for the acquisition of subsidiaries
by the Group whereby the identifiable
assets, liabilities and contingent liabilities
are measured at their fair values at the date
of acquisition. The excess of the cost of
acquisition over the fair value of the Group’s
share of the identifiable net assets acquired
is recorded as goodwill. The financial
statements consolidate the accounts of Hays
plc and all of its subsidiaries. The results of
subsidiaries acquired or disposed during the
year are included from the effective date of
acquisition or up to the effective date of
disposal as appropriate.
Hays plc | 2016 Annual Report and Financial Statements100
NOTES TO THE CONSOLIDATED FINANCIAL STATEMENTS
All intra-Group transactions, balances,
income and expenses are eliminated
on consolidation.
d. Turnover
Turnover is measured at the fair value of
the consideration received or receivable and
represents amounts receivable for goods
and services provided in the normal course
of business, net of discounts, VAT and other
sales-related taxes.
Turnover arising from the placement of
permanent candidates is recognised at the
time the candidate commences full-time
employment. Provision is made for the
expected cost of meeting obligations where
employees do not work for the specified
contractual period.
Turnover arising from temporary placements
is recognised over the period that temporary
workers are provided. Where the Group
is acting as a principal, turnover represents
the amounts billed for the services of
the temporary workers, including the
remuneration costs of the temporary workers.
Where Hays acts as principal in
arrangements that invoice on behalf of other
recruitment agencies, turnover represents
amounts invoiced and collected on behalf
of other recruitment agencies, including
arrangements where no commission is
directly receivable by the Group.
Where the Group is acting as an agent,
turnover represents commission receivable
relating to the supply of temporary workers
and does not include the remuneration costs
of the temporary workers.
e. Net fees
Net fees represent turnover less the
remuneration costs of temporary workers for
temporary assignments and remuneration
of other recruitment agencies. For the
placement of permanent candidates, net
fees are equal to turnover.
f. Exceptional items
Exceptional items as disclosed on the face
of the Consolidated Income Statement
are items which due to their size and
non-recurring nature have been classified
separately in order to draw them to the
attention of the reader of the financial
statements and to show the underlying
profits of the Group. There are no exceptional
items disclosed within the financial
statements in the current or prior year.
g. Foreign currencies
On consolidation, the tangible and
intangible assets and liabilities of subsidiaries
denominated in foreign currencies are
translated into sterling at the rates ruling at
the balance sheet date. Income and expense
items are translated into sterling at average
rates of exchange for the period. Any
exchange differences which have arisen from
an entity’s investment in a foreign subsidiary,
including long-term loans, are recognised as
a separate component of equity and are
included in the Group’s translation reserve.
On disposal of a subsidiary, any amounts
transferred to the translation reserve
are included in the calculation of profit
and loss on disposal. All other translation
differences are dealt with in the Consolidated
Income Statement.
Goodwill and fair value adjustments arising
on the acquisition of a foreign entity are
treated as assets and liabilities of the foreign
entity and translated at the closing rate.
h. Retirement benefit costs
The expense of defined benefit pension
schemes and other post-retirement
employee benefits is determined using the
projected-unit credit method and charged
to the Consolidated Income Statement as
an expense, based on actuarial assumptions
reflecting market conditions at the beginning
of the financial year. All remeasurement
gains and losses are recognised immediately
in reserves and reported in the Consolidated
Statement of Comprehensive Income in the
period in which they occur. Past service
costs, curtailments and settlements are
recognised immediately in the Consolidated
Income Statement.
The Group has chosen under IFRS 1 to
recognise in retained earnings all cumulative
remeasurement gains and losses as at
1 July 2004, the date of transition to IFRS.
The Group has chosen to recognise all
remeasurement gains and losses arising
subsequent to 1 July 2004 in reserves and
reported in the Consolidated Statement of
Comprehensive Income.
The retirement benefit obligation recognised
in the Consolidated Balance Sheet represents
the present value of the defined benefit
obligation as adjusted for unrecognised past
service cost, and as reduced by the fair value
of scheme assets. Any asset resulting from
this calculation is limited to past service cost,
plus the present value of available refunds
and reductions in future contribution to
the scheme.
Payments to defined contribution schemes
are charged as an expense in the Consolidated
Income Statement as they fall due.
i. Share-based payments
The fair value of all share-based remuneration
that is assessed upon market-based
performance criteria is determined at the
date of grant and recognised as an expense
in the Consolidated Income Statement on
a straight-line basis over the vesting period,
taking account of the estimated number
of shares that will vest.
The fair value of all share-based remuneration
that is assessed upon non-market-based
performance criteria is determined at the date
of the grant and recognised as an expense
in the Consolidated Income Statement over
the vesting period, based on the number of
shares that are expected to vest. The number
of shares that are expected to vest is adjusted
accordingly to the satisfaction of the
performance criteria at each period end.
The fair values are determined by use of the
relevant valuation models. All share-based
remuneration is equity settled.
j. Borrowing costs
Interest costs are recognised as an expense
in the Consolidated Income Statement
in the period in which they are incurred.
Arrangement fees incurred in respect of
borrowings are amortised over the term
of the agreement.
k. Taxation
The tax expense comprises both current
and deferred tax.
The tax currently payable is based on taxable
profit for the year. Taxable profit differs from
net profit as reported in the Consolidated
Income Statement because it excludes items
of income or expense that are taxable or
deductible in other years and it further
excludes items that are never taxable or
deductible. The Group’s liability for current
tax is calculated using tax rates that have
been enacted or substantively enacted
by the balance sheet date.
Hays plc | 2016 Annual Report and Financial Statements101
OVERVIEW  STRATEGICREPORT  GOVERNANCE  FINANCIALSTATEMENTS  SHAREHOLDERINFORMATION
2. Significant accounting policies
continued
Deferred tax is provided in full on all
temporary differences, at rates that are
enacted or substantively enacted by the
balance sheet date. Deferred tax assets
are recognised only to the extent that it is
probable that taxable profits will be available
against which to offset the deductible
temporary differences. Deferred tax assets
and liabilities are offset when there is a
legally enforceable right to set off current
tax assets against current tax liabilities and
when they relate to income taxes levied by
the same taxation authority and the Group
intends to settle its current tax assets and
liabilities on a net basis.
Temporary differences arise where there is a
difference between the accounting carrying
value in the Consolidated Balance Sheet
and the amount attributed to that asset
or liability for tax purposes. Temporary
differences arising from goodwill and, except
in a business combination, the initial
recognition of assets or liabilities that affect
neither accounting profit nor taxable profit,
are not provided for. Deferred tax liabilities
are recognised for taxable temporary
differences arising on investments in
subsidiaries and associates except where the
Group is able to control the reversal of the
temporary differences and it is probable that
the temporary difference will not reverse in
the foreseeable future.
The calculation of the Group’s total tax
charge necessarily involves a degree of
estimation and judgment in respect of
certain items whose tax treatment cannot be
finally determined until resolution has been
reached with the relevant tax authority, or, as
appropriate, through a formal legal process.
Provisions for tax contingencies require
management to make judgments and
estimates in relation to tax audit issues and
exposures. Amounts provided are based on
management’s interpretation of applicable
tax law and the likelihood of settlement, and
are derived from the Group’s best estimation
and judgment. However, the inherent
uncertainty regarding the outcome of these
items means the eventual resolution could
differ from the provision and in such event
the Group would be required to make an
adjustment in a subsequent period.
l. Goodwill
Goodwill arising on consolidation represents
the excess of purchase consideration less
the fair value of the identifiable tangible
and intangible assets and liabilities acquired.
Goodwill is recognised as an asset and
reviewed for impairment at least annually.
For the purpose of impairment testing,
assets are grouped at the lowest level
for which there are separately identifiable
cash flows, known as cash-generating
units (CGUs). Any impairment is recognised
immediately in the Consolidated Income
Statement and is not subsequently reversed.
On disposal of a business the attributable
amount of goodwill is included in the
determination of the profit or loss on disposal.
Goodwill arising on acquisitions before
the date of transition to IFRS (1 July 2004)
has been retained at the previous UK GAAP
amounts, subject to being tested for
impairment at that date. Goodwill arising on
acquisitions prior to 1 July 1998 was written
off direct to reserves under UK GAAP. This
goodwill has not been reinstated and is not
included in determining any subsequent
profit or loss on disposal.
m. Intangible assets
Intangible assets acquired as part of a business
combination are stated in the Consolidated
Balance Sheet at their fair value as at the date
of acquisition less accumulated amortisation
and any provision for impairment. The directors
review intangible assets for indications of
impairment annually.
Internally generated intangible assets are
stated in the Consolidated Balance Sheet
at the directly attributable cost of creation
of the asset, less accumulated amortisation.
Intangible assets are amortised on a
straight-line basis over their estimated useful
lives up to a maximum of 10 years. Software
incorporated into major Enterprise Resource
Planning (ERP) implementations that
support the recruitment process and
financial reporting process is amortised over
a life of up to seven years. Other software
is amortised between three and five years.
n. Property, plant and equipment
Property, plant and equipment is recorded
at cost, net of depreciation and any provision
for impairment. Depreciation is provided on a
straight-line basis over the anticipated useful
working lives of the assets, after they have
been brought into use, at the following rates:
Freehold land
–– No depreciation is provided
Freehold buildings
–– At rates varying between 2% and 10%
Leasehold properties
–– The cost is written off over the unexpired
term of the lease
Plant and machinery
–– At rates varying between 5% and 33%
Fixtures and fittings
–– At rates varying between 10% and 25%
o. Trade and other receivables
Trade and other receivables are initially
measured at fair value and then at amortised
cost after appropriate allowances for
estimated irrecoverable amounts have been
recognised in the Consolidated Income
Statement where there is objective evidence
that the asset is impaired.
p. Cash and cash equivalents
Cash and cash equivalents comprise
cash-in-hand and current balances with
banks and similar institutions, which are
readily convertible to known amounts of
cash and which are subject to insignificant
risk of changes in value.
q. Trade payables
Trade payables are measured initially at fair
value and then at amortised cost.
r. Bank borrowings
Interest-bearing bank loans and overdrafts
are recorded initially at fair value and
subsequently measured at amortised cost.
Finance charges, including premiums
payable on settlement or redemption and
direct-issue costs, are accounted for on an
accrual basis in the Consolidated Income
Statement using the effective interest rate
method and are added to the carrying
amount of the instrument to the extent that
they are not settled in the period in which
they arise.
Hays plc | 2016 Annual Report and Financial Statements102
NOTES TO THE CONSOLIDATED FINANCIAL STATEMENTS
CONTINUED
s. Derivative financial instruments and
hedge accounting
The Group may use certain derivative financial
instruments to reduce its exposure to interest
rate and foreign exchange movements. The
Group held eight foreign exchange contracts
at the end of the current year to facilitate cash
management within the Group. In the prior
year the Group held two interest rate swaps
which have subsequently matured in the
current year. The Group does not hold or
use derivative financial instruments for
speculative purposes.
Changes in the fair value of derivative
financial instruments that are designated
and effective as hedges of future cash flows
are recognised directly in equity and any
ineffective portion is recognised immediately
in the Consolidated Income Statement. The
Group uses a range of 80% to 125% for hedge
effectiveness, in accordance with IAS 39,
and any relationship which has effectiveness
outside this range is deemed to be ineffective
and hedge accounting is suspended.
The fair values of foreign exchange swaps
are measured using inputs other than quoted
prices that are observable for the asset or
liability, either directly or indirectly. It is the
Group’s policy not to seek to designate these
derivatives as hedges. All derivative financial
instruments not in a hedge relationship are
classified as derivatives at fair value in the
income statement. The fair value of long-
term borrowing is calculated by discounting
expected future cash flows at observable
market rates.
Fair value measurements
The information below sets out how the
Group determines fair value of various
financial assets and financial liabilities.
The following provides an analysis of
financial instruments that are measured
subsequent to initial recognition at fair value,
grouped into Levels 1 to 3 based on the
degree to which the fair value is observable.
–– Level 1 fair value measurements are those
derived from quoted prices (unadjusted)
in active markets for identical assets
or liabilities;
–– Level 2 fair value measurements are those
derived from inputs other than quoted
prices included within Level 1 that are
observable for the asset or liability
either directly (i.e. as prices) or indirectly
(i.e. derived from prices); and
–– Level 3 fair value measurements are those
derived from valuation techniques that
include inputs for the asset or liability that
are not based on observable market data
(unobservable inputs).
Amounts deferred in equity are recognised
in the Consolidated Income Statement in
the same period in which the hedged item
affects net income.
Cash flow hedge accounting is discontinued
when a hedging instrument expires or is
sold, terminated or exercised, or no longer
qualifies for hedge accounting. At that time
any cumulative gain or loss on the hedging
instrument recognised in equity is either
retained in equity until the firm commitment
or forecasted transaction occurs, or where
a hedge transaction is no longer expected to
occur, is immediately credited or expensed
in the Consolidated Income Statement.
t. Leases
Leases where a significant portion of risks
and rewards of ownership are retained by
the lessor are classified as operating leases
by the lessee.
Rentals payable under operating leases
are charged to the Consolidated Income
Statement on a straight-line basis over the
lease term.
Benefits received and receivable as an
incentive to enter into an operating lease
are recognised on a straight-line basis over
the lease term.
u. Provisions
A provision is recognised when the Group has
a present legal or constructive obligation as a
result of a past event for which it is probable
that an outflow of resources will be required
to settle the obligation and when the amount
can be reliably estimated. If the effect is
material, provisions are determined by
discounting the expected future cash flows at
a pre-tax rate that reflects the current market
assessments of the time value of money
and the risks specific to the liability.
3. Critical accounting judgments
and key sources of estimation
uncertainty
Critical accounting judgments
Revenue recognition
The main areas of judgment in revenue
recognition relate to (i) cut-off as revenue
is recognised for permanent placements
on the day a candidate starts work and
temporary placement income over the
duration of the placement; and (ii) the
recognition of temporary contractual
arrangements where Hays act on a gross
basis rather than a net basis. Turnover and
Net fees are described in note 2 (d) and (e)
to the Consolidated Financial Statements.
Goodwill impairment
Goodwill is tested for impairment at
least annually. In performing these tests
assumptions are made in respect of future
growth rates and the discount rate to be
applied to the future cash flows of income-
generating units. These assumptions are set
out in note 13 to the Consolidated Financial
Statements.
Provisions in respect of recoverability
of trade receivables
As described in note 17, provisions for
impairment of trade receivables have been
made. In reviewing the appropriateness of
these provisions, consideration has been
given to the ageing of the debt and the
potential likelihood of default, taking into
account current economic conditions.
Estimation uncertainty
Pension accounting
Under IAS 19 ‘Employee Benefits’, the Group
has recognised a pension deficit of £14.3
million (2015: £58.7 million). A number of
assumptions have been made in determining
the pension deficit and these are described
in note 22 to the Consolidated Financial
Statements.
Hays plc | 2016 Annual Report and Financial Statements103
OVERVIEW  STRATEGICREPORT  GOVERNANCE  FINANCIALSTATEMENTS  SHAREHOLDERINFORMATION
4. Segmental information
IFRS 8 Operating Segments
IFRS 8 requires operating segments to be identified on the basis of internal reports about components of the Group that are regularly
reviewed by the chief operating decision maker to allocate resources to the segment and to assess their performance.
As a result, the Group continues to segment the business into three regions, Asia Pacific, Continental Europe  Rest of World, and United
Kingdom  Ireland. There is no material difference between the segmentation of the Group’s turnover by geographic origin and destination.
The Group’s continuing operations comprise one class of business, that of qualified, professional and skilled recruitment.
Net fees and operating profit from continuing operations
The Group’s Management Board, which is regarded as the chief operating decision maker, uses net fees by segment as its measure of revenue
in internal reports, rather than use turnover. This is because net fees exclude the remuneration of temporary workers, and payments to other
recruitment agencies where the Group acts as principal, which are not considered relevant in allocating resources to segments. The Group’s
Management Board considers net fees for the purpose of making decisions about allocating resources. The Group does not report items
below operating profit by segment in its internal management reporting. The full detail of these items can be seen in the Group Consolidated
Income Statement on page 96. The reconciliation of turnover to net fees can be found in note 5.
(In £s million) 2016 2015
Net fees from continuing operations
Asia Pacific 176.1 178.5
Continental Europe  Rest of World 362.5 313.8
United Kingdom  Ireland 271.7 271.9
810.3 764.2
(In £s million) 2016 2015
Operating profit from continuing operations
Asia Pacific 50.2 49.7
Continental Europe  Rest of World 78.7 68.7
United Kingdom  Ireland 52.1 45.7
181.0 164.1
Net trade receivables
For the purpose of monitoring performance and allocating resources from a balance sheet perspective, the Group’s Management Board
monitors trade receivables net of provisions for impairments only on a segment by segment basis. These are monitored on a constant
currency basis for comparability through the year. These are shown below and reconciled to the totals as shown in note 17.
Net trade receivables
(In £s million)
As reported
internally
Foreign
exchange 2016
As reported
internally
Foreign
exchange 2015
Asia Pacific 58.2 7.6 65.8 55.1 (6.0) 49.1
Continental Europe  Rest of World 202.4 34.5 236.9 185.7 (18.8) 166.9
United Kingdom  Ireland 180.3 3.9 184.2 153.8 (0.1) 153.7
440.9 46.0 486.9 394.6 (24.9) 369.7
Major customers
In the current year and prior year there was no one customer that exceeded 10% of the Group’s turnover.
Hays plc | 2016 Annual Report and Financial Statements104
NOTES TO THE CONSOLIDATED FINANCIAL STATEMENTS
CONTINUED
5. Operating profit from continuing operations
The following costs are deducted from turnover to determine net fees from continuing operations:
(In £s million) 2016 2015
Turnover 4,231.4 3,842.8
Remuneration of temporary workers (3,236.5) (2,941.5)
Remuneration of other recruitment agencies (184.6) (137.1)
Net fees 810.3 764.2
Operating profit is stated after charging the following items to net fees of £810.3 million (2015: £764.2 million):
(In £s million) 2016 2015
Staff costs (note 7) 476.3 440.6
Depreciation of property, plant and equipment 7.7 8.7
Amortisation of intangible assets 14.2 13.7
Operating lease rentals payable (note 32) 34.0 30.8
Impairment loss on trade receivables 3.0 2.5
Auditor remuneration (note 6)
	 – for statutory audit services 0.9 0.9
	 – for other services 0.7 0.4
6. Auditor remuneration
(In £s million) 2016 2015
Fees payable to the Company's Auditor for the audit of the Company's annual accounts 0.2 0.2
Fees payable to the Company's Auditor and their associates for other services to the Group:
The audit of the Company's subsidiaries pursuant to legislation 0.7 0.7
Total audit fees 0.9 0.9
Half year review 0.1 0.1
Tax and other services 0.6 0.3
Total non-audit fees 0.7 0.4
Other services, principally relating to technical accounting advice, totalled £44,000 (2015: £33,000). No services were performed pursuant
to contingent fee arrangements.
Tax and other services includes the completion of a comprehensive review of our transfer pricing framework to enhance existing
arrangements such that the Group will continue to conform to best practice under OECD guidelines. The Group’s existing arrangements are
well known to Deloitte both in the UK and globally. This, together with the expertise within the firm, meant that they were best placed to
partner us in this piece of work.
Hays plc | 2016 Annual Report and Financial Statements105
OVERVIEW  STRATEGICREPORT  GOVERNANCE  FINANCIALSTATEMENTS  SHAREHOLDERINFORMATION
7. Staff costs
The aggregate staff remuneration (including executive directors) was as follows:
(In £s million) 2016 2015
Wages and salaries 400.5 370.8
Social security costs 50.0 46.4
Other pension costs 13.9 12.6
Share-based payments 11.9 10.8
476.3 440.6
Average number of persons employed (including executive directors):
(Number) 2016 2015
Continuing operations
	 Asia Pacific 1,662 1,577
	 Continental Europe  Rest of World 3,923 3,504
	 United Kingdom  Ireland 3,668 3,742
9,253 8,823
Closing number of persons employed (including executive directors):
(Number) 2016 2015
Continuing operations
	 Asia Pacific 1,660 1,639
	 Continental Europe  Rest of World 4,040 3,643
	 United Kingdom  Ireland 3,514 3,741
9,214 9,023
8. Net finance charge
(In £s million) 2016 2015
Interest received on bank deposits 0.5 0.5
Interest payable on bank loans and overdrafts (3.4) (4.6)
Interest unwind on acquisition liability (0.9) (0.4)
Pension Protection Fund levy (0.3) (0.5)
Net interest on pension obligations (3.9) (3.0)
Net finance charge (8.0) (8.0)
Included within the net finance charge is an unrealised gain of £6.6 million on the derivative current asset, offset by a £6.6 million revaluation
loss on the Euro denominated overdraft within the Group’s European cash pool arrangements, the net impact of which is £nil, and therefore
is not presented separately in the table above. There was no such gain or loss in the prior year. Further details of the Group’s treasury
management are included in note 18 to the Consolidated Financial Statements and described on page 41 of the Financial Review.
9. Income taxes relating to continuing operations
The tax (expense)/credit for the year is comprised of the following:
Current tax
(In £s million) 2016 2015
Current tax expense in respect of the current year (49.2) (49.6)
Adjustments recognised in the current year in relation to the current tax of prior years – (0.2)
(49.2) (49.8)
Hays plc | 2016 Annual Report and Financial Statements106
NOTES TO THE CONSOLIDATED FINANCIAL STATEMENTS
CONTINUED
Deferred tax
(In £s million) 2016 2015
Deferred tax (charge)/credit in respect of the current year (3.1) 0.2
Adjustments to deferred tax attributable to changes in tax rates and laws – (0.8)
Adjustments to deferred tax in relation to prior years 0.4 (0.3)
(2.7) (0.9)
Total income tax expense recognised in the current year relating to continuing operations (51.9) (50.7)
Current tax expense for the year comprised of the following:
(In £s million) 2016 2015
UK (6.5) (7.4)
Overseas (42.7) (42.2)
(49.2) (49.6)
The income tax expense for the year can be reconciled to the accounting profit as follows:
(In £s million) 2016 2015
Profit before tax from continuing operations 173.0 156.1
Income tax expense calculated at 20.00% (2015: 20.75%) (34.6) (32.4)
Net effect of items that are non-taxable/(non-deductible) in determining taxable profit (1.4) (3.7)
Effect of unused tax losses not recognised as deferred tax assets (1.5) –
Effect of tax losses not recognised as deferred tax utilised in the year 0.7 –
Effect of different tax rates of subsidiaries operating in other jurisdictions (14.6) (13.8)
Effect on deferred tax balances due to the changes in income tax rates – (0.8)
Effect of share-based payment charges and share options (0.9) 0.5
(52.3) (50.2)
Adjustments recognised in the current year in relation to the current tax of prior years – (0.2)
Adjustments to deferred tax in relation to prior years 0.4 (0.3)
Income tax expense recognised in the Consolidated Income Statement relating to continuing operations (51.9) (50.7)
Effective tax rate for the year on continuing operations 30.0% 32.5%
The tax rate used for the 2016 reconciliations above is the corporate tax rate of 20.00% (2015: 20.75%) payable by corporate entities in the
United Kingdom on taxable profits under tax law in that jurisdiction.
Income tax recognised directly in equity
(In £s million) 2016 2015
Current tax
Excess tax deductions relating to share-based payments 0.9 0.9
Deferred tax
Excess tax deductions relating to share-based payments (1.6) (0.1)
Total income tax recognised in equity (0.7) 0.8
Income tax recognised in other comprehensive income
(In £s million) 2016 2015
Current tax
Contributions in respect of defined benefit pension scheme 1.8 2.3
Deductions in respect of foreign exchange – 1.1
Deferred tax
Actuarial (gain)/loss in respect of defined benefit pension scheme (9.0) 2.9
Total income tax recognised in other comprehensive income (7.2) 6.3
Hays plc | 2016 Annual Report and Financial Statements107
OVERVIEW  STRATEGICREPORT  GOVERNANCE  FINANCIALSTATEMENTS  SHAREHOLDERINFORMATION
10. Discontinued operations
The results of the discontinued operations which have been included in the Consolidated Income Statement were as follows:
(In £s million) 2016 2015
Profit from discontinued operations 4.6 –
Profit before tax 4.6 –
Tax charge (1.2) 0.2
Profit from discontinued operations after tax 3.4 0.2
The profit of £3.4 million arose from the write-back of provisions which in light of subsequent events and expiry of warranty periods were no
longer required. In the prior year the profit of £0.2 million arose primarily from the write-back of tax provisions that were no longer required.
The provisions were established when the Group completed the disposal of its non-core activities between March 2003 and November 2004.
The cash outflows generated from discontinued operations were £0.6 million (2015: £0.3 million) and are recorded within net movements in
provisions on the Consolidated Cash Flow Statement.
There were no cash inflows generated from discontinued operations (2015: nil).
11. Dividends
The following dividends were paid by the Group and have been recognised as distributions to equity shareholders in the year:
2016
pence per
share
2016
£s million
2015
pence per
share
2015
£s million
Previous year final dividend 1.89 26.9 1.80 25.6
Current year interim dividend 0.91 13.0 0.87 12.3
39.9 37.9
The following dividends have been paid/proposed by the Group in respect of the accounting year presented:
2016
pence per
share
2016
£s million
2015
pence per
share
2015
£s million
Interim dividend (paid) 0.91 13.0 0.87 12.3
Final dividend (proposed) 1.99 28.7 1.89 27.0
2.90 41.7 2.76 39.3
The final dividend for 2016 of 1.99 pence per share (£28.7 million) will be proposed at the Annual General Meeting on 9 November 2016 and
has not been included as a liability as at 30 June 2016. If approved, the final dividend will be paid on 11 November 2016 to shareholders on
the register at the close of business on 14 October 2016.
Hays plc | 2016 Annual Report and Financial Statements108
NOTES TO THE CONSOLIDATED FINANCIAL STATEMENTS
CONTINUED
12. Earnings per share
For the year ended 30 June 2016
Earnings
(£s million)
Weighted
average
number of
shares
(million)
Per share
amount
(pence)
Continuing operations:
Basic earnings per share from continuing operations 121.1 1,428.4 8.48
Dilution effect of share options – 19.0 (0.11)
Diluted earnings per share from continuing operations 121.1 1,447.4 8.37
Discontinued operations:
Basic earnings per share from discontinued operations 3.4 1,428.4 0.24
Dilution effect of share options – 19.0 (0.01)
Diluted earnings per share from discontinued operations 3.4 1,447.4 0.23
Continuing and discontinued operations:
Basic earnings per share from continuing and discontinued operations 124.5 1,428.4 8.72
Dilution effect of share options – 19.0 (0.12)
Diluted earnings per share from continuing and discontinued operations 124.5 1,447.4 8.60
For the year ended 30 June 2015
Earnings
(£s million)
Weighted
average
number of
shares
(million)
Per share
amount
(pence)
Continuing operations:
Basic earnings per share from continuing operations 105.4 1,416.4 7.44
Dilution effect of share options – 24.5 (0.13)
Diluted earnings per share from continuing operations 105.4 1,440.9 7.31
Discontinued operations:
Basic earnings per share from discontinued operations 0.2 1,416.4 0.01
Dilution effect of share options – 24.5 –
Diluted earnings per share from discontinued operations 0.2 1,440.9 0.01
Continuing and discontinued operations:
Basic earnings per share from continuing and discontinued operations 105.6 1,416.4 7.46
Dilution effect of share options – 24.5 (0.13)
Diluted earnings per share from continuing and discontinued operations 105.6 1,440.9 7.33
The weighted average number of shares in issue for both years exclude shares held in treasury.
Hays plc | 2016 Annual Report and Financial Statements109
OVERVIEW  STRATEGICREPORT  GOVERNANCE  FINANCIALSTATEMENTS  SHAREHOLDERINFORMATION
13. Goodwill
(In £s million) 2016 2015
Cost
At 1 July 198.4 170.6
Exchange adjustments 22.0 (8.1)
Additions during the year – 35.9
At 30 June 220.4 198.4
Goodwill arising on business combinations is reviewed and tested on an annual basis or more frequently if there is indication that goodwill
might be impaired. Goodwill has been tested for impairment by comparing the carrying amount of each cash-generating unit (CGU), including
goodwill, with the recoverable amount. The recoverable amounts of the CGUs are determined from value-in-use calculations.
The key assumptions for the value-in-use calculations are as follows:
Assumption How determined
Operating profit The operating profit is based on the latest one-year forecasts for the CGUs approved by the Group’s Management
Board which are compiled using expectations of fee growth, consultant productivity and operating costs. The Group
prepares cash flow forecasts derived from the most recent financial forecasts approved by management and
extrapolates cash flows in perpetuity based on the long-term growth rates and expected cash conversion rates.
Discount rates The pre-tax rates used to discount the forecast cash flows range between 9.3% and 16.7% (2015: 9.0% and 13.3%)
reflecting current market assessments of the time value of money and the country risks specific to the relevant CGUs.
The discount rate applied to the cash flows of each of the Group’s operations is generally based on the weighted
average cost of capital (WACC), taking into account adjustments to the risk-free rate for 10-year bonds issued by the
government in the respective market. Where government bond rates contain a material component of credit risk,
high-quality local corporate bond rates may be used.
These rates are adjusted for a risk premium to reflect the increased risk of investing in equities and, where appropriate,
the systematic risk of the specific Group operating company. In making this adjustment, inputs required are the equity
market risk premium (that is the increased return required over and above a risk-free rate by an investor who is investing
in the market as a whole) and the risk adjustment, beta, applied to reflect the risk of the specific Group operating
company relative to the market as a whole.
Growth rates The medium-term growth rates are based on management forecasts. These are consistent with a minimum average
estimated growth rate of 5.0% (2015: 5.0%), with the exception of the United Kingdom where an average of 2.0% has
been applied for years two to five. The growth estimates reflect a combination of both past experience and the
macroeconomic environment, including GDP expectations driving fee growth.
The long-term growth rates are based on management forecasts, which are consistent with external sources of an
average estimated growth rate of 2.0% (2015: 2.0%), reflecting a combination of GDP expectations and long-term
wage inflation driving fee growth.
GDP growth is a key driver of our business, and is therefore a key consideration in developing long-term forecasts.
Wage inflation is also an important driver of net fees as net fees are derived directly from the salary level of
candidates placed into employment. Based on past experience a combination of these two factors is considered to be
an appropriate basis for assessing long-term growth rates.
Management has determined that there has been no impairment to any of the CGUs and in respect of these a sensitivity analysis has been
performed in assessing recoverable amounts of goodwill. This has been based on changes in key assumptions considered to be possible by
management. This included a change in the discount rate of up to 1% and changes in the long-term growth rate from Year 2 onwards between
0% and 2% in absolute terms.
The sensitivity analysis shows no impairment would arise under each scenario for any of the CGUs.
The Veredus business, which is part of the Continental Europe  Rest of World segment, was acquired in December 2014 and continues to
perform well. As a result the Group has made significant investments in the business to accelerate its growth in line with the Group’s strategy
to build a strong presence in the USA, and maximise the long-term growth opportunities available in the market. As a consequence of
this investment, the headroom on goodwill has decreased from the prior year. Headroom based on the assumptions used in the goodwill
calculation is £3.4 million arising on goodwill of £40.5 million. The key assumption in determining the value-in-use calculation is the discount
rate used, which is 13%. An increase in the discount rate to 14% would result in no headroom.
Hays plc | 2016 Annual Report and Financial Statements110
NOTES TO THE CONSOLIDATED FINANCIAL STATEMENTS
CONTINUED
Goodwill acquired in a business combination is considered its own CGU or allocated to the groups of CGUs that are expected to benefit from
that business combination. Individual CGUs are either country or brand specific. For the purpose of disclosure individual CGUs have been
aggregated and disclosed in accordance with segmental reporting. The carrying amount of goodwill has been allocated as follows:
(In £s million) 2016 2015
Asia Pacific 25.8 19.1
Continental Europe  Rest of World 101.5 86.2
United Kingdom  Ireland 93.1 93.1
220.4 198.4
14. Other intangible assets
(In £s million) 2016 2015
Cost
At 1 July 93.2 91.2
Exchange adjustments 3.9 (1.1)
Acquired – 3.0
Additions 4.7 4.3
Disposals – (4.2)
At 30 June 101.8 93.2
Amortisation
At 1 July 63.4 54.7
Exchange adjustments 2.6 (0.8)
Charge for the year 14.2 13.7
Disposals – (4.2)
At 30 June 80.2 63.4
Net book value
At 30 June 21.6 29.8
At 1 July 29.8 36.5
All other intangible assets relate mainly to computer software additions, and of the additions in the current year, £3.5 million relate to
internally generated assets (2015: £3.1 million).
The estimated average useful life of the computer software related intangible assets is seven years (2015: seven years). Software incorporated
into major Enterprise Resource Planning (ERP) implementations is amortised on a straight-line basis over a life of up to seven years. Other
software is amortised on a straight-line basis between three and five years.
In the prior year following the acquisition of Veredus Corp. an intangible asset of £3.0 million has been recognised in respect of the Veredus
brand. This is amortised on a straight-line basis over three years from the date of acquisition.
There were no capital commitments at the year end, as was the case in the prior year.
Hays plc | 2016 Annual Report and Financial Statements111
OVERVIEW  STRATEGICREPORT  GOVERNANCE  FINANCIALSTATEMENTS  SHAREHOLDERINFORMATION
15. Property, plant and equipment
(In £s million)
Freehold
properties
Leasehold
properties
(short)
Plant and
machinery
Fixtures and
fittings Total
Cost
At 1 July 2015 0.6 12.4 29.1 22.6 64.7
Exchange adjustments 0.1 2.1 2.6 2.1 6.9
Capital expenditure – 2.0 3.8 4.5 10.3
Disposals – (0.8) (2.0) (0.1) (2.9)
At 30 June 2016 0.7 15.7 33.5 29.1 79.0
Accumulated depreciation
At 1 July 2015 0.4 9.2 22.2 17.3 49.1
Exchange adjustments 0.1 1.5 2.0 1.7 5.3
Charge for the year – 1.2 3.9 2.6 7.7
Disposals – (0.8) (2.0) (0.1) (2.9)
At 30 June 2016 0.5 11.1 26.1 21.5 59.2
Net book value
At 30 June 2016 0.2 4.6 7.4 7.6 19.8
At 1 July 2015 0.2 3.2 6.9 5.3 15.6
There were no capital commitments at the year end (2015: £nil).
(In £s million)
Freehold
properties
Leasehold
properties
(short)
Plant and
machinery
Fixtures and
fittings Total
Cost
At 1 July 2014 1.8 12.1 26.1 28.0 68.0
Exchange adjustments (0.1) (1.2) (1.8) (1.5) (4.6)
Capital expenditure – 1.7 4.4 1.7 7.8
Acquired – – – 0.2 0.2
Reclassification (1.1) 1.6 1.1 (1.6) –
Disposals – (1.8) (0.7) (4.2) (6.7)
At 30 June 2015 0.6 12.4 29.1 22.6 64.7
Accumulated depreciation
At 1 July 2014 1.1 9.5 18.2 21.6 50.4
Exchange adjustments (0.2) (0.9) (1.3) (1.2) (3.6)
Charge for the year – 1.3 5.1 2.3 8.7
Acquired – – – 0.1 0.1
Reclassification (0.5) 1.0 0.9 (1.4) –
Disposals – (1.7) (0.7) (4.1) (6.5)
At 30 June 2015 0.4 9.2 22.2 17.3 49.1
Net book value
At 30 June 2015 0.2 3.2 6.9 5.3 15.6
At 1 July 2014 0.7 2.6 7.9 6.4 17.6
Hays plc | 2016 Annual Report and Financial Statements112
NOTES TO THE CONSOLIDATED FINANCIAL STATEMENTS
CONTINUED
16. Deferred tax
Deferred tax assets in relation to:
(In £s million)
1 July
2015
(Charge)/
credit to
Consolidated
Income
Statement
(Charge)/
credit to
other
comprehensive
income
(Charge)/
credit to
equity
Exchange
difference
30 June
2016
Accelerated tax depreciation 14.7 (1.1) – – 0.2 13.8
Acquired tangibles and intangibles (1.2) (0.9) – – (0.3) (2.4)
Retirement benefit obligation 11.7 – (9.0) – – 2.7
Share-based payments 4.5 (0.7) – (1.6) – 2.2
Provisions 2.1 0.5 – – 0.3 2.9
Tax losses 1.2 (1.0) – – 0.1 0.3
Other short-term timing differences 3.4 0.5 – – 0.5 4.4
36.4 (2.7) (9.0) (1.6) 0.8 23.9
(In £s million)
1 July
2014
(Charge)/
credit to
Consolidated
Income
Statement
(Charge)/
credit to
other
comprehensive
income
(Charge)/
credit to
equity
Exchange
difference
30 June
2015
Accelerated tax depreciation 16.8 (2.1) – – – 14.7
Acquired tangibles and intangibles – (1.2) – – – (1.2)
Retirement benefit obligation 8.8 – 2.9 – – 11.7
Share-based payments 4.1 0.5 – (0.1) – 4.5
Provisions 2.2 0.2 – – (0.3) 2.1
Tax losses – 1.2 – – – 1.2
Other short-term timing differences 3.2 0.5 – – (0.3) 3.4
35.1 (0.9) 2.9 (0.1) (0.6) 36.4
The UK deferred tax asset of £18.2 million (2015: £30.4 million) is recognised on the basis of the UK business performance in the year and the
forecast approved by management. Other deferred tax assets of £5.7 million (2015: £6.0 million) arise in the other jurisdictions (primarily
Australia) in which the Group operate.
Deferred tax assets and liabilities are measured at the tax rates that are expected to apply in the periods in which they reverse. The date
enacted or substantively enacted for the relevant periods of reversal are: 19% from 1 April 2017 and 18% from 1 April 2020 in the UK (2015: 19%)
and 30% in Australia.
In March 2016, the United Kingdom Government announced a reduction in the main rate of UK corporation tax to 17% with effect from 1 April
2020. The reduction to 17% has not been substantively enacted and has therefore not been reflected in the figures above. The impact of the
future rate reduction will be accounted for to the extent that it is enacted at future balance sheet dates; however it is estimated that this will
not have a material impact on the Group.
Unrecognised deductible temporary differences, unused tax losses and unused tax credits
Deductible temporary differences, unused tax losses and unused tax credits for which no deferred tax assets have been recognised are
attributable to the following:
(In £s million)
Gross
2016
Tax
2016
Gross
2015
Tax
2015
Tax losses (revenue in nature) 150.7 37.8 155.4 40.1
Tax losses (capital in nature) 20.0 3.9 20.0 4.4
170.7 41.7 175.4 44.5
In tax losses (revenue in nature) £0.1 million is due to expire in 2017, £2.2 million in 2023, £1.5 million in 2027, £5.0 million in 2033 and
£8.5 million in 2036.
Hays plc | 2016 Annual Report and Financial Statements113
OVERVIEW  STRATEGICREPORT  GOVERNANCE  FINANCIALSTATEMENTS  SHAREHOLDERINFORMATION
16. Deferred tax continued
Unrecognised taxable temporary differences associated with investments and interests
(In £s million) 2016 2015
Taxable temporary differences in relation to investments in subsidiaries, for which deferred tax liabilities have
not been recognised are attributable to the following:
Foreign subsidiaries 4.9 3.8
Tax thereon 0.3 0.2
17. Trade and other receivables
(In £s million) 2016 2015
Trade receivables 503.2 385.2
Less provision for impairment (16.3) (15.5)
Net trade receivables 486.9 369.7
Prepayments and accrued income 277.0 230.8
763.9 600.5
The directors consider that the carrying amount of trade receivables approximates to their fair value. The average credit period taken is
37 days (2015: 35 days).
The ageing analysis of the trade receivables not impaired is as follows:
(In £s million) 2016 2015
Not yet due 435.5 297.4
Up to one month past due 41.7 55.7
One to three months past due 9.7 16.6
486.9 369.7
The Group’s exposure to foreign currency translation is primarily in respect of the Euro and the Australian Dollar. The sensitivity of a 1 cent
change in the year end closing exchange rates in respect of the Euro and Australian Dollar would result in a £1.7 million and £0.3 million
movement in trade receivables respectively.
The movement on the provision for impairment of trade receivables is as follows:
(In £s million) 2016 2015
At 1 July 15.5 16.0
Exchange movement 1.3 (0.8)
Charge for the year 3.0 2.5
Uncollectable amounts written off (3.5) (2.2)
At 30 June 16.3 15.5
The ageing of impaired trade receivables relates primarily to trade receivables over three months past due.
Credit risk
The Group’s credit risk is primarily attributable to its trade receivables. The amounts presented in the Consolidated Balance Sheet are net of
allowances for doubtful receivables. An allowance for impairment is made where there is an identified loss event which, based on previous
experience, is evidence of a likely reduction in the recoverability of the cash flows. The Group reduces risk through its credit control process
and by contractual arrangements with other recruitment agencies in situations where the Group invoices on their behalf. The Group’s
exposure is spread over a large number of customers.
The risk disclosures contained on pages 42 to 45 within the Strategic Report form part of these financial statements.
Hays plc | 2016 Annual Report and Financial Statements114
NOTES TO THE CONSOLIDATED FINANCIAL STATEMENTS
CONTINUED
18. Cash and cash equivalents
(In £s million) 2016 2015
Cash at bank and in hand 62.9 69.8
The effective interest rate on short-term deposits was 1.0% (2015: 1.3%). The average maturity of short-term deposits was one day
(2015: one day).
Capital management
The Board’s priorities for free cash flow are to fund the Group’s investment and development, maintain a strong balance sheet and deliver
a sustainable dividend at a level that is affordable and appropriate. The Board targets a dividend cover range of 2.0x to 3.0x, and remains
committed to paying a sustainable and progressive dividend. Further details can be found in the Financial Review on page 41.
The capital structure of the Group consists of net cash/(debt), which is represented by cash and cash equivalents, bank loans and overdrafts
(note 20) and equity attributable to equity holders of the parent, comprising issued share capital, reserves and retained earnings as disclosed
in notes 24 to 29.
The Group is not restricted to any externally imposed capital requirements.
Risk management
A description of the Group’s treasury policy and controls is included in the Financial Review on page 41.
Cash management and foreign exchange risk
The Group’s cash management policy is to minimise interest payments by closely managing Group cash balances and external borrowings.
Euro-denominated cash positions are managed centrally using a cash pooling facility which provides visibility over participating country bank
balances on a daily basis. Any Group surplus balance is used to repay any maturing loans under the Group’s revolving credit facility or invested
in overnight money market funds. As the Group holds a sterling denominated debt facility and generates significant foreign currency cash
flows, the Board considers it appropriate in certain cases to use derivative financial instruments as part of its day-to-day cash management
to reduce the Group’s exposure to foreign exchange risk.
The Group’s operating profit exposure to foreign currency translation is primarily in respect of the Euro and the Australian Dollar. The
sensitivity of a 1 cent change in the average exchange rates for the year in respect of the Euro and Australian Dollar would result in a
£0.7 million and £0.2 million change in operating profit respectively.
The Group does not use derivatives to hedge balance sheet and income statement translation exposure.
Interest rate risk
The Group is exposed to interest rate risk on floating rate bank loans and overdrafts. It is the Group’s policy to limit its exposure to fluctuating
interest rates by selectively hedging interest rate risk using derivative financial instruments. Cash and cash equivalents carry interest at
floating rates based on local money market rates.
Counterparty credit risk
Counterparty credit risk arises primarily from the investment of surplus funds. Risks are closely monitored using credit ratings assigned to
financial institutions by international credit rating agencies. The Group restricts transactions to banks and money market funds that have
an acceptable credit profile and limits its exposure to each institution accordingly.
19. Derivative financial instruments
(In £s million) 2016 2015
Derivative asset 6.6 –
Derivative liability – –
Net derivative asset 6.6 –
As set out in note 18 and in the Treasury management section of the Financial Review on page 41, in certain cases the Group uses derivative
financial instruments to manage its foreign exchange exposures as part of its day-to-day cash management.
As at 30 June 2016, the Group had entered into eight forward exchange contract arrangements with counterparty banks (2015: eight forward
contracts). The fair market value of the contracts as at 30 June 2016 gave rise to an unrealised gain resulting in the presentation of a net
derivative asset of £6.6 million (2015: £nil) in the Consolidated Balance Sheet.
Some of the derivative assets and liabilities meet the offsetting criteria of IAS 32 paragraph 42. Consequently, the qualifying gross derivative
liabilities are set off against the qualifying gross derivative assets. The derivative liabilities not qualifying for offset is less than the rounding
factor presented in the financial statements and thus presented as £nil (2015: £nil).
Hays plc | 2016 Annual Report and Financial Statements115
OVERVIEW  STRATEGICREPORT  GOVERNANCE  FINANCIALSTATEMENTS  SHAREHOLDERINFORMATION
19. Derivative financial instruments continued
The Group does not use derivatives for speculative purposes and all transactions are undertaken to manage the risks arising from underlying
business activities. These instruments are classified as Level 2 in the IFRS 7 fair value hierarchy.
In the prior year the Group held two interest rate swaps which have subsequently matured in the current year.
Categories of financial assets and liabilities held by the Group are as shown below:
(In £s million) 2016 2015
Financial assets
Net trade receivables 486.9 369.7
Cash and cash equivalents 62.9 69.8
Derivative financial instruments 6.6 –
556.4 439.5
Financial liabilities
Trade creditors 170.0 116.6
Bank loans and overdrafts 26.1 100.5
196.1 217.1
20. Bank loans and overdrafts
(In £s million) 2016 2015
Bank loans 25.0 100.0
Overdrafts 1.1 0.5
26.1 100.5
Risk management
A description of the Group’s treasury policy and controls is included in the Financial Review on page 41.
Committed facilities
The Group has a £210 million unsecured revolving credit facility which expires in April 2020. The financial covenants require the Group’s
interest cover ratio to be at least 4:1 and its leverage ratio (net debt to EBITDA) to be no greater than 2.5:1. The interest rate of the facility
is based on a ratchet mechanism with a margin payable over LIBOR in the range of 0.90% to 1.55%.
At 30 June 2016, £185 million of the committed facility was un-drawn.
Maturities of bank loans and overdrafts
The maturity of borrowings are as follows:
(In £s million) 2016 2015
Within one year 1.1 0.5
More than one year 25.0 100.0
26.1 100.5
Fair values of financial assets and bank loans and overdrafts
The fair value of financial assets and bank loans and overdrafts is not materially different to their book value due to the short-term maturity
of the instruments, which are based on floating rates.
The interest rate profile of bank loans and overdrafts is as follows:
(In £s million) 2016 2015
Floating rate – sterling 26.1 100.5
The floating rate liabilities comprise bank loans and unsecured overdrafts bearing interest at rates based on local market rates.
Hays plc | 2016 Annual Report and Financial Statements116
NOTES TO THE CONSOLIDATED FINANCIAL STATEMENTS
CONTINUED
Interest rates
The weighted average interest rates paid were as follows:
2016 2015
Bank borrowings 2.3% 2.5%
For each 10 basis point fall or rise in the average LIBOR rate in the year there would be a reduction or increase in profit before tax by
approximately £0.1 million.
21. Trade and other payables
(In £s million) 2016 2015
Current
Trade creditors 170.0 116.6
Other tax and social security 65.1 66.2
Other creditors 25.5 34.3
Accruals 312.7 261.6
573.3 478.7
The directors consider that the carrying amount of trade payables approximates to their fair value. The average credit period taken for trade
purchases is 29 days (2015: 30 days).
22. Retirement benefit obligations
The Group operates a number of retirement benefit schemes in the UK and in other countries. The Group’s principal schemes are within the
UK where the Group operates one defined contribution scheme and two defined benefit schemes. The majority of overseas arrangements are
either defined contribution or government-sponsored schemes and these arrangements are not material in the context of the Group results.
UK Defined Contribution Scheme
The Group’s principal defined contribution retirement benefit scheme is the Hays Group Personal Pension Plan which is operated for
all qualifying employees and is funded via an employee salary sacrifice arrangement, and for qualifying employees additional employer
contributions. Employer contributions are in the range of 2% to 12% of pensionable salary depending on the level of employee contribution
and seniority.
The total cost charged to the Consolidated Income Statement of £6.2 million (2015: £6.2 million) represents employer’s contributions payable
to the money purchase arrangements. There were no contributions outstanding at the end of the year (2015: £0.5 million). The assets of the
money purchase arrangements are held separately from those of the Group.
UK Defined Benefit Schemes
The Group’s principal defined benefit schemes are the Hays Pension Scheme and the Hays Supplementary Scheme both in the UK. The Hays
Pension Scheme is a funded final salary defined benefit scheme providing pensions and death benefits to members. The Hays Supplementary
Scheme is an unfunded unapproved retirement benefit scheme for employees who were subject to HMRC’s earnings cap on pensionable
salary. The Schemes were closed to future accrual from 30 June 2012 with pensions calculated up until the point of closure. The Schemes
are governed by a trustee board, which is independent of the Group and is subject to full actuarial valuation on a triennial basis.
The last formal actuarial valuation of the Hays Pension Scheme was performed at 30 June 2015 and quantified the deficit at c.£95 million. A
revised deficit funding schedule was agreed with effect from 1 July 2015 which maintained the annual contribution at its previous level, subject
to a 3% per annum fixed uplift over a period of just under 10 years. During the year ended 30 June 2016, the Group made a contribution of
£14.0 million to the Hays Pension Scheme (2015: £13.5 million) in accordance with the agreed deficit funding schedule. The cash contributions
during the year mainly related to deficit funding payments.
Settlement arising from transfer exercise
During the year a transfer exercise was undertaken. A number of members included in this exercise elected to transfer out of the scheme to
access the new flexible retirement options now available. This resulted in £21.1 million being paid out of scheme assets to members in the form
of individual transfer values and equated to a reduction in the associated IAS 19 liabilities of £19.5 million. As the transfer eliminated all further
legal and constructive obligations for all of the benefits under the scheme to these individuals, the resulting £1.6 million net settlement charge
has been recognised in the Consolidated Income Statement and is recorded within staff costs.
The defined benefit schemes expose the Group to actuarial risks, such as longevity risk, inflation risk, interest rate risk and market
(investment) risk. The Group is not exposed to any unusual, entity-specific or scheme-specific risks.
Hays plc | 2016 Annual Report and Financial Statements117
OVERVIEW  STRATEGICREPORT  GOVERNANCE  FINANCIALSTATEMENTS  SHAREHOLDERINFORMATION
22. Retirement benefit obligations continued
The net amount included in the Consolidated Balance Sheet arising from the Group’s obligations in respect of its defined benefit pension
schemes is as follows:
(In £s million) 2016 2015
Present value of defined benefit obligations (726.3) (685.3)
Less fair value of defined benefit scheme assets:
Equities 132.3 131.8
Bonds and gilts 293.3 277.2
Absolute return funds 36.6 37.2
Cash and LDI funds 227.1 159.1
Real estate 22.7 21.3
712.0 626.6
Net liability arising from defined benefit obligation (14.3) (58.7)
Virtually all scheme assets have quoted prices in active markets. Real estate can be classified as Level 3 instruments. The £132.3 million
scheme assets held in equities comprise: UK Equities £32.9 million; Global Equities £70.5 million; and £28.9 million Emerging Market Equities.
To reduce volatility risk a liability driven investment (LDI) strategy forms part of the Trustee’s management of the defined benefit schemes’
assets, including government bonds, corporate bonds and derivatives. The government bonds asset category in the table above includes
gross assets of £965.5 million and associated repurchase agreements of £740.8 million. Repurchase agreements are entered into with
counterparties to better offset the schemes’ exposure to interest and inflation rates, whilst remaining invested in assets of a similar risk profile.
Interest rate and inflation rate derivatives are also used to complement the use of fixed and index-linked bonds in matching the profile of the
schemes’ liabilities.
The change in the present value of defined benefit obligations was:
(In £s million) 2016 2015
Change in benefit obligation
Opening defined benefit obligation at 1 July (685.3) (612.3)
Administration costs (1.9) (1.3)
Effect of settlement 19.5 –
Interest on defined benefit scheme liabilities (25.7) (26.6)
Net remeasurement gains – change in experience assumptions 28.9 11.2
Net remeasurement gains – change in demographic assumptions 14.7 –
Net remeasurement losses – change in financial assumptions (99.2) (74.5)
Benefits and expenses paid 22.7 18.2
Closing defined benefit obligation at 30 June (726.3) (685.3)
Analysis of defined benefit obligation
Plans that are wholly or partly funded (714.7) (675.6)
Plans that are wholly unfunded (11.6) (9.7)
Total (726.3) (685.3)
The defined benefit schemes’ liabilities comprise 68% (2015: 72%) in respect of deferred scheme participants and 32% (2015: 28%) in respect
of retirees.
The weighted average duration of the UK defined benefit scheme liabilities at the end of the reporting period is 22.0 years (2015: 23.0 years).
Hays plc | 2016 Annual Report and Financial Statements118
NOTES TO THE CONSOLIDATED FINANCIAL STATEMENTS
CONTINUED
The change in the fair value of defined benefit schemes’ assets was:
(In £s million) 2016 2015
Change in the fair value of scheme assets 
Fair value of plan assets at 1 July 626.6 568.4
Effect of settlement (21.1) –
Interest income on defined benefit scheme assets 23.7 24.9
Return on scheme assets 91.1 37.5
Employer contributions (towards funded and unfunded schemes) 14.4 14.0
Benefits and expenses paid (22.7) (18.2)
Fair value of plan assets at 30 June 712.0 626.6
During the year the Company made deficit funding contributions of £14.0 million (2015: £13.5 million) into the funded Hays Pension Scheme,
and made pension payments amounting to £0.4 million (2015: £0.5 million) in respect of the unfunded Hays Supplementary Scheme. The
amount of deficit funding contributions expected to be paid into the funded Hays Pension Scheme in the year to 30 June 2017 is £14.4 million.
Following the closure of the Schemes in 2012 future service contributions are no longer payable.
The net expense recognised in the Consolidated Income Statement comprised:
(In £s million) 2016 2015
Net interest expense (2.0) (1.7)
Administration costs (1.9) (1.3)
Effect of settlement (1.6) –
Net expense recognised in the Consolidated Income Statement (5.5) (3.0)
The net interest expense and administration costs in the current year and prior year were recognised within finance costs.
The amounts recognised in the Consolidated Statement of Comprehensive Income are as follows:
(In £s million) 2016 2015
The return on plan assets (excluding amounts included in net interest expense) 91.1 37.5
Actuarial remeasurement:
Net remeasurement gains – change in experience assumptions 28.9 11.2
Net remeasurement gains – change in demographic assumptions 14.7 –
Net remeasurement losses – change in financial assumptions (99.2) (74.5)
Remeasurement of the net defined benefit liability 35.5 (25.8)
A roll forward of the actuarial valuation of the Hays Pension Scheme to 30 June 2016 and a valuation of the Hays Supplementary Pension
Scheme have been performed by an independent actuary, who is an employee of Hymans Robertson LLP.
The key assumptions used at 30 June 2016 are listed below.
2016 2015
Discount rate 2.8% 3.8%
RPI inflation 2.8% 3.3%
CPI inflation 1.8% 2.3%
Rate of increase of pensions in payment 2.8% 3.2%
Rate of increase of pensions in deferment 1.8% 2.3%
The discount rate has been constructed to reference the Hymans Robertson AA corporate bond curve (which fits a curve to iBoxx AA
corporate data). The corporate bond yield curve has been used to discount the Scheme cash flows using the rates available at each future
duration and this had been converted into a single flat rate assumption to give equivalent liabilities to the Scheme’s cash flows. The duration
of the Scheme’s liabilities using this approach is circa 22 years.
The RPI inflation assumption has been set as gilt market implied RPI appropriate to the duration of the liabilities (circa 22 years) less a
0.2% p.a. inflation risk premium. The CPI inflation assumption has been determined as 1% p.a. below the RPI assumption. This approach for
both RPI and CPI assumptions is consistent with last year.
Hays plc | 2016 Annual Report and Financial Statements119
OVERVIEW  STRATEGICREPORT  GOVERNANCE  FINANCIALSTATEMENTS  SHAREHOLDERINFORMATION
22. Retirement benefit obligations continued
The life expectancy assumptions have been calculated using Club Vita base tables and future improvements in line with the CMI 2013 model
with a long-term improvement rate of 1.5% per annum and ‘non peaked’ short-term future improvements. On this basis a 65-year-old current
pensioner has a life expectancy of 24.3 years and 24.8 years for males and females respectively.
A sensitivity analysis on the principal assumptions used to measure the Scheme’s liabilities at the year end is:
Change in
assumption
Impact on
Schemes
Discount rate 0.5% £88m
RPI inflation 0.5% £55m
Assumed life expectancy at age 60 (rate of mortality) +1 year £29m
The sensitivity analysis presented above may not be representative of the actual change in the defined benefit obligation as it is unlikely
that the change in assumptions would occur in isolation to one another as some of the assumptions may be correlated.
In presenting the above sensitivity analysis the present value of the defined benefit obligation has been calculated using the projected unit
credit method at the end of the reporting period, which is the same as that applied in calculating the defined benefit obligation liability
recognised in the Consolidated Balance Sheet.
23. Provisions
(In £s million) Discontinued Continuing Total
At 1 July 2015 12.1 2.8 14.9
Exchange adjustments – 0.2 0.2
(Credited)/charged to income statement (4.6) (0.6) (5.2)
Utilised (0.6) – (0.6)
At 30 June 2016 6.9 2.4 9.3
(In £s million) 2016 2015
Current 3.1 3.0
Non-current 6.2 11.9
9.3 14.9
Discontinued provisions comprise potential exposures arising as a result of the business disposals that were completed in 2004, together
with deferred employee benefits relating to former employees. During the year a number of property leases and warranty periods
associated with those business disposals expired resulting in a release of £4.6 million to the income statement and is included in profit
from discontinued operations.
Of the total provisions of £9.3 million, £0.1 million relates to property exposures, a further £1.3 million to deferred employee benefit
obligations, and the remaining £7.9 million relates mainly to potential warranty claim liabilities arising from the business disposals which took
place in 2004. Of the provisions that remain, £3.1 million is expected to be paid in the next 12 months and it is not possible to estimate the
timing of the payments for the other items.
Hays plc | 2016 Annual Report and Financial Statements120
NOTES TO THE CONSOLIDATED FINANCIAL STATEMENTS
CONTINUED
24. Called up share capital
Called up, allotted and fully paid Ordinary shares of 1 pence each
Share capital
number
(thousand)
Share
capital
£s million
At 1 July 2015 and 30 June 2016 1,464,097 14.7
In accordance with the Companies Act 2006, the Company no longer has an authorised share capital.
The Company is allowed to hold 10% of issued share capital in treasury.
As at 30 June 2016, the Company held 31.2 million (2015: 43.1 million) Hays plc shares in treasury.
25. Share premium account
(In £s million) 2016 2015
At 30 June 369.6 369.6
26. Capital redemption reserve
(In £s million) 2016 2015
At 30 June 2.7 2.7
27. Retained earnings
(In £s million) 2016 2015
At 1 July (138.2) (197.7)
Remeasurement of defined benefit pension schemes 35.5 (25.8)
Tax on items taken directly to reserves (7.9) 7.1
Profit for the year 124.5 105.6
Dividends paid (39.9) (37.9)
Share-based payments 10.2 10.5
At 30 June (15.8) (138.2)
28. Cumulative translation reserve
(In £s million) 2016 2015
At 1 July 2.1 33.4
Currency translation adjustments 64.3 (31.3)
At 30 June 66.4 2.1
29. Equity reserve
(In £s million) 2016 2015
At 1 July 18.7 18.3
Share-based payments 1.5 0.4
At 30 June 20.2 18.7
The equity reserve is generated as a result of IFRS 2 ‘Share-based payments’.
Hays plc | 2016 Annual Report and Financial Statements121
OVERVIEW  STRATEGICREPORT  GOVERNANCE  FINANCIALSTATEMENTS  SHAREHOLDERINFORMATION
30. Share-based payments
During the year, £11.9 million (2015: £10.8 million) was charged to the Consolidated Income Statement in relation to equity-settled share-based
payments.
Share options
At 30 June 2016 the following options had been granted and remained outstanding in respect of the Company’s Ordinary shares of 1 pence
each under the Company’s share option schemes:
Number of
shares
Nominal
value of
shares
£
Subscription
price
pence/share
Date
normally
exercisable
Hays UK Sharesave Scheme 347,894 3,479 88 2016
720,336 7,203 131 2017
1,025,790 10,258 142 2018
2,529,308 25,293 107 2019
4,623,328 46,233
Hays International Sharesave Scheme 218,670 2,187 88 2016
332,802 3,328 131 2017
369,729 3,697 142 2018
826,241 8,262 107 2019
1,747,442 17,474
Total Sharesave options outstanding 6,370,770 63,707
The Hays International Sharesave Scheme is available to employees in Australia, New Zealand, Germany, the Republic of Ireland, Canada,
Hong Kong, Singapore and the United Arab Emirates.
Details of the share options outstanding during the year are as follows:
2016
Number of
share
options
(thousand)
2016
Weighted
average
exercise
price
(pence)
2015
Number of
share
options
(thousand)
2015
Weighted
average
exercise
price
(pence)
Sharesave
Outstanding at the beginning of the year 6,252 111 7,642 94
Granted during the year 3,457 107 1,896 142
Forfeited/cancelled during the year (1,545) 110 (882) 108
Exercised during the year (1,748) 85 (2,318) 81
Expired during the year (45) 91 (86) 106
Outstanding at the end of the year 6,371 117 6,252 111
Exercisable at the end of the year 567 88 993 78
On 31 March 2016, 3.5 million Sharesave options were granted. The aggregate of the estimated fair values of the options granted on that date
is £0.9 million. In the prior year, 1.9 million Sharesave options were granted. The aggregate of the estimated fair values of the options granted
in the prior year was £0.7 million.
The inputs into the valuation model (a binomial valuation model) are as follows:
Share price at grant 119 pence
Exercise price 107 pence
Expected volatility 27.2%
Expected life 3.33 years
Risk-free rate 0.50%
Expected dividends 2.30%
Expected volatility was determined by calculating the historical volatility of the Group’s share price over the previous three years.
Hays plc | 2016 Annual Report and Financial Statements122
NOTES TO THE CONSOLIDATED FINANCIAL STATEMENTS
CONTINUED
Performance Share Plan (PSP) and Deferred Annual Bonus (DAB)
The PSP is designed to link reward to the key long-term value drivers of the business and to align the interests of the executive directors and
approximately 320 of the global senior management population with the long-term interests of shareholders. PSP awards are discretionary
and vesting is dependent upon the achievement of performance conditions measured over either a three-year period or a one-year period
with a two-year holding period.
Only the executive directors and other members of the Management Board participate in the DAB which promotes a stronger link between
short-term and long-term performance through the deferral of annual bonuses into shares for a three-year period.
Further details of the schemes for the executive directors can be found in the directors’ Remuneration Report on pages 64 to 85.
Details of the share awards outstanding during the year are as follows:
2016
Number of
share
options
(thousand)
2016
Weighted
average
fair value
at grant
(pence)
2015
Number of
share
options
(thousand)
2015
Weighted
average
fair value
at grant
(pence)
Performance Share Plan
Outstanding at the beginning of the year 25,762 97 30,897 79
Granted during the year 6,755 153 8,446 116
Exercised during the year (8,729) 74 (10,361) 71
Lapsed during the year (1,100) 123 (3,220) 69
Outstanding at the end of the year 22,688 122 25,762 97
2016
Number of
share
options
(thousand)
2016
Weighted
average
fair value
at grant
(pence)
2015
Number of
share
options
(thousand)
2015
Weighted
average
fair value
at grant
(pence)
Deferred Annual Bonus
Outstanding at the beginning of the year 2,628 107 2,994 86
Granted during the year 747 162 918 133
Exercised during the year (712) 80 (1,284) 75
Outstanding at the end of the year 2,663 130 2,628 107
31. Related parties
Remuneration of key management personnel
The remuneration of the Management Board, who are key management personnel of the Group, is set out below in aggregate for each of the
categories specified in IAS 24 ‘Related Party Disclosures’ and represents the total compensation costs incurred by the Group in respect of
remuneration, not the benefit to the individuals. Further information about the remuneration of executive directors is provided in the directors’
Remuneration Report on pages 64 to 85.
(In £s million) 2016 2015
Short-term employee benefits 8.5 6.6
Post-employment benefits 0.1 0.1
Share-based payments 5.2 4.8
13.8 11.5
Information relating to pension fund arrangements is disclosed in note 22.
Hays plc | 2016 Annual Report and Financial Statements123
OVERVIEW  STRATEGICREPORT  GOVERNANCE  FINANCIALSTATEMENTS  SHAREHOLDERINFORMATION
32. Operating lease arrangements
The Group as lessee
(In £s million) 2016 2015
Lease payments under operating leases recognised as an expense for the year 34.0 30.8
At 30 June 2016, the Group had outstanding commitments for future minimum lease payments under non-cancellable operating leases which
fall due as follows:
(In £s million) 2016 2015
Within one year 39.4 30.0
Between two and five years 70.3 46.0
After five years 6.6 4.3
116.3 80.3
IFRS 16 ‘Leases’ will become effective in the Group’s financial year 2020 and will primarily change the lease accounting requirements for
lessees as currently disclosed above.
33. Movement in net cash/(debt)
(In £s million)
1 July
2015
Cash
flow
Exchange
movement
30 June
2016
Cash and cash equivalents 69.8 (28.1) 21.2 62.9
Bank loans and overdrafts (100.5) 74.4 – (26.1)
Net cash/(debt) (30.7) 46.3 21.2 36.8
The table above is presented as additional information to show movement in net cash/(debt), defined as cash and cash equivalents less bank
loans and overdrafts.
34. Acquisition liabilities
(In £s million) Total
At 1 July 2015 (8.6)
Exchange adjustments (1.7)
Interest unwind on acquisition liability (0.9)
At 30 June 2016 (11.2)
Acquisition liabilities relate to the deferred consideration payable following the acquisition of 80% of Veredus Corp., a pure play US IT staffing
company in December 2014. The business was acquired for a total cash consideration of £36.1 million and to reflect the substance of the
transaction using the principles of IFRS 10, the acquisition was accounted for as if 100% of the equity had been acquired.
The deferred consideration is subject to a put/call arrangement which provides Hays with an option to acquire the remaining 20% of the
equity from the shareholders. The option is first available for exercise in March 2018. A liability of £8.6 million was recognised in the prior year
representing management’s best estimate of the amount payable discounted to its present value. The unwind of the discount in the year
of £0.9 million is recognised as a finance cost in the income statement.
Full details can be found in the disclosures in note 32 to the 2015 financial statements.
35. Subsequent events
The final dividend for 2016 of 1.99 pence per share (£28.7 million) will be proposed at the Annual General Meeting on 9 November 2016 and
has not been included as a liability as at 30 June 2016. If approved, the final dividend will be paid on 11 November 2016 to shareholders on the
register at close of business on 14 October 2016.
Hays plc | 2016 Annual Report and Financial Statements124
NOTES TO THE CONSOLIDATED FINANCIAL STATEMENTS
CONTINUED
(In £s million) Note 2016 2015
Non-current assets
Property, plant and equipment 4 0.9 0.3
Investment in subsidiaries 5 910.4 910.4
Trade and other receivables 6 115.9 120.8
Deferred tax assets 7 3.0 12.1
1,030.2 1,043.6
Current assets
Trade and other receivables 8 11.5 10.2
Cash and bank balances 3.1 –
14.6 10.2
Total assets 1,044.8 1,053.8
Current liabilities
Trade and other payables 9 (352.8) (358.2)
Bank overdraft 10 – (22.5)
Net current liabilities (338.2) (370.5)
Total assets less current liabilities 692.0 673.1
Non-current liabilities
Retirement benefit obligations 11 (14.3) (58.7)
Provisions 12 (5.3) (7.8)
(19.6) (66.5)
Total liabilities (372.4) (424.7)
Net assets 672.4 629.1
Equity
Share capital 14.7 14.7
Share premium account 369.6 369.6
Capital redemption reserve 2.7 2.7
Retained earnings 265.2 223.4
Equity reserve 20.2 18.7
Equity attributable to owners of the Company 672.4 629.1
The financial statements of Hays plc, registered number 2150950, were approved by the Board of Directors and authorised for issue on
1 September 2016.
Signed on behalf of the Board of Directors
A R Cox		 P Venables
Hays plc | 2016 Annual Report and Financial Statements125
OVERVIEW  STRATEGICREPORT  GOVERNANCE  FINANCIALSTATEMENTS  SHAREHOLDERINFORMATION
COMPANY BALANCE SHEET
AT 30 JUNE
(In £s million)
Share
capital
Share
premium
account
Capital
redemption
reserve
Retained
earnings
Equity
reserve
Own
shares Total
At 1 July 2015 14.7 369.6 2.7 223.4 18.7 – 629.1
Remeasurement of defined benefit pension schemes – – – 35.5 – – 35.5
Tax relating to components of other comprehensive income – – – (7.2) – – (7.2)
Net expense recognised in other comprehensive income – – – 28.3 – – 28.3
Profit for the year – – – 43.3 – – 43.3
Total comprehensive income for the year – – – 71.6 – – 71.6
Dividends paid – – – (39.9) – – (39.9)
Share-based payments – – – 10.1 1.5 – 11.6
At 30 June 2016 14.7 369.6 2.7 265.2 20.2 – 672.4
(In £s million)
Share
capital
Share
premium
account
Capital
redemption
reserve
Retained
earnings
Equity
reserve
Own
shares Total
At 1 July 2014 14.7 369.6 2.7 224.4 18.3 (0.2) 629.5
Remeasurement of defined benefit pension schemes – – – (25.8) – – (25.8)
Tax relating to components of other comprehensive income – – – 4.3 – – 4.3
Net expense recognised in other comprehensive income – – – (21.5) – – (21.5)
Profit for the year – – – 47.0 – – 47.0
Total comprehensive income for the year – – – 25.5 – – 25.5
Dividends paid – – – (37.9) – – (37.9)
Share-based payments – – – 10.6 0.4 0.2 11.2
Tax on share-based payment transactions – – – 0.8 – – 0.8
At 30 June 2015 14.7 369.6 2.7 223.4 18.7 – 629.1
Hays plc | 2016 Annual Report and Financial Statements126
COMPANY STATEMENT OF CHANGES IN EQUITY
FOR THE YEAR ENDED 30 JUNE 2016
FOR THE YEAR ENDED 30 JUNE 2015
1. Accounting policies
a.	 Basis of accounting
The financial statements have been prepared under the historical cost convention, in accordance with Financial Reporting standard 101
(FRS101) ‘Reduced Disclosure Framework’ as issued by the Financial Reporting Council. The prior financial statements were prepared in
accordance with UK GAAP and have been restated for material adjustments on adoption of FRS 101 in the current year. The last financial
statements under a previous GAAP (UK GAAP) were for the year ended 30 June 2015 and the date of transition to FRS 101 was therefore
1 July 2014. There has been no movement in total equity due to the change in accounting framework from UK GAAP to FRS 101. Movements
in equity are detailed on page 126.
As permitted by Section 408 of the Companies Act 2006, the Company’s income statement has not been presented. The Company, as
permitted by FRS 101, has taken advantage of the disclosure exemptions available under that standard in relation to share-based payments,
financial instruments, certain disclosures regarding the Company’s capital, capital management, presentation of comparative information
in respect of certain assets, presentation of a cash flow statement, certain related party transactions and the effect of future accounting
standards not yet adopted. Where required, equivalent disclosures are provided in the Group financial statements of Hays plc.
The significant accounting policies and significant judgments and key estimates relevant to the Company are the same as those set out
in note 2 and note 3 to the Group financial statements.
2. Employee information
There are no staff employed by the Company (2015: none). Therefore no remuneration has been disclosed. Details of directors’ emoluments
and interests are included in the directors’ Remuneration Report on pages 64 to 85 of the Annual Report.
3. Profit for the year
Hays plc has not presented its own income statement and related notes as permitted by Section 408 of the Companies Act 2006.
The profit for the financial year in the Hays plc Company financial statements is £43.3 million (2015: profit £47.0 million).
4. Property, plant and equipment
(In £s million)
Plant and
machinery
Fixtures and
fittings Total
Cost
At 1 July 2015 1.2 1.2 2.4
Additions – 0.8 0.8
Disposals (0.4) – (0.4)
At 30 June 2016 0.8 2.0 2.8
Depreciation
At 1 July 2015 1.1 1.0 2.1
Charge for the year – 0.1 0.1
Disposals (0.3) – (0.3)
At 30 June 2016 0.8 1.1 1.9
Net book value
At 30 June 2016 – 0.9 0.9
At 1 July 2015 0.1 0.2 0.3
5. Investment in subsidiaries
(In £s million)
Shares in
subsidiary
undertakings
Cost
At 1 July 2015 and 30 June 2016 910.4
Provision for impairment
At 1 July 2015 and 30 June 2016 –
Total
At 30 June 2015 and 30 June 2016 910.4
The principal subsidiary undertakings of the Group are listed in note 13.
Hays plc | 2016 Annual Report and Financial Statements127
OVERVIEW  STRATEGICREPORT  GOVERNANCE  FINANCIALSTATEMENTS  SHAREHOLDERINFORMATION
NOTES TO THE COMPANY FINANCIAL STATEMENTS
6. Trade and other receivables: amounts falling due after more than one year
(In £s million) 2016 2015
Prepayments 1.5 1.7
Amounts owed by subsidiary undertakings 114.4 119.1
115.9 120.8
The Company charges interest on amounts owed by subsidiary undertakings at a rate of three-month LIBOR plus 1%.
7. Deferred tax
Deferred tax assets in relation to:
(In £s million) 2016 2015
Retirement benefit obligations 2.7 11.7
Other short-term timing differences 0.3 0.4
3.0 12.1
8. Trade and other receivables: amounts falling due within one year
(In £s million) 2016 2015
Corporation tax debtor 8.8 8.1
Prepayments 2.7 2.1
11.5 10.2
9. Trade and other payables
(In £s million) 2016 2015
Accruals 15.9 19.5
Amounts owed to subsidiary undertakings 336.9 316.2
352.8 335.7
Amounts owed to subsidiary undertakings are repayable on demand. The Company is charged interest on amounts owed to subsidiary
undertakings at a rate of three-month LIBOR less 1%.
10. Bank overdraft
Bank overdrafts are unsecured and repayable on demand. There was no overdraft repayable at the end of the year (2015: £22.5 million).
11. Retirement benefit obligations
(In £s million) 2016 2015
Defined benefit scheme deficit 14.3 58.7
The details of this UK scheme, for which Hays plc is the sponsoring employer, are set out in note 22 to the Group financial statements.
12. Provisions
(In £s million)
At 1 July 2015 7.8
Credited to the income statement (1.9)
Utilised during the year (0.6)
At 30 June 2016 5.3
Provisions comprise of potential exposures arising as a result of the business disposals relating to the Group transformation that concluded in
2004. During the year warranty claim liabilities relating to the discontinued operations expired resulting in a £1.9 million release to the income
statement. It is not possible to estimate the timing of payments against the remaining provisions.
Hays plc | 2016 Annual Report and Financial Statements128
NOTES TO THE COMPANY FINANCIAL STATEMENTS
CONTINUED
13. Subsidiaries
Country of registration
Accountancy Personnel Pty Limited Australia
Accountancy Placements (Australia) Pty Limited Australia
Ampoza Holdings Pty Limited Australia
Hays Construction Pty Limited Australia
Hays Property Pty Limited Australia
Hays Specialist Recruitment (Australia) Pty Limited Australia
Hays Superannuation Pty Limited Australia
Hays Österreich GmbH Personnel Services Austria
Hays NV Belgium
Hays Services NV Belgium
Hays Recruitment and Selection Ltda Brazil
Hays Specialist Recruitment (Canada) Inc. Canada
Hays Especialistas En Reclutamiento Limitada Chile
Hays Specialist Recruitment (Shanghai) Co. Limited* (90% owned) China
Hays Colombia SAS Colombia
Hays Czech Republic, s.r.o Czech Republic
Hays Specialist Recruitment (Denmark) A/S Denmark
Axis Resources Holdings Limited England  Wales
Axis Resources Limited England  Wales
EPS Pension Trustees Limited England  Wales
H101 Limited England  Wales
Hays Commercial Services Limited England  Wales
Hays Finance Technology Limited England  Wales
Hays Group Holdings Limited England  Wales
Hays Healthcare Limited England  Wales
Hays Holdings Limited England  Wales
Hays International Holdings Limited England  Wales
Hays Nominees Limited England  Wales
Hays Overseas Holdings Limited England  Wales
Hays Pension Trustee Limited England  Wales
Hays Personnel (Managed Solutions) Limited England  Wales
Hays Personnel Payroll Services Limited England  Wales
Hays Personnel Services Limited England  Wales
Hays Pharma Consulting Limited England  Wales
Hays Pharma Limited England  Wales
Hays Project Solutions Limited England  Wales
Hays Property Holdings Limited England  Wales
Hays Recruitment Services Limited England  Wales
Hays Social Care Limited England  Wales
Hays Specialist Recruitment (Holdings) Limited England  Wales
Hays Specialist Recruitment Limited England  Wales
Hays SRA Limited England  Wales
Hays Stakeholder Life Assurance Trustee Limited England  Wales
Hays ZMB Limited England  Wales
James Harvard International Group Limited England  Wales
Krooter Limited England  Wales
Myriad Computer Services Limited England  Wales
Oval (1620) Limited England  Wales
Owen, Thornhill and Harper Limited England  Wales
Paperstream Limited England  Wales
Hays plc | 2016 Annual Report and Financial Statements129
OVERVIEW  STRATEGICREPORT  GOVERNANCE  FINANCIALSTATEMENTS  SHAREHOLDERINFORMATION
Country of registration
Recruitment Solutions Group Limited (IOM) England  Wales
RSG EBT Limited England  Wales
Weyside 23 Limited England  Wales
Weyside Group Limited England  Wales
Weyside Office Services Limited England  Wales
Weyside Telecoms Limited England  Wales
Weyside Turngate Limited England  Wales
Hays BTP  Immobilier SASU France
Hays Clinical Research SASU France
Hays Consulting SASU France
Hays Executive SASU France
Hays Finance SASU France
Hays France SAS France
Hays Ile de France SASU France
Hays IT Services SASU France
Hays Medias SASU France
Hays Nord Est SASU France
Hays Ouest SASU France
Hays Pharma Consulting SASU France
Hays Pharma SASU France
Hays Pharma Services SASU France
Hays Sud Est SASU France
Hays Sud Ouest SASU France
Hays Talent Solutions SAS France
Hays Travail Temporaire SASU France
Hays AG Germany
Hays Talent Solutions GmbH Germany
Hays Holding GmbH Germany
Hays Technology Solutions GmbH Germany
Hays Temp GmbH Germany
Hays Hong Kong Limited Hong Kong
Hays Specialist Recruitment Hong Kong Limited Hong Kong
Hays Hungary Kft. Hungary
Hays Business Solutions Private Limited (Gurgaon) India
Hays Specialist Recruitment Private Limited India
Hays Business Services Ireland Limited Ireland
Hays Specialist Recruitment (Ireland) Limited Ireland
Hays Professional Services S.r.l Italy
Hays S.r.l Italy
Hays Resource Management Japan K.K. Japan
Hays Specialist Recruitment Japan K.K. Japan
Hays Finance (Jersey) Limited Jersey
Hays S.a.r.l Luxembourg
Hays Travail Temporaire Luxembourg Luxembourg
Hays Specialist Recruitment (Malaysia) Sdn. Bhd.* (49% owned) Malaysia
Hays Solution Sdn. Bhd. Malaysia
Hays Specialist Recruitment Holdings Sdn. Bhd. Malaysia
Hays Servicios, S.A. de C.V. Mexico
Hays, S.A. de C.V. Mexico
Hays B.V. Netherlands
13. Subsidiaries continued
Hays plc | 2016 Annual Report and Financial Statements130
NOTES TO THE COMPANY FINANCIAL STATEMENTS
CONTINUED
Country of registration
Hays Commercial Services B.V. Netherlands
Hays Holdings B.V. Netherlands
Hays Services B.V. Netherlands
Hays Temp B.V. Netherlands
Hays Specialist Recruitment (NZ) Limited New Zealand
Hays Document Management (Private) Limited Pakistan
Hays Poland sp. z.o.o. Poland
Hays Poland Centre of Excellence sp. z.o.o. Poland
Hays Recrutamento Seleccao e Empresa de Trabalho Tempoario Unipessoal LDA Portugal
Hays Specialist Recruitment Romania SRL Romania
Hays Business Solutions Limited Liability Company Russia
Hays IT Solutions Limited Liability Company Russia
Hays Specialist Recruitment Limited Liability Company Russia
Hays Specialist Recruitment P.T.E Limited Singapore
Hays Business Services S.L Spain
Hays Personnel Espana Empresa de Trabajo Temporal SA Spain
Hays Personnel Services Espana SA Spain
Hays Specialist Recruitment AB Sweden
Hays (Schweiz) AG Switzerland
Hays FZ-LLC UAE
3 Story Software LLC United States of America
Hays Holding Corporation United States of America
Hays Specialist Recruitment LLC United States of America
Hays Talent Solutions LLC United States of America
Hays USA Holdings Inc United States of America
Veredus Corporation* (80% owned) United States of America
Veredus Government Solutions LLC* (80% owned) United States of America
Veredus Holdings Inc* (80% owned) United States of America
Veredus LLC* (80% owned) United States of America
As at 30 June 2016, Hays plc and/or a subsidiary or subsidiaries in aggregate owned 100% of each class of the issued shares of each of these
companies with the exception of companies marked with an asterisk (*) in which case each class of issued shares held was as stated.
14. Other related party transactions
Hays plc has taken advantage of the exemption granted under paragraph 8(k) of FRS 101 not to disclose transactions with fellow wholly
owned subsidiaries. Transactions entered into and trading balances outstanding that were owed to Hays plc at 30 June 2016 with other related
parties was £1.7 million (2015: £0.1 million).
15. Subsequent events
The final dividend for 2016 of 1.99 pence per share (£28.7 million) will be proposed at the Annual General Meeting on 9 November 2016 and
has not been included as a liability as at 30 June 2016. If approved, the final dividend will be paid on 11 November 2016 to shareholders on the
register at close of business on 14 October 2016.
Hays plc | 2016 Annual Report and Financial Statements131
OVERVIEW  STRATEGICREPORT  GOVERNANCE  FINANCIALSTATEMENTS  SHAREHOLDERINFORMATION
Hays plc | 2016 Annual Report and Financial Statements132
Shareholder information
Supporting information
for investors.
In this section:
134	Shareholder information
135 Financial calendar
136 Hays online
Hays plc | 2016 Annual Report and Financial Statements133
OVERVIEW  STRATEGICREPORT  GOVERNANCE  FINANCIALSTATEMENTS  SHAREHOLDERINFORMATION
Equiniti provides a range of services for shareholders:
Service What it offers How to participate
Shareholder
service
You can access details of your
shareholding and a range of other
shareholder services.
You can register at
www.shareview.co.uk
Enquiries relating
to your
shareholding
You can inform Equiniti of lost share
certificates, dividend warrants or tax
vouchers, change of address or if
you would like to transfer shares
to another person.
Please contact Equiniti.
Dividend payments Dividends may be paid directly into your
bank or building society account. Tax
vouchers will continue to be sent to the
shareholder’s registered address.
Complete a dividend
bank mandate
instruction form which
can be downloaded from
www.shareview.co.uk or
by telephoning Equiniti.
Dividend payment
direct to bank
account for
overseas
shareholders
Equiniti can convert your dividend in
over 83 currencies to over 90 countries
worldwide and send it directly to your
bank account.
For more details
please visit
www.shareview.co.uk
or contact Equiniti.
Dividend
Reinvestment Plan
(DRIP)
The Company has a DRIP to allow
shareholders to reinvest the cash
dividend that they receive in Hays plc
shares on competitive dealing terms.
Further information is
available from the Share
Dividend helpline on
0371 384 2268 or visit
www.shareview.co.uk
Amalgamation
of accounts
If you receive more than one copy of the
Annual Report  Financial Statements,
it could be because you have more
than one record on the register. Equiniti
can amalgamate your accounts into
one record.
Please contact Equiniti.
Share dealing
service(2)
Equiniti offers Shareview Dealing, a service
which allows you to sell your Hays plc
shares or add to your holding if you are
a UK resident. If you wish to deal, you
will need your account/shareholder
reference number which appears on
your share certificate.
Alternatively, if you hold a share
certificate, you can also use any
bank, building society or stockbroker
offering share dealing facilities to buy
or sell shares.(2)
You can deal in your
shares on the internet
or by phone. For more
information about this
service and for details
of the rates, log on to
www.shareview.co.uk/
dealing or telephone
Equiniti on 0345 603 7037
between 8.00am and
4.30pm, Monday
to Friday.
Individual Savings
Accounts (ISAs)(2)
Investors in Hays plc Ordinary shares
may take advantage of a low-cost
individual savings account (ISA) and/or
an investment account where they can
hold their Hays plc shares electronically.
The ISA and investment account are
operated by Equiniti Financial Services
Limited and are subject to standard
dealing commission rates.
For further information
or to apply for an ISA or
investment account, visit
Equiniti’s website at
www.shareview.co.uk/
dealing or telephone
them on 0345 300 0430.
(1)	 Lines open 8.30am to 5.30pm (UK time), Monday to Friday (excluding public holidays in England and Wales).
(2)	The provision of share dealing services is not intended to be an invitation or inducement to engage in
an investment activity. Advice on share dealing should be obtained from a professional independent
financial adviser.
Registrar	
The Company’s registrar is:
Equiniti Limited
Aspect House, Spencer Road, Lancing
West Sussex BN99 6DA
www.shareview.co.uk
Telephone: 0371 384 2843(1)
International: +44 121 415 7047
Textphone: 0371 384 2255
ID fraud and unsolicited mail
Share-related fraud and identity theft affects
shareholders of many companies and we
urge you to be vigilant. If you receive any
unsolicited mail offering advice, you should
inform Equiniti immediately.
As the Company’s share register is, by law,
open to public inspection, shareholders may
receive unsolicited mail from organisations
that use it as a mailing list. To reduce the
amount of unsolicited mail you receive,
contact the Mailing Preference Service,
FREEPOST 29 LON20771, London W1E 0ZT.
Telephone: 0845 703 4599 or 020 7291 3310.
Website: www.mpsonline.org.uk
ShareGift
ShareGift is a charity share donation
scheme for shareholders and is administered
by the Orr Mackintosh Foundation. It is
especially useful for those shareholders
who wish to dispose of a small number of
shares whose value makes it uneconomical
to sell on a normal commission basis.
Further information can be obtained from
www.sharegift.org or from Equiniti.
Website
The Company has a corporate website at
haysplc.com, which holds, amongst other
information, a copy of our latest Annual
Report  Financial Statements and copies
of all announcements made over the last
12 months.
Registered office
250 Euston Road
London
NW1 2AF
Registered in England  Wales no. 2150950
Telephone: +44 (0) 20 7383 2266
Company Secretary
Doug Evans
Email: cosec@hays.com
Investor Relations contact
David Walker, Head of Investor Relations
Email: ir@hays.com
Hays plc | 2016 Annual Report and Financial Statements134
SHAREHOLDER INFORMATION
2016
18 October Trading Update for quarter ending 30 September 2016
9 November Annual General Meeting
11 November Payment of final dividend
2017
12 January Trading Update for quarter ending 31 December 2016
Hays plc | 2016 Annual Report and Financial Statements135
OVERVIEW  STRATEGICREPORT  GOVERNANCE  FINANCIALSTATEMENTS  SHAREHOLDERINFORMATION
FINANCIAL CALENDAR
Hays’ comprehensive
investor site gives you
fast direct access
to a wide range of
Company information.
haysplc.com
Our investor site includes:
–– Investment case
–– Results centre
–– Events calendar
–– Corporate governance
–– Investor day
–– Regulatory news
–– Alerts
–– Share price information
–– Shareholder services
–– Advisors  analysts’ consensus
–– Annual reports archive
LinkedIn
linkedin.com/company/hays
Twitter
twitter.com/HaysWorldwide
twitter.com/haysplcIR
Facebook
facebook.com/HaysUK
YouTube
youtube.com/user/HaysTV
Follow and like us on social media:
Hays plc | 2016 Annual Report and Financial Statements136
HAYS ONLINE
This document is produced using materials that
are certified as FSC©
mixed sources from well-
managed forests.
This document is printed on Heaven 42 paper that
has been independently certified on behalf of the
Forest Stewardship Council (FSC).
Design and production:
Gather +44 (0)20 7610 6140
www.gather.london
© Copyright Hays plc 2016
HAYS, the Corporate and Sector H devices,
Recruiting experts worldwide, the HAYS Recruiting
experts worldwide logo, and Powering the World of
Work are trademarks of Hays plc. The Corporate and
Sector H devices are original designs protected by
registration in many countries. All rights are reserved.
haysplc.com

Hays Plc Annual Report 2016

  • 1.
    THE ULTIMATE PEOPLE BUSINESSHaysplc Annual Report & Financial Statements 2016
  • 2.
    Financial highlights Net feeincome £810.3m 2015: £764.2m Operating profit £181.0m 2015: £164.1m Basic EPS 8.48p 2015: 7.44p Dividend per share 2.90p 2015: 2.76p Conversion rate 22.3% 2015: 21.5% Profit before tax £173.0m 2015: £156.1m For more information go to our website haysplc.com/investors Strategic report A description of our business model, markets and strategy. 10 Our four point investment case 12 Chief Executive’s Review 16 Our market 20 Our strategy 22 Our business model 32 Key Performance Indicators 35 Divisional operating review 38 Financial Review 42 Principal risks Governance report How our Board of Directors sets strategic direction and provides oversight and control. 48 Chairman’s Statement 50 Leadership 56 Relations with shareholders 57 Effectiveness 60 Accountability 64 Remuneration Report 86 Directors’ Report 89 Directors’ responsibilities Financial statements Financial statements for the Group including a report from the independent auditor. 92 Independent Auditor’s Report 96 Consolidated Group Financial Statements 125 Hays plc Company Financial Statements Shareholder information Supporting information for investors. 134 Shareholder Information 135 Financial calendar 136 Hays online WE ARE LEADING GLOBAL RECRUITING EXPERTS IN THE WORLD OF QUALIFIED, PROFESSIONAL AND SKILLED WORK.
  • 3.
    Divisional operating review page35 Our strategy page 20 Our business model page 22
  • 4.
    1. IT 20% 2.Accountancy Finance 15% 3. Construction Property 15% 4. Engineering 8% 5. Office Support 8% 6. Other 34% 1. Permanent 42% 2. Temporary 58% 1. 2. 3. 4. 5. 6. 1. 2. Asia Pacific Continental Europe Rest of World UK Ireland What we do We place candidates into temporary, contractor and permanent roles across 20 specialist areas of skilled work. Split of net fees by specialism Split of net fees by contract type Where we do it We operate in 33 countries across our three divisions. Hays is powered by our people around the world. We focus on hiring, training and developing the best people in our industry. Employees 9,214 2015: 9,023 Consultants 6,268 2015: 6,113* Employee engagement 83% 2015: 84% Hays internal international transfers 59 2015: 41 * 2015 consultant headcount has been restated to include 144 resourcers previously not reported as consultants in Germany and Switzerland. 1. THE BREADTH OF OUR BUSINESS MODEL ACROSS SECTOR AND CONTRACT TYPE 2. A BALANCED EXPOSURE TO BOTH MATURE AND STRUCTURAL GROWTH MARKETS 3. OUR ABILITY TO DELIVER SUPERIOR FINANCIAL PERFORMANCE THROUGH THE CYCLE 4. OUR POTENTIAL TO GENERATE SIGNIFICANT CASH FLOW AND DIVIDENDS Permanent jobs filled last year 67,000 Net fee income £810m Temporary and contractor roles filled last year 220,000 For more information go to page 35 For more information go to page 10 Facts and figures The ultimate people business Our four point investment case We believe that there are four simple and compelling reasons to invest in Hays:
  • 5.
    EVERY DAY, IN33 COUNTRIES, FROM NEW ZEALAND TO CHILE, 252 OFFICES COME TO LIFE, UNDERSTANDING WHAT POWERS THE WORLD OF WORK, ANTICIPATING OUR CLIENTS’ VARYING NEEDS, AND HELPING DRIVE CANDIDATES’ CAREERS. AS RECRUITING EXPERTS IN 20 SECTORS WE RECEIVE OVER 20,000 CVs AND MEET 100s OF CLIENTS EVERY DAY FROM BREAKFAST SEMINARS TO WORKING LUNCHES AND 1,000s OF INTERVIEWS. WE WORK AROUND THE CLOCK TO BRING OUR EXPERTISE TO LIFE, FINDING THE PERFECT FIT TO HELP BUSINESSES AND THEIR PEOPLE FLOURISH. WE ARE HAYS. THE ULTIMATE PEOPLE BUSINESS. Hays plc | 2016 Annual Report and Financial Statements1 OVERVIEW  STRATEGICREPORT  GOVERNANCE  FINANCIALSTATEMENTS  SHAREHOLDERINFORMATION
  • 6.
    290,000 Lives transformed Every workingday last year we placed over 1,000 people into the next job, that’s 290,000 over the course of the year. We also saw over 50 of our own people transfer around the world and promoted 2,800 people across the Group. Transforming lives through our expertise: it’s what we do. “AT HAYS WE ARE CHANGING LIVES ON A DAILY BASIS.” Hays plc | 2016 Annual Report and Financial Statements2
  • 7.
    “I FEEL LIKEI HAVE FINALLY FOUND THE JOB THAT SUITS ME.” 6 million CVs received last year Like many businesses, the amount of data we need to deal with has increased dramatically in recent years. The key for us is having the systems and tools in place to enable us to understand, interrogate and search that data quickly and effectively. Hays plc | 2016 Annual Report and Financial Statements3 OVERVIEW  STRATEGICREPORT  GOVERNANCE  FINANCIALSTATEMENTS  SHAREHOLDERINFORMATION
  • 8.
    1 million Individuals lookingto flourish We seek to personally meet all candidates we plan to put forward to our clients to make sure we fully understand their needs and can match them to the most suitable roles. Last year our consultants conducted over 1 million candidate interviews. “HAYS HAS JUST DELIVERED THREE AMAZING CANDIDATES IN A SHORT PERIOD OF TIME.” Hays plc | 2016 Annual Report and Financial Statements4
  • 9.
    “WE HAVE THE RIGHTTOOLS AND TRAINING TO ALLOW US TO SUCCEED.” 9,214 Passion fuelled experts Key to our success is our ability to hire, train and develop the best people in our industry. We expect them to be experts in their local market, understanding the evolving challenges and needs of clients and candidates. Hays plc | 2016 Annual Report and Financial Statements5 OVERVIEW  STRATEGICREPORT  GOVERNANCE  FINANCIALSTATEMENTS  SHAREHOLDERINFORMATION
  • 10.
    LAST YEAR, WEPLACED 67,000 PEOPLE IN PERMANENT JOBS AND OVER 220,000 PEOPLE IN TEMPORARY ROLES... Hays plc | 2016 Annual Report and Financial Statements6
  • 11.
    ...OR TO PUTIT ANOTHER WAY, WE PUT A SMILE ON 290,000 FACES. Hays plc | 2016 Annual Report and Financial Statements7 OVERVIEW  STRATEGICREPORT  GOVERNANCE  FINANCIALSTATEMENTS  SHAREHOLDERINFORMATION
  • 12.
    Hays plc |2016 Annual Report and Financial Statements8
  • 13.
    Strategic report A reviewof our business and an analysis of our performance throughout the financial year. In this section: 10 Our four point investment case 12 Chief Executive’s Review 16 Our market 20 Our strategy 22 Our business model 26 Resources and relationships 32 Key Performance Indicators 35 Divisional operating review 38 Financial Review 42 Principal risks Hays plc | 2016 Annual Report and Financial Statements9 OVERVIEW  STRATEGICREPORT  GOVERNANCE  FINANCIALSTATEMENTS  SHAREHOLDERINFORMATION
  • 14.
    Our business philosophy centreson the need to invest to support long- term growth, but also to generate profits and cash along the way. In practical terms, this means we continually focus on: consultant and business productivity; profitability; strategic reinvestment of our profits to support growth; cash generation and returns to shareholders. In addition, we believe there are four simple and compelling reasons to invest in Hays. Hays plc | 2016 Annual Report and Financial Statements10 OUR FOUR POINT INVESTMENT CASE
  • 15.
    Group net fees 1.Mature markets 61% 2. Structural growth markets 39% 1. 2. 1. THE BREADTH OF OUR BUSINESS MODEL ACROSS SECTOR AND CONTRACT TYPE –– We have built a global platform with unrivalled scale, balance and diversity. –– We have exposure across permanent, temporary and contractor recruitment markets at a scale, which is unique amongst our peers. –– We focus on execution in each of our local markets delivered by the best people, sector- leading technology, tools and a world-class single brand. –– We have strong and experienced operational and senior regional management teams across the Group. –– We focus on developing and delivering the best services and products for clients and candidates, meeting their evolving needs. 3. OUR ABILITY TO DELIVER SUPERIOR FINANCIAL PERFORMANCE THROUGH THE CYCLE –– Three years into our five-year plan, we are where we expected to be in terms of our aspiration to broadly double 2013’s operating profit of £125 million to £250 million in 2018. –– We have a balanced exposure across countries, specialist areas and contract forms (between temp, contracting and perm). –– We believe this balance adds relative resilience to our earnings throughout the economic cycle and drives the outperformance of our business versus the peer group. –– Despite this existing balance we remain focused on further diversifying our earnings, building scale across our existing global platform. 2. A BALANCED EXPOSURE TO BOTH MATURE AND STRUCTURAL GROWTH MARKETS –– Many of the 33 countries across our global platform represent clear structural growth opportunities, where the use of agencies such as Hays to source skilled employees is a relatively new practice. –– 39% of our Group net fees are generated in these structural growth markets which include Germany, Latin America and Japan. –– The remaining 61% of net fees come from more mature markets, such as the UK, the US or Australia, where the use of agencies is a long- established practice in the skilled jobs market. 4. OUR POTENTIAL TO GENERATE SIGNIFICANT CASH FLOW AND DIVIDENDS –– Delivering our plan would allow us to generate material cash returns, increase our net cash position and grow the Group’s dividend. –– We target core dividend cover of 3.0x earnings and are building cover towards this level, with this year’s at 2.9x. –– It is our intention that once we have built a net cash position of c.£50 million, any free cash generated over and above this level will be distributed to shareholders annually, at year end, assuming a positive outlook, most likely as a special dividend, supplementing the core dividend. –– This year we achieved our long-standing ambition of eliminating net debt, a significant milestone for the Group. Sectors 20 FY16 operating profit £181.0m Net cash £36.8m Countries 33 Earnings per share 8.48p Dividend per share 2.90p Hays plc | 2016 Annual Report and Financial Statements11 OVERVIEW  STRATEGICREPORT  GOVERNANCE  FINANCIALSTATEMENTS  SHAREHOLDERINFORMATION
  • 16.
    Conversion rate progressionsince FY13 2013 2014 2015 2016 19.4% 17.5% % 21.5% 22.3% 15 20 25 I was also very pleased with our good underlying cash performance, meaning that we achieved our long-standing goal of eliminating the Group’s net debt – and again we delivered this ahead of when the market expected us to do so. We achieved this despite paying £40 million in dividends to shareholders in the year and investing rapidly to drive organic growth around the world. Becoming debt-free means we face the future with our balance sheet healthier than it has been for many years. That gives me even greater reassurance in our ability to deal with future market ups and downs, having the firepower to both invest where appropriate as well as continue to reward our shareholders via the dividend. Our Chief Executive, Alistair Cox, discusses the Group’s performance in 2016 and looks ahead to our areas of focus for 2017 and beyond. Q.Was the financial performance of the business this year in line with your expectations? A.I was pleased with our strong set of financial results for the year, particularly as we delivered a performance that was above market consensus expectations. We grew our net fees by 7%(1) and very importantly converted that into strong operating profit growth of 13%(1) , thereby further improving our conversion rate by 80bps to 22.3%(2) . The conversion rate is the key measure of how effectively we convert net fees into operating profits, so it is an important indicator as to how efficiently and productively the business is performing around the world. We have long enjoyed the leading conversion rate amongst our peers in the industry, so it was very rewarding to see it continue to grow. Hays plc | 2016 Annual Report and Financial Statements12 CHIEF EXECUTIVE’S REVIEW Alistair Cox Chief Executive
  • 17.
    Q.What were yourkey areas of operational focus during the year, and what progress did you make against your non-financial objectives? A.The two routes to grow our business organically are by adding additional capacity via headcount investment and by further improving the productivity of our existing consultant base. Our focus is to strike the right balance between these two. Many of our markets offer significant structural growth opportunities, so we invest to build capacity to exploit those opportunities for the long term. However, we also believe it is vital to deliver meaningful profits along the way and productivity improvements play a large part in achieving that. During the year, many of our markets were very supportive so we invested in additional capacity and grew our headcount by 3% globally, helping to drive our net fee growth around the Group. A good example is Germany where we ramped up investment in the summer of 2015, with a specific emphasis on targeting the SME client sector. Over the year we increased headcount in Germany by 11%(3) to over 1,200 consultants at year-end. As the German market improved during the course of the year, this investment delivered quick returns, as we had in place the capacity to meet the growing demand and our fee growth accelerated accordingly. between these candidates and current client opportunities and we have invested in growing our internal capabilities in data analysis and digital marketing accordingly. This team’s role is to analyse our data, unlocking insights which will allow us to focus our consultants’ efforts and expertise into the most fertile areas. Above all though, all of these initiatives are designed to make our consultants even more productive and profitable than they might be otherwise. This data-focused team works very closely with our well-established Innovation group, whose primary focus is on understanding the many new and emerging business models in the recruitment space. Again, where we see a potential threat or challenge to our existing core business or indeed when a new opportunity or route to market arises we want to ensure we fully understand that change, forge relationships where we can, and also build, test and learn from our own new tools and products. This approach is designed to ensure we can quickly identify and mitigate any risk or threat to our business and fully capitalise on any new opportunities that come our way. We made significant progress diversifying our business by further expanding our Contractor business into newer markets, using the experience and expertise that has been at the heart of our success in Germany. The worldwide Contractor market is benefiting from a structural shift towards highly skilled freelancer roles in a number of sectors, and is set for long-term growth as we discuss in more detail on page 18. It also provides us greater earnings resilience, particularly when markets are more uncertain. However, it requires different skills, systems and business models to the permanent recruitment market. As a leader and expert in both permanent and contracting recruitment, we are well positioned to leverage both opportunities, and that is a unique positioning in today’s recruitment industry as our peers tend to focus on one or other of these two sectors. I expect Contracting to become a more important part of many of our businesses around the world. For example, from a standing start just a few years ago, our French business now generates over one-third of its net fees from temporary and contractor recruitment and we are continuing to invest to grow these businesses further. Finally, we made good progress developing the Veredus business in the US, following its acquisition in December 2014. All post- acquisition integration plans were successfully completed including implementation of the Hays proprietary front office system OneTouch, introduction of the Hays brand and harmonisation of the finance and controls systems under the Veredus management. We also expanded the core IT business as well as investing in the recently launched Construction Property and Life Sciences specialisms. One of the key challenges we face is the fast- moving economic environment to deliver excellent profit leverage, even as the market then did soften, as we’d predicted as macroeconomic concerns intensified and the EU Referendum approached. These actions allowed us to grow UK profits by 14%(1) or £6.4 million even though net fees were flat on the prior year – an excellent result. These are both examples of how the combination of strong local management teams supported by powerful management information systems equips our business to take rapid and informed decisions that are fundamental to our financial performance. Consultant headcount 2013 2014 2015 2016 5,037 5,357 6,113 6,268 0 1,000 2,000 3,000 4,000 5,000 6,000 7,000 Over the year we further improved consultant productivity by 1%(1) . This alone added £6 million to our operating profit. Key to achieving this was our investment in consultant training and the development of more tools that would enable our consultants to become even more expert and effective in their roles. Over the year we delivered 4,000 days of training across our business, designed to make our consultants expert in their jobs and to further develop our management teams to run ever-larger businesses. We also continued to invest in new and emerging technologies, designed to assist our consultants find exactly the right candidates for their clients and to do that faster than ever before. An example of this is our recent partnership in Australia with SEEK, the leading job board in that region. Such partnerships, blending the skills, systems and insights of other organisations with those of our own are an important element of our own development and I am proud of the relationships we have built with enterprises such as Google, LinkedIn, Oracle, the Confederation of British Industry and Manchester City Football Club. I expect more such collaborations to flourish over time. This year we made further inroads in understanding how we can best use the massive quantities of data our business holds in order to deliver even better service to our clients and candidates. Our business has a relationship with literally millions of highly skilled individuals and organisations around the world. Data science has a role to play assisting our consultants make the very best match One of the key challenges we face is the fast-moving economic environment, and how changes in the world around us can very quickly and materially impact trading conditions in our markets. For example, this year our forward indicators in the UK suggested a softening market in Autumn 2015. Consequently, we took quick action to reduce costs and capacity. This allowed us to continue Hays plc | 2016 Annual Report and Financial Statements13 OVERVIEW  STRATEGICREPORT  GOVERNANCE  FINANCIALSTATEMENTS  SHAREHOLDERINFORMATION
  • 18.
    Q.Three years intoyour five-year plan, are you on track? Do you still feel confident in delivering on those aspirations? A.Three years into our five-year plan, we are in line with where we expected to be at this stage, having delivered £56 million of headline profit growth since 2013. I am delighted with that progress, not least because over the first three years we have faced significant currency headwinds of £22 million, which materially reduced our reported sterling profits, and it is very encouraging that our strong trading has mitigated these adverse forex movements. However, as expected in a cyclical business such as ours, after three years the geographic source of profit growth has been different to that which we envisaged, with Australia and Germany slightly behind track, largely as result of currency headwinds, while the UK and the rest of the world are well ahead of plan due to strong trading and operational performances. In Australia this year, we benefited from a gradual improvement in sentiment in the private sector, led by the eastern states of New South Wales and Victoria, as well as increasing demand from the public sector. The mining sector continued to prove very challenging but stabilised towards the end of the year. These dynamics enabled us to modestly increase our fee growth rate through the year and increase consultant headcount by 5%. In Germany, we grew headcount to take advantage of improved market conditions, as mentioned earlier. This allowed us to gradually accelerate our net fee growth rate through the year, reaching an underlying 17%(1) in the final quarter. At these growth levels, Germany now has the potential to deliver on the 2018 profit range we originally targeted, which had a mid point of £100 million, and continues to represent a material structural growth opportunity for our Group. The UK is worth a specific mention as we have made significantly more progress there than we might have originally expected. The exceptional operating leverage the team have delivered is particularly impressive. In fact, over the last three years, we have converted over 90% of our incremental net fees into operating profits, way ahead of our historical norms or any of our competitors. Finally, our remaining 30 countries have collectively performed beyond our initial expectations and several countries are now reaching real scale, including France, Q.How do you think about the uses of cash within the business? A.Over and above the investment we make into people, our business has very low capital requirements and is highly cash generative. This year we converted 88%(4) of our operating profits into operating cash flow, generating over £159 million of cash in the process. We believe in rewarding our shareholders and have a clear distribution policy in place, designed to be appropriate for the cyclicality inherent in our industry. The primary element of distribution is the core dividend, which is set at a level which we believe to be secure under all predictable scenarios. Over the last few years, we have built the core dividend cover up towards our target of 3x EPS, and when we reach this level of cover, the core dividend will grow in line with earnings. Now we have eliminated our net debt, our next goal is to build a net cash position of around £50 million, which we expect to achieve in FY17. Once this is achieved, it is our intention that any excess cash that is generated over and above this level will be distributed to shareholders, provided our market outlook is positive. The most likely form of distribution will be via a special dividend, supplementing the existing core dividend. We believe this combination of secure, progressive core dividend supplemented by regular and material special dividends in the good years is an effective way of distributing our cash returns to shareholders. Our policy also ensures the business remains securely financed and appropriately invested and reflects both the cyclicality as well as the attractive cash generation capability of our business. Q.What will be the main areas of focus for you and your management team in the year ahead? A.We have a clearly defined long-term strategy and objectives so in the year ahead our focus and priorities will be largely unchanged as we seek to make further progress against those established goals. We will continue to focus on driving profitable, cash generative fee growth, as well as investing to deliver on Switzerland and Japan. Equally we are benefiting from many smaller businesses which are growing rapidly and are collectively delivering meaningful profits, including Spain, China, Belgium and New Zealand. Our five-year plan was based on a set of clear assumptions for the market backdrop; steady overall economic growth over the plan period, with no recessions in any of our major markets and a modest acceleration in growth in the final two years. We also assumed that while there may be the occasional minor economic ‘shock’, no major shock such as those we’ve experienced previously including the Global Banking crisis or Eurozone crisis would occur. Three years into the plan, these assumptions have been proven valid. However, the UK’s decision to leave the EU at the end of our last financial year has undoubtedly created greater economic uncertainty. It remains to be seen how this will impact our important economies and what the implications might be on our financial performance for the remaining two years of the plan period. What I can say though is that our business is adaptable and managed by a strong and stable team around the world who are experienced in managing our business to maximum effect in any market environment. Operating profit £181m 2015: £164m Three-year operating profit growth(1) £78m FY13 FX impact Operating profit growth(1) FY16 125 £m (22) 78 181 0 40 80 120 160 200 Hays plc | 2016 Annual Report and Financial Statements14 CHIEF EXECUTIVE’S REVIEW CONTINUED
  • 19.
    The success of ourbusiness is based on the expertise of our colleagues our long-term strategic ambitions. Day-to-day, this means continuing to invest in improving consultant productivity, adding additional capacity where demand warrants and rapidly investing in the longer-term initiatives that will become large and important aspects of our business in the future. This single-minded focus on our core business, supplemented by a continual strive to improve and expand that core, has served us well and will continue to be our primary theme. The success of our business is based on the quality and expertise of all of our colleagues across Hays worldwide. Key to our growth and continuing success therefore will remain our ability to hire, train, motivate and retain the best people in our industry. That’s why people risk is one of the key challenges we face. It’s why we are so focused on the global mobility of our people (which we discuss on page 27), moving high performers from established businesses to help grow and develop newer ones. We address the risk of losing key people through industry-leading training and development programmes, succession planning and incentive schemes (discussed on page 26). Over the years, we have invested to build the resources and infrastructure to manage these things well but we will continue to invest in upgrading this capability. For example, we will add additional training and development resources into the US to enable faster growth and we will roll out new leadership development programmes, to equip our global management to deal with larger and more complex businesses. and where current productivity has reached an acceptable level to justify adding more capacity. Clearly the UK vote to leave the EU has increased uncertainty in that market, at least in the short term. And although it remains too early to tell what the longer-term impact may be, we are, as ever, monitoring activity levels closely. Regardless, the UK remains a large and important skilled labour market, despite the current uncertainty and we will continue to reinforce our market- leading position there as the exit negotiations and implications unfurl. In terms of newer market areas, we will continue to ramp up our Contracting business in a number of countries as discussed earlier. Similarly, we have already started to invest in new niche specialisms in the technology sector, serving the rapidly growing market for advanced digital skills across the technology and marketing sectors, and this investment will be accelerated across key countries including the UK, Australia, Germany, North America and Asia. Finally, the US market offers significant opportunities for us to build a very large business over time. Our priorities there remain to grow our core IT business as well as launch and rapidly expand additional specialisms. We will accelerate investment in the recently launched Construction Property and Life Sciences specialisms for example and will also explore opportunities to invest in other areas including Accounting Finance. Technology impacts every industry so we will continue to explore how we can best exploit the evolving technology landscape to make our own business ever more productive and valuable. As discussed earlier, we have in place the internal resources to focus on this but will also continue to build relationships with external partners where we see benefit. This market moves so quickly that it is impossible to predict the future. Rather, our approach is to be deeply involved in its evolution, working alongside our partners so that we keep abreast of developments, adapt our business where we see competitive threats and exploit new ideas and tools where they provide us with competitive advantage. Above all, these investments are all designed to enhance the expertise and capability of all Hays employees. Our recipe is simple: hire the very best people to work for Hays, provide them with world-class training and career development opportunities, equip them with state-of-the-art technology tools to be better at their jobs than their competitors and reward them based on their performance. All our investments are designed so that our teams can better help our clients find the scarce talent they need and help millions of candidates we are connected to secure the perfect next role in their career. That’s why I believe Hays is the ultimate people business. Alistair Cox Chief Executive (1) LFL (like-for-like) growth represents organic growth of continuing operations at constant currency. (2) Conversion rate is the proportion of net fees converted into operating profit (before exceptional items). (3) Consultant headcount at June 2015 has been restated to include 144 resourcers previously not reported as consultants in Germany and Switzerland. (4) Cash conversion is the conversion of operating profit into operating cash flow (before exceptional items and capital expenditure). Most of our markets are supportive today so we will capitalise on this by investing both in additional consultant capacity in our existing businesses as well as more rapid investment in newer areas that offer longer-term opportunities. If current market trends continue, I expect us to grow headcount next year, but only in those markets where we see a positive outlook Hays plc | 2016 Annual Report and Financial Statements15 OVERVIEW  STRATEGICREPORT  GOVERNANCE  FINANCIALSTATEMENTS  SHAREHOLDERINFORMATION
  • 20.
    The stage ofthe macroeconomic cycle and outlook, and prevailing sentiment in each of our markets, have a direct and often significant impact on activity levels within our business. This can be both positive and negative, particularly with respect to the confidence levels of businesses to invest in hiring, and candidates to move jobs. We call this ‘job churn’, and it is the primary driver of activity in the short term. lowered. As the year ended, there was a General Election in Australia and the incumbent Government was re-elected, albeit with a slim majority. In Asia, China grew at the slowest rate in 25 years as the transition to move towards an economy led by consumption and services, rather than one driven by exports, continued. In the rest of Asia subdued banking markets weighed down on sentiment, especially in the second half of the year in Hong Kong and Singapore. Continental Europe Rest of World Overall, Europe continued its broad-based recovery during the year, with falling unemployment, rising incomes and supportive monetary policy measures from the ECB all strengthening consumer and business confidence, which in turn supported activity levels in many markets. In the Americas, economic conditions were more mixed, with heightened political and economic instability in Brazil, while in North America although the Canadian economy remained subdued, hampered by falls in commodity prices, the US enjoyed a more robust economic performance. This was most evident in the jobs market, where non-farm payroll, a key employment measure, rose by an average of 206,000 per month, leading the Federal Reserve to increase interest rates for the first time in nine years. To see how we performed across our three divisions go to page 35 The macroeconomic environment UK Ireland For most of the year, especially the first half, the UK economic and market backdrop was broadly stable and supportive. As we started the second half, however, we saw increased caution amongst clients as geopolitical instability in parts of Europe and worries about the state of the Chinese economy weighed on sentiment. Confidence was also impacted by the UK Referendum on EU membership which, although it did not take place until June 2016, created further increased uncertainty, adding to the sense that the UK was experiencing a ‘pause for breath’. As we exited the year, following the vote to leave the EU, this level of uncertainty (notably amongst clients) increased significantly and so remains a key factor in the market, though it is too early to tell what the longer-term impact may be. In the year, UK unemployment fell further, employment levels hit all-time records, and the Bank of England held interest rates at historically low levels. Asia Pacific In Australia, while the resources-driven parts of the economy remained subdued, overall sentiment improved steadily over the year despite some concerns over the impact of a China slowdown on the economy. Consumer confidence levels in the non-mining regions improved, there was an uptick in public sector backed investment and interest rates were Key economic and political events in our major markets during FY16 UK market sentiment was impacted by the EU Referendum poll and its result. Unemployment fell further, employment levels hit all time records. Asia Pacific UK Ireland Continental Europe Rest of World Australia Consumer confidence levels, especially in the non-mining regions, improved. There was a General Election in Australia and the incumbent Government was re-elected. China Experienced a slowdown in the economy which impacted consumer and business sentiment worldwide. Europe Continued broad-based recovery with falling unemployment. US The US enjoyed a stronger economic performance, notably in the jobs market. Americas Economic conditions were more mixed in the Americas, with heightened political and economic instability in Brazil. Hays plc | 2016 Annual Report and Financial Statements16 OUR MARKET
  • 21.
    £130k £20k Indicativesalaryrange ofHaysplacements Net fee pool Marketsegment Haysfocus Executive search Specialist recruitment Contingent fee model focused on highly skilled roles in clear structural growth markets Generalist ‘blue collar’ staffing Group net fees excluding Germany, Australia and the UK Perm Temp 2011 2016 78% 67% 33% % 22% 0 20 40 60 80 100 The main UK listed specialist recruitment businesses we identify are PageGroup, Robert Walters and SThree, all of which have varying exposures and business mix, but do have a presence in many of the markets in which we operate (though do not have the scale of Hays’ operations in some of the more technical recruitment markets such as Construction Property). We also identify many other competitors across each of our local markets. These include larger, so called ‘generalist’ recruiters such as Adecco, Randstad and Manpower, who also have operations in the specialist recruitment space, but are predominantly focused on lower-salary ‘blue collar’ segment of the market. There are also several other sector or region-specific businesses such as KForce in the US or Amadeus FiRe in Germany. We have deliberately built a business that is well-balanced and exposed to both mature, cyclical markets and emerging structural markets. In FY16 61% of our net fees were generated in mature markets and 39% in more immature markets. The latter have significant structural growth opportunities and are less impacted by the economic cycle. We believe this balance, as well as our mix of temporary, contractor and permanent recruitment combined with genuine scale across a range of 20 specialist areas and 33 countries, is unique to the specialist recruitment space, adds relative resilience to our business model through the economic cycle and acts as a genuine differentiator in our industry. The competitive environment We focus on the segment of the recruitment market referred to as professional, ‘white collar’ skilled or specialist recruitment. The salary of the candidates we place ranges from roughly £20,000 to £130,000 p.a. and we operate across 20 different areas of specialism, including white collar professions such as Accountancy Finance and IT, and more technical disciplines such as Engineering and Construction Property. The competitive landscape across most of our markets is extremely fragmented and characterised by a large number of companies, which are often very small and focus on local, niche markets, and with a few large global players. Despite the fragmented nature of the industry, however, in the majority of our markets the main competition we face is from in-house recruiting teams within the HR function of corporates. While we estimate that in more mature markets like the UK or the US around 80% of addressable skilled jobs are filled via recruitment agencies, in less mature markets like Germany that figure is only around 20% according to our analysis. The first time outsourcing of the recruitment of professional staff is therefore a key driver of growth in many of our businesses. The structure of the global recruitment market In FY16 58% of our fees came from the Temp and Contracting market, although this is weighted towards just three countries where Hays has a market-leading position: Germany, Australia and the UK. In most of the other countries in the Group we have historically been predominantly perm focused, however where market conditions and local legislation have allowed it, we have successfully been pursuing a strategy to build a meaningful temp and contractor business, which today represents one-third of our business outside of the three core markets. Hays plc | 2016 Annual Report and Financial Statements17 OVERVIEW  STRATEGICREPORT  GOVERNANCE  FINANCIALSTATEMENTS  SHAREHOLDERINFORMATION
  • 22.
    Longer-term market trends Inaddition to these short-term macroeconomic conditions and competitive trends, we see many other factors that influence our business, which can represent opportunities and/or risks or challenges to our existing business model. The emergence of structural growth markets in specialist recruitment, skills shortages in certain recruitment markets and the globalisation of the flow of labour all have an influence. In addition, we identify four ‘mega trends’ which also have an impact on the future shape and direction of our industry and inform how we run the business and develop our strategy: Mega trend 1: Labour force evolutions These include the rise of the digital economy driving new job creation in more niche areas such as social media, increased IT spend and demand for more flexible, project-based work or greater mobility of experienced workers and globalisation of labour. Many of the factors above are why we believe Contracting is a key structural growth market and has become one of our fastest-growing business sectors. We have made further strategic progress rolling out our market-leading IT Contracting business from Germany into other markets where we believe the model can be successful, including Canada, France and Japan. This, coupled with the established IT contracting business we now have in the US following the acquisition of Veredus, means we are at the forefront of this evolving market trend. Opportunities for Hays –– Further build scale within our Contractor business –– Offer a truly globally-integrated service to respond to increased candidate global mobility, capitalise on cross border client relationships –– Continue to build our brand in new emerging country markets and industry niches Potential challenges or threats –– Sourcing highly-skilled contractors to place with clients –– Jobs are created in new, niche specialisms in which Hays has limited presence –– Being able to quickly understand and adapt to changing regulatory environments in many local markets –– Technological and demographic factors which may constrain growth Mega trend 2: Changing client behaviour Many companies are increasingly employing skilled people on a contract or project basis, introducing more flexibility in their cost base and benefiting from a workforce with a wide portfolio of relevant experience. For an increasing number of businesses therefore, contract and temporary workers make up an essential, and in some cases substantial, part of their workforce. Hays act as intermediary for highly skilled professionals searching for short-term vacancies. Opportunities for Hays –– Work with existing clients to help them manage and shape their skilled Temp Contractor workforces –– Establish new client relationships as more businesses adopt this model –– Bring the expertise of our existing Temp Contractor businesses to bear in new and opening markets Potential challenges or threats –– The risk of more ‘in-house’ recruitment and direct sourcing of temp and contractor labour by corporates –– Adverse changes in local market regulations governing the Temp Contractor markets Mega trend 3: Changing business practices These include increased outsourcing of recruitment in many immature markets around the world where most professional recruitment is still done by in-house HR teams, as well as the increased levels of centralised procurement seen in large corporates in more mature markets Opportunities for Hays –– Open-up markets where the majority of recruitment is still performed by in-house teams –– Drive growth over-and-above the economic cycle, capitalising on first time outsourcing Potential challenges or threats –– Margin pressure as more recruitment purchasing decisions are actioned by procurement teams –– The need to continue to invest in developing new tools and resources to provide first-class large-scale HR services –– The risk of disintermediation by newly developed technology tools embedded within our clients –– Sourcing and retaining skilled people and management depth in newer markets We operate in both mature, cyclical and less mature structural-growth markets. We have been building a strong presence in markets like Germany which, despite being a developed economy, has a low penetration rate when it comes to the outsourcing of recruitment services. Therefore, notwithstanding our market-leading position there we still see many growth opportunities as more businesses start to outsource their recruitment of skilled labour. Our services must be tailored to these different client needs, whether SMEs or large corporates and the way we provide those services has to be adapted to match those unique requirements. For instance we offer Managed Service Programme (MSP) services, where we manage contingent workforces, as well as Recruitment Process Outsourcing (RPO) services, where we manage all permanent recruitment needs. Additionally, to help clients of any size tracking all aspects of their contingent workforce we also offer technology- enabled solutions like our 3 Story Software, a cloud-based vendor management and workforce management software solution. Mega trend 4: Evolving technology Technology is in many ways transforming how people work, enabling remote working and impacting on how clients and candidates engage and interact with the jobs market and with Hays. Also, the digitalisation of both supply and demand creates vast quantities of data to be analysed and put to use. Opportunities for Hays –– Leverage our IT architecture to efficiently handle the increasing volumes of data in our business, enabling our consultants to focus on the relationships with clients and candidates –– Understand and manage the data within our business to drive better results for clients and candidates Potential challenges or threats –– Invest in understanding and responding to new trends, routes to market and disruptive technologies –– Continue to develop our systems and capabilities to interact with external data sources, new routes to market and to be able to offer clients and candidates the products and systems they demand such as mobile and social media technologies Our sector-leading technology and partnerships help us drive growth by improving our consultants’ productivity. We also have an Innovation team which is tasked with assessing the technology landscape, identifying new industry trends, opportunities and threats and building partnerships with key emerging players. Hays plc | 2016 Annual Report and Financial Statements18 OUR MARKET CONTINUED
  • 23.
    Like many thingsat Hays, our German IT Contracting business is based on strong, long- lasting relationships we build with clients and candidates. Arno has been a business partner of Hays for more than 10 years. He is a Senior IT Consultant, specialising in the migration of core banking systems. “In my previous projects at Deutsche Bank and Commerzbank I was in touch with Hays on a regular basis and had a personal recruitment expert who looked after me throughout my various assignments. I enjoy the opportunity and the flexibility to shape my career according to my own needs and I am looking forward to the new project I am about to start with Hays.” Arno Mathiszik Senior IT Consultant, Germany Over the last few years the roll-out of our market-leading Contracting business into France has enabled us to capitalise on a macro shift in the French skilled workforce marketplace towards more flexible working arrangements. David Michelin has been part of this trend. He is an IT Project Director and over the last three years Hays has helped him secure positions with clients including Publicis, Pixmania and Isobar. “Over the years, I have created a strong relationship with Hays, who have given me the opportunity to grow professionally in projects which matched my expectations.” David Michelin IT Project Director, France Acquisition of Veredus Corp. In 2014 Hays acquired Veredus Corp., a pure play IT staffing company that generates c.80% of its net fees from Contracting and Temporary assignments. The ingredients for success in the Veredus business were the same as those in our other major contracting businesses around the world: acting as trusted long-term career advisers to highly-skilled professionals, finding them the roles to develop and match their skills. Bobby Higbea has been a Veredus contractor for over 10 years. He is a Senior .Net Developer who has been placed on assignment through Veredus with clients including Tech Data, Elsevier and PwC. Our consultants have built a real understanding for what Bobby’s requirements are and how they’ve changed over time and have been successfully matching them with our clients’ evolving needs. “I’ve worked with Veredus for over 10 years, and have a genuine two-way relationship with them. They have always taken a genuine interest in the development of my career, which has shown with each assignment as well as the advice they are able to give. They understand my career goals as well as the way I work and have consistently offered attractive roles that suited my skillset and lifestyle.” Bobby Higbea Senior .Net Developer, USA Market trends case study: DRIVING MANY OF THESE MEGA-TRENDS IS THE WAY THAT FLEXIBLE PROJECT- BASED WORK AND INCREASED GLOBAL MOBILITY OF SKILLED CANDIDATES HAS CHANGED THE WAY WE WORK. Hays understand my career goals as well as the way I work Bobby Higbea Senior .Net Developer, USA Hays plc | 2016 Annual Report and Financial Statements19 OVERVIEW  STRATEGICREPORT  GOVERNANCE  FINANCIALSTATEMENTS  SHAREHOLDERINFORMATION
  • 24.
    Our ultimate aimis to be the undisputed leader in global specialist recruitment. As we build towards this, we have a set of four, long-established strategic priorities which remain unchanged throughout the various stages of the economic cycle. They are informed and driven by our aims, as well as the long-term mega-trends we identify in our marketplace, described on page 18. Strategic roadmap We have a clear and disciplined approach to the prioritisation of investment to deliver on our long-term goals. Prioritised pipeline 2. Build critical mass and diversity across our global platform Increased geographic and sectoral diversification and exposure to perm, temp and contractor markets across the business reduces the relative volatility of earnings through the various stages of the economic cycle. We invest to rapidly build our own headcount, office capacity and introduce new specialisms where and when appropriate. Our investment approach is driven by the long-term opportunity to reach significant scale where we see the potential, as well as the shorter-term need to deliver profits along the way. We are now three years into our five-year plan to broadly double and materially diversify the Group’s profits by 2018. We have a clear framework for how we prioritise investment in order to build towards these aspirations, outlined above. Our plan is underpinned by some clear assumptions: a continued gradual economic recovery, no material economic shocks or recessions in any of our major markets and a modest acceleration of growth in the outer two years of the plan. We believe that hiring, training and developing the best people in our industry is key to our success. We also think that by equipping those people with the most advanced tools and technology products, we can make them even more effective and better serve our customers. We recognise that our operating environment and the demands of our customers is evolving constantly, with new routes to market emerging and the amount and type of data we need to interact with constantly increasing. We are proactive in responding to these changes investing in internal expertise, processes and technology as well as seeking to form mutually beneficial external relationships. Our business is highly cash generative with low capital requirements and we have a clear policy in place when It comes to shareholder distributions. We have a core dividend which is set to a level which we believe to be secure under all predictable scenarios, is well covered by earnings and therefore appropriately reflects the cyclicality inherent in our business. We also have a long-standing goal of eliminating the Group’s net debt, and building a net cash position of around £50 million. Once this is achieved, we anticipate that any free cash flow which is generated every year over-and-above this level will be distributed to shareholders, assuming a positive outlook, most likely in the form of a special dividend. 1. Materially increase and diversify Group profits 3. Invest in people and technology, responding to change and build relationships 4. Generate and distribute meaningful cash returns See also our Resources and relationships section where we describe in detail how our values give us a competitive advantage on page 26 Timeline Strategic priority Description Hays plc | 2016 Annual Report and Financial Statements20 OUR STRATEGY
  • 25.
    –– Further expansionof our temp/contracting business, which now represents a material proportion of Group net fee income –– Material increase in the percentage of non-perm net fees generated in the Group, excluding the UK, Germany and Australia (from 22% in 2011 to 33% in 2016) –– Successfully completed the integration of our contractor-focused Veredus business and expanded our footprint in the US by opening one new office –– Three years into the plan period, we are in line with where we expected to be at this stage –– The mix of profitability is different to that which we had assumed, but given the lack of visibility inherent in our business, this was always likely to be the case. In particular, after three years, the UK has outperformed expectations –– So far over the three years to date, we’ve experienced material FX headwinds of £22 million in our International business, but this has been mitigated ahead-of-plan operating performance –– There is material increased uncertainty in the UK market as a result of the vote to leave the EU and this is likely to have an impact on our UK earnings in the current year, though it remains too early to fully assess what that impact may be, and we will continue to monitor activity levels closely –– In our international businesses, where markets remain supportive, we will continue to focus on driving fee and profit growth as we work towards our objectives –– We have continued to develop external relationships across a range of areas, most recently with SEEK in Australia, adding to existing relationships with LinkedIn and Google, amongst others. We discuss this more on page 30 –– We established a dedicated Data Analytics Marketing function, working alongside our existing RD function and Corporate Development teams –– We made further progress with a project to automate our German back office, ensuring it is fit for purpose in a growing contractor business, and could drive further profit efficiencies in our business –– We will continue to explore and develop mutually beneficial relationships and partnerships with other organisations, and further develop our internal capabilities and expertise in terms of data science and analytics, bringing those to bear to improve our business efficiency and service to clients and candidates –– Further explore new and emerging business models to ensure we understand all new market opportunities, and ways to make our own business more effective, as well as potential threats to our existing model –– Strong profit growth and a good underlying cash performance meant that we achieved our long- standing aim of eliminating the Group’s net debt this year, finishing the year with a net cash balance of £36.8 million, ahead of expectations –– We increased the core dividend this year by 5%, with a full year dividend of 2.90 pence, and cover of 2.9x EPS, in line with our policy of building cover towards 3x –– Once core dividend cover reaches 3x earnings, we intend to grow the core dividend in line with growth in earnings –– Build our net cash position to £50 million. Once we achieve this net cash position, it is our intention that any excess cash that is generated over and above this level will be distributed to shareholders, provided our market outlook is positive –– We will focus on organic growth and further investment in headcount where conditions are supportive –– Continue to expand the percentage of net fee income generated outside of our largest businesses (the UK, Germany and Australia) –– Drive further growth in our contracting business in newer markets and invest to grow the US business Core profit drivers These businesses are, and will remain, our largest profit contributors. Germany United Kingdom Australia 0-5 years 0-10 years Ongoing Future material profit drivers Each have the potential to develop into significant profit contributors. France Japan Canada US Meaningful contributors High quality businesses but market size, or reinvestment to drive growth, limits short-term profits. Switzerland New Zealand Belgium China Brazil Mexico Network critical Vital to our global business, serving clients and candidates locally and cross-border and developing people. 20 other countries 1 1 5 1 6 2 2 8 8 7 4 3 What we achieved in FY16 Our objectives for FY17 Link to relevant KPIs Hays plc | 2016 Annual Report and Financial Statements21 OVERVIEW  STRATEGICREPORT  GOVERNANCE  FINANCIALSTATEMENTS  SHAREHOLDERINFORMATION
  • 26.
    We earn feeson a contingent basis, when we successfully place a candidate in a role with a client. These fees, paid by the client, are derived as a percentage of the candidate’s salary. Our consultants develop long-term relationships with clients and candidates to understand their local markets and are equipped with the latest technology, tools and data to match candidates to roles. We understand the needs and challenges of our clients and candidates locally and employ the power of our integrated global business to meet them quickly and effectively. People and culture Hays is the ultimate people business and as such our ability to attract, develop, enable and retain the very best consultants and managers in our industry is vital to our success. For more information go to page 26 Technology and data Our sector-leading global technology platform is able to interact with other applications and third-party technologies to enable our consultants to make sense of the vast amount of data generated in today’s world, source real-time, accurate information on their market and ultimately to get the best candidates to clients faster than anyone else. For more information go to page 29 Brand Our reputation as a world-leader in the specialist recruitment market is supported and reinforced by our world-class global brand, which is consistent in each of our markets around the world. We constantly focus on building and enhancing our reputation by supplementing our core brand with thought-leadership publications, such as The Hays Journal, Hays Global Skills Index, salary guides, white papers and market reports. For more information go to page 30 Relationships and collaborations Our philosophy is to form and maintain strong relationships not only with clients and candidates, but also with other like-minded organisations, creating mutually-beneficial collaborations which help us better understand and serve our customers. For more information go to page 30 Environment and community We believe that what we do makes a big difference to the world around us. We help hundreds of thousands of people every year to secure the next leg on their personal career journey, and companies source the skilled employees they need to grow. This all contributes to the wider growth and success of the economies and communities in which we operate. For more information go to page 31 Our resources and relationships What we need to make our business model work Hays plc | 2016 Annual Report and Financial Statements22 OUR BUSINESS MODEL HOW IT WORKS
  • 27.
    Macr oeconomy Competitiveen vironm ent Recruitment market megatrends Global integrated platform Local expertise and delivery Candidate relationships Understanding client needs Market expertise Data, tools and products Placing people in roles Clients We work closely with our clients to help them find the skilled people they need to drive growth in their businesses. We work with thousands of companies every year, with no single client representing more than 1% of Group net fees. Whether it is local SMEs or global multinationals, we help companies deal with skills shortages in certain markets, whilst reshaping workforces in others. Candidates We help candidates securing their next permanent job or temporary assignment. We connect our candidates with the world of work through an array of events, debates, seminars and networking opportunities across our network of 33 countries. Last year we filled 67,000 permanent jobs and over 220,000 temporary assignments. Employees We invest a significant amount of time and effort to ensure Hays is a great place to work. We offer our consultants the best training to become experts in their market and develop their careers, along with the best technology and tools in the industry to enable them to be as productive and successful as possible. Shareholders We are working towards our objective of building the world’s pre-eminent specialist recruitment business and in doing so we aim to create long-term sustainable value for our shareholders. The breadth, scale and balance of our business model, together with our industry-leading operating leverage, allow us to deliver superior financial performance through the cycle. This, combined with our focus on working capital management and the cash generative nature of our business, means we have the potential to generate meaningful shareholder returns as our business grows. How we create value As the ultimate people business, everything we do is focused on placing the right people into the right roles Stakeholder benefits The value we create not only creates returns for our shareholders, but also for our other stakeholders Hays plc | 2016 Annual Report and Financial Statements23 OVERVIEW  STRATEGICREPORT  GOVERNANCE  FINANCIALSTATEMENTS  SHAREHOLDERINFORMATION
  • 28.
    A balanced anddiverse model We have deliberately and strategically built a business which is balanced and diverse. We have exposure to both more cyclical, mature markets such as the UK and more immature, structural growth markets such as Germany. We are exposed to the temporary, contractor and permanent recruitment markets and have long-established scale and expertise in 20 specialist areas of skilled employment. We have public sector and private sector clients, and work on one-off placements for SMEs and global multi-nationals as well as contract-based higher volume recruitment for our larger clients. The balance, breadth and scale of our business is unique in the world of specialist recruitment. This is a key differentiator, and we believe it is important as it makes our business and its earnings relatively more resilient to today’s ever changing macroeconomic and political landscape. Exposure to mature and less-mature markets Structural growth markets are those where the use of agencies like Hays to source skilled candidates is a relatively new practice. Traditionally in these markets, this recruitment is undertaken by companies themselves, using hiring teams within their own HR functions. A key driver of our growth is therefore the first time outsourcing of this recruitment to third parties. This means that these markets are relatively less cyclical by nature, and less driven by the prevailing economic backdrop, or short-term sentiment. More mature markets are those where the use of agencies is a well established, long- standing norm. Here, clients will use agencies to help them fill roles in the majority of cases. As such, these markets tend to be more cyclical in nature, with activity levels dependant far more on the amount of job churn occurring at any particular time. That is, the confidence of clients to replace leavers in their businesses, or hire extra people, and the confidence amongst candidates to move jobs. We have a business with scale, breadth and diversity of exposure, which is built to take into account the mega- trends driving change in our industry, the short- term market movements we experience and positions us to work towards our long-term aims and strategy. Hays plc | 2016 Annual Report and Financial Statements24 OUR BUSINESS MODEL WHAT IT GIVES US
  • 29.
    17% Public c.15% Top 40 58% Temporary 42% Permanent c.85% Other clients83% Private 22% AsiaPacific 33% UK and Ireland 45% Continental Europe and Rest of World 20% Information Technology 15% Accountancy and Finance 15% Construction and Property 8% Office support 8% Engineering 34% Other Structural/immature 39% Group net fees Cyclical/more mature 61% Group net fees 32% Temp 68% Perm 11% Temp 89% Perm 88% Temp 12% Perm 65% Temp 35% Perm 44% Temp 56% Perm 57% Temp 43% Perm LatAm, Russia CERoW Asia Germany Australia New ZealandFrance, US, Canada Netherlands UK Ireland 0-30% market penetration 30-70% penetration 70% penetration Balanced exposure across markets is key to our model Breadth of expertise Net fees by geography, type and market maturity Hays plc | 2016 Annual Report and Financial Statements25 OVERVIEW  STRATEGICREPORT  GOVERNANCE  FINANCIALSTATEMENTS  SHAREHOLDERINFORMATION
  • 30.
    People and culture Haysis the ultimate people business and our ability to attract, retain and develop the best people is vital to our success. To achieve this we focus on: –– reward, with commission structures to ensure that team and individual contributions are competitively rewarded; –– providing attractive career development paths for new recruits, starting with a structured induction programme and ongoing training as they progress their careers; –– equipping consultants with the latest technology, tools and products and embrace digital technology as an enabler to make them as effective as possible; –– encouraging employees to develop their careers by moving internationally; –– continually investing in our leadership and development programmes which are aligned with the Group’s business strategy. 240 senior managers have now attended our ‘Fast Forward’ and ‘Advanced Management Development’ programmes; and –– promoting a strong sense of corporate social responsibility at Hays. After all, everything we do contributes to finding people jobs, changing people’s lives, and fuelling the wider economy. CSR is embedded in our academically recognised leadership development programme in which a cadre of senior leaders work with a charity to solve real strategic problems. Hays programmes to boost performance and recognise achievement include: –– our international ‘Hays Elite’ competition which rewards the 50 top fee-earners from around the world with company- wide recognition and an all-expenses paid trip to a popular holiday destination; –– our ‘Summer Boot Camp’ where consultants are invited to enlist for a 12-week ‘workout’ and complete designated activities to boost their fees by 20% and qualify for attendance at a prestigious finishing event; and –– monthly themed ‘National Business Development Days’ on which consultants compete to see who can generate the most new business leads. In this section we discuss the drivers of our business: the resources and relationships we have around the world. Achieving our goals requires a mixture of components all working together. Key to our success is our ability to attract the very best talent and provide an attractive career path that will make them experts in their fields. We also equip our consultants with a powerful, global brand and with sector- leading technology tools and products so that they can interact with clients and candidates in multiple ways, using various different channels. Our philosophy is not just to invest in technology solutions, but more importantly to build strong collaborations with leading providers and innovators and influential organisations, creating long-term relationships which help us better understand our markets and serve our customers. All of this is key to enabling our model to function, and our ability to respond to a fast-moving market and deliver on our strategic aims. Formal training days last year 4,000 Hays plc | 2016 Annual Report and Financial Statements26 OUR BUSINESS MODEL OUR RESOURCES AND RELATIONSHIPS
  • 31.
    After spending thefirst three years of my Hays career in the UK, I took the opportunity to move to Australia in 1998, where I worked across various different specialisms, firstly in Sydney and then Perth. After 11 years in Australia, I was promoted to be the Managing Director of our new business in Japan. This was an exciting opportunity, given the relative immaturity of the market there, which is a key strategic growth business for the Group. Since 2012 I’ve seen my role expand to cover the whole of the Asia region reporting into the Group CEO, with the task of overseeing Hays’ organic expansion in one of the most exciting, fast-growing markets in the world. Christine Wright Asia Managing Director, Hays I joined Hays in 2008, as an Associate on the Construction Property desk in Melbourne. Following the acquisition of Veredus, in the US, in 2014, an opportunity arose to establish and build a team focused on the Construction Property market in Orlando, Florida, a large and established Veredus office. I took on a Senior Manager role there, and have responsibility for building a market-leading business in an area which is new for us in the USA, but in which we are expert global leaders across the rest of our Group. It’s also an exciting challenge to take experiences I gained in more established parts of the Group and apply them in a new country for our business. Shen Walker Senior Manager, Hays US My Hays career has taken me across three countries and has been a fulfilling and a varied one. I began in London in 1995, before moving to Dublin a year later to help expand the Irish business. Having proven my capabilities I was quickly promoted to regional manager and I was then asked to join a task force of fee-earners to lead Hays’ entry into the Canadian market in 2001. I then returned to Hays in Ireland in 2004, but not long after that I had the opportunity to return to Canada and make a contribution on a much bigger scale as Managing Director. Rowan O’Grady Canada Managing Director, Hays People and culture case study: ATTRACTING, MOTIVATING AND RETAINING THE BEST PEOPLE AT HAYS. Individuals relocated internationally within our business in the last three years 175 Hays plc | 2016 Annual Report and Financial Statements27 OVERVIEW  STRATEGICREPORT  GOVERNANCE  FINANCIALSTATEMENTS  SHAREHOLDERINFORMATION
  • 32.
    1. 2. 1. Male 6(67%) 2. Female 3 (33%) 1. 2. 1. Male 46 (73%) 2. Female 17 (27%) 1. 2. 1. Male 3,528 (38%) 2. Female 5,686 (62%) Diversity at Hays At Hays, diversity means understanding and reflecting the community in which we operate, building loyalty with our colleagues, candidates and clients. Differences such as age, gender, ethnicity, physical appearance, religion, education and beliefs are valued and everyone has the opportunity to contribute to the Company and fulfil their potential. Respect for people and becoming an ‘Employer of Choice’ are the core values in our approach. Our aim is to create an open, honest and unprejudiced working environment and to ensure that all our colleagues feel part of Hays and are respected as individuals. We value and utilise the differences that our people bring to our business and in the competitive environment in which we operate it is essential that we attract and retain the best people and those that reflect the client and candidate groups we serve. At Hays, our culture is meritocratic; we share a passion for creating opportunities for our people to flourish and succeed, whatever their background. We know that diversity of perspective and an inclusive approach is great for business and careers with us. By reflecting our marketplace and embracing difference we can continue to drive an outstanding organisation culture that impacts business results and delivers world-class service to our customers. Fundamental to our leading expertise is a shared commitment to equality and to harnessing the dynamism that diversity and inclusion bring to our workplace. We were named as one of the Best Places to Work in the UK In the 2016 Glassdoor Employees’ Choice Award we ranked second overall in the Best Places to Work, and the top rated recruiter listed. The Employees’ Choice Awards programme relies solely on the input of employees, who provide feedback on their jobs, work environments and companies via Glassdoor’s anonymous online company reviews survey. Gender diversity within Hays Split of PLC Board members Split of Senior Management team members Split of employees Glassdoor Employees’ Choice Award winners We were named as one of the Best Places to Work in the UK in 2016. No.2 Hays plc | 2016 Annual Report and Financial Statements28 OUR BUSINESS MODEL OUR RESOURCES AND RELATIONSHIPS CONTINUED
  • 33.
    Technology and data Intoday’s digitally-enabled and data-rich world it is essential that we equip our people with the latest technology tools and products to maximise their productivity and to ultimately get the best candidates to clients faster than anyone else. Use of data The amount and variety of data that is being generated in our industry has increased exponentially over recent years. We now receive over six million CVs a year and around three million hits on our jobs websites every month. Capturing, analysing and making sense of this wealth of data has become a strategic imperative. Clients and candidates interact with us in multiple and evolving ways, using various channels and it is part of our philosophy to recognise and quickly respond to these trends. For example, candidate profiles have moved away from traditional printed formats, first to email and now increasingly onto various social media platforms. We have responded to this online world, but equally we recognise that data must be managed in an integrated manner with our own proprietary database, OneTouch, to give us a competitive edge. This is why we ensured that OneTouch was built not only to be fully integrated internally within our business, but that it would also have the ability to interact and connect with external platforms, as they evolve. This not only enables us to have an up-to- date list of active candidates ready to be placed into jobs, but also to maintain relationships with the passive candidate pool. At the heart of our business is the protection of candidate personal data and client confidential information. We respect the trust individuals and companies place in us to look after the information they provide us on a daily basis. Hays has systems and processes in operation to best ensure that this information is held and transferred, where appropriate, in a secure manner. Hays recognises the importance of complying with all relevant data protection and privacy laws in each of our local markets. As well as investing in technology solutions for the front office, we also recognise the importance of having a largely-automated back office, which has driven significant financial benefit to the profitability of the Group. Equally important is having access to our real-time, detailed management information system, which allows management teams to make accurate and timely business decisions. Capturing, analysing and making sense of this wealth of data has become a strategic imperative Hays plc | 2016 Annual Report and Financial Statements29 OVERVIEW  STRATEGICREPORT  GOVERNANCE  FINANCIALSTATEMENTS  SHAREHOLDERINFORMATION
  • 34.
    Key relationships and collaborations Webelieve that it is important to be outward-looking and to develop strong relationships not only with clients and candidates, but also with other organisations, where we see an opportunity to deliver mutual benefit. Our long-standing arrangement with Google allows our consultants to index 20 million documents across 33 countries in real time, giving us a competitive edge when it comes to sourcing the perfect candidate for any given role. Our relationship with LinkedIn means that our consultants have access to LinkedIn’s member database so they can search LinkedIn and our own database, OneTouch, side-by-side. This Cross System Awareness allows us to connect millions of people globally with relevant job opportunities, materials and employment-related content. Most recently, we have partnered with SEEK, the world’s biggest online employment marketplace, to create a leading and innovative position in the use of cloud- computing and data science in the recruiting industry, bringing value to hirers and jobseekers alike. Additionally, we recognise that there are a number of smaller, innovative organisations that are working on developing new technology solutions to challenge and improve the landscape of the recruitment world. We are a committed partner to Seedcamp, a pan European Founder’s First Round Fund, helping to identify and support the next generation of market leaders powering the world of work. Our relationships are not limited to the technology sector however. We have been working with research consultancy Oxford Economics since 2012 to develop the Hays Global Skills Index, an annual Index that looks at the labour market dynamics across 31 countries, giving a clear picture of the dynamics that are playing a role in the global labour markets and the changing nature of the global skills landscape. We have also been a strategic partner of the CBI’s Annual Conference since 2013. The CBI is the UK’s premier business lobbying organisation. Its flagship event, the Annual Conference, attracts over 1,000 influential business professionals and political leaders to discuss the state of the economy and the most critical issues affecting global business today. LinkedIn followers over1.4million Twitter followers 75,000 Facebook likes 80,000 Brand We have focused on building the reputation of Hays as the respected industry standard in the specialist recruitment market, and also as being the leading commentator on issues impacting the world of work. Our brand lies at the heart of everything we do We have been building wider recognition and awareness of Hays as a market leader through partnerships with the CBI and Manchester City Football Club, amongst others, and by building a portfolio of high quality and respected publications that demonstrate the thought-leadership credentials of Hays and our people. These include the Hays Journal, the Hays Global Skills Index as well as white papers and industry-leading content that we publish via our corporate blog, Viewpoint, and on social media platforms such as LinkedIn, where Hays is the most followed recruitment company, with over 1.4 million followers. We believe that establishing a powerful, global brand helps us drive net fee income, as it opens doors for our consultants and makes it easier for them to build relationships. People also aspire to work for the leading brand in any industry sector, so the strength of our brand helps us attract the very best new recruits to join Hays. Hays plc | 2016 Annual Report and Financial Statements30 OUR BUSINESS MODEL OUR RESOURCES AND RELATIONSHIPS CONTINUED
  • 35.
    Environment and community Humanrights At Hays we are committed to our Code of Conduct and Ethics Policy which reflects the way we operate including in relation to human rights. All staff within Hays are expected to act with integrity and honesty and behave in a way that is above reproach, as well as treat people fairly, with courtesy and respect, be responsible, respect diversity and communicate openly. Included in our Code of Conduct is an Equal Opportunity Policy. We make every effort to ensure that no discrimination arises during the recruitment, employment and period after employment of any employee for reasons of gender, sexual orientation, marital status, creed, colour, race, nationality, ethnic or national origin, religious or other belief, political opinion, spent convictions, disability or age, and all employees are expected to deal with all persons with the same attention, courtesy and consideration. This support of equal opportunities applies not only as a direct employer but also in our introduction of candidates to clients. Supplier Code of Conduct We expect our suppliers to operate in an ethical, legally compliant and professional manner. The standards we expect are detailed in our Supplier Code of Conduct, a copy of which can be found on our website, haysplc.com. Community support As the ultimate people business, our employees are keen to support their local communities and charities in any way they can. This effort is operated on local and national levels to great effect through volunteering, fundraising activities and donations. The many activities undertaken during the year include collections and fundraising to provide food for those at risk of social exclusion in Spain and to refugees in Germany; a five city cycle ride, over 700km, in Ireland for charity partner Aware; various sporting and other fundraising activities for Make-A-Wish Australia; supporting young people living with cancer in New Zealand; and funding 6,000 hours of children’s hospice care in the UK for charity partner Together for Short Lives, exceeding our two-year fundraising target in the first year of our partnership. The environment in which we work Hays in the UK has ISO 14001 environmental management certification, which demonstrates our commitment to environmental management. Hays gathers data from every office around the world in order to calculate our greenhouse gas (GHG) emissions in accordance with the World Resources Institute (WRI) Greenhouse Gas Protocol. Our data is independently verified by Carbon Smart Ltd who conduct the verification engagement in accordance with the ISO 14064 part 3 standard with guidance for the validation and verification of greenhouse gas assertions. We measure our annual emissions in relation to employees (our ‘intensity ratio’). As a people-based business, number of employees is a quantifiable factor associated with our activities. Our reporting year for GHG emissions is 1 April 2015 to 31 March 2016, and this year our employee intensity per tonne CO2e was 1.58 (against 1.98 last year). Every day we provide our clients and candidates around the world with industry-leading content, with the aim of helping them to succeed in their careers and source the right talent for their businesses. The key platform which enables us to do this is Viewpoint, our global careers advice blog. Viewpoint currently hosts over 500 blogs, authored by over 30 experts from various fields. Last year, our content generated over 855,000 views and almost 200,000 social shares. By sharing our targeted and relevant content with our audience this way, we are able to both demonstrate the expertise of our people and strengthen the unique positioning of our brand. Impact Scope Resource 2016 2015 Total GHGs (tonnes CO2e)(1) % contribution to total Total GHGs (tonnes CO2e)(1) % contribution to total Direct Scope 1 Operational fuel 245 2 199 1 Vehicle fuel 4,331 28 4,201 24 Refrigerant 344 2 264 2 Indirect Scope 2 Electricity(2) 5,775 38 6,546 37 District heating 396 2 370 2 Scope 3 Air travel 3,219 21 4,569 26 Rail travel 329 2 611 3 Electricity TD losses 570 4 602 3 Private cars (business use) 153 1 377 2 Total direct and indirect 15,362 100 17,739 100 (1) Greenhouse gas emissions are stated in tonnes of CO2e (carbon dioxide equivalent, comprising carbon dioxide, methane and nitrous oxide) for the 12-month period ended 31 March 2016. Out of scope Indirect emissions, which were the biogenic part of vehicle fuels, totalled 167 tonnes of CO2e (106 tonnes in FY15). (2) All electricity totals are calculated using 2015 government location-based conversion factors. Brand case study: BUILDING A BRAND THAT PEOPLE LOVE. Hays plc | 2016 Annual Report and Financial Statements31 OVERVIEW  STRATEGICREPORT  GOVERNANCE  FINANCIALSTATEMENTS  SHAREHOLDERINFORMATION
  • 36.
    2016 2015 2013 2014 7 9 -1 5 2016 2015 2013 2014 83 84 84 85 Our long-term aimis to be the undisputed leader in global specialist recruitment. Along the way, we are focused on delivering well-diversified, profitable and cash- generative net fee growth. We measure our progress in this respect, as well as against our areas of operational focus, using a series of KPIs. Why we have chosen these KPIs We have chosen a range of KPIs which are both financial and non-financial. They are focused on the overall Group financial performance, as well as changes we are making within the Group, such as the internationalisation of the business. As well as growth, we measure KPIs which illustrate the efficiency of our operations, such as the Conversion Rate and Cash Conversion. As we work towards our aims, and the shape and size of our business, or our strategic priorities evolve, then our KPIs will evolve too. Measured against our strategy We clearly link each of our KPIs to our four strategic priorities, which are outlined on page 20. Strategic priority 1: Materially increase and diversify group profits Strategic priority 2: Build critical mass and diversity across our global platform Strategic priority 3: Invest in people and technology, responding to change and build relationships Strategic priority 4: Generate and distribute meaningful cash returns On page 68 we reference how we link our strategic priorities and KPIs to the Group’s remuneration policy. (1) LFL (like-for-like) growth represents organic growth of continuing operations at constant currency. Measure How the Group’s business is developing and growing over time, measured as net fee growth on a constant currency basis. Progress made in 2015–16 We delivered good net fee growth of 7%(1) , primarily driven by our European businesses. The rate of growth slowed versus last year due mainly to slower growth in the UK. Link to relevant strategic priority 1. Like-for-like net fee growth (%) Measure Based on the results of our internal employee engagement survey which tracks their sense of belonging, discretionary effort, personal motivation and job satisfaction. Progress made in 2015–16 Over 80% of our employees again engaged in our annual TALKback survey this year, reflecting our continuous efforts to focus on employee training, retention and effectiveness. See overleaf for more detail on this process. See case study on page 34 Link to relevant strategic priority 5. Employee engagement (%) 1 3 2 Hays plc | 2016 Annual Report and Financial Statements32 KEY PERFORMANCE INDICATORS
  • 37.
    2016 2015 2013 2014 66 64 69 66 2016 2015 2013 2014 128 127 123 127 2016 2015 2013 2014 539 492 497 479 2016 2015 2013 2014 22.3 21.5 17.5 19.4 2016 2015 2013 2014 14 21 -6 19 2016 2015 2013 2014 88 116 109 125 Measure The Group’s relativeexposure to markets which are typically more immature and underpenetrated than the UKI, calculated as the percentage of non-UKI net fees. Progress made in 2015–16 66% of Group net fees were generated outside of the UKI this year, led by a material increase in net fee coming from our European businesses. Link to relevant strategic priority 2. Proportion of Group net fees generated by our international business (%) Measure The productivity of the Group’s fee earners. Calculated as total Group net fees divided by average consultant numbers. Progress made in 2015–16 Group like-for-like(1) net fees per consultants increased by 1% in the year. In the UK productivity rose by 2%, driving excellent operating leverage and profit growth. Link to relevant strategic priority 6. Like-for-like net fees per consultant (£000s) Measure The absolute scale of the non-UKI businesses in net fee terms (Asia Pacific and Continental Europe RoW). Progress made in 2015–16 Like-for-like(1) net fees in the international business grew by 13% in the year. Australia continued to grow, and we saw strong, broad-based growth across many European markets and much of the Americas. Link to relevant strategic priority 3. Headline international net fee base (£m) Measure Calculated as operating profit divided by net fees. Measures the Group’s effectiveness in managing our level of investment for future growth and controlling costs. Progress made in 2015–16 Conversion rate improved to 22.3% as a result of this good net fee growth, the ongoing benefit of our largely automated back office platform and our continued strong control of operating costs. Link to relevant strategic priority 7. Conversion rate (%) Measure The underlying profitability of the Group, measured by the Earnings per share of the Groups continuing operations. Progress made in 2015–16 Basic earnings per share increased by 14% to 8.48 pence, reflecting the Group’s higher operating profit and lower effective tax rate. Growth slowed on last year primarily due to the lower rate of profit growth in the UK. Link to relevant strategic priority 4. Basic continuing earnings per share growth (%) Measure The Group’s ability to convert profit into cash. Calculated as cash generated by operations as a percentage of operating profit from continuing operations. Progress made in 2015–16 88% cash conversion was a result of good working capital management, especially considering the strong growth of our working-capital intensive German contracting business, and the reversal of an FY15 £20 million benefit due to the favourable day on which that year end fell. Link to relevant strategic priority 8. Cash conversion (%) 1 1 1 4 122 3 Hays plc | 2016 Annual Report and Financial Statements33 OVERVIEW  STRATEGICREPORT  GOVERNANCE  FINANCIALSTATEMENTS  SHAREHOLDERINFORMATION
  • 38.
    Employee engagement KPIcase study: SUSTAINING HIGH ENGAGEMENT AT HAYS. Hays plc first implemented TALKback – our global employee engagement survey – in 2009. The survey tracks our employees’ sense of belonging, discretionary effort, personal motivation and job satisfaction. Hays is a cyclical business and constantly exposed to the prevailing economic climate. It is therefore essential that we maintain engagement to ensure retention and productivity. Despite the amount of change that employees have experienced since 2009 for instance with new systems and ways of working, as well as fast changing economic environments, continued high levels of individual engagement and performance have enabled Hays to outperform our competitors and retain our position as the market leader in specialist recruitment services. Employee engagement is a key performance indicator which measures our success in attracting, training and developing people. Therefore a primary objective for Hays has been to sustain this high level of engagement across all regions – a challenge that has spawned a multitude of approaches to achieving ongoing employee commitment and driving performance. Results In 2016 our global engagement score was 83% and employee participation in the annual TALKback survey was 84%, which is an excellent response rate for an international support services business. There is a clear focus on culture, quality of leadership and reward. Hays plc | 2016 Annual Report and Financial Statements34 KEY PERFORMANCE INDICATORS CONTINUED
  • 39.
    1. 3. 4.5. 6. 7.2. 1. Construction Property 21% 2. Accountancy Finance 14% 3. Office Support 11% 4. IT 11% 5. Sales Marketing 6% 6. Resources Mining 3% 7. Other 34% 1. Australia 69% 2. Japan 9% 3. New Zealand 7% 4. China 6% 5. Singapore 4% 6. Hong Kong 4% 7. Malaysia 1% 2. Perm 48%1. Temp 52% 2. Public sector 26%1. Private sector 74% Net fees by specialism 1. 3. 4. 5. 6. 7.2. Net fees by country 1. 2. 1. 2. Net fees by contract type Net fees by sector Facts and figures Hays is the market-leading specialist recruitment company in Australia, having been a pioneer of the industry in the country since 1976. In Asia Pacific, net fees decreased by 1% (but increased 4% on a like-for-like basis(1) ) to £176.1 million and operating profit increased 1% (up 8% on a like-for-like basis(1) ) to £50.2 million, representing a conversion rate of 28.5% (2015: 27.8%). The difference between actual growth and like-for-like growth rates is primarily the result of the depreciation in the average rate of exchange between the Australian Dollar and Japanese Yen versus sterling during the year, which reduced net fees in the division by £9.4 million and operating profits by £3.4 million. In Australia New Zealand net fees were up 4%(1) and operating profit was up 8%(1) . Our Perm business grew by 5%(1) and Temp, which represented 65% net fees in the year, grew by 4%(1) . In Australia we delivered good net fee growth of 5%(1) , with market conditions and performances varying between states and specialisms. Our largest regions of New South Wales and Victoria, which accounted for 56% of Australia net fees, were up 12%(1) , and ACT delivered excellent growth of 21%(1) , driven by continued strength in our public sector business. Western Australia was down 33%(1) as reduced activity in the Resources Mining sector continued to significantly impact trading across the state, although we were sequentially stable in the latter part of the year. Excluding Western Australia, net fees in Australia were up 11%(1) , with activity led by the technical specialisms such as Construction Property, our largest specialism, which was up 9%(1) and IT, up 10%(1) . Overall, our public sector business delivered growth of 18%(1) , while the private sector declined by 2%(1) . Net fees in New Zealand were flat(1) in the year. In Asia, which accounted for 24% of the division’s net fees, we delivered solid net fee growth of 4%(1) and operating profits increased by 10%(1) to £6.2 million. Overall market conditions worsened as the year progressed, particularly in the banking sector. Despite this, net fees increased by 4%(1) in Japan, 12%(1) in China, 3%(1) in Hong Kong and 7%(1) in Malaysia, with all four countries posting record net fees for the year. In Singapore net fees were down 7%(1) . Consultant headcount in the Asia Pacific division increased by 1% year-on-year. Consultant headcount in Australia New Zealand increased by 5%. In Asia, consultant headcount fell by 6% during the year as we responded to more challenging market conditions. Operating performance Year ended 30 June 2016 2015 Actual growth LFL growth(1) Net fees (£m) 176.1 178.5 (1%) 4% Operating profit (£m) 50.2 49.7 1% 8% Conversion rate(2) 28.5% 27.8% Period-end consultant headcount(3) 1,210 1,195 1% (1) LFL (like-for-like) growth represents organic growth of continuing operations at constant currency. (2) Conversion rate is the proportion of net fees converted into operating profit (before exceptional items). (3) Closing consultant headcount as at 30 June. Consultants 1,210 2015: 1,195 Offices 49 2015: 45 Net fees (£m) 176.1 2015: 178.5 Operatingprofit (£m) 50.2 2015: 49.7 Australia delivered good net fee growth led by excellent public sector growth Hays plc | 2016 Annual Report and Financial Statements35 OVERVIEW  STRATEGICREPORT  GOVERNANCE  FINANCIALSTATEMENTS  SHAREHOLDERINFORMATION DIVISIONAL OPERATING REVIEW ASIA PACIFIC
  • 40.
    1. 3. 4.5. 6. 7.2. Net fees by specialism 1. 3. 4. 5. 6. 7.2. Net fees by country/sub-group 1. 2. Net fees by contract type 1. 2 Net fees by sector 1. Germany 48% 2. France 11% 3. Benelux 8% 4. USA 7% 5. Switzerland 5% 6. Canada 4% 7. Other 17% 1. IT 32% 2. Engineering 18% 3. Accountancy Finance 12% 4. Construction Property 9% 5. Life Sciences 7% 6. Sales Marketing 4% 7. Other 18% 2. Perm 38%1. Temp 62% 2. Public sector 3%1. Private sector 97% Facts and figures We entered the German market in 2003 and we have built a business that is today our largest contributor to Group operating profits. It still represents a unique structural opportunity for Hays and our focus remains on making Germany a £100 million operating profit business. In Continental Europe RoW, we delivered excellent net fee growth of 16% (15% on a like-for-like basis(1) ) to £362.5 million, driving strong operating profit growth of 15% (16% on a like-for-like basis(1) ) to £78.7 million. The difference between actual and like-for- like growth rates is primarily the result of the depreciation in the average rate of exchange between the Euro versus sterling, which reduced net fees by £6.9 million and operating profit by £1.1 million. The conversion rate of the division at 21.7% (2015: 21.9%), reduced slightly as we continued to invest in new consultant headcount, notably across several continental European markets, including Germany and France and in the US. In Germany, which represented 48% of the division’s net fees, we saw an acceleration in growth to 13%(1) and an all-time net fee record performance in the year. Growth was strong across Contracting and Temp, which together grew by 12%(1) , while Perm net fees grew by an excellent 24%(1) . We saw strong growth in our newer specialisms, which now represent 27% of Germany net fees, particularly Accountancy Finance, Sales Marketing and Legal which all grew by more than 10%(1) . Net fees in IT, which represents 42% of Germany business, grew by 16%(1) and net fees in Engineering increased by 8%(1) . Consultant headcount was up 11%(3) year-on-year as we invested significantly to continue to build critical mass and scale in our IT and Engineering specialisms as well as expanding our offering to our mid-size client base. Across the rest of the division, net fees were up 17%(1) and operating profit increased by £5.7 million(1) . In France, our second largest country in the division, we grew 17%(1) and posted an all-time record net fees performance, outperforming the market and taking clear market share. In addition, we delivered strong growth and all-time record net fee performances in each of Switzerland, up 19%(1) , Belgium, up 20%(1) and Spain, up 34%(1) . In North America, our US business delivered strong net fee growth of 15%(1) , while our business in Canada was flat(1) , due primarily to continued challenging conditions in the resources-focused regions. In Latin America, Chile, Colombia and Mexico all continued to perform well, delivering strong growth. In Brazil, although market conditions remained challenging, net fees were flat(1) , and we returned to growth in the second half. Within the division, 11 countries delivered net fee growth of 20%(1) or more, and the region as a whole delivered an all-time record net fee performance. Consultant headcount in the division increased by 12%(3) year-on-year, including increases of 11%(3) in Germany and 10% in France. Operating performance Year ended 30 June 2016 2015 Actual growth LFL growth(1) Net fees (£m) 362.5 313.8 16% 15% Operating profit (£m) 78.7 68.7 14% 16% Conversion rate(2) 21.7% 21.9% Period-end consultant headcount(3)(4) 3,034 2,715 12% (1) LFL (like-for-like) growth represents organic growth of continuing operations at constant currency. (2) Conversion rate is the proportion of net fees converted into operating profit (before exceptional items). (3) Closing consultant headcount as at 30 June. (4) Consultant headcount at June 2015 has been restated to include 144 resourcers previously not reported as consultants in Germany and Switzerland. Consultants 3,034 2015: 2,715 Offices 103 2015: 96 Net fees (£m) 362.5 2015: 313.8 Operatingprofit (£m) 78.7 2015: 68.7 Strong broad- based growth across many European markets and much of the Americas Hays plc | 2016 Annual Report and Financial Statements36 DIVISIONAL OPERATING REVIEW CONTINENTAL EUROPE REST OF WORLD
  • 41.
    1. 3. 4.5. 6. 7.2. Net fees by specialism 1. 3. 4. 5. 62. Net fees by region 1. 2. 1. 2. 1. London 35% 2. North Scotland 25% 3. Midlands East Anglia 17% 4. Home Counties 11% 5. South West Wales 9% 6. Ireland 3% 1. Accountancy Finance 21% 2. Construction Property 19% 3. Office Support 11% 4. Education 10% 5. IT 9% 6. Banking Financial Services 9% 7. Other 21% 2. Perm 43%1. Temp 57% 2. Public sector 28%1. Private sector 72% Net fees by contract type Net fees by sector Facts and figures We entered our home market in 1968 and today we are the leading specialist recruiter in what is the world’s most mature and competitive market. In the United Kingdom Ireland we delivered an excellent profit performance, with operating profit up 14%(1) to £52.1 million (2015: £45.7 million) as a result of a combination of further improvements in the productivity of our consultants, which increased by 2%(1) , and active cost control throughout the business. This is despite the fact that net fees were flat(1) at £271.7 million. As a result, the conversion rate of the United Kingdom Ireland increased to 19.2% (2015: 16.8%). Our Temp business decreased by 1%(1) , largely as a result of a more challenging public sector market, while Perm grew 2%(1) . We saw more uncertainty across the UK market, notably in the second half, as increased risks regarding the macroeconomic outlook impacted negatively on private sector sentiment, especially amongst clients. This uncertainty increased in the period leading up to, and immediately after, the EU Referendum and we saw activity levels weaken significantly at the end of the financial year. Against this backdrop, our private sector business, which represented 72% of the division’s net fees, grew 2%(1) , while net fees in our public sector business decreased by 4%(1) as conditions became increasingly challenging in that market, particularly in local Government and Healthcare focused markets. Over the course of the year, London ex-City grew 11%, with mid-single digit growth in Scotland, the North and the Midlands. Our City business was down 3%, with a tough banking market. In Ireland our business delivered excellent net fee growth of 24%(1) . At the specialism level, Office Support delivered good growth of 6%(1) , IT grew 3%(1) while Banking, where markets remain difficult, decreased by 12%(1) . Net fees across the rest of our major specialisms, including Accountancy Finance and Construction Property, performed in line with the overall UK Ireland business and were broadly flat(1) , although we saw trends weakening towards the end of the financial year, particularly in our Construction Property business. Consultant headcount in the division was down 8% year-on-year (average consultant headcount down 2%), all by natural attrition, as we reacted to the decrease in activity levels and focused on consultant productivity, cost control and maximising our UK Ireland financial performance. Operating performance Year ended 30 June 2016 2015 Actual growth LFL growth(1) Net fees (£m) 271.7 271.9 0% 0% Operating profit (£m) 52.1 45.7 14% 14% Conversion rate(2) 19.2% 16.8% Period-end consultant headcount(3) 2,024 2,203 (8%) (1) LFL (like-for-like) growth represents organic growth of continuing operations at constant currency. (2) Conversion rate is the proportion of net fees converted into operating profit (before exceptional items). (3) Closing consultant headcount as at 30 June. Consultants 2,024 2015: 2,203 Offices 100 2015: 99 Net fees (£m) 271.7 2015: 271.9 Operating profit (£m) 52.1 2015: 45.7 Excellent operating leverage drives strong profit growth Hays plc | 2016 Annual Report and Financial Statements37 OVERVIEW  STRATEGICREPORT  GOVERNANCE  FINANCIALSTATEMENTS  SHAREHOLDERINFORMATION UK IRELAND
  • 42.
    Introduction Turnover for theyear to 30 June 2016 was up 10% (12% on a like-for-like basis(1) ) and net fees increased by 6% (7% on a like-for-like basis(1) ). Growth in turnover exceeded growth in net fees due to a large number of MSP contracts won in the year primarily in Germany, where we inherited a large number of long-term contractors/interims previously paid directly by the client. Operating profit increased by 10% (13% on a like-for-like basis(1) ). Exchange rate movements decreased net fees and operating profit by £16.4 million and £4.5 million respectively, primarily as a result of a material depreciation in the average rate of exchange of the major currencies to which the Group has exposure versus sterling, most notably the Australian Dollar and the Euro which remain significant sensitivities for the Group. Operating costs were 5% higher than prior year (5% higher on a like-for-like basis(1) ), primarily due to a rise in commission payments in line with net fees and costs associated with the 6% average increase in Group consultant headcount. For more information on our strategy go to page 20 Performance highlights Strong 13%(1) operating profit growth, with a 40%(1) drop-through of incremental net fees into operating profit Sector-leading conversion rate, the proportion of net fees converted into operating profit, further improved by 80 basis points to 22.3% Consultant headcount up 3%(3) , with targeted investment in markets such as Europe and the USA partially offset by reductions in the UK, all through natural attrition Good underlying cash performance with 88% conversion of operating profit into operating cash flow driving the elimination of net debt, with year-end cash position of £36.8 million Strong EPS growth of 14%, reflecting strong operating profit growth and lower effective tax rate Full year dividend up 5% to 2.90 pence, with cover of 2.9x, in line with our strategy to build cover towards 3.0x earnings Increase in Group net fees(1) +7% 2015: +9% Conversion rate of Group net fees into operating profit(2) +22.3% 2015: +21.5% Increase in operating profit(1) +13% 2015: +25% Group consultant headcount up 3%(3) year-on-year 6,268 2015: 6,113 Hays plc | 2016 Annual Report and Financial Statements38 FINANCIAL REVIEW Paul Venables Group Finance Director
  • 43.
    The Group’s conversionrate, which is the proportion of net fees converted into operating profit, improved by 80 basis points to 22.3% (2015: 21.5%) as a result of this good net fee growth, the ongoing benefit of our largely automated back office platform and our continued strong control of operating costs. Operating profit 2013 2014 2015 2016 125.5 £m 140.3 164.1 181.0 0 40 80 120 160 200 Consultant headcount at the end of June 2016 was 6,268, up 3% year-on-year but down 3% versus December 2015. In our UK Ireland business consultant headcount was down 8% year-on-year, all by natural attrition, as we Net fees in the Temp business, which represented 58% of Group net fees, also increased by 7%(1) . This was driven by an increase in volumes, up 5%, and a 4% increase in the mix/hours worked over the year. Underlying Temp margins(2) were down 20 bps at 16.7% (2015: 16.9%), primarily in Australia New Zealand. Net fees by contract type 2013 2014 2015 2016 % Perm Temp 0 20 40 60 80 100 41% 59% 41% 59% 42% 58% 42% 58% Movements in consultant headcount Consultant headcount ended June at 6,268, up 3% year-on-year. In our Continental Europe Rest of World (RoW) division we increased consultant headcount by 12%(3) year-on-year, including Germany which was up 11% and France which was up 10%. In Asia Pacific, consultant headcount was up 1% year-on-year, within which Australia consultant headcount was up 6%, while in Asia consultant headcount decreased by 6%, mainly in response to challenging conditions in the banking market. In the UK Ireland consultant headcount was down 8%, all by natural attrition, as we focused on consultant productivity and maximising our financial performance. Over the last six months, Group consultant headcount was down 3% (versus December 2015), primarily in the UK. Summary income statement Year ended 30 June (£m) 2016 2015 Actual growth LFL growth(1) Turnover(5) 4,231.4 3,842.8 10% 12% Net fees(5) 810.3 764.2 6% 7% Operating profit from continuing operations 181.0 164.1 10% 13% Cash generated by operations 159.3 189.8 (16%) Profit before tax 173.0 156.1 11% Basic earnings per share 8.48p 7.44p 14% Dividend per share 2.90p 2.76p 5% (1) LFL (like-for-like) growth represents organic growth of continuing operations at constant currency. (2) Conversion rate is the proportion of net fees converted into operating profit (before exceptional items). (3) Consultant headcount at 30 June 2015 has been restated to include 144 resourcers previously not reported as consultants in Germany and Switzerland. (4) The underlying Temp gross margin is calculated as Temp net fees divided by Temp gross revenue and relates solely to Temp placements in which Hays generates net fees and specifically excludes transactions in which Hays acts as agent on behalf of workers supplied by third-party agencies and arrangements where the Company provides major payrolling services. (5) Net fees of £810.3 million (2015: £764.2 million) are reconciled to statutory turnover of £4,231.2 million (2015: £3,842.8 million) in note 5 to the Consolidated Financial Statements. controlled costs in response to worsening market conditions. In our International business, we increased consultant headcount by 9% year-on-year. Foreign exchange Currency movements versus sterling represented a significant headwind for the reported performance in the year. Over the course of the year to June 2016, the total combined operating profit impact of average exchange rate movements was £4.5 million negative. Exchange rate movements remain a material sensitivity and by way of illustration, each 1 cent movement in annual exchange rates of the Australian Dollar and Euro impacts net fees by £0.8 million and £2.5 million respectively per annum; and operating profits by £0.3 million and £0.8 million respectively per annum. The rate of exchange between the Australian Dollar and sterling over the year ended 30 June 2016 averaged AUD2.0392 and closed at AUD1.7877. As at 30 August 2016 the rate stood at AUD1.7421. The rate of exchange between the Euro and sterling over the year ended 30 June 2016 averaged €1.3373 and closed at €1.1989. As at 30 August 2016 the rate stood at €1.1744. The impact of these material movements in foreign exchange rates means that if we retranslate the Group’s full-year operating profit of £181.0 million at current exchange rates, the actual reported result would increase by c.£26 million to c.£207 million. Good growth in both Perm and Temp Net fees in the Perm business increased by 7%(1) , as volumes increased 6%, driven by improved client and candidate confidence, especially in Europe. This was supported by an increase in the average fee per placement of 1%(1) . Another strong financial performance as we delivered excellent operating profit growth Hays plc | 2016 Annual Report and Financial Statements39 OVERVIEW  STRATEGICREPORT  GOVERNANCE  FINANCIALSTATEMENTS  SHAREHOLDERINFORMATION
  • 44.
    Current trading At thisearly stage in our new financial year, we see solid overall net fee growth. In most of our markets, we see many clear opportunities to grow further and we will continue to invest in a targeted way to capitalise on these opportunities. In the UK, following a step down in Perm activity immediately after the EU Referendum, conditions are tough but broadly sequentially stable and it is too early to have a clear view on the extent to which the post-Brexit uncertainty will impact our business in the current financial year. Movements in the rates of exchange of the Group’s key currencies, notably the Australian Dollar and the Euro, remain a material sensitivity to our reported financial performance, and we have seen significant movements since the EU Referendum in the UK. If we retranslate the Group’s full-year operating profit of £181.0 million at current exchange rates, the actual reported result would increase by c.£26 million to c.£207 million. Asia Pacific We continue to see good levels of growth in Australia overall, as market confidence continues to recover gradually. Growth in New South Wales, Victoria and ACT is good, and conditions are stable in the mining- dominated state of Western Australia. We continue to see strong growth in our public sector business and growth is solid in the private sector. In Asia markets such as Hong Kong and Singapore, which have a high exposure to banking, remain subdued. We expect headcount to increase modestly in the first half of the year, mainly in Australia. Continental Europe ROW In Continental Europe RoW, growth remains strong overall, albeit against tough comparators. In Germany and France we continue to see strong growth and in the rest of Europe and the Americas conditions remain strong in most markets. To date, we have seen no evidence of contagion into Europe following the outcome of the EU Referendum. Overall we expect headcount in the division to increase significantly in Germany and France and on a selective basis elsewhere. United Kingdom Ireland In the UK, the market is tough but broadly sequentially stable. We saw a step down in Perm activity immediately after the EU Referendum, but since then activity levels have been broadly stable. In Temp, activity levels have remained broadly at pre- referendum levels. It is too early to determine whether these trends will continue beyond the summer period. We continue to review underlying activity levels, but having taken action to reduce headcount in the last financial year, we expect headcount to remain broadly flat in the early part of the new financial year. See also our divisional operating review on page 35 Net finance charge The net finance charge for the year was £8.0 million (2015: £8.0 million). The average interest rate on gross debt during the period was 2.3% (2015: 2.5%), generating net bank interest payable including amortisation of arrangement fees of £2.9 million (2015: £4.1 million) with the reduction primarily due to the lower levels of average net debt compared to the prior year. The net interest charge on defined benefit pension scheme obligations was £3.9 million (2015: £3.0 million) and the Pension Protection Fund levy was £0.3 million (2015: £0.5 million). The unwind of the discount applied to the future Veredus acquisition liability is recorded within interest, and was £0.9 million (2015: £0.4 million). We expect the net finance charge for the year ending 30 June 2017 to be around £7.0 million. Included within the net finance charge is an unrealised gain of £6.6 million on the derivative current asset, offset by a £6.6 million revaluation loss on the Euro denominated overdraft within the Group’s European cash pool arrangements, the net impact of which is £Nil. There was no such gain in 2015. Taxation Taxation for the year was £51.9 million (2015: £50.7 million), representing an effective tax rate of 30.0% (2015: 32.5%). The effective tax rate reflects the Group’s geographical mix of profits, with the reduction in the rate due to the material improvement of profitability in the UK and the reduction in the UK corporation tax rate. The Group’s effective tax rate for the year to June 2017 will be driven by the mix of profits generated during the year. We currently expect the rate to be between 30% and 35%. Earnings per share Basic earnings per share increased by 14% to 8.48 pence (2015: 7.44 pence), reflecting the Group’s higher operating profit and lower effective tax rate. 2013 2014 2015 2016 5.14 p 6.13 7.44 8.48 0 2 4 6 8 10 Cash flow and balance sheet Good underlying cash performance with 88% conversion of operating profit into operating cash flow (2015: 116%). This was a result of good working capital management throughout the year, especially considering the strong growth in our German and European contracting businesses, which are relatively working capital-intensive, and the reversal of the £20 million cash flow benefit reported in FY15 due to the favourable day upon which that year-end fell. Net capital expenditure was £14.9 million (2015: £11.9 million). We expect capital expenditure to be around £15 million for the year to June 2017. Dividends paid in the year totalled £39.9 million and pension deficit contributions were £14.4 million. Net interest paid was £3.6 million and the cash tax payment was £41.7 million. We eliminated net debt, which stood at £30.7 million at the start of the year, achieving a net cash position of £36.8 million at the end of the year. Closing net cash/(net debt) 2012 2013 2014 2015 2016 (132.9) (105.2) £m (62.7) (30.7) 36.8 -150 -120 -90 -60 -30 0 30 60 Hays plc | 2016 Annual Report and Financial Statements40 FINANCIAL REVIEW CONTINUED
  • 45.
    Operating profit Operating cash flow £159.3m(FY15 £189.8m) £20m FY15 year-end unwind Free cash flow Interest paid Tax paid Working capital Non-cash items 181.0 32.6 (54.3) (41.7) (3.6) 114.0 £m 0 40 80 120 160 200 240 Retirement benefits The Group’s pension liability under IAS19 at 30 June 2016 of £14.3 million decreased by £44.4 million compared to June 2015 primarily due to an increase in asset values, a decrease in the inflation rate and favourable changes in experience and demographics assumptions following the 2015 triennial actuarial valuation, partially offset by a decrease in the discount rate. During the year the Company contributed £14.4 million of cash to the defined benefit scheme (2015: £14.0 million), in line with the agreed deficit recovery plan. The 2015 triennial valuation quantified the actuarial deficit at c.£95 million and the recovery plan comprises an annual payment of £14.0 million from July 2015 with a fixed 3% uplift per year, over a period of just under 10 years. The scheme was closed to future accrual in June 2012. Capital structure and dividend The Board’s priorities for free cash flow are to fund the Group’s investment and development, maintain a strong balance sheet and deliver a sustainable core dividend at a level which is both affordable and appropriate. Taking into account the financial performance of the Group this year and as we build core dividend cover towards 3.0x earnings, the Board proposes to increase the final core dividend by 5% to 1.99 pence, resulting in an increase to the full year dividend to 2.90 pence, also up 5% on the prior year. As such, the full year dividend will be covered 2.9x by earnings. The Board remains committed to this sustainable and progressive dividend policy and will continue to review the core dividend level in line with our stated dividend cover policy. Additionally, we reiterate our policy regarding the uses of excess free cash flow as follows. Once we have built a net cash position in the region of £50 million and assuming a positive outlook, it is our intention that any excess free cash flow generated over-and- above this net cash position, that is not needed for the priorities outlined above, will then be distributed to shareholders via special dividends, or other appropriate methods, to supplement the core dividend. The final dividend will be paid, subject to shareholder approval, on 11 November 2016 to shareholders on the register on 14 October 2016. Treasury management The Group’s operations are financed by retained earnings and bank borrowings. The Group has in place a £210 million revolving credit facility, maturing in April 2020, which provides considerable headroom versus current and future expected levels of Group Operating profit to free cash flow conversion debt. The covenants within the facility require the Group’s interest cover ratio to be at least 4:1 (ratio as at June 2016: 60:1) and its leverage ratio (defined as net debt: EBITDA) to be no greater than 2.5:1 (as at June 2016 the Group held a net cash position). The interest rate of the facility is on a ratchet mechanism with a margin payable over LIBOR in the range 0.90% to 1.55%. The Group’s UK-based treasury function manages the Group’s treasury risks in accordance with policies and procedures set by the Board, and is responsible for day-to- day cash management; the arrangement of external borrowing facilities; the investment of surplus funds; and the management of the Group’s interest rate and foreign exchange risks. The Treasury function does not engage in speculative transactions and does not operate as a profit centre, and the Group does not hold or use derivative financial instruments for speculative purposes. The Group’s cash management policy is to minimise interest payments by closely managing group cash balances and external borrowings. Euro-denominated cash positions are managed centrally using a cash pooling facility which provides visibility over participating country bank balances on a daily basis. Any group surplus balance is used to repay any maturing loans under the Group’s revolving credit facility or is invested in overnight money market funds. As the Group holds a sterling denominated debt facility and generates significant foreign currency cash flows, the Board considers it appropriate in certain cases to use derivative financial instruments as part of its day-to- day cash management to reduce the Group’s exposure to foreign exchange risk. The Group does not use derivatives to hedge balance sheet and income statement translation exposure. The Group is exposed to interest rate risk on floating rate bank loans and overdrafts. It is the Group’s policy to limit its exposure to interest rates by selectively hedging interest rate risk using derivative financial instruments. Counterparty credit risk arises primarily from the investment of surplus funds. Risks are closely monitored using credit ratings assigned to financial institutions by international credit rating agencies. The Group restricts transactions to banks and money market funds that have an acceptable credit profile and limits its exposure to each institution accordingly. Paul Venables Group Finance Director 1 September 2016 Hays plc | 2016 Annual Report and Financial Statements41 OVERVIEW  STRATEGICREPORT  GOVERNANCE  FINANCIALSTATEMENTS  SHAREHOLDERINFORMATION
  • 46.
    Our risk appetite Hayshas a proactive approach to measuring performance and considers risk as an integral part of decision-making, both about current and future performance throughout the global businesses. With the Board being responsible for the level of risk that the Group is willing to accept, the Board manages this by linking risk appetite to its strategic objectives, being mapped against defined impact and likelihood scales, in order to define where the level of risk sits. The principal risks have all been mapped through the risk appetite process in order to identify both position and tolerance levels and to assess the mitigating actions. Hays operates a measured risk appetite position due to the nature of the recruitment market, being a cyclical business and highly sensitive to macroeconomic conditions, which results in a lack of forward visibility of fees and increases the overall risk environment. Risk attributes When considering the risk appetite the Board considers this in terms of the following attributes: –– Experienced and stable management team globally; –– Strong balance sheet, including the level of operational gearing; –– Clear and open communication channels. Risk governance – identifying, evaluating and managing risk The Board has overall responsibility for the Group’s internal control systems and for reviewing their effectiveness. This has been designed to assist the Board in making better, more risk-informed, strategic decisions with a view to creating and protecting shareholder value. In practice, the Board delegates the task of implementing its policy on risk and control to management and needs to assure itself on an ongoing basis that management is responding appropriately to these risks and controls. Managing risks so we achieve our strategic growth targets. We focus on key risks which could impact on the achievement of our strategic goals and therefore on the performance of our business. How we monitor our progress – three lines of defence Board Audit Committee Management Board Ownership Management Monitor Oversight Independent Assurance First line of defence: –– Management Controls –– Policies and Procedures –– Internal Control Measures Second line of defence: –– Financial Control –– Security –– Risk Management –– KPIs –– Compliance –– Group Risk Committee Third line of defence: –– Internal Audit –– External Advisers The Board delegates to management ownership and responsibility for operating risk management and controls, and management need to provide leadership and direction to the employees to ensure the organisation’s overall risk-taking activity is managed in relation to the agreed level of risk appetite. To manage the effectiveness of this the Board and management need to rely on adequate line functions – including monitoring and assurance functions – within the organisation. As such the organisation operates the ‘Three Lines of Defence’ model as a way of explaining the relationship between these functions and demonstrating how responsibilities are allocated: –– The first line of defence – responsibility to own and manage risk; –– The second line of defence – responsibility to monitor and oversee risk; –– The third line of defence – functions that provide independent assurance. The Group Risk Committee, chaired by the Group Finance Director and comprising senior operational, IT, legal and finance representatives, assists in the strategic management of risk in the Group. Risk identification and impact – Hays’ principal risks are analysed on a gross (pre-mitigation) and net (post- mitigation) basis The Management Board oversees an enterprise risk management framework, which allows for a holistic, top-down and bottom-up view of key risks facing the business. These are recorded in a Group risk register, which is reviewed at least annually by the Management Board and submitted to the Board thereafter to enable it to carry out its risk oversight responsibility. This exercise involves a current and forward look at various risks affecting the business and prioritising them according to risk magnitude and likelihood. Risks covered include operational, financial and reputational risks, as well as compliance and people-related risks. Each risk is assigned an owner with current and future risk mitigation procedures detailed, with the continuing monitoring of these undertaken on an ongoing basis. Viability statement In accordance with provision C.2.2 of the UK Corporate Governance Code 2014 the directors have assessed the prospects of the Group over a period longer than the 12 months from the approval of the financial statements. The directors have determined that the three-year period ending 30 June 2019 is the most relevant time period over which to provide the viability statement. This is because it is aligned with the strategic planning cycle and, given the fast moving nature of the industry, using a three-year period it is possible to form a reasonable expectation as to the Group’s longer-term viability. Process to assess the Group’s prospects As in prior years, the Board undertook a strategic business review in the current year taking into account the Group’s current position and the potential impact of the principal risks set out on pages 43 to 45 of the Annual Report. In addition and in making this statement, the Board carried out a robust assessment of the principal risks facing the Group, including those that would threaten the Group’s business model, future performance and liquidity. While the review has considered all the principal risks identified by the Group, the resilience of the Group to the occurrence of these risks in severe yet plausible scenarios has been evaluated. Hays plc | 2016 Annual Report and Financial Statements42 PRINCIPAL RISKS
  • 47.
    Stress testing The Boardapproves an annual budget and reviews monthly management reports and quarterly forecasts. The output of the strategic planning and budgeting processes has been used to perform a sensitivity analysis to the Group’s cash flow to model the potential effects should principal risks actually occur either individually or in unison. The sensitivity analysis included loss of business arising from a prolonged global downturn, material movements in foreign exchange rates, and a detailed assessment of a range of possible outcomes arising from the UK’s vote to leave the European Union. Set against these downside risks the Board considered key mitigating factors including the geographic diversity of the Group, its balanced business model across temporary, permanent and contract recruitment services, and the significant working capital inflows which arise in periods of severe downturn, particularly in the temporary recruitment business, thus protecting liquidity as was the case during the global financial crisis of 2008-09. In addition, the Group’s history of strong cash generation, tight cost control and flexible workforce management provide further protection. The Group also has in place a £210 million revolving credit facility with a suite of banks until 2020, and has recently signed a new actuarial valuation of its defined benefit pension scheme which maintains cash outflows broadly at their existing level. Confirmation of longer-term viability Based on the above assessment the directors confirm that they have a reasonable expectation that the Company will be able to continue in operation and meet its liabilities as they fall due over the three-year period to 30 June 2019. Going concern The Group’s business activities, together with the factors likely to affect its future development, performance and position are set out in the Strategic Report. The financial position of the Group, its cash flows and liquidity position are described in the Financial Review, with details of the Group’s treasury activities, long-term funding arrangements and exposure to financial risk included in notes 18 to 20 to the Consolidated Financial Statements. The Group has sufficient financial resources which, together with internally generated cash flows, will continue to provide sufficient sources of liquidity to fund its current operations, including its contractual and commercial commitments and any proposed dividends. The Group is therefore well placed 1. Macroeconomic/cyclical business exposure Movement in year Risk description The performance of the Group is significantly impacted by changes to underlying economic activity, particularly in the UK, Germany and Australia, the levels of business confidence as businesses consider permanent and temporary hiring decisions and levels of candidate confidence which impact their propensity to change jobs. Risk impact –– Financial Risk mitigation Hays has continued to diversify its operations to include a balance of both temporary and permanent recruitment services to private and public sector markets, and operates across 33 countries and 20 sector specialisms. Progress is being made to further diversify the business to reduce the Group’s reliance on the UK, Germany and Australia, which currently represent 70% of the Group’s net fees. Hays’ cost base is highly variable and carefully managed to align with business activity, and can be focused and scaled accordingly to react to the individual markets, with temporary recruitment being more resilient in times of economic uncertainty or downturn. Hays is highly cash generative, requiring low levels of asset investment. Cash collection is a priority and the Group has made appropriate investment in its credit control and working capital management processes, resulting in the elimination of Group net debt and a year-end net cash positive position. It is too early to have a clear view on the impact of Brexit on our UK business, but its potential to have an impact is fully acknowledged. Link to relevant strategic priority 2 to manage its business risks. After making enquiries, the directors have formed the judgment at the time of approving the financial statements, that there is a reasonable expectation that the Group has adequate resources to continue in operational existence for the foreseeable future. For this reason, they continue to adopt the going concern basis of accounting in preparing the Consolidated Financial Statements. Risk trends The ongoing review of the Group’s principal risks focuses on how these risks may evolve. Since the publication of last year’s Annual Report, our principal risks have changed as follows: Increased risks Risk 1 Macroeconomic/cyclical business exposure The Brexit decision has increased the level of uncertainty and thus risk to the trading performance of our UK business and potentially to the broader European market. Risk 2 Business model The pace of change in social media and internet-enabled digital dynamics, allied to changes in the structure of the professional workforce, is increasing the potential risk of insourcing and disintermediation. Risks 5 and 6 Reliance on technology Data governance The increasing prevalence of cyber attack across the world, means that along with all large corporates, our business systems are under increasing level of attack. Over the last two years as explained in the detailed risk sections, we have invested significantly in this area both in upgrading all aspects of our systems and our internal resources and also using external consultants to perform regular external and internal penetration tests and using the results to drive a continuous improvement programme. Decreased risks While foreign exchange remains a risk to the Group, in light of the assessment under the annual review and the elimination of net debt, it has been removed from the list of the Group’s Principal Risks. Hays plc | 2016 Annual Report and Financial Statements43 OVERVIEW  STRATEGICREPORT  GOVERNANCE  FINANCIALSTATEMENTS  SHAREHOLDERINFORMATION
  • 48.
    Link to relevantstrategic priority 3 Link to relevant strategic priority. 3 Risk description The Group is reliant on its ability to recruit, develop and retain staff to protect the business it has today and to deliver its future growth plans, especially internationally both at a manager and consultant level. Its strategy is to grow and nurture talent internally into senior roles wherever possible. Risk description The Group operates in 33 countries, with each operating its own legislative, regulative, compliance and tax rules, especially for temporary workers, with any non-compliance increasing the Group’s exposure to potential legal, financial and reputational risk. Risk impact –– People –– Financial Risk impact –– Compliance –– Financial –– Reputational Risk mitigation Hays provides a defined and sustainable career development path for new hires, starting with a structured induction programme and ongoing training as they advance their careers, supported by formalised performance and career tracking. Development Centres focus on the progress of high-potential individuals, providing further development opportunities and also helping to identify any talent gaps and training needs. Leadership and development programmes are aligned with the Group’s business strategy. Overall remuneration packages are competitive, including an employee benefit programme, together with a long-term incentive scheme that is offered to some 320 senior managers, which encourages a performance led culture and aids retention. Succession plans identify future potential leaders of the business and produce individual development plans in which to harness and cultivate talent. The Group’s standard employment contracts include notice periods and non-solicitation provisions in the event of an employee leaving. Risk mitigation Compliance processes and monitoring are tailored to specific specialisms, ensuring additional focus is given to higher-risk specialisms such as Education and Healthcare in the UK, Construction Property in Australia and specialised corporate contracts through Hays Talent Solutions. Employees receive training in respect of the operating standards applicable to their role, with additional support provided by compliance functions, regional legal teams and, where necessary, external advisers. All staff receive regular training to ensure that legal and compliance updates are understood and applied. In territories where legislation sets out additional compliance requirements, specialists are employed. Dedicated compliance auditors conduct sample checks to ensure that the appropriate candidate vetting checks and due diligence obligations are carried out in line with legal and contractual requirements. The Group holds all standard business insurance cover, including employers’ liability, public liability and professional indemnity insurance. 4. Compliance Movement in year 3. Talent Movement in year Risk description The Group faces competition from the increasing use of social media for recruitment purposes and a growing trend towards outsourced recruitment models with associated margin pressures, which may impact on the business should Hays not continue to take appropriate actions and respond effectively. Risk impact –– Operational –– Financial Risk mitigation Hays monitors industry trends and opportunities, including social media and insourcing, and continues to invest in our online presence to provide a high-quality customer experience. Our key relationships (such as with SEEK in Australia) increase our exposure to online professional networking and recruitment portals and enhance our value proposition to clients and candidates. Our expert and specialised consultants are trained in utilising social media to enhance their day-to-day activities in providing the best quality candidates for our clients. We continue to leverage our broad geographical and sectoral footprint to win and maintain a significant number of multi-specialism contracts with large corporate organisations, which has strengthened our relationship with these clients and increased our share of their recruitment spend. We have made a significant investment in FY16 to address data analytics in order to significantly improve our candidate acquisition strategy. The initiative is supported by increasing our digital capability with the appointment of a Group Data Marketing Director. Link to relevant strategic priority 3 2. Business model Movement in year Hays plc | 2016 Annual Report and Financial Statements44 PRINCIPAL RISKS CONTINUED
  • 49.
    Link to relevantstrategic priority 3 Risk description Our dependence on technology in our day-to-day business means that systems failure due to technical issues or cyber attack, may have a significant impact on our operations and ability to deliver our services if it continued for a period of days and as such could negatively impact our financial performance and reputation. Risk impact –– Operational –– Financial –– Reputational Risk mitigation The Group’s technology strategy is continually reviewed to ensure that the systems it operates across the Group support its strategic direction. Ongoing asset lifecycle management programmes mitigate risks of hardware and software obsolescence. Technology systems are housed in various data centres and the Group has capacity to cope with a data centre’s loss through the establishment of disaster recovery sites, that are physically based in separate locations to the ongoing operations, intrinsically linked to the country business continuity plans. Across the regions we have established dedicated security teams in order to ensure that the systems are protected from unauthorised access, both externally and internally, and includes ensuring that anti-virus software is in place and up-to-date, with regular testing of these environments by external providers. We use external advisers to perform regular external and internal physical and logical penetration tests on all major systems and operations and implement any required improvements coming out of such tests as part of a continuous improvement process. Link to relevant strategic priority 2 By order of the Board Doug Evans Company Secretary 1 September 2016 Link to relevant strategic priority 3 Risk description The business works with personal data in all 33 countries on a daily basis under a variety of laws and regulations. A material data breach or data loss could expose the Group to potential legal, financial and reputational risks in the form of penalties and loss of business. Risk description The Group enters into contractual arrangements with clients, some of which can be on onerous terms and/or impacted by local regulatory requirements, especially in relation to temp/contracting markets. Risk impact –– Operational –– Financial –– Reputational Risk impact –– Operational –– Financial –– Reputational Risk mitigation Robust procedures for handling, storing and transfer of personal data are in place across the Group, on both a physical and logical security basis. Comprehensive data protection and information security policies and procedures are in place across the Group and, where data protection and privacy legislation allows, protective email monitoring programmes are undertaken to address potential areas of concern, to best protect our confidential information and candidates’ personal data. Attention has been focused in this area, with the increased threat of cyber crime globally, and security vulnerability is assessed as part of the ongoing IT strategy across the Group. Hays is preparing for the implementation of the EU General Data Protection Regulations in May 2018. We use external advisers to perform regular external and internal physical and logical penetration tests on all major systems and operations and implement any required improvements coming out of such tests as part of a continuous improvement process. Risk mitigation During contract negotiations management seeks to minimise risk and ensure that the nature of risks and their potential impact is understood. Our global legal team has the depth of knowledge and experience to enable them to advise management on the level of risk presented in increasingly onerous contracts, with clear guidelines in operation. The Group Finance Director reviews all commercial contracts with onerous non-standard terms in accordance with the Group’s risk appetite. In addition the Group’s Insurance Manager reviews and where necessary engages with insurance providers to ensure that risks are covered. Reviews are performed on a risk basis across key contracts to identify compliance and agree improvements to the way in which we deliver services to clients. Assurance work is undertaken in key countries by Internal Audit to ensure contractual obligations are appropriately managed. 7. Contracts Movement in year 6. Data governance Movement in year 5. Reliance on technology Movement in year Hays plc | 2016 Annual Report and Financial Statements45 OVERVIEW  STRATEGICREPORT  GOVERNANCE  FINANCIALSTATEMENTS  SHAREHOLDERINFORMATION
  • 50.
    Hays plc |2016 Annual Report and Financial Statements46
  • 51.
    Governance How the HaysBoard sets strategic direction and provides oversight and control. In this section: 48 Chairman’s Statement 50 Leadership 56 Relations with shareholders 57 Effectiveness 60 Accountability 64 Remuneration Report 86 Directors’ Report 89 Directors’ responsibilities Hays plc | 2016 Annual Report and Financial Statements47 OVERVIEW  STRATEGICREPORT  GOVERNANCE  FINANCIALSTATEMENTS  SHAREHOLDERINFORMATION
  • 52.
    Dear Shareholder I ampleased to present to you the Governance section of our 2016 Annual Report. The solid corporate governance framework which underpins the way your Board operates is well established, but remains dynamic and adaptable to the ever changing corporate and social landscape we face globally. I am fortunate that I get to visit many of our business locations around the world; within the last financial year as a Board we have visited Japan and Australia, in addition to a number of UK sites, and what is clear from speaking with senior management and leaders across the business is that the same factors are embedded into their modus operandi wherever they are in the world. I and my Board colleagues live by the principles of good governance in the way we operate and endeavour to cascade that in all our dealings with and, on behalf of, the Company, so it is rewarding to see that this culture exists throughout the business. Operating within a robust governance framework, I believe, makes us a stronger business, where we have integrity and respect at the heart of what we do. I am proud that, during the year, the Board have taken decisions that, when considered against broad criteria, have had ethical considerations very much at the forefront, and as such were ones that were felt to be the right fit for our business. 2016 was notable for us as a Board as we undertook an external evaluation of our own performance. What you get out of these exercises is often only a product of what you put in and I was most grateful, as the principal Board ‘sponsor’ of this activity, for the commitment shown by my colleagues to the process and what it was designed to achieve. Further information on the evaluation can be found within the following pages. Richard Smelt retired from the Board at our AGM last year. In December 2015 we were very pleased to welcome MT Rainey as a valuable addition to the Board. MT is an experienced media and marketing professional, who has worked extensively in the UK and US. MT founded the advertising Operating within a robust governance framework makes us a stronger business Hays plc | 2016 Annual Report and Financial Statements48 CHAIRMAN’S STATEMENT Alan Thomson Chairman
  • 53.
    agency Rainey KellyCampbell Roalfe, which she grew to a top 20 agency before it was sold to YR, a subsidiary of WPP plc, and where MT was CEO then Chair until 2005. MT has considerable digital and marketing knowledge and understanding and a strong customer focus and her skill set is a complementary fit to our Board. November 2016 will mark nine years since Paul Harrison was first elected to the Board. During the year we have considered Paul’s independence and regard him not only as independent of character and judgment, but also free of any connections that may lead to conflicts of interest. Paul will therefore stand for re-election at this year’s AGM. As we continue to assess the skills and attributes required to ensure the Board membership has the right mix of skills and knowledge required for the evolving business landscape we’re faced with, we will continue our policy of appointing the most appropriate candidate based on their skills and experience. I look forward to meeting any shareholders who can join us at our AGM in November, and extend my thanks to you all for your continued support as we look forward to the year ahead. Alan Thomson Chairman 1 September 2016 Responsibility for good governance rests with the Board; this is underpinned by an effective governance framework which, the Board believes, fits the requirements of Hays’ business. The Board retains certain matters for its own preserve; other specific responsibilities are delegated to its principal Committees, namely the Audit Committee, the Remuneration Committee and the Nomination Committee. Each of these Committees operates within defined terms of reference, which are available on the Our governance framework Company’s website. The Board has also delegated to a sub-committee certain matters which are routine in nature, or which have been agreed in principle by the Board; such matters require a meeting of three directors, with an appropriate mix of executives and non-executives. Such matters are reported to the full Board. The Chairman of each Committee reports to the Board on its proceedings, and minutes of the meetings are available as appropriate. Hays plc is subject to the UK Corporate Governance Code (the Code) issued by the Financial Reporting Council (available at frc.org.uk), which was published in September 2014. As a listed company, Hays is required to report on how it has applied the principles of the Code and this is set out in the following pages. The Board is pleased to report that Hays has complied with all of the provisions of the Code throughout the year ended 30 June 2016 and to the date of this document. Statement of Code Compliance Board of Directors –– Set standards, values, policies and strategic aims –– Ensures we have the resources in place to meet our objectives –– Monitors and reviews material strategic issues, financial performance and risk management See page 52 Audit Committee –– Reviews and monitors financial statements –– Oversees external audit –– Reviews internal audit plans See page 60 Remuneration Committee –– Sets, reviews and recommends overall remuneration policy and strategy –– Reviews and approves remuneration arrangements for executive directors and senior management See page 64 Nomination Committee –– Makes recommendations to the Board on its composition and that of its Committees See page 57 Chief Executive Management Board –– Day-to-day management of our business and operations, responsibility for monitoring detailed performance of all aspects of our business See page 52 Group Risk Committee –– Provide strategic leadership, direction and oversight of risk See page 55 Hays plc | 2016 Annual Report and Financial Statements49 OVERVIEW  STRATEGICREPORT  GOVERNANCE  FINANCIALSTATEMENTS  SHAREHOLDERINFORMATION
  • 54.
    1. Alan Thomson(69) Non-Executive Chairman Appointed: 1 October 2010 (and as Chairman on 10 November 2010) Committees: Nomination (Chairman) Skills and experience: A post-graduate of Glasgow University and a Chartered Accountant, Alan’s early career was with Arthur Andersen and Price Waterhouse. This was followed by senior management roles with Rockwell International plc, Raychem Ltd and Courtaulds plc, after which he became Finance Director of Rugby Group plc and then Smiths Group plc. Alan is a former Non-Executive Director of Johnson Matthey plc, former Chairman of Polypipe Group plc and a past President of the Institute of Chartered Accountants of Scotland. Principal external appointments: Chairman of Bodycote plc; Non-Executive Director of Alstom SA; Non-Executive Director and Chairman designate of Oxford Instruments plc. 2. Alistair Cox (55) Chief Executive Appointed: 1 September 2007 Skills and experience: A Chartered Engineer with an MBA from Stanford University, Alistair’s early career was in various field engineering, management and research science roles with British Aerospace and then Schlumberger. Following his MBA, Alistair worked for McKinsey Company before joining Blue Circle Industries, where he was the Group Strategy Director and then the Regional Director for Asia. Prior to joining Hays, Alistair was Chief Executive of Xansa plc. Alistair was, until November 2015, a Non-Executive Director of 3i Group plc. A strong team with a broad and complementary mix of skills and experience 3. Paul Venables (54) Group Finance Director Appointed: 2 May 2006 Skills and experience: A Chartered Accountant and also US-qualified, Paul started his career at Deloitte Touche where he was a Senior Manager in its USA practice. This was followed by a 13-year career at Exel plc where he held a number of senior finance and operational roles including Deputy Group Finance Director and was a member of the Executive Board of Exel plc and Chairman of their Acquisitions and Project Review Board. Following the acquisition of Exel plc by Deutsche Post, Paul worked in its DHL Logistics division before joining Hays. Paul was, until July 2015, Senior Independent Non-Executive Director of Wincanton plc. 4. Paul Harrison (52) Senior Independent Non-Executive Director Appointed: 8 May 2007 (and Senior Independent Director on 9 November 2011) Committees: Remuneration (Chairman), Audit and Nomination Skills and experience: Paul trained as a Chartered Accountant with Price Waterhouse. He joined The Sage Group plc as Financial Controller in 1997 and was Group Finance Director from 2000 to 2013. In September 2013, Paul joined WANdisco plc as Chief Financial Officer. Principal external appointments: Paul is also a Non-Executive Director of Ascential plc. Executive Board member Senior Independent Non-Executive Director Non-Executive Director 9 5 3 8 4 6 7 10 12 Hays plc | 2016 Annual Report and Financial Statements50 LEADERSHIP BOARD OF DIRECTORS
  • 55.
    1. Male 67% 2.Female 33% Board diversity 1. 2. 1. 0-3 years 22% 2. 3-5 years 33% 3. 5+years 45% Board tenure 1. Finance 22% 2. Engineering and technology 45% 3. Media and marketing 22% 4. Operations 11% Board experience 4. 1. 2. 3. 1. Non-Executive 67% 2. Chairman 11% 3. Executive 22% Board composition 1. 2. 3. 1. 2. 3. 5. Victoria Jarman (44) Independent Non-Executive Director Appointed: 1 October 2011 Committees: Audit (Chairman), Nomination and Remuneration Skills and experience: An engineering graduate of the University of Leicester and a Chartered Accountant, Victoria started her career with KPMG before moving to Lazard Corporate Finance, where she was Chief Operating Officer of Lazard’s London and Middle East operations and a member of its European Management Committee. Victoria was, until July 2016, a Non-Executive Director of De La Rue plc. Principal external appointments: Victoria is a Non-Executive Director of Equiniti Group plc where she is the Chairman of the Audit Committee and a member of the Risk Committee, and a non-executive adviser to Knight Frank’s group executive board. 6. Torsten Kreindl (53) Independent Non-Executive Director Appointed: 1 June 2013 Committees: Audit, Nomination and Remuneration Skills and experience: A graduate from Johannes Kepler University in Linz, Austria with a PhD in industrial engineering and technical chemistry. Torsten has held senior executive positions for Booz Allen Hamilton and Deutsche Telekom AG and was, until April 2016, a member of the Swisscom AG board. Principal external appointments: He is a partner in Grazia Equity, a Munich-based capital firm. 7. MT Rainey (60) Independent Non-Executive Director Appointed: 14 December 2015 Committees: Audit, Nomination and Remuneration Skills and experience: An experienced media and marketing professional, MT Rainey has worked extensively in the UK and the US. MT founded the advertising agency Rainey Kelly Campbell Roalfe, which she grew to a top 20 agency before it was sold to YR, a subsidiary of WPP plc, and where MT was CEO then Chair until 2005. In addition she was Chair of the leading digital strategy agency Th_nk Ltd from 2008-2015. Previous non-executive directorships held by MT include WH Smith plc and STV Group plc. MT has Masters degrees from Aston University and Glasgow University. Principal external appointments: MT is a Non-Executive Director of Pinewood Group plc and Channel 4 Television. 8. Pippa Wicks (52) Independent Non-Executive Director Appointed: 1 January 2012 Committees: Audit, Nomination and Remuneration Skills and experience: A post-graduate of Oxford University with a diploma in corporate finance from the London Business School, Pippa started her career with Bain Company. She subsequently became Chief Financial Officer of Courtauld Textiles plc and then Chief Executive Officer of FT Knowledge, the corporate training division of Pearson plc. Her previous non-executive directorships have been with Ladbrokes plc, Hilton International plc and Arcadia plc. Principal external appointments: Pippa is presently the Chief Operating Officer of the Co-op Group and Chairman of AlixPartners UK Turnaround and Restructuring. 9. Peter Williams (63) Independent Non-Executive Director Appointed: 24 February 2015 Committees: Audit, Nomination and Remuneration Skills and experience: Peter has a Law degree from Cambridge University and is a Chartered Accountant. He was, until 2011, Group Finance Director of Daily Mail General Trust plc, a role he performed for 19 years, making him one of the longest serving CFOs in the FTSE. Principal external appointments: Since 2011 Peter has been a Non-Executive Director of Perform Group, a leading digital sports media company; he is also a Trustee of the Royal Academy and a member of the Industrial Advisory Board of GVQ Asset Management, a UK equity management company. 10. Doug Evans (53) Company Secretary and General Counsel Appointed: 4 February 2013 Skills and experience: A law graduate from Rhodes University who began his career with Webber Wentzel in South Africa, specialising in corporate and commercial law before moving in-house. Doug has previously held the posts of Company Secretary Corporate Legal Director at Exel plc and Group General Counsel at Royal Mail Limited. Prior to joining Hays, Doug was an Executive Director, Company Secretary General Counsel at Mitchells Butlers plc. Hays plc | 2016 Annual Report and Financial Statements51 OVERVIEW  STRATEGICREPORT  GOVERNANCE  FINANCIALSTATEMENTS  SHAREHOLDERINFORMATION
  • 56.
    The Hays Board Compositionof the Board The Board is currently made up of two executive directors and seven non-executive directors, including the Chairman. Their biographies, including prior experience, are set out on pages 50 and 51. Board changes during the year Richard Smelt retired from the Board at the conclusion of our 2015 Annual General Meeting (AGM); MT Rainey was appointed to the Board in December 2015. Election and re-election of directors at the 2016 AGM In accordance with the Company’s Articles of Association and the principles of the Code, all Directors of the Company will offer themselves for election or re-election at the 2016 AGM. Having received advice from the Nomination Committee, the Board is satisfied that each director is qualified for election or re-election by virtue of their skills, experience and commitment to the Board. Operational governance The Management Board Responsibility for the day-to-day management of our business and operations rests with the Chief Executive, who operates through the Management Board – the principal executive committee within Hays. In performing this role, the Management Board also has responsibility for monitoring detailed performance of all aspects of our business. The Management Board, which meets monthly, is chaired by the Chief Executive and also comprises the Group Finance Director, the Company Secretary General Counsel, the Chief Marketing Officer, the Group Technology Director and the Managing Directors of the Group’s three main operating divisions and is attended by the Group Head of People and Culture. Each Management Board member has a clearly defined remit, business objectives and financial budget within which they operate. Our organisational structure is built around three regions globally: UK Ireland; Continental Europe Rest of World; and Asia Pacific. Regional Managing Directors operate their business through regional boards, which comprise key business and functional managers with specific responsibilities within those regions. Each business is given operational autonomy, as far as possible, within a well- established internal control framework which consists of, among other things, a Group-wide set of policies and procedures, operational delegated authorities and policies on anti- bribery and corruption, competition compliance, conduct and ethics, and whistleblowing. The role of the Hays plc Board The Board is collectively responsible to the Company’s shareholders for the long-term success of the Company. It sets the Company’s strategic objectives and determines the risk appetite and control framework within which those objectives are achieved. The Board provides effective oversight of the Company and its businesses within a robust governance structure that helps achieve the long-term success of the Company and deliver sustainable shareholder value. The Board also provides leadership of the Company and direction for management, ensuring that the necessary resources are in place for the Company to meet its objectives and it keeps under review management’s performance in regard to achieving those objectives. Our aim is to be the world’s pre-eminent specialist recruitment business. In pursuit of that aim, our employees across the globe work towards achieving our Strategic Priorities, set out on page 20. The Board closely monitors management and its delivery of a sustainable and profitable business, ensuring it continues to operate within the appropriate risk-reward culture. The Board has established a core set of values, which it adheres to and promotes throughout the Group. These values, which underpin our skills, behaviours and way of doing business, are being ambitious, being passionate about people, being expert at what we do and being inquisitive about the world of work. These values serve to engender an entrepreneurial culture within Hays, which is critical to our continued success without promoting excessive risk-taking. Role of the Non-Executive Directors Hays’ non-executive directors have a broad and complementary mix of business skills, knowledge and experience acquired across sectors and geographies. This allows them to provide strong, independent and external perspectives to Board discussions, which complement the skills and experience of the executive directors. In turn, this leads to a diversity of views being aired at Board meetings, robust and constructive debate and optimal decision-making. At the same time, it also reduces the likelihood of any one perspective prevailing unduly. A key role performed by the non-executive directors is the scrutiny of executive management in meeting agreed objectives and monitoring the reporting of performance. They also ensure that financial controls and systems of risk management are both rigorous and appropriate for the needs of the business. The terms and conditions of appointment of non-executive directors, including the expected time commitment, are available for inspection at the Company’s registered office, and a pro forma letter of appointment is also available on the Company’s website. During the year, the Board considered the independence of each of the non-executive directors, save for the Chairman who was deemed independent by the Board at the date of his appointment. In doing so, it concluded that each non-executive director remained independent of management and free from any relationship that could interfere with the exercise of their independent judgment. In making the assessment, the Board recognised that 15 November 2016 will represent nine years since Paul Harrison was first elected by shareholders; notwithstanding the length of his tenure, the Board believe Paul Harrison continues to demonstrate independence of thought and judgment and as such the Board will continue to deem him independent for the purposes of the Code. All of Hays’ directors are expected to act in the best interests of the Company. Chairman and Chief Executive The roles of the Chairman and Chief Executive are separate, with a clear division of responsibilities between them which is set out in writing; the responsibility for this separation of duties rests formally with the Board. As Chairman, Alan Thomson presides over the Board and is responsible for its leadership and overall effectiveness. In doing so, he fosters and helps to maintain an effective working relationship between the executive and non-executive directors. As Chief Executive, Alistair Cox has responsibility for the day-to-day management of the Company’s business and the implementation and delivery of the Board strategy. This separation of roles enhances the independent oversight of executive management by the Board and more closely aligns the Board with shareholders. It also means that no one individual within the Company has unfettered powers of decision making. Hays plc | 2016 Annual Report and Financial Statements52 LEADERSHIP CONTINUED
  • 57.
    Senior Independent Director TheBoard appointed Paul Harrison to the position of Senior Independent Director on 9 November 2011. In performing this role Paul provides shareholders with someone to whom they can turn if ever they have concerns which they cannot address through the normal channels, for example with the Chairman or executive directors. Similarly, as Senior Independent Director Paul is available as an intermediary between his fellow directors and the Chairman. While there were no requests from directors or shareholders for access to the Senior Independent Director during the year, the role serves as an important check and balance in Hays’ governance process. In the fulfilment of his role Paul ensures he maintains a thorough understanding of the views of the Company’s shareholders. Key roles and responsibilities of these positions, and that of the Company Secretary, are provided opposite.   Matters reserved for the Board A schedule of formal matters reserved for the Board’s decision and approval is available on our website, haysplc.com. These largely relate to matters of governance and business where independence from executive management is important, and include the following: –– Approving financial results and other financial, corporate and governance matters; –– Approving Group strategy; –– Approving appointments to the Board; –– Approving and recommending dividends as appropriate and deciding dividend policy; –– Reviewing material litigation; –– Approving major capital projects, acquisitions and disposals; –– Approving material contracts; –– Reviewing annually the effectiveness of internal control and the nature and extent of significant risks identified by management and associated mitigation strategies; and –– Approving the annual budget. No changes to the schedule of matters were made during the year. Board decisions are usually by consensus at Board meetings. On occasion, decisions may be taken by a majority of Board members. In the case of an equality of votes, Hays’ Articles of Association provide the Chairman with a second or casting vote. Alan Thomson Non-Executive Chairman –– Leadership and the effective operation of the Board –– Chairing the Board and Nomination Committee –– Setting the agenda, style and tone of Board discussions including promoting openness, debate and effective individual contribution –– Ensuring that all directors receive clear and accurate information on a timely basis –– Ensuring the effectiveness of the Board through induction, ongoing training and regular evaluations –– Effective communications with shareholders Paul Harrison Senior Independent Director –– Acting as a sounding board for the Chairman –– Serving as an alternative contact and intermediary for other directors and shareholders –– Leading the Chairman’s annual performance appraisal and ultimate succession Alistair Cox Chief Executive –– Day-to-day management of the Group’s business –– Formulating strategic business objectives for Board approval and implementing approved strategic objectives and policies –– Managing and optimising the operational and financial performance of the business in conjunction with the Group Finance Director –– Fostering a good working relationship with the Chairman –– Chairing the Management Board and developing senior talent within the business for succession planning Key roles and responsibilities Board commitment The Board has established a policy permitting its executive directors to hold only one external non-executive directorship, subject to any possible conflict of interest. This ensures that executive directors retain sufficient time for and focus on the Company’s business, whilst allowing them to gain external Board exposure as part of their leadership development. Executive directors are permitted to retain any fees paid for such services. Details of the annual rate of fees payable to each of the executive directors for their tenure during the year ended 31 March 2016 (the year-end date of the relevant companies) are shown below: Director Fee External appointment Alistair Cox* £80,000 3i Group plc Paul Venables** £53,000 Wincanton plc * Stepped down as a non-executive director on 10 November 2015. ** Stepped down as a non-executive director on 16 July 2015. While the Company does not have a similar policy for non-executive directors, their key external commitments are reviewed each year to ensure that they too have sufficient time commitment for the fulfilment of their Board responsibilities. Key external commitments of the Board are included within their biographies on pages 50 and 51. The Board considered the commitments of the Chairman and is satisfied that he has sufficient time to devote to his Board responsibilities with Hays. Doug Evans Company Secretary and General Counsel –– Acting as Secretary to the Board, its Committees and the Management Board –– Providing legal and governance support to the Board as a whole and directors individually –– Ensuring that the Group complies with all relevant legal, regulatory and governance requirements Hays plc | 2016 Annual Report and Financial Statements53 OVERVIEW  STRATEGICREPORT  GOVERNANCE  FINANCIALSTATEMENTS  SHAREHOLDERINFORMATION
  • 58.
    1. Developing asuccessful strategy 30% 2. Ensuring appropriate financial management 30% 3. Implementing governance and ethics and monitoring risk 25% 4. Stakeholder engagement 15% Percentage of time spent by the Board 1. 3. 4. 2. Board focus during 2016 – What the Board has done in the year 1. Developing a successful strategy –– Attended a Group strategy day, with members of the Management Board and other senior executives, to consider key strategic priorities and challenges faced across the business –– Approved the Group strategy and reviewed associated performance –– Visited operations in Australia, Japan and the UK, receiving presentations from senior management on business performance, the state of the market, strategy, succession planning and opportunities –– Reviewed strategy plans and received reports on the operational performance for the Group’s regions –– Received reports on technology and innovation and related industry developments –– Reviewed Group risk 2. Ensuring appropriate financial management –– Received and considered regular reports on the Group’s financial performance –– Approved financial announcements for publication –– Approved the annual budget –– Approved dividend policy, payments and recommendations as appropriate, including consideration of a special dividend –– Reviewed and approved the Group’s refinancing of its new revolving credit facility –– Met with the Company’s financial adviser and corporate brokers –– Considered ad hoc property and finance-related transactions 3. Implementing governance and ethics and monitoring risk –– Performed the annual review of the effectiveness of internal control and the nature and extent of risks identified together with mitigation plans –– Reviewed regular reports on legal and compliance matters from the Company Secretary –– Received formal training updates on corporate reporting, legal and regulatory matters –– Reviewed Board and Committee effectiveness –– Reviewed and approved minor changes to the terms of reference of the Board Committees –– Reviewed the Directors’ Conflicts of Interest procedures –– Reviewed the Company’s compliance with the Code –– Received updates and reviewed procedures in connection with the implementation of the Market Abuse Regulation 4. Stakeholder engagement –– Considered the results from TALKback, the Group’s employee engagement survey –– Considered and approved invitations under the Company’s all-employee share plans –– Received regular updates on views and feedback from investors –– Considered the Company’s investor relations strategy –– Considered and reviewed the leadership and development strategy –– Reviewed the Group’s succession plans and assessed risks and options Information and support The Board meets regularly throughout the year and agrees a forward calendar of matters that it wishes to discuss at each meeting. Standing items, including operational, functional and financial reviews and Committee updates are considered at each scheduled Board meeting, with unplanned items such as commercial or property-related decisions being considered as and when required. The Chairman, in conjunction with the Chief Executive and Company Secretary, plans the agenda for each Board meeting and ensures that supporting papers are clear, accurate, timely and of sufficient quality to enable the Board to discharge its duties. All Board directors have access to the Company Secretary, who advises them on Board and governance matters. As well as the support of the Company Secretary, there is a procedure in place for any director to take independent professional advice at the Company’s expense in the furtherance of their duties, where considered necessary. Our culture Hays is a people business and people are at the core of what we do. As such we foster a meritocratic and entrepreneurial culture, which is reflected in our four brand values of: –– Expert –– Ambitious –– Passionate about People; and –– Inquisitive To support this culture we maintain an open style of communication, which is designed to both identify issues early, and also to recognise potential opportunities, so that in both cases appropriate action can be taken in terms of reducing any negative impact on the business whilst ensuring opportunities are exploited. These characteristics and brand values are core to our Group culture and are supported via the following mediums and underpinned by the Hays Group Policies and Procedures: –– Corporate communications –– Global intranet –– Hiring, induction, training and promotion criteria Hays plc | 2016 Annual Report and Financial Statements54 LEADERSHIP CONTINUED
  • 59.
    Board attendance The Boardmet a total of seven times during the year. In addition, the Board attended an annual Strategy Review meeting with the Management Board being present. Six Board meetings were held in the UK and one in Sydney, Australia. Board and Committee attendance for scheduled meetings during the year are shown below. Board and Committee attendance Board Audit Committee Nomination Committee Remuneration Committee Alan Thomson 7 of 7 – 4 of 4 – Alistair Cox 7 of 7 – – – Paul Venables(1) 6 of 7 – – – Paul Harrison 7 of 7 4 of 4 4 of 4 4 of 4 Victoria Jarman 7 of 7 4 of 4 4 of 4 4 of 4 Torsten Kreindl 7 of 7 4 of 4 4 of 4 4 of 4 MT Rainey(2) 3 of 3 2 of 2 1 of 1 2 of 2 Richard Smelt(3) 3 of 4 2 of 2 1 of 2 2 of 2 Pippa Wicks(4) 7 of 7 4 of 4 2 of 4 4 of 4 Peter Williams 7 of 7 4 of 4 4 of 4 4 of 4 (1) Unable to attend one Board meeting due to a prior commitment. (2) Appointed 14 December 2015. (3) Retired from the Board on 11 November 2015. Unable to attend one Board and Nomination Committee meeting due to a prior commitment. (4) Unable to attend two Nomination Committee meetings due to prior commitments. Risk management and internal control The Board has overall responsibility for the Group’s internal control systems and for reviewing their effectiveness. This has been designed to assist the Board in making better, more risk-informed, strategic decisions with a view to creating and protecting shareholder value. In practice, the Board delegates the task of implementing its policy on risk and control to management. Further support and assistance is provided by an independent Internal Audit function, details of which are provided in the Audit Committee Report. The Management Board oversees an enterprise risk management system which allows for a holistic, top-down and bottom- up view of key risks facing the business. These are recorded in a Group risk register, which is reviewed at least annually by the Management Board and submitted to the Board thereafter to enable it to carry out its risk oversight responsibility. This exercise involves a current and forward look at various risks affecting the business and prioritising them according to risk magnitude and likelihood. Risks covered include operational, business and compliance risks as well as financial risks. Each risk is assigned an owner with current and future risk mitigation procedures detailed, with the continuing monitoring of these undertaken on an ongoing basis. The principal risks currently facing the business are detailed in the Strategic Report. The Group Risk Committee assists the Management Board in providing strategic leadership, direction, reporting and oversight of the Group’s risk framework. The Committee is chaired by the Group Finance Director and membership includes representation across the global network and comprises operational, IT and finance functions. Meetings are held three times a year, with activities and recommendations reported to the Management Board. The Hays plc Board also has oversight of the Committee and its activities. The Board reviews the Group strategy and approves a budget for the organisation each year, to ensure that the performance of the business is in line with the plan and financial and operating reporting procedures are in place. Comprehensive annual budgets and forecasts are approved by the Management Board and business divisions. Monthly progress and variances are reported to the Management Board and subsequently to the Board at each meeting as part of the control process. Complementing these financial controls is a set of Group-wide policies and procedures addressing non-quantifiable risks. These include the Group’s Code of Conduct and Ethics, Anti-Bribery and Corruption Policy, and whistleblowing arrangements. The Board regularly receives management and Committee reports which also form part of the internal control system. The Group’s internal control procedures are subject to regular review and provide an ongoing process for identifying, evaluating and managing significant risks. This is in accordance with the Guidance on Risk Management and Internal Control and Related Financial and Business Reporting (September 2014). The Board recognises that such a system has its limitations in that risk management requires independent judgment on the part of directors and executive management. Internal controls are designed to manage rather than eliminate the risk of failure to achieve business objectives, and can provide only reasonable and not absolute assurance against material misstatement or loss. In accordance with its regulatory obligations, the Board, with the assistance of the Audit Committee, carried out an annual assessment of the effectiveness of the Group’s risk management and internal control system during the reporting period. During the course of its review, the Board did not identify or hear of any failings or weaknesses that it determined to be significant and it therefore concluded that they are operating effectively. Conflicts of interest Procedures are in place for the disclosure by directors of any interest that conflicts, or possibly may conflict, with the Company’s interests and for the appropriate authorisation to be sought if a conflict arises, in accordance with the Company’s Articles of Association. In deciding whether to authorise a conflict or potential conflict of interest only those directors that have no interest in the matter under consideration will be able to take the relevant decision; in taking such a decision the directors must act in a way they consider, in good faith, will be most likely to promote the success of the Company and may impose such limits or conditions as they think fit. The Board has reviewed the procedures in place and considers that they continue to operate effectively. There were no actual or potential conflicts of interest which were required to be authorised by the Board during the year under review or to the date of this report. Hays plc | 2016 Annual Report and Financial Statements55 OVERVIEW  STRATEGICREPORT  GOVERNANCE  FINANCIALSTATEMENTS  SHAREHOLDERINFORMATION
  • 60.
    1. United Kingdom53% 2. Continental Europe 28% 3. North America 19% Geographic breakdown of investor meetings 1. 2. 3. Engagement with investors Responsibility for shareholder relations rests with the Chairman, Chief Executive and Group Finance Director. They ensure that there is effective communication with shareholders on matters such as governance and strategy, and are responsible for ensuring that the Board understands the views of major shareholders on such matters. The Company’s investor relations programme is supported by a dedicated Investor Relations team which acts as the primary point of contact with the investor community and is responsible for managing ongoing relations with investors and shareholders. The Board receives regular reports from the Investor Relations team. Feedback from meetings held between executive management, or the Investor Relations team, and institutional shareholders is also reported to the Board. As a part of a comprehensive investor relations programme, formal meetings are scheduled with investors and analysts to discuss the Group‘s interim and final results. In the intervening periods, Hays continues its dialogue with the investor community by meeting key investor representatives, holding investor roadshows and participating in conferences. Meetings with debt providers, principally the Company’s banks, also take place on a regular basis. During the year, the executive directors and senior management met with almost two hundred institutions around the world, interacting with shareholders and potential shareholders. Presentations to analysts are posted on the Company’s website at haysplc.com and if you would like to know more about our relations with shareholders please contact ir@hays.com. As a reflection of the success of Hays’ investor relations efforts, Hays was ranked No. 3 in the 2016 Extel Survey for best investor relations by a listed company in the European Support Business Services category. Within the survey, Alistair Cox, Paul Venables and David Walker were also ranked in the top three of their respective categories of best Chief Executive Officer, best Chief Financial Officer and best IR Professional. Additionally, the Hays investor relations team ranked No. 3 in the equivalent 2016 Institutional Investor Survey, within which Alistair Cox, Paul Venables and David Walker ranked in the top two spots of their respective categories. Investor meetings held in FY16 United Kingdom Continental Europe North America Total Alistair Cox 34 18 18 70 Paul Venables 78 43 23 144 Investor Relations team 127 68 47 242 Other senior management 17 4 5 26 Annual General Meeting The Board uses the Company’s AGM to communicate with investors and welcomes their participation. All shareholders are entitled to attend the AGM, at which the Board members are present. The Board views the AGM as a good opportunity to meet with its smaller, private shareholders. A summary presentation of results is given by the Chief Executive before the formal business of the meeting is conducted. All shareholders present can question the Chairman, the Chairmen of the Committees and the rest of the Board both during the meeting and informally afterwards. The Notice of AGM and related papers are sent to shareholders at least 20 working days before the meeting. Voting on all resolutions at the AGM is by means of a poll, which, reflecting the number of voting rights exercisable by each member, is considered by the Board to be a more democratic method of voting. As soon as practicable following the conclusion of the AGM, the proxy votes cast, including details of votes withheld, are announced to the London Stock Exchange via the Regulatory News Service and published on our website. Hays plc | 2016 Annual Report and Financial Statements56 RELATIONS WITH SHAREHOLDERS
  • 61.
    Main Committee activitiesduring the financial year Role of the Nomination Committee The role of the Committee is summarised below and detailed in full in its terms of reference, a copy of which is available on the Company’s website (haysplc.com) under Corporate Governance. The main responsibilities of the Committee are to: –– Review the structure, size and composition (including skills, knowledge, experience, diversity and balance of executive and non-executive directors) Membership and meetings –– Considered Board succession plans –– Reviewed the composition of the Board and its Committees –– Reviewed the Committee’s terms of reference The Committee is appointed by the Board. It is chaired by the Chairman of the Board and comprises the non-executive directors, all of whom are independent, save for the Chairman who was independent on appointment. The names and qualifications of the Committee’s current members are set out in the directors’ biographies on pages 50 and 51. August 2015 October 2015 November 2015 May 2016 Number of scheduled meetings in FY16 Committee member Meeting attendance FY16 Alan Thomson (Chairman) Paul Harrison Victoria Jarman Torsten Kreindl MT Rainey(1) Richard Smelt(2) Pippa Wicks Peter Williams (1) MT Rainey was appointed to the Board on 14 December 2015. (2) Richard Smelt retired from the Board on 11 November 2015. –– Considered the appointment of a further non-executive director –– Considered and recommended the election and re-election of each director, as appropriate, at the AGM Dear Shareholder The Nomination Committee has continued to support the Board during the year in ensuring its composition has the right balance of skills, experience, independence and knowledge to best serve the business and fulfil the Board’s responsibility to shareholders in the ever-changing environment in which the Company operates. An ongoing area of focus for the Committee is succession planning. As Chairman of both the Committee and the Company, I am acutely aware of the need to ensure there are no gaps in skills or experience as Board members reach the end of their relevant terms, whether three years, six years, or longer. Paul Harrison will reach the ninth anniversary of his election by shareholders to our Board shortly after this year’s Annual General Meeting in November. The Committee have considered carefully whether there are any factors, circumstances or relationships, that could be considered to compromise Paul’s independence and it concluded that he remains independent in character and judgment. I am therefore delighted that Paul has agreed to remain as a non-executive director at Hays plc for a further year. Planning for his succession, and that in future years of fellow directors, continues. With Richard Smelt having retired during the year, the Nomination Committee worked on the profile of the individual required to be The Committee meets as required and did so on four occasions during the year and all members were in attendance except Pippa Wicks who could not attend two meetings and Richard Smelt who could not attend one meeting, due to prior commitments. Other regular attendees at Committee meetings include the Company Secretary and, on invitation, the Chief Executive and Group Finance Director. recruited to fill that vacancy and also to ensure the Board has the right skills and experience to fulfil the Board’s aim for Hays to be the world’s pre-eminent specialist recruitment business. The Zygos Partnership was appointed to facilitate the appointment of MT Rainey, who was appointed by the Board on 14 December 2015, and we will continue to work with them as we consider further opportunities as vacancies arise. of the Board and its Committees and make recommendations to the Board with regard to any changes; –– Consider succession planning for directors and other senior executives; –– Identify and nominate for the approval of the Board, candidates to fill Board vacancies; and –– Keep under review the time commitment expected from the Chairman and the non-executive directors. Ongoing succession planning remains an area of focus for the Committee Board appointments will continue to be made on merit, and the Committee recognises the benefits of diversity and, provided we remain true to our key principles, we will aim to build on our existing diverse composition in the future. Alan Thomson Nomination Committee Chairman 1 September 2016 Hays plc | 2016 Annual Report and Financial Statements57 OVERVIEW  STRATEGICREPORT  GOVERNANCE  FINANCIALSTATEMENTS  SHAREHOLDERINFORMATION EFFECTIVENESS NOMINATION COMMITTEE REPORT Alan Thomson Chairman of the Nomination Committee
  • 62.
    Non-executive director appointmentprocess The Company adopts a formal, rigorous and transparent procedure for the appointment of new directors and senior executives with due regard to diversity. Prior to making an appointment, the Committee will evaluate the balance of skills, knowledge, experience and diversity on the Board and, in light of this evaluation, will prepare a description of the role and capabilities required, with a view to appointing the best-placed individual for the role. In identifying suitable candidates, the Committee uses open advertising or the services of external advisers to facilitate the search and considers candidates on merit and against objective criteria and ensuring that appointees have sufficient time to devote to the position, in light of other significant commitments, and no conflicts of interest. A long-list of potential candidates would be drawn up, from which an appropriate number would be shortlisted for interview based upon their fulfilment of the appointment criteria. The Committee would then recommend to the Board the appointment of the preferred candidate (or candidates, if there is more than one considered suitable) for subsequent appointment. During the year the Committee retained The Zygos Partnership in respect of MT Rainey’s appointment and they remain engaged as further non-executive director appointments are considered. The Zygos Partnership is an independent executive search consultancy and it has no other connection with the Company. In the year ahead, the Committee will continue to assess the Board’s composition and how it may be enhanced and will consider diversity (gender and experience) and geographic representation and continue to use independent consultants as appropriate to ensure a broad search for suitable candidates. Board composition is routinely reviewed to ensure that the balance of skills, knowledge and experience of the Hays Board remains appropriate to its business. Hays’ Group policy is to hire the best candidates for all positions at all levels throughout the business, irrespective of gender, including candidates at Board level. Board induction and development On appointment, each director takes part in a tailored and comprehensive induction programme which is designed to give him or her a deep understanding of the Company’s business, governance and stakeholders. Elements of the programme include: –– Senior management briefings to provide a business overview, current trading conditions and strategic commercial issues; –– Meetings with the Company’s key advisers and major shareholders, where necessary; –– Business site visits across regions; –– A legal and regulatory briefing on the duties of directors of listed companies; –– Details of the Group corporate structure, Board and Committee structures and arrangements, and key policies and procedures; and –– The latest statutory financial reports and management accounts. The Board has not set any specific aspirations in respect of gender diversity at Board level and supports fully the Code principles in respect of diversity. However, the Board is of the view that diversity is less about quotas, and recognises the benefits of diversity, of which gender is one aspect, and it will continue to ensure that this is taken into account when considering any particular appointment, whilst ensuring appointments are made on merit and ability to enhance the performance of the business. Succession planning A key task of the Committee is to keep under review the Company’s succession plans for members of the Board over the short, medium and longer term, to ensure the Board remains appropriately balanced between new and innovative thinking and longer-term stability. The focus during the 2016 financial year has been on identifying a suitable replacement for Richard Smelt, as well as planning for the succession of other Board members. Board appointment criteria are considered automatically as part of the Committee’s approach on succession planning. The Committee believes that limited tenure and the subsequent enforced retirement of directors is not always appropriate for sound business leadership. Accordingly, matters of director tenure are viewed on a case-by-case basis. At present, the Board has not set any specific aspirations in respect of gender diversity though it believes that refreshment of the Board should take into account the need to consider diversity in all forms. Tenure of non-executive directors Appointments to the Board are made for initial terms not exceeding three years and are ordinarily limited to three such terms in office. Director performance Having reviewed the independence and contribution of directors, the Committee confirms that the performance of each of the directors standing for election or re-election at the 2016 AGM continues to be effective and demonstrates commitment to their roles, including independence of judgment, commitment of time for Board and Committee meetings and any other duties. Accordingly, the Committee has recommended to the Board that all current directors of the Company be proposed for election or re-election, at the forthcoming AGM. The Board has a clear understanding of its role and interacts effectively with management The Chairman, in conjunction with the Company Secretary, ensures that directors are provided with updates on changes in the legal and regulatory environment in which the Company operates. These are incorporated into the annual agenda of the Board’s activities along with wider business and industry updates; the Chairman also keeps under review the individual training needs of Board members. The Company’s principal external advisers provide updates to the Board, at least annually, on the latest developments in their respective fields, and relevant update sessions are included in the Board’s strategy meetings. The Company Secretary presents corporate governance reports to the Board as appropriate, together with any relevant technical directives issued by the Company’s auditor. In this way, each director keeps their skills and knowledge current so they remain competent in fulfilling their role both on the Board and on any Committee of which they are a member. Hays plc | 2016 Annual Report and Financial Statements58 EFFECTIVENESS CONTINUED
  • 63.
    Board evaluation During the2016 financial year in accordance with Code Provision B.6.2, the effectiveness of the Board was assessed through an external Board evaluation process, conducted by ICSA Board Evaluation (ICSA). ICSA has no other connection with the Company (the Company uses ICSA Software Limited for entity management and Board portal solutions). One-to-one meetings were held between the ICSA evaluator and the directors and the Company Secretary. During the meetings, seven broad topics were considered and the evaluator ensured that pre-defined constituent elements of each topic were covered to ensure consistency in the evaluation. The topic areas were Board responsibilities, oversight, meetings, Board support, Board composition, working together and outcome and achievements. Committee effectiveness was also assessed separately. Results were presented to the Board by the external evaluator and areas for improved operation identified and agreed. The outcome of the evaluation, with few recommendations being made and which are discussed below, indicated that the Board is performing well. The report noted that the Board has a clear understanding of its role and responsibilities and fulfils its oversight role effectively. The interaction by the Board with management is effective and within the Board itself the executive and non-executive members engage well. The division of responsibilities between the Chairman and Chief Executive are well understood and matters that are reserved to the Board are considered appropriate and regularly and properly reviewed. Board composition was considered to be well balanced in terms of both numbers and the executive to non-executive ratio. Whilst Board membership has evolved with the Company, the need to remain dynamic in addressing the needs of the business moving forward was acknowledged. In terms of working together, the Board is considered cohesive, with an open style and no one individual or group dominating and displays good chemistry. Support for the Board is considered to be a strength and the relationship between the Company Secretary and the Board is good. Access to professional advice is readily available and Board members receive regular updates on legal and regulatory matters, with the Chairman taking a close interest in Board education and Board development generally. Whilst the Board calendar had undergone some change in recent years, it was considered that further refinements could be made to improve performance generally. The Board continues to refine its approach to risk, as identified in prior evaluations, and the executive’s steps in this area had brought matters more into focus for the Board. One area of recommendation for the Board as part of the evaluation was to consider what measures could be taken to enhance its reviews of the effectiveness of the risk management process. Consideration was given to the further review of risk either within the Board or Audit Committee calendar or, as suggested, through the establishment of a separate Board risk committee. The Board did not consider that this would be necessary or appropriate at this time. In addition to the Board and Committee evaluation, the Chairman evaluated the individual performance and effectiveness of each director. The Senior Independent Director led a separate appraisal of the Chairman’s performance with his fellow non-executive directors, which took into consideration both the executive and non-executive directors’ views. Hays plc | 2016 Annual Report and Financial Statements59 OVERVIEW  STRATEGICREPORT  GOVERNANCE  FINANCIALSTATEMENTS  SHAREHOLDERINFORMATION
  • 64.
    The Audit Committeehas supported the Board in ensuring the Annual Report is fair, balanced and understandable; in ensuring the integrity of the Group’s financial statements and the effectiveness of internal control, shareholders are in turn able to assess the Company’s performance, business model and strategy. Dear Shareholder I am pleased to present to you the Audit Committee report prepared in accordance with the 2014 edition of the Code. We have revised the Committee’s Terms of Reference to bring them in line with the 2016 edition of the Code, under which it is operating for future financial years. You will be aware from prior years’ Reports that we committed to undertake a full tender of the Company’s external audit contract this year, which commenced in early 2016. Following a comprehensive process the Committee recommended to the Board that PwC be put forward to shareholders for appointment at the Company’s 2016 AGM. I would like to record my thanks to all those involved in the process, including the unsuccessful tenderers, as the time and effort invested by all was significant. On behalf of the Company my thanks also go to Deloitte for their role as the Company’s auditor over many years. In some way a reflection of the world in which we live, the Committee has spent time during the year assessing the potential for, and impact of, the various forms of cybercrime that may befall us. As a company, technology is very important to us and the way we operate, but technology also represents a significant risk and it is important we keep on top of such risks and the Committee, along with the Board, keep this very much in focus. On the subject of risk, I am pleased with the progress being made by the Group Risk Committee. The Committee provides oversight of the Company’s enterprise risk management framework and continues to be satisfied that the Board maintains sound risk management and internal controls. Another aspect of the Committee’s work this year, also touching on the risk landscape, has been in supporting the directors in their assessment of the long term viability of the Company for the purposes of the Code. The work built on the existing robust process we have in place around risk assessment and mitigation and will hopefully provide shareholders with further comfort in the way the Company is managed and operated. Role of the Audit Committee The Committee’s terms of reference are available on the Company’s website (haysplc.com) under Corporate Governance. The key responsibilities of the Committee are to: –– Monitor the integrity of the financial statements of the Company, including annual and half year reports, interim management statements, and other formal announcements relating to its financial performance, and reviewing and reporting to the Board on significant financial reporting issues and judgments; –– Where requested by the Board, review the content of the Annual Report and advise the Board whether, taken as a whole, it is fair, balanced and understandable and provides the information necessary for shareholders to assess the Company’s performance, business model and strategy; –– Recommend to the Board for approval by shareholders, the appointment, reappointment or removal of the external Auditor; –– Monitor the relationship with the Company’s external Auditor, including consideration of fees, audit scope and terms of engagement; –– Review the effectiveness and objectivity of the external audit and the Auditor’s independence; –– On engagement of the external Auditor, review the policy for the provision of non-audit services and monitor compliance; –– Monitor and review the Company’s internal control and risk management systems; –– Monitor and review the effectiveness of the Company’s Internal Audit function; and –– Ensure compliance with laws, regulations, ethical and other issues, including that the Company maintains suitable arrangements for employees to raise concerns in confidence. Technology is very important to us but can also present significant risk In addition to discharging its financial reporting, internal control and risk management responsibilities, including supporting the Board in ensuring the Annual Report, as a whole, is fair, balanced and understandable, during the course of the year the Committee also considered, amongst other matters, audit effectiveness (both internal and external), non-audit services policy and the Group’s whistleblowing policy and procedures. Further detail on the Committee’s activities during the year under review is provided below, which I hope will provide shareholders with the necessary information for them to assess the Company’s performance, business model and strategy. Victoria Jarman Audit Committee Chairman 1 September 2016 Hays plc | 2016 Annual Report and Financial Statements60 ACCOUNTABILITY AUDIT COMMITTEE REPORT Victoria Jarman Chairman of the Audit Committee
  • 65.
    Main Committee activitiesduring the financial year Membership and meetings –– Approved the annual Committee programme –– Reviewed financial results for publication –– Considered the external audit plan and reviewed the results of the audit –– Approved the internal audit plan and reviewed its findings –– Reviewed the new requirements relating to external auditor appointments and audit partner rotation –– Undertook a tender process for the selection of the external audit –– Reviewed the non-audit services provided by the external auditor –– Reviewed the risk management and controls framework and its effectiveness, together with the Group’s principal risks –– Considered all aspects of IT operations and risks including cyber –– Reviewed the performance and effectiveness of the external auditor –– Reviewed the performance and effectiveness of the internal audit function The Committee is appointed by the Board from its independent non-executive directors. Biographies of the Committee’s current members are set out on pages 50 and 51. August 2015 November 2015 February 2016 May 2016 Number of scheduled meetings in FY16 Committee member Meeting attendance FY16 Victoria Jarman (Chairman) Paul Harrison Torsten Kreindl MT Rainey(1) Richard Smelt(2) Pippa Wicks Peter Williams (1) MT Rainey was appointed to the Board on 14 December 2015. (2) Richard Smelt retired from the Board on 11 November 2015. The Chairman of the Committee and its financial expert, Victoria Jarman, is a Chartered Accountant, who also chairs the Audit Committee of Equiniti Group plc. All Committee members are financially literate. The Committee discharges its responsibilities through a series of scheduled meetings during the year, the agenda of which is linked to events in the financial calendar of the Company. The Committee met four times during the financial year and all members were in attendance at all meetings during their tenure. The Committee commissions reports, either from external advisers, the Head of Internal Audit, or Group management, as required, to enable it to discharge its duties. The Group Finance Director and the Group Financial Controller attend its meetings, as do the external Auditor and the Head of Internal Audit, both of whom have the opportunity to meet privately with the Committee Chairman, in the absence of Group management. The Chairman of the Board and the Chief Executive are also invited to, and regularly attend, Committee meetings. –– Reviewed the Group’s whistleblowing arrangements –– Carried out a review of the Committee’s effectiveness and reviewed progress on matters arising from previous assessments –– Considered the Code requirements concerning fair, balanced and understandable reporting –– Considered the Company’s long-term viability –– Recommended the Audit Committee Report for approval by the Board –– Reviewed senior finance personnel across the Group –– Held discussions with the external auditor and the Head of Internal Audit without management being present Annual Report review In addition to its work described here, the Committee has reviewed the financial and narrative disclosures in this year’s Annual Report. It has advised the Board that, in its view, taken as a whole, the Annual Report is fair, balanced and understandable and provides the information necessary for shareholders to assess the Group’s performance, business model and strategy. Fair, balanced and understandable In making its recommendation to the Board that the Annual Report, taken as a whole, is fair, balanced and understandable, the Committee’s robust governance approach, included: –– Comprehensive Group and subsidiary accounts process, with written confirmations provided by the regional senior management teams on the health of the financial control environment; –– Reviews of the Annual Report undertaken at different levels of the Group and by the senior management team that aim to ensure consistency and overall balance; –– External audit review; –– Clear guidance and instruction of the requirement provided to contributors; –– Written confirmation that information provided has been done so on a fair and balanced basis; –– Additional scrutiny by senior management; and –– Additional reviews by the Committee Chairman of the draft Annual Report in advance of the final sign-off in the context of the revised Code provision. Final sign-off is provided by the Board, on the recommendation of the Committee. Significant issues considered during the year In reviewing both the half and full year financial statements, the following issues of significance were considered by the Committee and addressed as described. These matters are described in more detail in note 3 to the Consolidated Financial Statements. Debtor and accrued income recoverability The recoverability of trade debtors, accrued income and the level of provisions for bad debt are considered to be areas of significant judgment due to the pervasive nature of these balances to the financial statements and the importance of cash collection in the working capital management of the business. The Committee considered the level and ageing of debtors and accrued income, together with the appropriateness of provisioning, by reviewing previous experience of bad debt exposure and the consistency of judgments made year-on- year. The Committee was satisfied that the level of provision and the carrying value of debtors and accrued income is appropriate. Hays plc | 2016 Annual Report and Financial Statements61 OVERVIEW  STRATEGICREPORT  GOVERNANCE  FINANCIALSTATEMENTS  SHAREHOLDERINFORMATION
  • 66.
    As reported previously,the Committee has undertaken a full tender of the Company’s external audit contract. The Committee is pleased to report that the Board has approved the proposed appointment of PricewaterhouseCoopers LLP as the Company’s auditor for the coming financial year. This appointment remains subject to approval by shareholders at the next Annual General Meeting. The Competition and Markets Authority Statutory Audit Services Order 2014 sets out certain regulations in respect of audit tendering and appointments and related audit committee responsibilities which came into effect for financial years commencing on or after 1 January 2015. The Company has complied with the provisions of the Order for the financial year ended 30 June 2016. Auditor Independence and Non-Audit Services Policy The Committee believes that the issue of non-audit services to Hays is closely related to external Auditor independence and objectivity. The Committee recognises that the independence of the external Auditor may reasonably be expected to be compromised if they also act as the Company’s consultants and advisers. Having said that, the Committee accepts that certain work of a non-audit nature is best undertaken by the external Auditor. To keep a check on this, the Committee has adopted a policy to ensure that the provision of any non-audit services by Deloitte does not impair its independence or objectivity. The key features of the non-audit services policy are as follows: –– The provision of non-audit services provided by the Company’s external Auditor be limited to a value of 70% of the average audit fees over a three-year period; –– Any non-audit project work which could impair the objectivity or independence of the external Auditor may not be awarded to the external Auditor; and –– Delegated authority by the Committee for the approval of non-audit services by the external Auditor is as follows: Authoriser Value of services per non-audit project Group Financial Controller Up to £25,000 Group Finance Director Up to £150,000 Audit Committee Above £150,000 Deloitte’s fee in respect of its 2016 financial year audit of Hays was £0.9 million. Accordingly, the maximum value of non- audit services that Deloitte could have been engaged by Hays to provide during the financial year 2016 was £0.7 million. The total audit fee for non-audit services provided by Deloitte during the 2016 financial year was £0.7 million (2015: £0.4 million). The main components of the £0.7 million non-audit services were as follows: –– Half year review: £0.1 million; –– Taxation compliance: £0.1 million; and –– Tax advice and other services: £0.5 million, of which £0.3 million related to a transfer pricing project. Tax advice and other services include the completion of a comprehensive review of our transfer pricing framework to enhance existing arrangements such that the Group will continue to conform to best practice under OECD guidelines. The Group’s existing arrangements are well known to Deloitte both in the UK and globally. This, together with the expertise within the firm, meant that they were best placed to partner us in this piece of work. No single non-audit project undertaken by Deloitte during the 2016 financial year exceeded £302,000. The Company did not pay any non-audit fees to Deloitte on a contingent basis. A summary of the fees paid to the external Auditor is set out in note 6 to the Consolidated Financial Statements. Having reviewed Hays’ non-audit services policy this year, the Committee is satisfied that adequate procedures are in place to safeguard the external Auditor’s objectivity and independence. Effectiveness of the external Auditor The annual effectiveness review was conducted under the guidance of the Committee Chairman, on behalf of the Committee, and covered amongst other things a review of the audit partners, audit resource, planning and execution, Committee support and communications, and Deloitte’s independence and objectivity. Overall feedback was positive with resulting improvements, which were largely country- specific, discussed and implemented. On the basis of this review, the Committee was satisfied with the performance of Deloitte in the fulfilment of its obligations as external Auditor and of the effectiveness of the audit process. Revenue recognition The main areas of judgment in revenue recognition relate to (i) cut-off as we recognise permanent placement income on the day a candidate starts work, and temporary placement income over the duration of the placement; and (ii) the recognition of temporary contractual arrangements where we act as principal on a gross basis rather than net basis. The Committee discussed and reviewed these areas with both management and the Auditor and remains satisfied that Group accounting policies with regard to revenue recognition have been adhered to and that judgments made remain appropriate. Goodwill The Committee assessed the carrying value of goodwill by reviewing a report by management which set out the values attributable to each cash-generating unit (CGU), compiled using projected cash flows based on assumptions related to discount rates and future growth rates. The Committee also considered the work undertaken by Deloitte and management’s sensitivity analysis on key assumptions. In the case of Veredus the Committee considered the disclosure in respect of this CGU. After discussion, the Committee was satisfied that the assumptions used were appropriate. Pension accounting Pension accounting is complex and contains areas of significant judgment, most notably those in respect of the discount and inflation rates used in the valuation of the net deficit disclosed in note 22. The Committee reviewed the pension items, including those relating to the adoption of IAS 19 Employee Benefits (Revised), by discussing a report prepared by management based on work performed by the Company’s actuary which set the key assumptions used in the calculation of the deficit and related income statement items. The Committee also considered the work performed by Deloitte’s specialist pension team in testing the assumptions and was satisfied that the assumptions used and the disclosures in the financial statements are appropriate. External Auditor Both the Committee and the Board keep the external Auditor’s independence and objectivity under close scrutiny, particularly in regard to its reporting to shareholders. Deloitte LLP has been the external Auditor of the Group since listing in October 1989. Professional rules require that the Company’s audit partner at Deloitte be rotated every five years; the current lead partner, Stephen Griggs, was appointed following the 2011 year-end results. Hays plc | 2016 Annual Report and Financial Statements62 ACCOUNTABILITY CONTINUED
  • 67.
    Risk management andinternal control The Board is responsible for the adequacy and effectiveness of the Group’s internal control system and risk management framework, which in order to fulfil its responsibilities the Board has delegated authority to the Committee. In order to establish an assessment from both a financial and operational control perspective, the Committee looks to the work of the Internal Audit function, specifically to consider whether significant process and control weaknesses are identified, improved and monitored and that risks have been identified, evaluated and managed. The Committee considered the Group’s risk assessment process, which included coverage across the regions, businesses and functions within the Group, primarily IT and treasury, reviewing the effectiveness of the risk methodology employed, the risk mitigation measures implemented and future risk management and monitoring. Internal Audit The Committee oversees and monitors the work of the Internal Audit function, which reviews key controls and processes throughout the Group on a rolling basis, including resources, scope and effectiveness of the function. The Group Head of Internal Audit has direct access to the Committee, and meets regularly with both the Committee and its Chairman without the presence of management to consider the work of Internal Audit. The Committee approved the programme of work for the Internal Audit function in respect of the 2016 financial year, which was focused on addressing both financial and overall risk management objectives across the Group. During the year, 39 Internal Audit reviews were undertaken, with the findings reported to both the Management Board and the Committee, with recommendations tracked and progress subsequently reported back to the Committee. No significant weaknesses were identified as a result of risk management and internal control reviews undertaken by Internal Audit during the reporting period. The Committee believes that the Group’s enterprise risk management framework needs to continue to evolve in accordance with the growth of the Hays’ business around the world. Throughout the financial year the Internal Audit team has continued to enhance the enterprise risk management framework and work with the Group Finance Director and the operating companies across the globe to further develop and embed the framework methodology at a local level. The formation of a Group Risk Committee chaired by the Group Finance Director and comprising senior operators from each region will assist in the management of risk in the Group. Raising concerns at work The whistleblowing procedure in place across the Group ensures that employees are able to raise any concerns about any possible improprieties in business practices, or other matters, in confidence; this is managed and reported through an external third party. The disclosures under this arrangement are investigated promptly by Internal Audit and escalated to the Management Board and the Committee as appropriate, with follow-up action being taken as soon as practicable thereafter. The Committee, as part of its overall review of the Group’s system of internal control, reviewed the procedures in place during the reporting period and is satisfied that they are appropriate to the size and scale of the Group. Anti-bribery and corruption Hays has a zero-tolerance approach to bribery and corruption. The Group Anti- Bribery and Corruption Policy (with specific reference to the UK Bribery Act 2010) is issued to all employees. Overall responsibility for, and oversight of, the Policy lies with the plc Board. Training is provided to all employees annually in local languages and ongoing support is provided when and where necessary. In addition, risk assessments are carried out on an ad hoc basis, for example when new countries are under consideration (whether they are considered to be low or high risk) or prior to entry into new public sector markets. The Committee reviewed the effectiveness of the Policy during the year and concluded that it was sufficient for managing the anti-bribery and corruption risks faced by the Group. Audit Committee effectiveness The Committee considered its effectiveness in discharging its duties during the year. The Committee looked at the work it had carried out during the year and considered that its performance during the year was effective when measured against its terms of reference and general audit committee best practice. Details of the main activities of the Committee and its role and responsibilities have been detailed earlier in this Report. The Chairman of the Committee will be available at this year’s AGM to answer any questions on the work of the Committee. Hays plc | 2016 Annual Report and Financial Statements63 OVERVIEW  STRATEGICREPORT  GOVERNANCE  FINANCIALSTATEMENTS  SHAREHOLDERINFORMATION
  • 68.
    performance indicators togetherwith longer-term strategic initiatives, and take into account Group risk. We also consider the relationship between executive reward and the reward structures in place for other Group employees. The Committee is always mindful to ensure the strength of the link of performance to reward and that it does not reward for failure. A Remuneration Policy fit for the future and long-term sustainability of the business In December 2015, the Committee began an in-depth review of the overall executive remuneration policy and structure with a view to ensuring that it is still fit for purpose in light of our future strategy over the coming years and the continuing cyclical nature of our business. While we have a diversified portfolio designed to try and mitigate any substantial swings in business performance by embracing both temporary and permanent candidate placements, wide-ranging business specialisms and a global geographical footprint, we nevertheless are subject to the volatility and vagaries of the economic markets which can create sudden changes within the recruitment industry. In recent months, this has manifested itself through the general uncertainty triggered by the ‘Brexit’ referendum in the UK and wider global unrest underpinned by changes in countries’ political leadership and general instability in certain geographical areas. In looking to the future therefore, the Committee wants to ensure that our reward structure and remuneration policy complement our future strategy and incentivise our executives to ensure the long-term sustainability of our business in a challenging environment. Shareholder consultation and support on any proposed changes are very important to us This important review of the Remuneration Policy, which is mentioned above, will continue during FY17, with the Committee being mindful that the next shareholder binding vote on our Remuneration Policy is due at the November 2017 AGM. We strongly value the support of our shareholders and are very aware of the views and guidelines issued by investor bodies on corporate governance, remuneration structures and good practice. The Committee will take into consideration the ongoing debate on executive pay, together with publications issued on these subjects, and will ensure that it allows the appropriate time to discuss and consult with our shareholders should the Committee decide to seek future changes to the Policy. The Committee is committed to an open and honest dialogue in this respect. The main objective of the Remuneration Committee is: To promote the long-term success of the Company by attracting, motivating and retaining highly skilled executives, while strongly advocating and ensuring a culture of high performance and sound values linked to appropriate reward. During 2016 the Committee: Began an in-depth review of the executive remuneration structure in order to determine whether the current policy will continue to complement our future strategy and recognises the challenges relating to the cyclical nature of our business. The Committee’s priorities and actions for FY17 are: To continue the review of the executive remuneration structure in preparation for the next shareholder binding vote on the Executive Remuneration Policy at the FY17 AGM. The Committee will ensure adequate time for appropriate consultation and discussion with shareholders if any changes are felt to be required. To conduct a full tender for an independent adviser to the Committee as a result of PwC stepping down with effect from 30 June 2016 due to their successful bid to be our independent external Auditor. This is the third year in a row that Hays has delivered strong profit performance. Such strong results, allied to outperformance in Hays’ share price over the last three years relative to its competitors, has directly contributed towards the reward outcomes for the executive directors both in the annual and long-term incentives, as will be covered below. Our executive reward for 2016 reflects these strong results and links pay to performance Annual Bonus Annual Bonus awards reflected the 2016 performance and were 65.76% of the maximum award (82.20% of base salary) for the CEO and the CFO. Maximum opportunity was 125% of base salary. 40% of each award will be deferred into shares for three years. 2013 Performance Share Plan (‘PSP’) The 2013 PSP vested at 85.59% of the award (149.78% of salary out of a maximum of 175%) reflecting the three-year performance period that ended on 30 June 2016. Full details of the executive directors’ remuneration for 2016 can be found in the Single Figure on page 70 and the full Annual Report on Remuneration on pages 70 to 85. The Committee takes very seriously its duty to exercise judgment and ensure outcomes are reflective of the Company’s underlying performance and shareholder experience. No discretion on any element of remuneration was exercised during FY16. Remuneration for FY17 The executive directors received base salary increases of 2.0% effective from 1 July 2016. This was in line with the average pay increase for other UK relevant employees. Executive directors will receive an FY17 PSP grant of 175% of base salary which will vest in 2019 dependentontheperformancecriteriabeingmet. Our Chairman’s fee and the base fee for the other non-executive directors (NEDs) were also increased by 2.0% from 1 July 2016. Details of the Chairman’s and NEDs’ fees can be found on page 83. Our Committee activities During 2016, the Committee formally met four times as well as maintained ongoing dialogue via email or telephone discussion. Our key regular agenda items include reviewing the basic pay, bonus and PSP awards for the executive directors and other senior executives. The Committee ensures that their targets and objectives are suitably stretching, include the principal Company financial Dear Shareholder I am pleased to introduce our Directors’ Remuneration Report for 2016. Our business continues to deliver strong results 2016 has been another strong year for Hays. With our markets outside of the UK broadly supportive, management invested to drive good growth of 7% in net fees and, through effective operational management and strong cost control especially in the UK, delivered strong operating profit leverage, with profits up 13% and good cash conversion. Hays plc | 2016 Annual Report and Financial Statements64 REMUNERATION REPORT CHAIRMAN’S ANNUAL STATEMENT AND SUMMARY Paul Harrison Chairman of the Remuneration Committee
  • 69.
    July 2015 August 2015 December 2015 May 2016 Number of scheduledmeetings in FY16 Senior independent non-executive director Attendance at scheduled meetings Paul Harrison (Chairman) Independent non-executive directors Torsten Kreindl Victoria Jarman Pippa Wicks Richard Smelt(1) Peter Williams MT Rainey(2) (1) Richard Smelt stood down from the Board at the 2015 AGM. (2) MT Rainey joined the Remuneration Committee on 14 December 2015. Section What it includes Letter from the Remuneration Committee Chairman Page 64 Our key results, remuneration decisions, Committee activities for FY16 and plans for FY17. Remuneration At A Glance Page 66 The key aspects of our Remuneration Structure, how we have performed and how we applied our policy during FY16. How Remuneration links to strategy and risk Page 68 How our reward elements link to our strategic pillars and take account of risk. Annual Report on Remuneration Page 70 1. Single Figure of Remuneration 2. Long Term Value Creation 3. Remuneration in the Broader Context 4. Statement of Implementation of the Remuneration Policy in the Following Financial Year 5. Governance Our full Remuneration Policy This can be found on our website at haysplc.com. A summary of relevant aspects can be found throughout this report. See the Committee’s Terms of Reference online at haysplc.com Membership and meetings This report is structured as follows: Annual Bonus and PSP Targets for FY17 When the Committee met in August 2016 to finalise the targets for FY17, it was in the context of a more uncertain economic outlook, especially in the UK following the ‘Brexit’ referendum result. The Committee carefully considered the targets it should apply to incentive awards (i.e. both annual bonus and PSP awards) for FY17. We decided to widen the range around the EPS targets for the FY17 annual bonus to reflect the increased uncertainty on FY17 earnings and to ensure that any maximum bonus target would require a level of profit achievement materially above the then consensus external forecast and that achieved in FY16. The annual bonus targets for FY17 will be disclosed in our FY17 annual report. In setting the EPS target (which represents one-third of the PSP award) for the FY17 PSP award, noting that the mechanics for this are consistent with prior years, it is recognised that the EPS target range is lower in absolute terms than the target applied to the awards made in FY16. However the Committee is comfortable that these targets are no less challenging in relative terms than the targets applied to the FY16 PSP awards and are consistent with external forecasts at that time. Renewal of the Deferred Annual Bonus (DAB) Plan Our current approved Remuneration Policy requires executive directors to defer 40% of any annual bonus award into shares for a period of three years. During this period, the deferred awards are subject to Malus conditions. The deferral is made under the terms of the Deferred Annual Bonus Plan (DAB). This plan was adopted by shareholders in April 2007 and therefore expires in April 2017. In order for us to continue to operate the current policy in relation to any bonus award made in relation to FY17 (which would be considered at the August 2017 Remuneration Committee meeting), we need to renew the DAB plan. Therefore, it is proposed to put forward a Resolution to renew the DAB at the 2016 AGM. There will be no changes to the current policy operation. Our independent remuneration adviser During 2016, the Committee engaged the services of PwC as its independent adviser. Following the successful tender by PwC to become the Company’s new external Auditor, PwC ceased to advise the Committee from 30 June 2016. During FY17 a full, formal tender process will be conducted to appoint a new independent adviser. For more information on our Terms of Reference, Meetings held in 2016 and the Advisers to the Remuneration Committee go to page 85 We aim to be clear, concise and straightforward in our reporting We aim to make the Directors’ Remuneration Report clear, concise and easy to follow. As there is no change this year to our formal, approved Remuneration Policy, it can be found on our website haysplc.com. This complements our approach to becoming more digital. To help with understanding the FY16 remuneration outcomes in relation to our Policy, we have summarised the key features of our reward components alongside the actions we have taken or awards made. We have also included a Remuneration At A Glance page and a table to show how our reward links to our strategy and Group risk. We hope that readers will find this helpful. We trust that this report demonstrates how we balance performance, reward and underlying associated behaviours and that we place great importance on our duty to shareholders. Paul Harrison Chairman of the Remuneration Committee 1 September 2016 Hays plc | 2016 Annual Report and Financial Statements65 OVERVIEW  STRATEGICREPORT  GOVERNANCE  FINANCIALSTATEMENTS  SHAREHOLDERINFORMATION
  • 70.
    The key elementsof our Remuneration Policy How we have performed –– Provide a balanced package with a strong link between reward and individual and Group performance; –– Encourage a material, personal stake in the business to give a long-term focus on sustained growth; and –– Operate a consistent reward and performance philosophy throughout the business. Annual Bonus Metrics measure the success of the day-to-day management of a volatile and cyclical business. Metric Target Maximum Actual % of max achieved EPS 8.12p 8.60p 8.19p* 66.50% Cash conversion 86% 101% 80.11% 44.29% Personal CEO 85% Personal CFO 85% * Both the target and actual performance were based on Budget exchange rates. Therefore the actual performance for bonus purposes is lower than the reported performance due to movements in exchange rates during the year. September 2013 PSP award Metrics measure the success of managing the long-term sustainability of the business and the outcome reflects the success in delivering strong results through the three-year cycle. 85.59% of the maximum award vested i.e. 149.78% of base salary (maximum is 175%). Metric and weighting Maximum Target Actual % of max achieved Relative TSR against comparator group (50%) Upper quartile (UQ) 46% 71.17% EPS (50%) 20.09p(1) 22.05p 100% Key general business highlights in FY16 –– Like-for-like net fee growth of 7%(2) –– Operating profit up 13%(2) –– Good cash conversion (1) Adjusted for actual RPI. (2) Like-for-like growth represents organic growth of continuing operations at constant currency. Reward linked closely to performance EPS – Above Target Cash conversion – Between Threshold and Target Personal objectives – 85% for both CEO and CFO Fixed elements Variable elements Shareholding requirements Definition Set in relation to skills, expertise and experience. Definition Maximum 125% of base salary. 40% of any award is deferred into shares for three years. The cash element is subject to clawback for three years from award. Malus applies to the deferred element. Definition 200% of base salary for CEO and 100% of salary for CFO. Definition Includes pension, health cover, life assurance and car allowance. Definition Maximum 175% of base salary. Three-year performance period. Malus applies during the performance period and clawback for two years post vesting. Base salary Annual bonus Annual bonus PSP Return to shareholders Core benefits Total Reward For more information go to pages 72 and 73 EPS – Outperformed TSR – Close to Upper Quartile Note: 2013 PSP had no cash conversion metric. Dividend 2.90p Performance Share Plan (PSP) Hays plc | 2016 Annual Report and Financial Statements66 REMUNERATION REPORT REMUNERATION AT A GLANCE
  • 71.
    Our Remuneration Policyand structure and how this was applied Key reward component Key features What we have done Base salary and core benefits Competitive salary and benefits to attract right calibre of executive. Increased salaries for Chief Executive and Group Finance Director by 2.0% with effect from 1 July 2016. New salaries: Alistair Cox, Chief Executive: £723,480 Paul Venables, Group Finance Director: £521,628 Increase in line with budget set for relevant UK employees of 2.0%. There were no changes to benefits during the year. Annual Bonus 1. 60% EPS 2. 20% Cash conversion 3. 20% Personal 1. 2. 3. –– Max potential 125% of salary. –– Key financial KPIs and personal objectives. –– 60% paid in cash (Clawback applies for three years from payment). –– 40% deferred in shares for three years (Malus applies for the three deferral years). Alistair Cox, Chief Executive: 65.76% of maximum, i.e. 82.20% of salary equating to £583,022. Paul Venables, Group Finance Director: 65.76% of maximum, i.e. 82.20% of salary equating to £420,358. 40% of the above awards deferred into shares for three years. Performance Share Plan (PSP) 1. 1/3 EPS 2. 1/3 Cash conversion 3. 1/3 TSR 1. 2. 3. –– Max potential 175% of salary. –– KPIs focused on long-term sustainability and shareholder returns. –– Three year performance period. –– Malus applies during the performance period, Clawback applies for two years post vesting. 175% of salary awarded. Shareholding requirements Ensure material personal stake in the business. Alistair Cox, Chief Executive: 200% of salary Paul Venables, Group Finance Director: 100% of salary Shareholdings at 30 June 2016: Alistair Cox, Chief Executive: 481% of salary Paul Venables, Group Finance Director: 308% of salary For more information on the Single Figure go to page 70 Hays plc | 2016 Annual Report and Financial Statements67 OVERVIEW  STRATEGICREPORT  GOVERNANCE  FINANCIALSTATEMENTS  SHAREHOLDERINFORMATION
  • 72.
    Key remuneration componentTime horizon (years) Fixed element 1 2 3 4 Base salary and core benefits Variable elements 1 2 3 4 Annual bonus: Cash element Annual bonus: Deferred element Performance Share Plan Shareholding requirements Our Remuneration Policy was approved by shareholders at the Company’s AGM on 12 November 2014 and received strong support with a favourable vote of 92.62%. There is no change to the Remuneration Policy this year. Our full Remuneration Policy can be found on our website at haysplc.com and in our FY14 Annual Report. However, we have included a policy summary for each remuneration element alongside the detailed disclosure of the Single Figure of Remuneration and beside other tables throughout this report which we hope will help understanding. As stated in our FY15 report, in line with the revised UK Corporate Governance Code (the Code) issued in September 2014, we included clawback provisions in our incentive plans during 2015. In accordance with the Code, these are effective in relation to all awards made in the financial year 2016 and thereafter. Clawback provisions therefore apply to the PSP awards granted in September 2015 for two years post any vesting, with malus provisions in place during the performance period. Clawback provisions also apply for a period of three years to the cash element of the bonus awarded in 2016 in relation to FY16 performance and malus provisions apply to the deferred element. Our Annual Report on Remuneration for the financial year 2015 received a positive vote of 96.69% indicating support for our approach towards the application of our Remuneration Policy. –– Votes for – 962,720,176 (96.69%) –– Votes against – 32,968,188 (3.31%) –– Votes withheld – 10,632,042 The table adjacent shows how we link our Remuneration Policy to our strategy and take into account risk. Links to strategy Strategic priority 1 Materially increase and diversify Group profits. Strategic priority 2 Build critical mass and diversity across our global platform. Strategic priority 3 Invest in people and technology, responding to change and building relationships. Strategic priority 4 Generate and distribute meaningful cash returns. For more details on strategy please go to pages 20 and 21 Hays plc | 2016 Annual Report and Financial Statements68 REMUNERATION REPORT HOW REMUNERATION LINKS TO STRATEGY AND RISK
  • 73.
    How our RemunerationPolicy links to our strategy How our Remuneration Policy takes into account risk Base salary, associated benefits and variable pay elements combine to attract, retain and motivate the calibre of executives required to shape and execute strategy and generate superior shareholder returns. Link to relevant strategic priority: 1 32 A principal risk is the loss of specialised talent. This is mitigated by offering a competitive package against businesses of a comparable size and comparable peer group as well as recognising the breadth of the role and individual experience the role-holder brings to the Company. Financial and personal objectives are set with reference to our business strategy approved by the Board. Current weighting and measures are: –– 60% Earnings per share* –– 20% Cash conversion* –– 20% Personal * Key Performance Indicators (KPIs). Link to relevant strategic priority: 1 3 42 In establishing the annual Group budget, the Board seeks to ensure that achievable, yet stretching, goals are properly balanced with risk. Financial targets for reward are then linked to budget. The financial metrics chosen are KPIs of the business and therefore reflect how well management mitigates our principal financial and reputational business risks which include: –– Its cyclical nature, closely linked to the economy; –– Ensuring we have the right business model to deal with market changes; –– The importance of compliance and data governance when operating across 33 countries with multiple regulatory and legal frameworks; and –– Increased reliance on technology and the associated risk of data loss or system failure. Personal objectives are linked to the delivery of key projects designed to enhance the Group’s operational strength and competitiveness in line with future strategy. They include operating within our Group risk framework. Bonus deferral into shares helps focus on long-term outcomes. The annual bonus also has malus provisions during the three-year deferral period and clawback provisions (new for the cash element of the bonus made in relation to FY16 and going forward, and applicable for three years post award). Deferred bonus is awarded in shares and therefore helps align future focus with that of shareholders and longer-term strategy. Link to relevant strategic priority: 1 3 42 Key financial performance metrics are set in line with the Company’s long-term strategy approved by the Board. Current performance conditions are: –– One-third based on total shareholder return (TSR) relative to a comparator group, with vesting subject to satisfactory financial performance over the period, as determined by the Committee; –– One-third based on cumulative earnings per share (EPS); and –– One-third based on cash conversion Link to relevant strategic priority: 1 3 42 The PSP metrics mitigate risk by providing a balanced approach of actual financial performance and business efficiency over a longer time period, together with relative performance against comparable businesses and longer-term alignment with shareholders. The TSR metric measures the relative return from Hays shares against a basket of comparator companies and the result is underpinned by the Company’s underlying financial performance. The EPS metric targets are calculated taking into account the Company budget for Year 1 plus growth around an assumed rate of RPI. The cash conversion metric indicates the continuous focus on ongoing business cash efficiency whatever the trading circumstances of the business. The award in shares focuses on alignment with shareholders. Malus provisions (during the three-year performance period) and clawback provisions (new for awards from FY16 and applicable for two years post vesting) are also in place to mitigate risk. Shareholding requirements ensure that executive directors’ interests are aligned with shareholders over a longer time horizon. Link to relevant strategic priority: 1 3 42 Encouraging a material, personal stake in the business through substantial shareholding requirements helps to align executives with shareholders and focus on delivering long-term shareholder value which includes risk mitigation. Hays plc | 2016 Annual Report and Financial Statements69 OVERVIEW  STRATEGICREPORT  GOVERNANCE  FINANCIALSTATEMENTS  SHAREHOLDERINFORMATION
  • 74.
    Section 1 –Total reward for FY16 In this section: 1.1 FY16 Single Figure for executive directors 1.1.1 Salary 1.1.2 Benefits 1.1.3 Pension 1.1.4 Other benefits 1.1.5 Annual bonus 1.1.6 PSP 1.2 FY16 fees for non-executive directors (NEDs) 1.1 FY16 Single Figure for executive directors Single Figure of remuneration (audited) The following table shows the single total figure of remuneration for each executive director in respect of qualifying services for the 2016 financial year. Comparative figures for the 2015 financial year have also been provided. Details of NEDs’ fees are set out in 1.2 on page 75. £000s Executive director Salary Note 1 Benefits Note 2 Pension Note 3 Other Note 4 Annual Bonus Note 5 Total remuneration excluding PSP PSP(1) Note 6 Total remuneration(1) 2016 Alistair Cox Chief Executive 709 44 213 0 583 1,549 1,194 2,743 Paul Venables Group Finance Director 511 34 153 2 420 1,120 861 1,981 2015 Alistair Cox 695 43 208 0 852 1,798 2,168 3,966 Paul Venables 501 33 150 0 608 1,292 1,563 2,855 (1) 2015 PSP figures now reflect the actual vesting price and the value of the dividend equivalent shares relating to the dividend which was subject to approval at the 2015 AGM, and for which the awards qualified. Components of the Single Figure and how the calculations are worked The following tables explain how the Single Figure has been derived. 1.1.1 Salary – note 1 (audited) Policy summary –– Set in relation to skills, expertise and experience. –– Reviewed annually from 1 July. –– Broadly aligned with salary increases for relevant UK employees. What has happened Salaries were increased by 2.0% with effect from 1 July 2015. This increase was the same as the wider budget set for relevant UK employees. Name Salary for FY16 % increase over FY15 Salary for FY15 Alistair Cox £709,294 2.0% £695,386 Paul Venables £511,400 2.0% £501,373 1.1.2 Benefits – note 2 (audited) Policy summary –– Core benefits align with those for other UK employees. What has happened There have been no changes to the benefits during FY16. £000s Executive director PMI Life assurance Income protection Travel and mileage Car allowance Total 2016 Alistair Cox 3 8 9 4 20 44 Paul Venables 3 4 9 – 18 34 2015 Alistair Cox 2 8 9 4 20 43 Paul Venables 2 4 9 – 18 33 PMI, life assurance and income protection figures represent the annual premiums. Hays plc | 2016 Annual Report and Financial Statements70 REMUNERATION REPORT ANNUAL REPORT ON REMUNERATION
  • 75.
    1.1.3 Pension –note 3 (audited) Policy summary –– Other than a cash payment in lieu of pension at the rate of 30% of base salary, there are no other pension arrangements for the directors. –– For the sake of clarity, neither executive director has any defined benefit pension provision. What has happened There has been no change to the structure of pension provision during FY16. £000s Executive director Pension 2016 Alistair Cox 213 Paul Venables 153 2015 Alistair Cox 208 Paul Venables 150 1.1.4 Other benefits – note 4 (audited) Policy Summary –– The executive directors are able to participate in the Hays UK Sharesave Scheme in the same way as other eligible employees. What has happened Paul Venables had a ‘theoretical’ gain on date of exercise which is shown below. However, he did not sell the shares. No options were due for exercise by Alistair Cox. Paul Venables participated in the March 2016 Hays Sharesave Scheme and has options which are due for exercise from 1 May 2019 to 31 October 2019. Details are shown on page 76. Neither Alistair Cox nor Paul Venables participated in the 2015 SAYE as they were already saving at the maximum limit permitted under the Scheme at that time. £000s Executive director Other 2016 Alistair Cox 0 Paul Venables 2 2015 Alistair Cox 0 Paul Venables 0 Hays plc | 2016 Annual Report and Financial Statements71 OVERVIEW  STRATEGICREPORT  GOVERNANCE  FINANCIALSTATEMENTS  SHAREHOLDERINFORMATION
  • 76.
    1.1.5 Annual bonus– note 5 (audited) Policy summary –– Maximum bonus potential is 125% of base salary, of which 60% is paid in cash and 40% is deferred into shares. –– Bonus is based on financial KPIs and personal objectives. What has happened The figure shown is the total bonus awarded in relation to performance in the year, including the portion that is deferred. For bonus awarded in relation to 2016 and 2015 performance, 40% of the figure shown is deferred into shares for three years. There are no further performance conditions but leaver terms apply. The cash element of the bonus award in relation to performance in 2016 is subject to Clawback for three years from award. The deferred element is subject to Malus for the three-year holding period. For detailed information on performance against targets see page 73 Summary £000s Executive director Annual Bonus Of which cash – 60% Of which deferred–40% % of salary achievement 2016 Alistair Cox 583 350 233 82.20% Paul Venables 420 252 168 82.20% 2015 Alistair Cox 852 511 341 122.50% Paul Venables 608 365 243 121.25% Details of the FY16 annual bonus The performance metrics and objectives Assessment Achievement and what happens now 60% on earnings per share (EPS): focuses on shareholder returns; 20% on cash conversion: ensures ongoing business efficiency; and 20% on personal objectives: safeguard and plan for the Company’s future. Personal objectives for FY16 included: Alistair Cox: –– Successful expansion of our US business following the acquisition of Veredus. –– Driving the business through use of digital marketing. –– Further embedding strong risk management processes and mitigation into the business. Paul Venables: –– Further embedding the enterprise risk management process. –– Implementation of the German back office transformation project. –– Managing all aspects of the external Auditor retender process. Due to the strategic nature of the personal objectives for the Chief Executive and Group Finance Director, the Company feels that other objectives, which are ongoing in nature and about developing our business, are commercially sensitive and so will not be disclosed. The Committee reviews both the Company’s results and executive directors’ performance against their personal objectives. The basic EPS targets and actual performance were measured at budget exchange rates. Cash conversion is the operating cash flow of the Company after deducting net capital expenditure items for the financial year, stated as a percentage of operating profit before exceptional items. In addition to assessment of the individual executives’ overall performance against key objectives, the Committee also takes into account its view of the directors’ regulatory compliance and approach to risk (including environmental, social or governance (ESG) risks). The Committee has not exercised any discretion in relation to bonus outcomes. Alistair Cox Achieved 82.20% of salary (out of 125% maximum potential i.e. 65.76% of maximum). This equates to a bonus of £583,022 (as stated in the Single Figure) of which: –– 60% or £349,813 will be paid as cash; and –– 40% or £233,209 will be deferred into shares for three years. There are no further performance conditions. Paul Venables Achieved 82.20% of salary (out of 125% maximum potential, i.e. 65.76% of maximum). This equates to a bonus of £420,358 (as stated in the Single Figure) of which: –– 60% or £252,215 will be paid as cash; and –– 40% or £168,143 will be deferred into shares for three years. There are no further performance conditions. Clawback and malus The cash element of the bonus is subject to clawback for three years from the date of award. The deferred element is subject to malus for the three-year deferral period. Hays plc | 2016 Annual Report and Financial Statements72 REMUNERATION REPORT ANNUAL REPORT ON REMUNERATION CONTINUED
  • 77.
    Calculation of actualresults (audited) Annual Bonus 2016 outcome Alistair Cox Paul Venables Performance condition Weighting Threshold performance required Maximum performance required Actual performance Annual bonus value for meeting threshold and maximum performance (% salary) Achievement % salary Bonus value £000s Achievement % salary Bonus value £000s EPS 60% 7.63p 8.60p 8.19p 15 – 75 49.88% 354 49.88% 255 Cash conversion 20% 71% 101% 80.11% 5 – 25 11.07% 78 11.07% 56 Personal 20% – 100% 85% 0 – 25 21.25% 151 21.25% 109 Total 2016 100% These totals are in the 2016 Single Figure 82.20% 583 82.20% 420 * Both the target and actual performance for bonus purposes were based on budget exchange rates. Therefore actual performance is lower than the reported performance due to movements in exchange rates during the year. Note both Alistair Cox and Paul Venables achieved 85% of their personal objectives. Of which cash 350 Of which cash 252 Of which deferred – 40% 233 Of which deferred – 40% 168 Total bonus achieved in 2015 122.5% 852 121.25% 608 Of which cash 511 Of which cash 365 Of which deferred – 40% 341 Of which deferred – 40% 243 The personal objectives outlined on page 72 were primarily achieved. 1.1.6 PSP – note 6 Policy Summary –– Normal maximum potential for executive directors is 175% of base salary. –– Normally granted annually. –– KPIs are focused on long-term sustainability and shareholder returns. –– Performance period is three years. –– Threshold performance equates to 25% of the award, i.e. 43.75% of salary. –– Award is subject to Malus provisions prior to vesting. –– Awards made from FY16, are subject to clawback provisions for up to two years post vesting. What has happened 85.59% of the 2013 award vested in 2016, i.e. 149.78% of base salary (maximum 175%). No malus was exercised. PSP 2013 (granted in FY14) vesting in 2016 The value of the 2013 PSP (vesting in September 2016) is based on a share price of 126.1 pence, which was calculated using an average for the final quarter of the financial year in accordance with the Regulations as the vesting will occur after the date of this Report. The share price on award was 113.9 pence. The award vested at 85.59% of the maximum, i.e. 149.78% of salary. See page 74 for detailed information on performance against targets. £000s Executive director Value in 2016 Single Figure based on share price of 126.1p Restatement 2016 Value will be restated in FY17 report when vesting share price is known. Alistair Cox 1,194 Paul Venables 861 Hays plc | 2016 Annual Report and Financial Statements73 OVERVIEW  STRATEGICREPORT  GOVERNANCE  FINANCIALSTATEMENTS  SHAREHOLDERINFORMATION
  • 78.
    Details of PSP2013 (granted in FY14) vesting in 2016 Summary The performance metrics (Legacy Plan prior to 2014 Policy) Assessment Achievement and what happens now Three-year plan Performance period: 1 July 2013 to 30 June 2016. Granted: 12 September 2013 and will vest 12 September 2016. Metrics 50% on cumulative earnings per share (EPS): focuses on longer-term shareholder returns. 50% on relative total shareholder return (TSR): Ranks the performance of Hays against a sector group of comparator companies: –– Adecco SA –– CDI Corporation –– Kelly Services, Inc. –– ManpowerGroup Inc. –– Michael Page International plc (now Page Group plc) –– Randstad Holdings nv –– Robert Half International Inc –– Robert Walters plc –– SThree plc –– USG People N.V.(1) (1) During FY16, USG People N.V. was purchased by Recruit Holdings Co. Ltd and its shares delisted. The TSR calculation was conducted in line with the Plan rules under these circumstances. Cumulative Earnings Per Share is the consolidated basic earnings per share of the Company calculated in accordance with IAS 33 for each financial year cumulative over the performance period. Goodwill impairments arising from acquisitions prior to 30 June 2006 are excluded from the earnings per share calculation. The Committee may make adjustments to the calculations of cumulative earnings per share, including taking into account unusual or non-recurring items that do not reflect underlying performance. TSR for each company is the difference between the average market values (in sterling terms) of a notional shareholding (including dividends) in that company on all dealing days for the three-month period prior to the start and the end of the performance period, divided by the average market values (in sterling terms) of a notional shareholding in that company on all dealing days for three-month period prior to the start of the performance period. The TSR for Hays shares is ranked against the respective TSR performances of the comparator group. Vesting will be subject to satisfactory financial performance over the performance period as determined by the Committee. The Committee has not exercised any discretion in relation to PSP outcomes. Alistair Cox Awarded 1,042,356 shares in 2013. 85.59% of the award has vested. 947,182 shares will be released in September 2016 which includes accrued dividend equivalent shares. This equates to a value of £1.194 million using a preliminary share price of £1.261 – see opposite. This value will be restated in 2017’s Report once the final share price and number of dividends are known. Paul Venables Awarded 751,538 shares in 2013. 85.59% of the award has vested. 682,918 shares will be released in September 2016 which includes accrued dividend equivalent shares. This equates to a value of £861,000 using a preliminary share price of £1.261 – see opposite. This value will be restated in 2017’s Report once the final share price and number of dividends are known. Actual results (audited) PSP 2013 (granted in FY14) vesting 2016 Performance period 1 July 2013 to 30 June 2016 Grant date 12 September 2013 Release date 12 September 2016 PSP value as % of salary for: Performance condition Weighting Threshold performance required Maximum performance required Below threshold Threshold Maximum Actual performance PSP value achieved as % of salary Relative TSR 50% Median of the comparator group Upper quartile of the comparator group 0 21.875 87.5 46% 62.28% EPS(1) 50% 17.16p 20.09p 0 21.875 87.5 22.05p 87.50% Total 100% 0 43.75 175 – 149.78% 25% of award 100% of award (1) For the FY14 PSP award the three-year cumulative target was calculated such that Year 1 target growth was based on the Reuters consensus forecast for FY14 of 5.66 pence, established on the working day preceding the date of grant of the awards. FY14 threshold and maximum range around this target was -/+ 4% respectively. Years 2 and 3 required further growth on FY14 of RPI + 4% to 12% per annum for threshold and maximum growth respectively. The initial targets assumed RPI was 3.0% per annum. The final threshold and maximum figures shown above reflect actual RPI. Hays plc | 2016 Annual Report and Financial Statements74 REMUNERATION REPORT ANNUAL REPORT ON REMUNERATION CONTINUED
  • 79.
    Name % of 2013 salary awarded Face value at award £000s Share priceat award £ Maximum number of shares excluding dividends Maximum number of shares including dividends Number of shares that vested including dividend equivalent shares Release date Value (figure shown in Single Figure of remuneration) £000s(1) 2012 award value that vested in 2015 as stated in 2015 Single Figure £000s 2012 award value restated using share price at release date £000s(2) Alistair Cox 175% 1,187 1.139 1,042,356 1,106,652 947,182 12 September 2016 1,194 2,464 2,168 Paul Venables 175% 856 1.139 751,538 797,896 682,918 12 September 2016 861 1,777 1,563 (1) The value of the 2013 PSP is based on a share price of 126.1 pence which was calculated using an average for the final quarter of the 2016 financial year in accordance with the Regulations as the vesting will occur after the date of this Report. (2) The value of the 2012 PSP disclosed in the 2015 Single Figure was based on a share price of 161.26 pence which was calculated using an average for the final quarter of the 2015 financial year in accordance with the Regulations as the vesting occurred after the date of the report. The share price on award was 81.55 pence. The actual share price on the date of vesting on 9 November 2015 was 141.849 pence. This price has been used to restate the value of the 2012 PSP awards in the Single Figure for 2015 in the table above. Additional Dividend Equivalent shares ‘vested’ on 11 November 2015 at a price of 141.55 pence. Performance conditions The Remuneration Committee believes that performance conditions for all incentives are: –– Suitably demanding; –– Have regard to business strategy; –– Incorporate an understanding of business risk; –– Consider shareholder expectations; and –– Take into account, to the extent possible, the cyclicality of the recruitment markets in which the Group operates. To the extent that any performance condition is not met, the relevant part of the award will lapse. There is no retesting of performance. PSP 2012 (granted in FY13) vesting in 2015 The value of the 2012 PSP (which vested in 2015 and was disclosed in the 2015 Single Figure) was based on a share price of 161.26 pence which was calculated using an average for the final quarter of the 2015 financial year in accordance with the Regulations as the vesting occurred after the date of the Report. The share price on award was 81.55 pence. The actual share price on the date of vesting on 9 November 2015 was 141.849 pence. This price has been used to restate the value of the 2012 PSP awards in the Single Figure for 2015 in the table on page 70. Additional Dividend Equivalent shares ‘vested’ on 11 November 2015 at a price of 141.55 pence. £000s Executive director Value in 2015 Single Figure based on share price of 161.26p Value restated based on actual share price at vesting of 141.849p 2015 Alistair Cox 2,464 2,168 Paul Venables 1,777 1,563 1.2 Non-executive directors FY16 fees The table below shows the current fee structure and actual fees paid in 2016. There were no taxable benefits paid in 2016 or 2015. Non-executive directors (audited) £000s Alan Thomson Paul Harrison MT Rainey(2) Victoria Jarman Torsten Kreindl Richard Smelt(3) Pippa Wicks Peter Williams Chairman SID R R R R R R R N N N N N N N N A A A A A A A Base 245 54 27 54 54 18 54 54 Committee fee – – – – – – – – Committee Chairman(1) – 12 – 12 – – – – SID – 10 – – – – – – Total fee 2016 245 76 27 66 54 18 54 54 Total fee 2015 240 70 0 65 53 53 53 18 Key R Remuneration Committee member A Audit Committee member N Nomination Committee member SID Senior Independent Director R N A Chairman of relevant Committee (1) There is no additional Committee Chair fee for the Nomination Committee. (2) MT Rainey joined the Board on 14 December 2015 and her fee represents the period from that date to 30 June 2016. (3) Richard Smelt stood down from the Board on 11 November 2015 and his fee represents the period from 1 July 2015 to that date. Hays plc | 2016 Annual Report and Financial Statements75 OVERVIEW  STRATEGICREPORT  GOVERNANCE  FINANCIALSTATEMENTS  SHAREHOLDERINFORMATION
  • 80.
    Section 2 –Long-term value creation In this section: 2.1 Outstanding deferred annual bonus 2.2 Share options 2.3 Outstanding PSP awards 2.4 Statement of directors’ shareholdings 2.5 TSR chart and table 2.6 Payments to past directors/payment for loss of office during FY16 2.1 Outstanding deferred annual bonus (DAB) awards (audited) The table below shows the shares held under the DAB and those that were awarded or vested during the financial year 2016. The shares that vested related to deferred annual bonus from previous years. The shares awarded in the financial year 2016 relate to deferred annual bonus in relation to performance in the financial year 2015. Dividend equivalent shares which accrue under the DAB have been ignored in the table below. There are no further performance conditions. Name Awards outstanding at 1 July 2015 Awards granted in FY16 Grant price (market price at date of award) £ Face value of award granted in FY16 (at grant price) £ Awards vesting in FY16 Awards outstanding as at 30 June 2016 Alistair Cox 709,737 210,983 1.615 340,738 164,334 756,386 Paul Venables 511,720 150,567 1.615 243,166 118,485 543,802 2.2 Share options Both executive directors participate in the UK Sharesave Scheme (approved by HMRC) on the same terms as other eligible employees. The following table shows outstanding options over Ordinary shares held by the executive directors during the year ended 30 June 2016. Name Scheme date of grant Balance 1 July 2015 Exercised Balance 30 June 2016 Option Price £ Exercise date Market price on date of exercise £ Gain(1) £000 Date from which exercisable Expiry date Alistair Cox 31 March 2014 6,870 – 6,870 1.31 – – – 1 May 2017 31 October 2017 Paul Venables(2) 31 March 2016 0 – 3,364 1.07 – – – 1 May 2019 31 October 2019 Paul Venables 31 March 2014 4,122 – 4,122 1.31 – – – 1 May 2017 31 October 2017 Paul Venables 28 March 2013 4,090 4,090 0 0.88 12 May 2016 1.259 2 1 May 2016 31 October 2016 (1) The gain shown is ‘theoretical’ as at the date of exercise. Paul Venables did not sell the shares. (2) The face value of the option at grant is £3,599. 2.3 Outstanding PSP awards The tables below show the outstanding PSP awards where vesting will be determined according to the achievement of performance conditions that will be tested in future reporting periods. The awards were made in line with the PSP in the Remuneration Policy approved by shareholders at the 2014 AGM. PSP 2014 (granted in FY15) vesting 2017 (audited) The share price used to calculate the award is 124.6 pence, being the closing price on the day preceding the grant date. Performance period 1 July 2014 to 30 June 2017 Grant date 14 November 2014 Release date 14 November 2017 Threshold performance required Maximum performance required PSP value as % of salary for: Performance condition Weighting Below threshold Threshold Maximum Relative TSR 1/3 Median of the comparator group Upper quartile of the comparator group 0 14.583 58.33 EPS(1) 1/3 21.67p 25.35p 0 14.583 58.33 Cash conversion 1/3 71% 101% 0 14.583 58.33 Total 100% 0 43.75 175 25% of award 100% of award See notes below. Name % of FY15 salary awarded Face value at award £000s Share price at award £ Maximum number of shares Threshold number of shares Alistair Cox 175 1,217 1.246 976,666 244,166 Paul Venables 175 877 1.246 704,175 176,043 Hays plc | 2016 Annual Report and Financial Statements76 REMUNERATION REPORT ANNUAL REPORT ON REMUNERATION CONTINUED
  • 81.
    2015 PSP (grantedin FY16) vesting 2018 The share price used to calculate the award is 1.622 pence, being the closing price on the day preceding the grant date. Performance period 1 July 2015 to 30 June 2018 Grant date 10 September 2015 Release date 10 September 2018 Threshold performance required Maximum performance required PSP value as % of salary for: Performance condition Weighting Below threshold Threshold Maximum Relative TSR(1) 1/3 Median of the comparator group Upper quartile of the comparator group 0 14.583 58.33 EPS(2) 1/3 25.06p 29.32p 0 14.583 58.33 Cash conversion 1/3 71% 101% 0 14.583 58.33 Total 100% 0 43.75 175 25% of award 100% of award Name % of FY16 salary awarded Face value at award £000s Share price at award £ Maximum number of shares Threshold number of shares Alistair Cox 175 1,241 1.622 765,268 191,317 Paul Venables 175 895 1.622 551,757 137,939 Notes to both 2014 and 2015 awards (1) TSR is measured against a bespoke comparator group, with vesting subject to satisfactory financial performance as determined by the Committee. The comparator group for both awards is: Adecco SA, CDI Corporation, Kelly Services Inc., Manpower Inc., Michael Page International Plc (now Page Group), Randstad Holdings nv, Robert Half International Inc., Robert Walters Plc, SThree Plc, USG People NV (delisted during 2016 following purchase by Recruit Holdings Co. Ltd. The TSR calculation will take this into account in line with the plan rules). (2) The Committee took into account the following factors when setting the EPS targets for an award: – Budget (the setting of which is a robust and transparent process). – Company budget for FY15 and FY16 respectively and the expectations for performance; – Strategic direction of the business over the period covered by the PSP award; – Market conditions and visibility of future trading. – Real growth around an assumed RPI of 3% p.a. The final threshold and maximum figures will be adjusted to reflect the actual RPI once known. – Analyst forecasts. Hays plc | 2016 Annual Report and Financial Statements77 OVERVIEW  STRATEGICREPORT  GOVERNANCE  FINANCIALSTATEMENTS  SHAREHOLDERINFORMATION
  • 82.
    2.4 Statement ofdirectors’ shareholdings and share interests (audited) Policy summary –– Shareholding requirements in operation at Hays are currently 200% of base salary for the Chief Executive and 100% of base salary for the Group Finance Director. Both are required to build up their shareholdings over a reasonable amount of time which would normally be five years. What has happened The number of shares of the Company in which current executive directors had a beneficial interest and details of long-term incentive interests as at 30 June 2016 are set out in the table below. Name Shareholding requirement % of salary Number of shares owned outright/ vested shares Share price as at 30 June 2016 Base salary as at 1 July 2015 Actual share ownership as % of base salary Guidelines met Alistair Cox 200% 3,496,719 97.65p £709,294 481 Yes Paul Venables 100% 1,615,262 97.65p £511,400 308 Yes Shares used for the above calculation exclude those with performance conditions, i.e. those awarded under the PSP which are still within their performance period, any unexercised options, those shares subject to a period of deferral and any shares held in a private Trust where the executive director is not a Trustee. They include vested shares where the executive directors have beneficial ownership, shares independently acquired in the market and those held by a spouse or civil partner or dependent child under the age of 18 years. The executive directors’ total shareholdings, including shares subject to deferral but excluding Sharesave Options, are shown below. Name Number of owned outright/ vested shares Value of owned outright/ vested shares(2) £ Number of shares subject to deferral/ holding period(1) Value of shares subject to deferral/ holding period(2) £ Number of total vested and unvested shares (excludes any shares with performance conditions) Value of total vested and unvested shares (excludes any shares with performance conditions)(2) £ Share ownership as % of base salary using vested and unvested shares PSP share interests excluding dividends subject to performance conditions Alistair Cox 3,496,719 3,414,546 756,386 738,611 4,253,105 4,153,157 585% 2,784,290 Paul Venables 1,615,262 1,577,303 543,802 531,023 2,159,064 2,108,326 412% 2,007,470 (1) Unvested shares will be subject to payroll deductions for tax and social security on vesting. Number excludes dividend equivalent shares. (2) Share price as at 30 June 2016 and used in the above table was 97.65 pence. The table below shows the NEDs’ shareholdings as at 30 June 2016 – this table has been audited. Non-executive director Shares held at 30 June 2016 Shares held at 30 June 2015 or date of joining if later Alan Thomson 250,000 200,000 Paul Harrison 8,678 8,678 Victoria Jarman 14,000 14,000 Torsten Kreindl – – Pippa Wicks – – Peter Williams 6,946 6,946 MT Rainey(1) – – (1) MT Rainey joined the Board on 14 December 2015. Hays plc | 2016 Annual Report and Financial Statements78 REMUNERATION REPORT ANNUAL REPORT ON REMUNERATION CONTINUED
  • 83.
    30 June 2009 30 June 2010 30June 2011 30 June 2012 30 June 2013 30 June 2014 30 June 2015 30 June 2016(1) Since 30 June 2009, Total Shareholder Return has increased by 47.2%, or 5.7% p.a. (i.e. on an annualised basis). Since 30 June 2013, Total Shareholder Return has increased by 16.7% or 5.3% p.a. driven in part by our Strategic plan to double the Group’s profits. 0 50 100 150 200 250 300 2.5 Total Shareholder Return (TSR) The graph shows the value of £100 invested in the Company’s shares compared to the FTSE 350 index. The graph shows the total shareholder return generated by both the movement in share value and the reinvestment over the same period of dividend income. The Committee considers that the FTSE 350 is the appropriate index because the Company has been a member of this index throughout the period. This graph has been calculated in accordance with the Regulations. (1) Following the UK Referendum to leave the EU, Hays’ share price fell from 136.9 pence on 23 June 2016 to 97.65 pence on 30 June 2016. Hays plc FTSE 350 Chief Executive historic remuneration The table below sets out the total remuneration delivered to the Chief Executive over the last seven years, valued using the methodology applied to the total single figure of remuneration. The 2015 figure has been restated to take into consideration the actual share price on date of PSP vesting, as previously explained on page 75. Chief Executive 2010 2011 2012 2013 2014 2015 2016 Total Single Figure (£000s) 1,634 2,157 1,328 2,012 2,826 3,966 2,743 Annual bonus payment level achieved (% of maximum opportunity) 89% 80% 37% 95% 98% 98% 65.76% PSP vesting level achieved (% of maximum opportunity) 0% 50% 0% 22% 50% 100% 85.59% DAB match vesting level achieved (% of maximum opportunity) N/A 59% 60% N/A N/A N/A N/A 2.6 Payments to past directors/payment for loss of office during FY16 There were no payments made in relation to either of the above in the financial year 2016. Hays plc | 2016 Annual Report and Financial Statements79 OVERVIEW  STRATEGICREPORT  GOVERNANCE  FINANCIALSTATEMENTS  SHAREHOLDERINFORMATION
  • 84.
    Section 3 –Remuneration in the broader context In this section: 3.1 Remuneration for employees below Board 3.2 Change in Chief Executive’s remuneration compared to other employees 3.3 External appointments 3.4 Relative importance of spend on pay 3.1 Remuneration for employees below Board Our remuneration philosophy is cascaded throughout the organisation. Our Management Board have an annual bonus scheme that is measured against Group and Regional (where relevant) financial targets and personal and strategic objectives. 40% of any award is deferred into shares for three years and subject to Malus provisions. Members of the Management Board also participate in the PSP with the same performance conditions as the executive directors. Members of the Management Board are encouraged to build up a Hays’ shareholding equivalent to 100% of their base salary. Employees below the Management Board receive salary and benefits which are benchmarked to the local markets and countries in which they work. These are reviewed annually. There is a strong tie of performance to reward which is recognised through annual bonuses, commission or other non-financial recognition. Employees who hold key strategic positions or are deemed critical to the business through their performance are also offered the opportunity to participate in the PSP with performance conditions based on Group EPS results measured over one year. Any shares that crystallise at the end of the performance period have a further two-year holding period prior to vesting. During this time there is also a personal performance underpin. In addition nine countries offer a Sharesave plan to employees. A Resolution will be put to Shareholders at the 2016 AGM to introduce a US Stock Purchase Plan for employees in the USA. As stated in our Remuneration Policy, each year, prior to reviewing the remuneration of the executive directors and the members of the Management Board, the Committee considers a report prepared by the Group Head of Reward detailing remuneration practice across the Group. The report provides a regional overview of how employee pay compares to the market, any material changes during the year and includes detailed analysis of basic pay and variable pay changes within the UK where all of the executive directors and most of the Management Board are based. While the Company does not directly consult with employees as part of the process of reviewing executive pay and formulating the remuneration policy, the Company takes account of feedback from the broader employee population on an annual basis using the engagement survey which includes a number of questions relating to remuneration. The table below summarises the above. Hays plc | 2016 Annual Report and Financial Statements80 REMUNERATION REPORT ANNUAL REPORT ON REMUNERATION CONTINUED
  • 85.
    Principles Components Operate aconsistent reward and performance philosophy throughout the business. Provide a balanced package with a strong link between reward and individual and Group performance. Encourage a material, personal stake in the business to give a long-term focus on sustained growth. Base salary Based on skill and experience and benchmarked to local market Annual bonus Employees who hold positions that influence the business strategy and direction, or hold key roles that have a direct effect on business results, have annual bonuses based on a combination of Group, Regional and/or local business targets and personal or strategic objectives. For members of the Management Board, 40% of any bonus earned is deferred into shares for three years and is subject to Malus. Performance Share Plan (‘PSP’) and Sharesave Members of the Management Board participate in the same PSP Plan as executive directors subject to Remuneration Committee approval. The PSP is subject to Malus provisions. Management Board members are encouraged to retain shares and build up a holding of 100% of Base Salary. Below the Management Board, broadly 300 key employees each year participate in a PSP which has a one-year performance period and two-year holding period. Financial targets are based on Group EPS results. Nominations are reviewed and approved by the Remuneration Committee. Employees in nine countries can participate in a Sharesave scheme with the ability to purchase options after three years. Benefits Benchmarked to local market and can include pension, life assurance, health cover and discounted voluntary benefits. In the UK the executive directors participate in the same plans as other UK employees. Commission Client facing employees have annual bonuses based on personal objectives and/or commission directly related to personal business performance. TALKback Survey An annual global employee engagement survey is conducted across all Hays’ employees in all countries to ascertain overall engagement. This includes a number of questions relating to remuneration. Timeline Fixed Variable Long-term/Ongoing 3.2 Change in Chief Executive’s remuneration compared to other employees The following table sets out the change in the remuneration paid to the Chief Executive from 2015 to 2016 compared with the average percentage change for relevant UK employees. The Chief Executive’s remuneration disclosed in the table below has been calculated to take into account base salary, taxable benefits, excluding his allowance in lieu of pension, and annual bonus (including any amount deferred). The UK employee pay (on which the average percentage change is based) is calculated using the increase in the earnings of UK-based, full-time employees who are eligible for increases in salary/benefits and who participate in the standard discretionary (i.e. not commission based) annual bonus plans (employees who receive bonuses on a monthly or other time-scale basis are excluded). It uses P11d data from tax years 2015 and 2016. Part-time employees have been excluded from the analysis as many will have experienced material changes in pay during the period due to their change of hours. Hays plc | 2016 Annual Report and Financial Statements81 OVERVIEW  STRATEGICREPORT  GOVERNANCE  FINANCIALSTATEMENTS  SHAREHOLDERINFORMATION
  • 86.
    The comparison figuresare based on relevant UK employees (as described above) as both executive directors and most of the Management Board are UK based and this is considered to be an appropriate comparison. % change salary FY16 vs FY15 % change taxable benefits FY16 vs FY15 % change variable pay FY16 vs FY15 Chief Executive 2% 2% -32% Other relevant employees 5% 13% -14% 3.3 External appointments The Company considers that certain external appointments can help to broaden the experience and contribution to the Board of the executive directors. Any such appointments are subject to prior agreement by the Company and must not be with competing companies. Subject to the Company’s agreement, any fees may be retained by the individual. For the 12 months ended 31 March 2016, the annual rate of fees earned and retained by the executive directors was as follows: –– Alistair Cox: £80,000 p.a. (3i Group plc) – he stepped down on 10 November 2015. –– Paul Venables: £53,000 p.a. (Wincanton plc) – he stepped down on 16 July 2015. 3.4 Relative importance of spend on pay The table below sets out the relative importance of the spend on pay in the 2016 financial year and the 2015 financial year compared with other disbursements. All figures are taken from the relevant Hays Annual Report. Disbursements from profit in 2016 financial year £m Disbursements from profit in 2015 financial year £m % change Profit distributed by way of dividend 41.7 39.3 6.1 % Overall spend on pay including directors 476.3 440.6 8.1 % Section 4 – Statement of implementation of Remuneration Policy in the following financial year In this section: 4.1 Executive directors 4.2 Non-executive directors Below are the Remuneration Policy decisions implemented for the financial year 2017. There have been no changes to our Remuneration Policy during FY16. 4.1 Executive directors Summary Position Name Base salary from 1 July 2016 Maximum bonus potential as % of salary Maximum PSP award as % of salary Benefits and pension CEO Alistair Cox £723,480 125% 175% No change CFO Paul Venables £521,628 125% 175% No change The salaries for the CEO and CFO were increased by 2.0%, in line with the pay review budget for other relevant employees in the UK See below for performance conditions See grant summary below Bonus performance conditions The weighting of the performance conditions remain as follows for FY17: Performance condition Weighting EPS 60% The operation of the Bonus Plan is otherwise as set out on page 72. It should be noted that the Committee views the disclosure of the actual performance targets as commercially sensitive. The Committee will provide retrospective disclosure of the performance targets for the financial measures to allow shareholders to judge the bonus earned in the context of the performance delivered. The Committee believes that some of the personal objectives may continue to be commercially sensitive. Cash conversion 20% Personal 20% Total 100% Hays plc | 2016 Annual Report and Financial Statements82 REMUNERATION REPORT ANNUAL REPORT ON REMUNERATION CONTINUED
  • 87.
    2016 PSP performanceconditions (to be granted in FY17) Performance period 1 July 2016 to 30 June 2019 Grant date 12 September 2016 Release date 12 September 2019 PSP value as % of salary for: Performance condition Weighting Threshold performance required Maximum performance required Below threshold Threshold Maximum Relative TSR(1) 1/3 Median of the comparator group Upper quartile of the comparator group 0 14.583 58.33 EPS(2) 1/3 22.01p 25.75p 0 14.583 58.33 Cash conversion 1/3 71% 101% 0 14.583 58.33 Total 100% 0 43.75 175 25% of award 100% of award (1) TSR is measured against a bespoke comparator group, with vesting subject to satisfactory financial performance as determined by the Committee. The comparator group is: Adecco SA, CDI Corporation, Kelly Services Inc., Manpower Inc., Michael Page International Plc (now Page Group), Randstad Holdings nv, Robert Half International Inc., Robert Walters Plc, and SThree Plc. During FY16 USG People NV was purchased by Recruit Holdings Co. Ltd and its shares delisted. It is therefore no longer in the comparator group. (2) The Committee took into account the following factors when setting the EPS targets for the award: – Budget (the setting of which is a robust and transparent process). – Company budget for FY17 and the expectations for performance; – Strategic direction of the business over the period covered by the PSP award; – Market conditions and visibility of future trading. – An assumed RPI of 3.0%. – The final threshold and maximum targets will be adjusted to reflect the actual RPI once known. – Analyst forecasts. (3) The award is subject to Malus for the three-year performance period and Clawback for two years post vesting. When the Committee met in August 2016 to finalise the targets for FY17, it was in the context of a more uncertain economic outlook, especially in the UK following the ‘Brexit’ referendum result. The Committee carefully considered the targets it should apply to incentive awards (i.e. both annual bonus and PSP awards) for FY17. In setting the EPS target (which represents one-third of the PSP award) for the FY17 PSP award, noting that the mechanics for this are consistent with prior years, it is recognised that the EPS target range is lower in absolute terms than the target applied to the awards made in FY16. However the Committee is comfortable that these targets are no less challenging in relative terms than the targets applied to the FY16 PSP awards and are consistent with external forecasts at that time. 4.2 Non-executive directors The Committee reviewed the Group Chairman’s fee during FY16 and determined that it should increase by 2.0% for FY17. This is in line with the pay review for other employees in the Company. The Board reviewed the fees for the other non-executive directors (NEDs) during FY16. They determined that their base fee should increase by 2.0% for FY17 in line with other increases across the Company. All increases are effective from 1 July 2016. The table below shows the changes. Position Fee for FY17 £000s Fee for FY16 £000s Chairman 250 245 Base fee 55 54 Committee Chairman 12 12 SID 10 10 Hays plc | 2016 Annual Report and Financial Statements83 OVERVIEW  STRATEGICREPORT  GOVERNANCE  FINANCIALSTATEMENTS  SHAREHOLDERINFORMATION
  • 88.
    Section 5 –Governance In this section: 5.1 Service contracts 5.2 Remuneration Committee members and attendees 5.3 Terms of reference 5.4 Meetings in FY16 5.5 Advisers to the Remuneration Committee 5.6 Engagement with shareholders 5.7 Considering risk 5.8 General governance 5.1 Service contracts A maximum 12-month notice period applies for executive directors. Current contract start date Unexpired term Notice period from Company Notice period from executive Alistair Cox September 2007 Indefinite One year One year Paul Venables May 2006 Indefinite One year Six months The non-executive directors do not have service contracts with the Company, but are appointed to the Board under letters of appointment for an initial three-year period. They have agreed to annual retirement and reappointment by shareholders at the Company’s Annual General Meeting and, with the exception of the Chairman, appointments can be terminated immediately by the Company. Letters of appointment are available for review from the Company Secretary and a pro forma letter of appointment can be viewed on the Company’s website, haysplc.com. Non-executive director Date appointed to the Board Date of current letter of appointment Notice period Alan Thomson 1 October 2010 14 July 2010 (Renewed) Three months Paul Harrison 8 May 2007 31 August 2011 (Renewed) None Victoria Jarman 1 October 2011 31 August 2011 (Renewed) None Torsten Kreindl 1 June 2013 30 May 2013 (Renewed) None Richard Smelt 15 November 2007 31 August 2011 (Renewed) Stood down at 2015 AGM Pippa Wicks 1 January 2012 30 November 2011 (Renewed) None Peter Williams 24 February 2015 24 February 2015 None MT Rainey 14 December 2015 14 December 2015 None 5.2 Remuneration Committee members and attendees The table below shows the members and attendees of the Remuneration Committee during 2016. Remuneration Committee members Position Comments Paul Harrison Chairman of the Remuneration Committee Independent Victoria Jarman Member from 1 October 2011 Independent Torsten Kreindl Member from 1 June 2013 Independent Richard Smelt Member from 15 November 2007 – stood down at 2015 AGM Independent Pippa Wicks Member from 1 January 2012 Independent Peter Williams Member from 24 February 2015 Independent MT Rainey Member from 14 December 2015 Independent Remuneration Committee attendees Position Comments Alan Thomson Group Chairman and standing attendee by invitation Independent upon appointment on 1 October 2010. Alistair Cox Chief Executive Attends by invitation but does not participate in any discussion directly about his own reward. Other executives The Group Head of Reward Attends by invitation as the executive responsible for advising on the Remuneration Policy. The Company Secretary Acts as Secretary to the Committee. The former Group HR Director Attended until his departure from the Company in November 2015. PwC Committee’s independent adviser until 30 June 2016. Attended by invitation. Stood down as independent adviser on 30 June 2016 following their appointment as Group external Auditor. No person is present during any discussion directly relating to his or her own remuneration. Hays plc | 2016 Annual Report and Financial Statements84 REMUNERATION REPORT ANNUAL REPORT ON REMUNERATION CONTINUED
  • 89.
    5.3 Terms ofreference The Board has delegated to the Committee, under agreed Terms of Reference, responsibility for the remuneration policy and for determining specific packages for the executive directors, the Chairman and other senior executives. The Company consults with key shareholders in respect of remuneration policy and the introduction of new incentive arrangements. The Terms of Reference for the Committee are available on the Company’s website, haysplc.com, and from the Company Secretary at the registered office. 5.4 Meetings in 2016 The Committee normally meets at least four times per year. During 2016, it formally met four times as well as having ongoing dialogue via email or telephone discussion. The meetings principally discussed the following key issues and activities: –– A review of the basic pay, bonus and PSP awards of the executive directors and other senior executives; –– Consideration of the appropriateness of the existing arrangements for the 2017 financial year; –– A review of the reward strategy in the context of Group risk; –– Consideration of the relationship between executive reward and the reward structures in place for other Group employees; –– A review of the Committee’s Terms of Reference; and –– Initial review of the future structure and appropriateness of the remuneration for executive directors in the light of being a cyclical business and in consideration of the new binding vote in 2017. 5.5 Advisers to the Remuneration Committee The Committee has continued to engage the services of PricewaterhouseCoopers LLP (PwC) as its independent adviser, who were appointed in 2014 following a formal tender process. During the financial year, PwC advised the Committee on all aspects of remuneration policy for executive directors and members of the Management Board. PwC also provided advice to the Company in relation to corporate tax, indirect tax and legal services. This work is carried out by an entirely separate group within PwC and is not felt to be in conflict with the independence and objectivity of the work carried out for the Committee. The Committee is satisfied that the advice received was objective and independent. PwC is a member of the Remuneration Consultants’ Group and the voluntary code of conduct of that body is designed to ensure objective and independent advice is given to Remuneration Committees. The total fee for 2016 in relation to Committee work was £198,700 excluding VAT. While fee estimates are generally required for each piece of work, fees are calculated based on time, with hourly rates in line with the level of expertise and seniority of the adviser concerned. Following the successful tender by PwC to become the Company’s new external Auditor, from 1 July 2016 PwC no longer act as the independent adviser to the Remuneration Committee. A new tender process will be conducted during FY17. 5.6 Engagement with shareholders The Committee seeks to maintain an active and productive dialogue with investors on developments in the remuneration aspects of corporate governance generally and any changes to the Company’s executive pay arrangements in particular. As the next binding vote on our executive Remuneration Policy approaches, the Committee is very mindful of the importance of having pro-active discussions with shareholders should there be any material changes to its remuneration structure or approach. 5.7 Considering risk Each year, the Committee considers the executive remuneration structure in the light of its key areas of risk. The summary table on page 69 indicates how the Remuneration Policy takes into account these risks. The Committee takes into consideration whether the achievement of objectives and any payment from plans have taken into account the overall risk profile of the Company when it evaluates the executives’ performance. 5.8 General governance The Directors’ Report on Remuneration has been prepared in accordance with Schedule 8 to The Large and Medium-sized Companies and Groups (Accounts and Reports) (Amendment) Regulations 2013, the revised provisions of the Code and the Listing Rules. By order of the Board Doug Evans Company Secretary 1 September 2016 Hays plc | 2016 Annual Report and Financial Statements85 OVERVIEW  STRATEGICREPORT  GOVERNANCE  FINANCIALSTATEMENTS  SHAREHOLDERINFORMATION
  • 90.
    Hays is incorporatedin the UK and registered as a public limited company in England and Wales. Its headquarters are in London and it is listed on the main market of the London Stock Exchange. Strategic Report A description of the Company’s business model and strategy is set out in the Strategic Report along with the factors likely to affect the Group’s future development, performance and position. Information on environmental, employee, social and community matters, including information on gender diversity within the Group, and an overview of the principal risks and uncertainties faced by the Group are also provided in the Strategic Report. The Statement of Compliance with the Code for the reporting period is contained in the Corporate Governance Statement. Information relating to matters addressed by the Audit, Remuneration and Nomination Committees, which operate within clearly defined terms of reference, are set out within the Audit, Remuneration and Nomination Committee Reports. All of the matters above are incorporated by reference into this Directors’ Report. The purpose of this Report is to provide information to the members of the Company, as a body. The Company, its directors, employees, agents or advisers do not accept or assume responsibility to any other person to whom this document is shown or into whose hands it may come and any such responsibility or liability is expressly disclaimed. This Report contains certain forward-looking statements with respect to the operations, performance and financial condition of the Group. By their nature, these statements involve uncertainty since future events and circumstances can cause results and developments to differ from those anticipated. The forward-looking statements reflect knowledge and information available at the date of preparation of this Report. Nothing in this Report should be construed as a profit forecast. Related party transactions Details of the related party transactions undertaken during the reporting period are contained in note 31 to the Consolidated Financial Statements. Post balance sheet events There have been no significant events to report since the date of the balance sheet. Dividends An interim dividend of 0.91 pence (2015: 0.87 pence) per Ordinary share was paid to shareholders on 5 April 2016. The Board recommends the payment of a final dividend of 1.99 pence (2015: 1.89 pence) per Ordinary share, representing a total dividend of 2.90 pence (2015: 2.76 pence) for the financial year ended 30 June 2016. Subject to the shareholders of the Company approving this recommendation at the 2016 AGM, the final dividend will be paid on 11 November 2016 to those shareholders appearing on the register of members as at 14 October 2016. The ex-dividend date is 13 October 2016. Financial instruments Details of the financial instruments used by the Group are set out in notes 18 to 20 to the Consolidated Financial Statements. A general outline of Hays’ use of financial instruments is set out in the treasury management section on page 41 of the Financial Review of this Report. Directors Biographies of the serving directors of Hays are provided on pages 50 and 51 of this Report. They all served on the Board throughout the 2016 financial year, with the exception of MT Rainey, who joined the Board on 14 December 2015. In addition, Richard Smelt served on the Board during the year until his retirement on 11 November 2015. General powers of the directors The powers of the directors are contained in the Company’s Articles of Association. These powers may be exercised by any meeting of the Board at which a quorum of three directors is present. The power of the Board to manage the business is subject to any limitations imposed by the Companies Act 2006, the Articles of Association (Articles) or any directions given by special resolution of the shareholders applicable at a relevant time. The Articles contain an express authority for the appointment of executive directors and provide the directors with the authority to delegate or confer upon such directors any of the powers exercisable by them upon such terms and conditions and with such restrictions as they see fit. The Articles contain additional authorities to delegate powers and discretions to committees and sub-committees. Directors’ powers to allot and buy back shares The directors have the power to authorise the issue and buy-back of the Company’s shares by the Company, subject to authority being given to the directors by the shareholders in general meeting, applicable legislation and the Articles. Appointment and replacement of directors Shareholders may appoint any person who is willing to act as a director by ordinary resolution and may remove any director by ordinary resolution. The Board may appoint any person to fill any vacancy or as an additional director, provided that they are submitted for election by the shareholders at the AGM following their appointment. Specific conditions apply to the vacation of office, including cases where a director becomes prohibited by law or regulation from holding office, or is persistently absent from directors’ meetings, or if three-quarters of appointed directors request his or her resignation or in the case of mental incapacity or bankruptcy. Directors’ interests Details of the interests of Hays’ directors and their connected persons in the Ordinary shares of the Company are outlined in the Remuneration Report. Directors’ indemnities The Company continues to maintain third-party directors’ and officers’ liability insurance for the benefit of its directors. This provides insurance cover for any claim brought against directors or officers for wrongful acts in connection with their positions. The directors have also been granted qualifying third-party indemnities, as permitted under the Companies Act 2006, which remain in force. Neither the insurance nor the indemnities extend to claims arising from fraud or dishonesty and do not provide cover for civil or criminal fines or penalties provided by law. Share capital Hays has one class of Ordinary shares which carry no right to fixed income or control over the Company. These shares may be held in certificated or uncertificated form. On 30 June 2016, the Company had 1,464,096,566 fully paid Ordinary shares in issue, of which 31,163,744 Ordinary shares were held in treasury by the Company. Hays plc | 2016 Annual Report and Financial Statements86 DIRECTORS’ REPORT
  • 91.
    The rights andobligations attaching to the Company’s Ordinary shares are contained in the Articles. In brief, the Ordinary shares allow holders to receive dividends and to exercise one vote on a poll per Ordinary share for every holder present in person or by proxy at general meetings of the Company. They also have the right to a return of capital on the winding up of the Company. There are no restrictions on the size of holding or the transfer of shares, which are both governed by the general provisions of the Company’s Articles and legislation. Under the Articles, the directors have the power to suspend voting rights and the right to receive dividends in respect of Ordinary shares and to refuse to register a transfer of Ordinary shares in circumstances where the holder of those shares fails to comply with a notice issued under Section 793 of the Companies Act 2006. The directors also have the power to refuse to register any transfer of certificated shares that does not satisfy the conditions set out in the Articles. The Company is not aware of any agreements between shareholders that might result in the restriction of transfer of voting rights in relation to the shares held by such shareholders. Treasury shares As Hays has only one class of share in issue, it may hold a maximum of 10% of its issued share capital in treasury. As at 30 June 2016, 2.13% of the Company’s shares were held in treasury. Legislation restricts the exercise of rights on Ordinary shares held in treasury. The Company is not allowed to exercise voting rights conferred by the shares whilst they are held in treasury. It is prohibited from paying any dividend or making any distribution of assets on treasury shares. Once in treasury, shares can only be sold for cash, transferred to an employee share scheme or cancelled. During the 2016 financial year, Hays transferred 11,898,607 shares out of treasury to satisfy the award of shares under the Company’s employee share schemes. Shares held by the Employee Benefit Trust The Hays plc Employee Share Trust (the Trust) is an employee benefit trust which is permitted to hold Ordinary shares in the Company for employee share schemes purposes. No shares were held by the Trust as at the year end. Shares held in the Trust may be transferred to participants of the various Group share schemes. No voting rights are exercisable in relation to shares unallocated to individual beneficiaries. Dilution limits in respect of share schemes The current Association of British Insurers (ABI) guidance (responsibility for which now rests with the Investment Association) on dilution limits provide that the overall dilution under all share plans operated by a company should not exceed 10% over a 10-year period in relation to the Company’s share capital, with a further limitation of 5% in any 10-year period on executive plans. The Company’s share plans operate within ABI recommended guidelines on dilution limits. Major shareholders As at 30 June 2016, the following shareholders held an interest of 3% or more of the Company’s issued share capital: % of total voting rights Cedar Rock Capital Limited 7.8% BlackRock Inc 7.2% Virtus Trust 7.2% Baillie Gifford Co 6.5% Marathon Asset Management 6.4% Heronbridge Investment Management LLP 4.0% Majedie Asset Management 3.8% Columbia Threadneedle Investments 3.5% Employees Our goal is for our people to reach their full potential and to give of their best as individuals and in teams. In this context, we are committed to never discriminating on the grounds of race, colour, creed, disability, religion, ethnic origin, gender, sexual orientation or age. All Hays employees are required to abide by these principles which are set out in the Group’s Equal Opportunities Policy and Code of Conduct. Hays gives full consideration to applications for employment from disabled persons where they have the right skills and abilities for the role. Should an employee become disabled whilst working for the Group, Hays would make every effort to accommodate them, to assist them in any re-training or to find suitable alternative employment within the Group. Employee involvement Ongoing communication forms the basis of the partnership between Hays’ leadership and its employees. Employees receive business performance updates from Alistair Cox, the Chief Executive, and from their respective regional Managing Directors, by email on a four-weekly basis. These are posted on the Group’s intranet, which acts as a source of reference for the Group’s brand, values, policies and procedures. Regular presentations are also made to employees by the Chief Executive and regional Managing Directors during office visits made over the course of the year. Hays continues to provide tailored training to the people who are in the front line of delivering recruitment solutions as well as in management and leadership roles. These programmes take a number of different guises across the Group’s regional businesses but all share the common goal of improving the service we provide to clients. To ensure that employees remain engaged in our business, an annual employee engagement survey, known as TALKback, is carried out each year. This allows employees to voice their views and opinions on all aspects of their workplace environment, training and development, work culture, leadership and client relations. The results, which indicate employee engagement levels and highlight any areas of concern, are presented to the Management Board and to the Board. Hays believes in the value of loyalty and considers its employee incentive programme of commission schemes, performance- related cash bonuses and share schemes to be important factors in keeping its employees motivated. The employee share schemes have been running successfully since inception and provide many employees with an additional stake in the business. Articles of Association The Company’s Articles may only be amended by special resolution of the shareholders. Disclosure of information to the Auditor So far as the directors who held office at the date of approval of this Report are aware, there is no relevant audit information of which the external Auditor is unaware and each director has taken all steps that he or she ought to have taken as a director to make himself or herself aware of any relevant audit information and to establish that the external Auditor is aware of that information. This confirmation should be interpreted in accordance with Section 418 of the Companies Act 2006. Hays plc | 2016 Annual Report and Financial Statements87 OVERVIEW  STRATEGICREPORT  GOVERNANCE  FINANCIALSTATEMENTS  SHAREHOLDERINFORMATION
  • 92.
    2016 Annual Reportand Financial Statements On the recommendation of the Audit Committee and having considered all matters brought to the attention of the Board during the financial year, the Board is satisfied that the Annual Report and Financial Statements, taken as a whole, is fair, balanced and understandable. The Board believes that the disclosures set out in the Annual Report provide the information necessary for shareholders to assess the Company’s performance, business model and strategy. Annual General Meeting The Company’s AGM will be held at 12 noon on 9 November 2016 at the offices of UBS, 5 Broadgate, London EC2M 2QS. The Notice of Meeting sets out the resolutions to be proposed at the AGM and gives details of the voting record date and proxy appointment deadline for that Meeting. The Notice of Meeting is contained in a separate circular to shareholders which is being mailed or otherwise provided to shareholders at the same time as this Report. Auditor Resolutions 13 and 14 at the forthcoming AGM will respectively propose the appointment of PricewaterhouseCoopers LLP as Auditor of the Company and authorise the directors to determine its remuneration. These resolutions will be proposed as ordinary resolutions and shall have effect until the conclusion of the next general meeting of the Company at which accounts are laid. Political donations The Company made no political donations during the year and intends to maintain its policy of not making such payments. It will however as a precautionary measure to avoid inadvertent breach of the law, seek shareholder authority at the 2016 AGM to make limited donations or incur limited political expenditure, although it has no intention of using the authority. Resolution 15 will be proposed as an ordinary resolution to seek authority to make political donations, and if passed, such authority shall expire at the conclusion of the 2017 AGM. Authority to allot shares At the 2015 AGM, shareholders authorised the directors, subject to the Companies Act 2006, to allot Ordinary shares or grant rights to subscribe for or grant rights to subscribe for or convert any securities into shares without the prior consent of shareholders. This authority expires at the conclusion of the 2016 AGM. Accordingly, Resolution 16 will be proposed as an ordinary resolution to renew this authority for a period expiring at the conclusion of the 2017 AGM. The directors have no present intention of exercising this authority. Disapplication of pre-emption rights Also at last year’s meeting, a special resolution was passed under the Companies Act 2006 empowering the directors to allot equity securities for cash without first being required to offer such shares to existing shareholders. Resolution 17 will seek to renew this authority. If approved, the resolution will authorise directors in accordance with the Articles to issue shares in connection with a rights issue and otherwise to issue shares for cash up to a specified maximum nominal amount which includes the sale on a non pre-emptive basis of any shares held in treasury. Resolution 17 will be proposed as a special resolution to renew this authority for a period expiring at the conclusion of the 2017 AGM. Authority to purchase own shares A special resolution was also passed at last year’s meeting enabling the Company to purchase its own shares in the market. Resolution 18 will seek to renew this authority. The directors intend only to exercise this authority if to do so would, in their opinion, enhance shareholder value. The Company will have the option of holding, as treasury shares, any of its own shares that it purchases pursuant to the authority conferred by this resolution. This would give the Company the ability to sell treasury shares, providing the Company with flexibility in the management of its employee shares schemes. No dividends will be paid on shares whilst held in treasury and no voting rights will attach to the treasury shares. The price paid for Ordinary shares will not be less than the nominal value of 1 pence per share and not more than the higher of 5% above the average of the middle market quotations of the Company’s Ordinary shares as derived from the London Stock Exchange. Resolution 18 will be proposed as a special resolution to renew this authority for a period expiring at the conclusion of the 2017 AGM. Notice of general meetings The notice period required by the Companies Act 2006 for general meetings of the Company is 21 clear days, unless shareholders approve a shorter notice period, which cannot however be less than 14 clear days. At last year’s AGM, shareholders authorised the calling of general meetings other than an AGM on not less than 14 clear days’ notice and Resolution 19 will be proposed as a special resolution and seeks to renew this authority. The authority granted by this resolution, if passed, will be for a period expiring at the conclusion of the 2017 AGM. The flexibility offered by this resolution will be used where, taking into account the circumstances, the directors consider this appropriate in relation to the business to be considered at the meeting and in the interests of the Company and shareholders as a whole. New share schemes Resolutions 20 and 21 seek shareholders’ approval to two share plans. One is replacement, on the same terms, of the Company’s existing Deferred Annual Bonus Plan, awards under which will continue to be made in accordance with the policy approved by shareholders at the 2014 AGM; the existing plan expires before the next AGM in 2017. The second plan is a US S423 Stock Purchase Plan, which is an all- employee share plan similar to that offered to employees under our Sharesave Plans in the UK and certain other countries, approved by shareholders in 2009. Resolutions 20 and 21 will be proposed as ordinary resolutions. Recommendation The directors consider that all the resolutions to be put to the meeting are in the best interests of the Company and its shareholders as a whole. Your Board will be voting in favour of them and unanimously recommends that you do so as well. By order of the Board Doug Evans Company Secretary 1 September 2016 Hays plc | 2016 Annual Report and Financial Statements88 DIRECTORS’ REPORT CONTINUED
  • 93.
    The directors areresponsible for preparing the Annual Report and Financial Statements in accordance with applicable law and regulations. Company law requires the directors to prepare financial statements for each financial year. Under that law the directors are required to prepare the Consolidated Financial Statements in accordance with International Financial Reporting Standards (IFRSs) as adopted by the European Union and Article 4 of the IAS Regulation and they have elected to prepare the parent Company financial statements in accordance with United Kingdom Generally Accepted Accounting Practice (United Kingdom Accounting Standards and applicable law). Under company law the directors must not approve the financial statements unless they are satisfied that they give a true and fair view of the state of affairs of the Company and of the profit or loss of the Company for that period. In preparing the parent Company financial statements, the directors are required to: –– select suitable accounting policies and then apply them consistently; –– make judgments and accounting estimates that are reasonable and prudent; –– state whether applicable UK Accounting Standards have been followed, subject to any material departures disclosed and explained in the financial statements; and –– prepare the financial statements on the going concern basis unless it is inappropriate to presume that the Company will continue in business. In preparing the Consolidated Financial Statements, International Accounting Standard 1 requires that directors: –– properly select and apply accounting policies; –– present information, including accounting policies, in a manner that provides relevant, reliable, comparable and understandable information; –– provide additional disclosures when compliance with the specific requirements in IFRSs are insufficient to enable users to understand the impact of particular transactions, other events and conditions on the entity’s financial position and financial performance; and –– make an assessment of the Company’s ability to continue as a going concern. The directors are responsible for keeping adequate accounting records that are sufficient to show and explain the Company’s transactions and disclose with reasonable accuracy at any time the financial position of the Company and enable them to ensure that the financial statements comply with the Companies Act 2006. They are also responsible for safeguarding the assets of the Company and hence for taking reasonable steps for the prevention and detection of fraud and other irregularities. The directors are responsible for the maintenance and integrity of the corporate and financial information included on the Company’s website. Legislation in the United Kingdom governing the preparation and dissemination of financial statements may differ from legislation in other jurisdictions. Responsibility statement The Board confirms to the best of its knowledge that: –– the Financial Statements, prepared in accordance with the relevant financial reporting framework, give a true and fair view of the assets, liabilities, financial position and profit or loss of the Company and the undertakings included in the consolidation taken as a whole; –– the Strategic Report, including any matters incorporated by reference in the Directors’ Report, includes a fair review of the development and performance of the business and the position of the Company and the undertakings included in the consolidation taken as a whole, together with a description of the principal risks and uncertainties that they face; and –– the Annual Report and Financial Statements, taken as a whole, are fair, balanced and understandable and provide the information necessary for shareholders to assess the Company’s performance, business model and strategy. By order of the Board Alistair Cox Chief Executive Paul Venables Group Finance Director 1 September 2016 Hays plc | 2016 Annual Report and Financial Statements89 OVERVIEW  STRATEGICREPORT  GOVERNANCE  FINANCIALSTATEMENTS  SHAREHOLDERINFORMATION DIRECTORS’ RESPONSIBILITIES
  • 94.
    Hays plc |2016 Annual Report and Financial Statements90
  • 95.
    Financial Statements Financial Statementsfor the Group including the report from the independent Auditor. In this section: 92 Independent Auditor’s Report 96 Consolidated Group Financial Statements 125 Hays plc Company Financial Statements Hays plc | 2016 Annual Report and Financial Statements91 OVERVIEW  STRATEGICREPORT  GOVERNANCE  FINANCIALSTATEMENTS  SHAREHOLDERINFORMATION
  • 96.
    Opinion on financialstatements of Hays plc In our opinion: –– the financial statements give a true and fair view of the state of the Group’s and of the parent Company’s affairs as at 30 June 2016 and of the Group’s profit for the year then ended; –– the Group financial statements have been properly prepared in accordance with International Financial Reporting Standards (IFRSs) as adopted by the European Union; –– the parent Company financial statements have been properly prepared in accordance with United Kingdom Generally Accepted Accounting Practice, including FRS 101 ‘Reduced Disclosure Framework’; and –– the financial statements have been prepared in accordance with the requirements of the Companies Act 2006 and, as regards the Group financial statements, Article 4 of the IAS Regulation. The financial statements comprise the Consolidated Income Statement, the Consolidated Statement of Comprehensive Income, the Consolidated and Parent Company Balance Sheets, the Consolidated Statement of Changes in Equity, the Consolidated Cash Flow Statement and the related notes 1 to 35 for the Consolidated financial statements and the related notes 1 to 15 for the parent Company financial statements. The financial reporting framework that has been applied in the preparation of the Group financial statements is applicable law and IFRSs as adopted by the European Union. The financial reporting framework that has been applied in the preparation of the parent Company financial statements is applicable law and United Kingdom Accounting Standards (United Kingdom Generally Accepted Accounting Practice), including FRS 101 ‘Reduced Disclosure Framework’. Going concern and the directors’ assessment of the principal risks that would threaten the solvency or liquidity of the Group As required by the Listing Rules we have reviewed the directors’ statement regarding the appropriateness of the going concern basis of accounting contained within note 2b to the financial statements and the directors’ statement on the longer-term viability of the Group contained within the Strategic Report on pages 42 and 43. We have nothing material to add or draw attention to in relation to: –– the directors’ confirmation on page 89 that they have carried out a robust assessment of the principal risks facing the Group, including those that would threaten its business model, future performance, solvency or liquidity; –– the disclosures on pages 42 to 45 that describe those risks and explain how they are being managed or mitigated; –– the directors’ statement in note 2b to the financial statements about whether they considered it appropriate to adopt the going concern basis of accounting in preparing them and their identification of any material uncertainties to the Group’s ability to continue to do so over a period of at least 12 months from the date of approval of the financial statements; –– the directors’ explanation on pages 42 and 43 as to how they have assessed the prospects of the Group, over what period they have done so and why they consider that period to be appropriate, and their statement as to whether they have a reasonable expectation that the Group will be able to continue in operation and meet its liabilities as they fall due over the period of their assessment, including any related disclosures drawing attention to any necessary qualifications or assumptions. We agreed with the directors’ adoption of the going concern basis of accounting and we did not identify any such material uncertainties. However, because not all future events or conditions can be predicted, this statement is not a guarantee as to the Group’s ability to continue as a going concern. Independence We are required to comply with the Financial Reporting Council’s Ethical Standards for Auditors and we confirm that we are independent of the Group and we have fulfilled our other ethical responsibilities in accordance with those standards. We also confirm we have not provided any of the prohibited non-audit services referred to in those standards. Our assessment of risks of material misstatement The assessed risks of material misstatement described below are those that had the greatest effect on our audit strategy, the allocation of resources in the audit and directing the efforts of the engagement team: Risk How the scope of our audit responded to the risk Debtor and accrued income recoverability The recoverability of trade receivables, accrued income and the level of provisions for bad debts are considered to be a significant risk due to the pervasive nature of these balances to the financial statements, and the importance of cash collection with reference to the working capital management of the business. At 30 June 2016, the total receivables and accrued income balances net of provisions included in note 17 was £695.8 million (2015: £558.9 million). Refer to the provisions in respect of recoverability of trade receivables critical accounting judgment and note 17 to the financial statements for further detail. We have: –– assessed the design and implementation of key controls around the monitoring of recoverability; –– challenged management regarding the level and ageing of receivables and accrued income, along with the consistency and appropriateness of receivables and accrued income provisioning by assessing recoverability with reference to cash received in respect of debtors and billings raised against accrued income. In addition we have considered the Company’s previous experience of bad debt exposure, the individual counter-party credit risk, the level of provision held by other recruitment businesses and the general economic environment in each jurisdiction; –– critically assessed the recoverability of overdue unprovided debt with reference to the historical levels of bad debt expense and credit profile of the counter-parties; –– tested these balances on a sample basis through agreement to post period end invoicing, post period end cash receipt or agreement to the terms of the contract in place, as appropriate; and –– considered the consistency of judgments regarding the recoverability of trade receivables and accrued income made year on year to consider whether there is evidence of management bias through discussion with management on their rationale and obtaining evidence to support judgment areas. Hays plc | 2016 Annual Report and Financial Statements92 INDEPENDENT AUDITOR’S REPORT TO THE MEMBERS OF HAYS PLC
  • 97.
    Risk How thescope of our audit responded to the risk Revenue recognition The key risks on revenue recognition are: –– cut-off where revenue is not recognised in line with Group policy, which is to recognise revenue associated with temporary placements over the period that temporary workers are provided, and permanent placements on the start date; and –– the presentation of revenue from temporary placements where Hays acts as a principal and revenue is recognised and presented on a gross rather than a net basis. The risks noted above in relation to revenue are areas that can involve management judgment, therefore they are considered to be significant risks. Refer to the revenue recognition critical accounting judgment in note 3 to the financial statements for further detail. We have: –– assessed the design and implementation and operating effectiveness of key controls around all streams of revenue recognised; –– considered the appropriateness and accuracy of any cut-off adjustments processed by considering the start date of permanent placements and the term of a temporary placement with reference to the year end date; –– evaluated whether revenue has been recognised in accordance with IAS 18 ‘Revenue’ and with Hays’ accounting policy by reviewing details of the Group revenue recognition policy, the application of this, and any significant new contracts; and –– confirmed that all material temporary worker contractual arrangements where Hays acts as a principal and maintains the majority of the risk and rewards associated with the underlying agreement have been recognised and presented on a gross revenue basis in the financial statements. Goodwill impairment The total goodwill balance at 30 June 2016 was £220.4 million (2015: £198.4 million). Management is required to carry out an annual impairment test. This process is complex and highly judgmental given the indefinite nature of the goodwill. It is based on assumptions about future growth and discount rates, which can be sensitive particularly in certain jurisdictions where the growth rates are typically linked to individual country GDP and country wage inflation. Therefore, a risk exists that goodwill is overstated on the balance sheet should any judgments or assumptions be considered inappropriate. Refer to the goodwill impairment critical accounting judgment and note 13 to the financial statements for further detail. We have: –– assessed the design and implementation of key controls around the impairment review process; –– performed a detailed review and challenge of the models used including the macroeconomic assumptions used; –– compared key assumptions (including discount rates and growth rates) used across the Group, used in the model to external data and, where possible, to information provided by Deloitte Valuations experts; –– assessed the reasonableness of forecast future cash flows by comparison to historical performance and future outlook; –– performed sensitivity analysis on key assumptions, including discount rates adopted; and –– performed a detailed review of the disclosures in respect of impairments and impairment testing adopted by management. Pension accounting Pension accounting is complex and contains areas of significant judgment, notably the discount and inflation rates and demographic assumptions used in the valuation of the net liability. Therefore, a risk exists that inappropriate assumptions are used resulting in an inaccurate pension valuation at year-end. The net pension liability balance at 30 June 2016 was £14.3 million (2015: £58.7 million). The net pension liability recognised is lower than the present value of future contributions to fund the existing deficit. Refer to the pension accounting critical accounting judgment and note 22 to the financial statements for further detail. We have: –– assessed the design and implementation of key controls around the pension accounting; –– assessed the actuarial assumptions (discount rate, inflation rates, and mortality assumptions) adopted by the Group for the valuation of its retirement benefit obligations, with specific focus on changes to demographic assumptions and rates in the year; –– utilised internal specialists to consider these assumptions and benchmarked them against a relevant comparator group; –– reviewed the pension scheme liability. Whilst the scheme is currently in a net deficit position, the net pension liability recognised is lower than the present value of future contributions to fund the existing deficit. In order to assess whether an additional liability would need to be recognised, we reviewed the pension scheme trust documents to assess whether Hays has an unconditional right to any scheme surplus; and –– reviewed the disclosures made in note 22 and compared these to the requirements of IAS 19 ‘Employee Benefits’. Hays plc | 2016 Annual Report and Financial Statements93 OVERVIEW  STRATEGICREPORT  GOVERNANCE  FINANCIALSTATEMENTS  SHAREHOLDERINFORMATION
  • 98.
    Last year ourreport included one other risk which is not included in our report this year: acquisition accounting in respect to the acquisition of Veredus (the acquisition accounting period has now ended and we no longer see this as a specific risk area). The description of risks above should be read in conjunction with the significant issues considered by the Audit Committee discussed on pages 61 and 62. These matters were addressed in the context of our audit of the financial statements as a whole, and in forming our opinion thereon, and we do not provide a separate opinion on these matters. Our application of materiality We define materiality as the magnitude of misstatement in the financial statements that makes it probable that the economic decisions of a reasonably knowledgeable person would be changed or influenced. We use materiality both in planning the scope of our audit work and in evaluating the results of our work. We determined materiality for the Group to be £8.0 million (2015: £7.4 million), which is approximately 5% (2015: 5.0%) of profit before tax, and below 3% (2015: 3%) of equity. Profit before tax has been selected as the basis for materiality as this is the measure by which key stakeholders and the market assess the performance of the Group. We agreed with the Audit Committee that we would report to the Committee all audit differences in excess of £160,000 (2015: £150,000), as well as differences below that threshold that, in our view, warranted reporting on qualitative grounds. We also report to the Audit Committee on disclosure matters that we identified when assessing the overall presentation of the financial statements. An overview of the scope of our audit 1. Full scope audit 90% 2. Specified procedures 2% 3. Head office review 8% Net fees 1. 3.2. 1. Full scope audit 95% 2. Specified procedures 1% 3. Head office review 4% Profit before tax 1.3. 2. Our Group audit was scoped by obtaining an understanding of the Group and its environment, including Group-wide controls, and assessing the risks of material misstatement at the Group level. Based on that assessment, we focused our Group audit scope primarily on the audit work at 32 (2015: 33) locations. 19 (2015: 19) of these were subject to a full audit, whilst the remaining 13 (2015: 14) were subject to an audit of specified account balances/specified audit procedures where the extent of our testing was based on our assessment of the risks of material misstatement and of the materiality of the Group’s operations at those locations. These 19 locations represent the principal business units within the Group’s three reportable segments and account for 90% (2015: 90%) of the Group’s net fees and 95% (2015: 92%) of profit before tax. The three key locations are Australia (APAC), Germany (CERoW) and UK (UK Ireland) which account for 70% of net fees and 81% of profit before tax. Our audit work at the 32 locations were executed at levels of materiality applicable to each individual entity which were lower than Group materiality and ranged from £1.3 million to £5.0 million (2015: £1.2 million to £4.7 million). At the parent entity level we also tested the consolidation process and carried out analytical procedures to confirm our conclusion that there were no significant risks of material misstatement of the aggregated financial information of the remaining components not subject to audit or audit of specified account balances. The Group audit team continued to follow a programme of planned visits that has been designed so that the Senior Statutory Auditor or a senior member of the Group audit team visits each of the material locations where the Group audit scope was focused at least once every two years. During the 2016 audit, the Senior Statutory Auditor visited the UK, Australia and Hong Kong. In addition, senior members of the audit team visited Germany and the USA. In years when we do not visit a significant component we will include the component audit team in our team planning and risk briefing, discuss their risk assessment, participate in the close meeting and review documentation of the findings from their work. Opinion on other matters prescribed by the Companies Act 2006 In our opinion: –– the part of the Directors’ Remuneration Report to be audited has been properly prepared in accordance with the Companies Act 2006; and –– the information given in the Strategic Report and the Directors’ Report for the financial year for which the financial statements are prepared is consistent with the financial statements. Hays plc | 2016 Annual Report and Financial Statements94 INDEPENDENT AUDITOR’S REPORT TO THE MEMBERS OF HAYS PLC CONTINUED
  • 99.
    Matters on whichwe are required to report by exception Adequacy of explanations received and accounting records Under the Companies Act 2006 we are required to report to you if, in our opinion: –– we have not received all the information and explanations we require for our audit; or –– adequate accounting records have not been kept by the parent Company, or returns adequate for our audit have not been received from branches not visited by us; or –– the parent Company financial statements are not in agreement with the accounting records and returns. We have nothing to report in respect of these matters. Directors’ remuneration Under the Companies Act 2006 we are also required to report if in our opinion certain disclosures of directors’ remuneration have not been made or the part of the Directors’ Remuneration Report to be audited is not in agreement with the accounting records and returns. We have nothing to report arising from these matters. Corporate Governance Statement Under the Listing Rules we are also required to review the part of the Corporate Governance Statement relating to the Company’s compliance with certain provisions of the UK Corporate Governance Code. We have nothing to report arising from our review. Our duty to read other information in the Annual Report Under International Standards on Auditing (UK and Ireland), we are required to report to you if, in our opinion, information in the Annual Report is: –– materially inconsistent with the information in the audited financial statements; or –– apparently materially incorrect based on, or materially inconsistent with, our knowledge of the Group acquired in the course of performing our audit; or –– otherwise misleading. In particular, we are required to consider whether we have identified any inconsistencies between our knowledge acquired during the audit and the directors’ statement that they consider the Annual Report is fair, balanced and understandable and whether the Annual Report appropriately discloses those matters that we communicated to the Audit Committee which we consider should have been disclosed. We confirm that we have not identified any such inconsistencies or misleading statements. Respective responsibilities of directors and Auditor As explained more fully in the Directors’ Responsibilities Statement, the directors are responsible for the preparation of the financial statements and for being satisfied that they give a true and fair view. Our responsibility is to audit and express an opinion on the financial statements in accordance with applicable law and International Standards on Auditing (UK and Ireland). We also comply with International Standard on Quality Control 1 (UK and Ireland). Our audit methodology and tools aim to ensure that our quality control procedures are effective, understood and applied. Our quality controls and systems include our dedicated professional standards review team, and independent partner reviews. This report is made solely to the Company’s members, as a body, in accordance with Chapter 3 of Part 16 of the Companies Act 2006. Our audit work has been undertaken so that we might state to the Company’s members those matters we are required to state to them in an auditor’s report and for no other purpose. To the fullest extent permitted by law, we do not accept or assume responsibility to anyone other than the Company and the Company’s members as a body, for our audit work, for this report, or for the opinions we have formed. Scope of the audit of the financial statements An audit involves obtaining evidence about the amounts and disclosures in the financial statements sufficient to give reasonable assurance that the financial statements are free from material misstatement, whether caused by fraud or error. This includes an assessment of: whether the accounting policies are appropriate to the Group’s and the parent Company’s circumstances and have been consistently applied and adequately disclosed; the reasonableness of significant accounting estimates made by the directors; and the overall presentation of the financial statements. In addition, we read all the financial and non-financial information in the Annual Report to identify material inconsistencies with the audited financial statements and to identify any information that is apparently materially incorrect based on, or materially inconsistent with, the knowledge acquired by us in the course of performing the audit. If we become aware of any apparent material misstatements or inconsistencies we consider the implications for our report. Stephen Griggs (Senior Statutory Auditor), FCA for and on behalf of Deloitte LLP Chartered Accountants and Statutory Auditor London, United Kingdom 1 September 2016 Hays plc | 2016 Annual Report and Financial Statements95 OVERVIEW  STRATEGICREPORT  GOVERNANCE  FINANCIALSTATEMENTS  SHAREHOLDERINFORMATION
  • 100.
    (In £s million)Note 2016 2015 Turnover Continuing operations 4,231.4 3,842.8 Net fees(1) Continuing operations 4 810.3 764.2 Operating profit from continuing operations 4 181.0 164.1 Net finance charge 8 (8.0) (8.0) Profit before tax 173.0 156.1 Tax 9 (51.9) (50.7) Profit from continuing operations after tax 121.1 105.4 Profit from discontinued operations 10 3.4 0.2 Profit attributable to equity holders of the parent Company 124.5 105.6 Earnings per share from continuing operations – Basic 12 8.48p 7.44p – Diluted 12 8.37p 7.31p Earnings per share from continuing and discontinued operations – Basic 12 8.72p 7.46p – Diluted 12 8.60p 7.33p (1) Net fees comprise turnover less remuneration of temporary workers and other recruitment agencies. (In £s million) 2016 2015 Profit for the year 124.5 105.6 Items that will not be reclassified subsequently to profit or loss: Actuarial remeasurement of defined benefit pension schemes 35.5 (25.8) Tax relating to components of other comprehensive income (7.2) 6.3 28.3 (19.5) Items that may be reclassified subsequently to profit or loss: Currency translation adjustments 64.3 (31.3) Mark to market valuation of derivative financial instruments – 0.1 Other comprehensive income for the year net of tax 92.6 (50.7) Total comprehensive income for the year 217.1 54.9 Attributable to equity shareholders of the parent Company 217.1 54.9 Hays plc | 2016 Annual Report and Financial Statements96 CONSOLIDATED INCOME STATEMENT FOR THE YEAR ENDED 30 JUNE CONSOLIDATED STATEMENT OF COMPREHENSIVE INCOME FOR THE YEAR ENDED 30 JUNE
  • 101.
    (In £s million)Note 2016 2015 Non-current assets Goodwill 13 220.4 198.4 Other intangible assets 14 21.6 29.8 Property, plant and equipment 15 19.8 15.6 Deferred tax assets 16 23.9 36.4 285.7 280.2 Current assets Trade and other receivables 17 763.9 600.5 Cash and cash equivalents 18 62.9 69.8 Derivative financial instruments 19 6.6 – 833.4 670.3 Total assets 1,119.1 950.5 Current liabilities Trade and other payables 21 (573.3) (478.7) Current tax liabilities (27.1) (19.5) Bank loans and overdrafts 20 (1.1) (0.5) Provisions 23 (3.1) (3.0) (604.6) (501.7) Non-current liabilities Bank loans 20 (25.0) (100.0) Acquisition liabilities 34 (11.2) (8.6) Retirement benefit obligations 22 (14.3) (58.7) Provisions 23 (6.2) (11.9) (56.7) (179.2) Total liabilities (661.3) (680.9) Net assets 457.8 269.6 Equity Called up share capital 24 14.7 14.7 Share premium 25 369.6 369.6 Capital redemption reserve 26 2.7 2.7 Retained earnings 27 (15.8) (138.2) Cumulative translation reserve 28 66.4 2.1 Equity reserve 29 20.2 18.7 Total shareholders’ equity 457.8 269.6 The Consolidated Financial Statements of Hays plc, registered number 2150950, were approved by the Board of Directors and authorised for issue on 1 September 2016. Signed on behalf of the Board of Directors A R Cox P Venables Hays plc | 2016 Annual Report and Financial Statements97 OVERVIEW  STRATEGICREPORT  GOVERNANCE  FINANCIALSTATEMENTS  SHAREHOLDERINFORMATION CONSOLIDATED BALANCE SHEET AT 30 JUNE
  • 102.
    (In £s million) Share capital Share premium account Capital redemption reserve Retained earnings Cumulative translation reserve Equity reserve Other reservesTotal At 1 July 2015 14.7 369.6 2.7 (138.2) 2.1 18.7 – 269.6 Currency translation adjustments – – – – 64.3 – – 64.3 Remeasurement of defined benefit pension schemes – – – 35.5 – – – 35.5 Tax relating to components of other comprehensive income – – – (7.2) – – – (7.2) Net expense recognised in other comprehensive income – – – 28.3 64.3 – – 92.6 Profit for the year – – – 124.5 – – – 124.5 Total comprehensive income for the year – – – 152.8 64.3 – – 217.1 Dividends paid – – – (39.9) – – – (39.9) Share-based payments – – – 10.2 – 1.5 – 11.7 Tax on share-based payment transactions – – – (0.7) – – – (0.7) At 30 June 2016 14.7 369.6 2.7 (15.8) 66.4 20.2 – 457.8 (In £s million) Share capital Share premium account Capital redemption reserve Retained earnings Cumulative translation reserve Equity reserve Other reserves Total At 1 July 2014 14.7 369.6 2.7 (197.7) 33.4 18.3 (0.3) 240.7 Currency translation adjustments – – – – (31.3) – – (31.3) Mark to market valuation of derivative financial instruments – – – – – – 0.1 0.1 Remeasurement of defined benefit pension schemes – – – (25.8) – – – (25.8) Tax relating to components of other comprehensive income – – – 6.3 – – – 6.3 Net expense recognised in other comprehensive income – – – (19.5) (31.3) – 0.1 (50.7) Profit for the year – – – 105.6 – – – 105.6 Total comprehensive income for the year – – – 86.1 (31.3) – 0.1 54.9 Dividends paid – – – (37.9) – – – (37.9) Share-based payments – – – 10.5 – 0.4 0.2 11.1 Tax on share-based payment transactions – – – 0.8 – – – 0.8 At 30 June 2015 14.7 369.6 2.7 (138.2) 2.1 18.7 – 269.6 Hays plc | 2016 Annual Report and Financial Statements98 CONSOLIDATED STATEMENT OF CHANGES IN EQUITY FOR THE YEAR ENDED 30 JUNE 2016 FOR THE YEAR ENDED 30 JUNE 2015
  • 103.
    (In £s million)Note 2016 2015 Operating profit from continuing operations 181.0 164.1 Adjustments for: Depreciation of property, plant and equipment 7.7 8.7 Amortisation of intangible assets 14.2 13.7 Net movements in provisions (1.2) (0.5) Share-based payments 11.9 10.8 32.6 32.7 Operating cash flow before movement in working capital 213.6 196.8 Movement in working capital: Increase in receivables (98.8) (53.0) Increase in payables 44.5 45.9 (54.3) (7.1) Cash generated by operations 159.3 189.7 Pension scheme deficit funding (14.4) (14.0) Income taxes paid (41.7) (43.6) Net cash inflow from operating activities 103.2 132.1 Investing activities Purchase of property, plant and equipment (10.3) (7.8) Proceeds from sales of business assets 0.1 0.2 Purchase of intangible assets (4.7) (4.3) Acquisition of subsidiaries – (35.7) Cash paid in respect of acquisitions made in previous years – (1.6) Interest received 0.5 0.5 Net cash used in investing activities (14.4) (48.7) Financing activities Interest paid (4.1) (5.7) Equity dividends paid (39.9) (37.9) Proceeds from exercise of share options 1.5 1.8 Decrease in bank loans and overdrafts (74.4) (10.2) Net cash used in financing activities (116.9) (52.0) Net (decrease)/increase in cash and cash equivalents (28.1) 31.4 Cash and cash equivalents at beginning of year 33 69.8 48.0 Effect of foreign exchange rate movements 21.2 (9.6) Cash and cash equivalents at end of year 33 62.9 69.8 Hays plc | 2016 Annual Report and Financial Statements99 OVERVIEW  STRATEGICREPORT  GOVERNANCE  FINANCIALSTATEMENTS  SHAREHOLDERINFORMATION CONSOLIDATED CASH FLOW STATEMENT FOR THE YEAR ENDED 30 JUNE
  • 104.
    1. General information Haysplc is a Company incorporated in the United Kingdom and registered in England and Wales and its registered office is 250 Euston Road, London NW1 2AF. The Consolidated Financial Statements have been prepared in accordance with International Financial Reporting Standards (IFRSs) and IFRS Interpretation Committee interpretations (IFRICs) as adopted by the European Union and therefore comply with Article 4 of the European Union International Accounting Standard (IAS) Regulation. New standards and interpretations The Consolidated Financial Statements have been prepared on the basis of the accounting policies and methods of computation applicable for the year ended 30 June 2016. These accounting policies are consistent with those applied in the preparation of the accounts for the year ended 30 June 2015 with the exception of the following new accounting standards, amendments and interpretations which were mandatory for accounting periods beginning on or after 1 January 2015, none of which had any material impact on the Group’s results or financial position. –– IAS 19 (amendments) Employee Benefits (EU adoption from 1 February 2015) –– Annual Improvements to IFRSs 2012 (EU adoption from 1 February 2015) –– Annual Improvements to IFRSs 2013 (EU adoption from 1 January 2015) There have been no alterations made to the accounting policies as a result of considering all IFRS and IFRIC amendments and interpretations that became effective during the financial year, as these were either not material to the Group’s operation, or were not relevant. The Group has not yet adopted certain new standards, amendments and interpretations to existing standards, which have been published but which are only effective for our accounting periods beginning on or after 1 July 2016. These new pronouncements are listed as follows: –– IFRS 14 Regulatory Deferral Accounts (effective 1 January 2016) –– IFRS 10 and IAS 28 (amendments) Investment Entities Applying the Consolidated Exemption (effective from 1 January 2016) –– IFRS 11 (amendments) Accounting for Acquisitions of Interests in Joint Operations (effective 1 January 2016) –– IAS 1 (amendments) Presentation of Financial Statements (effective from 1 January 2016) –– IAS 16 and IAS 38 (amendment) Clarification of Acceptable Methods of Depreciation and Amortisation (effective 1 January 2016) –– IAS 27 (amendments) Equity Method in Separate Financial Statements (effective from 1 January 2016) –– Annual Improvements to IFRSs 2014 (effective 1 January 2016) –– IAS 12 (amendments) Income Taxes (effective from 1 January 2017) –– IAS 7 (amendments) Statement of Cash Flows on Disclosure Initiative (effective from 1 January 2017) –– IFRS 2 (amendments) Share Based Payments (effective 1 January 2018) –– IFRS 9 Financial Instruments (effective 1 January 2018) –– IFRS 15 Revenue from Contracts and Customer (effective 1 January 2018) –– IFRS 15 (amendments) Revenue from Contracts and Customer (effective 1 January 2018) –– IFRS 16 Leases (effective 1 January 2019) The directors are currently evaluating the impact of the adoption of these standards, amendments and interpretations but do not expect them to have a material impact on the Group operation or results with the exception of IFRS 16 Leases. IFRS 16 will primarily change the lease accounting requirement for lessees as currently disclosed in note 32 to the Consolidated Financial Statements. The Group’s principal accounting policies adopted in the presentation of these financial statements are set out below and have been consistently applied to all the periods presented. 2. Significant accounting policies a. Basis of preparation The Consolidated Financial Statements have been prepared on the historical cost basis with the exception of financial instruments. Financial instruments have been recorded initially on a fair-value basis and then at amortised cost. b. Going concern The Group’s business activities, together with the factors likely to effect its future development, performance and viability are set out in the Strategic Report on pages 9 to 45. The financial position of the Group, its cash flows and liquidity position are described in the Financial Review on pages 38 to 41. In addition, notes 18 to 20 to the Consolidated Financial Statements include details of the Group’s treasury activities, long-term funding arrangements and exposure to financial risk. The Group has sufficient financial resources which, together with internally generated cash flows, will continue to provide sufficient sources of liquidity to fund its current operations, including its contractual and commercial commitments and any proposed dividends. Therefore the Group is well placed to manage its business risks. After making enquiries the directors have formed the judgment that at the time of approving the Consolidated Financial Statements there is a reasonable expectation that the Group has adequate resources to continue in operational existence for the foreseeable future. For this reason, the directors continue to adopt the going concern basis in preparing the Consolidated Financial Statements. c. Basis of consolidation Subsidiaries are fully consolidated from the date on which power to control is transferred to the Group. They are deconsolidated from the date on which control ceases. The acquisition method of accounting is used to account for the acquisition of subsidiaries by the Group whereby the identifiable assets, liabilities and contingent liabilities are measured at their fair values at the date of acquisition. The excess of the cost of acquisition over the fair value of the Group’s share of the identifiable net assets acquired is recorded as goodwill. The financial statements consolidate the accounts of Hays plc and all of its subsidiaries. The results of subsidiaries acquired or disposed during the year are included from the effective date of acquisition or up to the effective date of disposal as appropriate. Hays plc | 2016 Annual Report and Financial Statements100 NOTES TO THE CONSOLIDATED FINANCIAL STATEMENTS
  • 105.
    All intra-Group transactions,balances, income and expenses are eliminated on consolidation. d. Turnover Turnover is measured at the fair value of the consideration received or receivable and represents amounts receivable for goods and services provided in the normal course of business, net of discounts, VAT and other sales-related taxes. Turnover arising from the placement of permanent candidates is recognised at the time the candidate commences full-time employment. Provision is made for the expected cost of meeting obligations where employees do not work for the specified contractual period. Turnover arising from temporary placements is recognised over the period that temporary workers are provided. Where the Group is acting as a principal, turnover represents the amounts billed for the services of the temporary workers, including the remuneration costs of the temporary workers. Where Hays acts as principal in arrangements that invoice on behalf of other recruitment agencies, turnover represents amounts invoiced and collected on behalf of other recruitment agencies, including arrangements where no commission is directly receivable by the Group. Where the Group is acting as an agent, turnover represents commission receivable relating to the supply of temporary workers and does not include the remuneration costs of the temporary workers. e. Net fees Net fees represent turnover less the remuneration costs of temporary workers for temporary assignments and remuneration of other recruitment agencies. For the placement of permanent candidates, net fees are equal to turnover. f. Exceptional items Exceptional items as disclosed on the face of the Consolidated Income Statement are items which due to their size and non-recurring nature have been classified separately in order to draw them to the attention of the reader of the financial statements and to show the underlying profits of the Group. There are no exceptional items disclosed within the financial statements in the current or prior year. g. Foreign currencies On consolidation, the tangible and intangible assets and liabilities of subsidiaries denominated in foreign currencies are translated into sterling at the rates ruling at the balance sheet date. Income and expense items are translated into sterling at average rates of exchange for the period. Any exchange differences which have arisen from an entity’s investment in a foreign subsidiary, including long-term loans, are recognised as a separate component of equity and are included in the Group’s translation reserve. On disposal of a subsidiary, any amounts transferred to the translation reserve are included in the calculation of profit and loss on disposal. All other translation differences are dealt with in the Consolidated Income Statement. Goodwill and fair value adjustments arising on the acquisition of a foreign entity are treated as assets and liabilities of the foreign entity and translated at the closing rate. h. Retirement benefit costs The expense of defined benefit pension schemes and other post-retirement employee benefits is determined using the projected-unit credit method and charged to the Consolidated Income Statement as an expense, based on actuarial assumptions reflecting market conditions at the beginning of the financial year. All remeasurement gains and losses are recognised immediately in reserves and reported in the Consolidated Statement of Comprehensive Income in the period in which they occur. Past service costs, curtailments and settlements are recognised immediately in the Consolidated Income Statement. The Group has chosen under IFRS 1 to recognise in retained earnings all cumulative remeasurement gains and losses as at 1 July 2004, the date of transition to IFRS. The Group has chosen to recognise all remeasurement gains and losses arising subsequent to 1 July 2004 in reserves and reported in the Consolidated Statement of Comprehensive Income. The retirement benefit obligation recognised in the Consolidated Balance Sheet represents the present value of the defined benefit obligation as adjusted for unrecognised past service cost, and as reduced by the fair value of scheme assets. Any asset resulting from this calculation is limited to past service cost, plus the present value of available refunds and reductions in future contribution to the scheme. Payments to defined contribution schemes are charged as an expense in the Consolidated Income Statement as they fall due. i. Share-based payments The fair value of all share-based remuneration that is assessed upon market-based performance criteria is determined at the date of grant and recognised as an expense in the Consolidated Income Statement on a straight-line basis over the vesting period, taking account of the estimated number of shares that will vest. The fair value of all share-based remuneration that is assessed upon non-market-based performance criteria is determined at the date of the grant and recognised as an expense in the Consolidated Income Statement over the vesting period, based on the number of shares that are expected to vest. The number of shares that are expected to vest is adjusted accordingly to the satisfaction of the performance criteria at each period end. The fair values are determined by use of the relevant valuation models. All share-based remuneration is equity settled. j. Borrowing costs Interest costs are recognised as an expense in the Consolidated Income Statement in the period in which they are incurred. Arrangement fees incurred in respect of borrowings are amortised over the term of the agreement. k. Taxation The tax expense comprises both current and deferred tax. The tax currently payable is based on taxable profit for the year. Taxable profit differs from net profit as reported in the Consolidated Income Statement because it excludes items of income or expense that are taxable or deductible in other years and it further excludes items that are never taxable or deductible. The Group’s liability for current tax is calculated using tax rates that have been enacted or substantively enacted by the balance sheet date. Hays plc | 2016 Annual Report and Financial Statements101 OVERVIEW  STRATEGICREPORT  GOVERNANCE  FINANCIALSTATEMENTS  SHAREHOLDERINFORMATION
  • 106.
    2. Significant accountingpolicies continued Deferred tax is provided in full on all temporary differences, at rates that are enacted or substantively enacted by the balance sheet date. Deferred tax assets are recognised only to the extent that it is probable that taxable profits will be available against which to offset the deductible temporary differences. Deferred tax assets and liabilities are offset when there is a legally enforceable right to set off current tax assets against current tax liabilities and when they relate to income taxes levied by the same taxation authority and the Group intends to settle its current tax assets and liabilities on a net basis. Temporary differences arise where there is a difference between the accounting carrying value in the Consolidated Balance Sheet and the amount attributed to that asset or liability for tax purposes. Temporary differences arising from goodwill and, except in a business combination, the initial recognition of assets or liabilities that affect neither accounting profit nor taxable profit, are not provided for. Deferred tax liabilities are recognised for taxable temporary differences arising on investments in subsidiaries and associates except where the Group is able to control the reversal of the temporary differences and it is probable that the temporary difference will not reverse in the foreseeable future. The calculation of the Group’s total tax charge necessarily involves a degree of estimation and judgment in respect of certain items whose tax treatment cannot be finally determined until resolution has been reached with the relevant tax authority, or, as appropriate, through a formal legal process. Provisions for tax contingencies require management to make judgments and estimates in relation to tax audit issues and exposures. Amounts provided are based on management’s interpretation of applicable tax law and the likelihood of settlement, and are derived from the Group’s best estimation and judgment. However, the inherent uncertainty regarding the outcome of these items means the eventual resolution could differ from the provision and in such event the Group would be required to make an adjustment in a subsequent period. l. Goodwill Goodwill arising on consolidation represents the excess of purchase consideration less the fair value of the identifiable tangible and intangible assets and liabilities acquired. Goodwill is recognised as an asset and reviewed for impairment at least annually. For the purpose of impairment testing, assets are grouped at the lowest level for which there are separately identifiable cash flows, known as cash-generating units (CGUs). Any impairment is recognised immediately in the Consolidated Income Statement and is not subsequently reversed. On disposal of a business the attributable amount of goodwill is included in the determination of the profit or loss on disposal. Goodwill arising on acquisitions before the date of transition to IFRS (1 July 2004) has been retained at the previous UK GAAP amounts, subject to being tested for impairment at that date. Goodwill arising on acquisitions prior to 1 July 1998 was written off direct to reserves under UK GAAP. This goodwill has not been reinstated and is not included in determining any subsequent profit or loss on disposal. m. Intangible assets Intangible assets acquired as part of a business combination are stated in the Consolidated Balance Sheet at their fair value as at the date of acquisition less accumulated amortisation and any provision for impairment. The directors review intangible assets for indications of impairment annually. Internally generated intangible assets are stated in the Consolidated Balance Sheet at the directly attributable cost of creation of the asset, less accumulated amortisation. Intangible assets are amortised on a straight-line basis over their estimated useful lives up to a maximum of 10 years. Software incorporated into major Enterprise Resource Planning (ERP) implementations that support the recruitment process and financial reporting process is amortised over a life of up to seven years. Other software is amortised between three and five years. n. Property, plant and equipment Property, plant and equipment is recorded at cost, net of depreciation and any provision for impairment. Depreciation is provided on a straight-line basis over the anticipated useful working lives of the assets, after they have been brought into use, at the following rates: Freehold land –– No depreciation is provided Freehold buildings –– At rates varying between 2% and 10% Leasehold properties –– The cost is written off over the unexpired term of the lease Plant and machinery –– At rates varying between 5% and 33% Fixtures and fittings –– At rates varying between 10% and 25% o. Trade and other receivables Trade and other receivables are initially measured at fair value and then at amortised cost after appropriate allowances for estimated irrecoverable amounts have been recognised in the Consolidated Income Statement where there is objective evidence that the asset is impaired. p. Cash and cash equivalents Cash and cash equivalents comprise cash-in-hand and current balances with banks and similar institutions, which are readily convertible to known amounts of cash and which are subject to insignificant risk of changes in value. q. Trade payables Trade payables are measured initially at fair value and then at amortised cost. r. Bank borrowings Interest-bearing bank loans and overdrafts are recorded initially at fair value and subsequently measured at amortised cost. Finance charges, including premiums payable on settlement or redemption and direct-issue costs, are accounted for on an accrual basis in the Consolidated Income Statement using the effective interest rate method and are added to the carrying amount of the instrument to the extent that they are not settled in the period in which they arise. Hays plc | 2016 Annual Report and Financial Statements102 NOTES TO THE CONSOLIDATED FINANCIAL STATEMENTS CONTINUED
  • 107.
    s. Derivative financialinstruments and hedge accounting The Group may use certain derivative financial instruments to reduce its exposure to interest rate and foreign exchange movements. The Group held eight foreign exchange contracts at the end of the current year to facilitate cash management within the Group. In the prior year the Group held two interest rate swaps which have subsequently matured in the current year. The Group does not hold or use derivative financial instruments for speculative purposes. Changes in the fair value of derivative financial instruments that are designated and effective as hedges of future cash flows are recognised directly in equity and any ineffective portion is recognised immediately in the Consolidated Income Statement. The Group uses a range of 80% to 125% for hedge effectiveness, in accordance with IAS 39, and any relationship which has effectiveness outside this range is deemed to be ineffective and hedge accounting is suspended. The fair values of foreign exchange swaps are measured using inputs other than quoted prices that are observable for the asset or liability, either directly or indirectly. It is the Group’s policy not to seek to designate these derivatives as hedges. All derivative financial instruments not in a hedge relationship are classified as derivatives at fair value in the income statement. The fair value of long- term borrowing is calculated by discounting expected future cash flows at observable market rates. Fair value measurements The information below sets out how the Group determines fair value of various financial assets and financial liabilities. The following provides an analysis of financial instruments that are measured subsequent to initial recognition at fair value, grouped into Levels 1 to 3 based on the degree to which the fair value is observable. –– Level 1 fair value measurements are those derived from quoted prices (unadjusted) in active markets for identical assets or liabilities; –– Level 2 fair value measurements are those derived from inputs other than quoted prices included within Level 1 that are observable for the asset or liability either directly (i.e. as prices) or indirectly (i.e. derived from prices); and –– Level 3 fair value measurements are those derived from valuation techniques that include inputs for the asset or liability that are not based on observable market data (unobservable inputs). Amounts deferred in equity are recognised in the Consolidated Income Statement in the same period in which the hedged item affects net income. Cash flow hedge accounting is discontinued when a hedging instrument expires or is sold, terminated or exercised, or no longer qualifies for hedge accounting. At that time any cumulative gain or loss on the hedging instrument recognised in equity is either retained in equity until the firm commitment or forecasted transaction occurs, or where a hedge transaction is no longer expected to occur, is immediately credited or expensed in the Consolidated Income Statement. t. Leases Leases where a significant portion of risks and rewards of ownership are retained by the lessor are classified as operating leases by the lessee. Rentals payable under operating leases are charged to the Consolidated Income Statement on a straight-line basis over the lease term. Benefits received and receivable as an incentive to enter into an operating lease are recognised on a straight-line basis over the lease term. u. Provisions A provision is recognised when the Group has a present legal or constructive obligation as a result of a past event for which it is probable that an outflow of resources will be required to settle the obligation and when the amount can be reliably estimated. If the effect is material, provisions are determined by discounting the expected future cash flows at a pre-tax rate that reflects the current market assessments of the time value of money and the risks specific to the liability. 3. Critical accounting judgments and key sources of estimation uncertainty Critical accounting judgments Revenue recognition The main areas of judgment in revenue recognition relate to (i) cut-off as revenue is recognised for permanent placements on the day a candidate starts work and temporary placement income over the duration of the placement; and (ii) the recognition of temporary contractual arrangements where Hays act on a gross basis rather than a net basis. Turnover and Net fees are described in note 2 (d) and (e) to the Consolidated Financial Statements. Goodwill impairment Goodwill is tested for impairment at least annually. In performing these tests assumptions are made in respect of future growth rates and the discount rate to be applied to the future cash flows of income- generating units. These assumptions are set out in note 13 to the Consolidated Financial Statements. Provisions in respect of recoverability of trade receivables As described in note 17, provisions for impairment of trade receivables have been made. In reviewing the appropriateness of these provisions, consideration has been given to the ageing of the debt and the potential likelihood of default, taking into account current economic conditions. Estimation uncertainty Pension accounting Under IAS 19 ‘Employee Benefits’, the Group has recognised a pension deficit of £14.3 million (2015: £58.7 million). A number of assumptions have been made in determining the pension deficit and these are described in note 22 to the Consolidated Financial Statements. Hays plc | 2016 Annual Report and Financial Statements103 OVERVIEW  STRATEGICREPORT  GOVERNANCE  FINANCIALSTATEMENTS  SHAREHOLDERINFORMATION
  • 108.
    4. Segmental information IFRS8 Operating Segments IFRS 8 requires operating segments to be identified on the basis of internal reports about components of the Group that are regularly reviewed by the chief operating decision maker to allocate resources to the segment and to assess their performance. As a result, the Group continues to segment the business into three regions, Asia Pacific, Continental Europe Rest of World, and United Kingdom Ireland. There is no material difference between the segmentation of the Group’s turnover by geographic origin and destination. The Group’s continuing operations comprise one class of business, that of qualified, professional and skilled recruitment. Net fees and operating profit from continuing operations The Group’s Management Board, which is regarded as the chief operating decision maker, uses net fees by segment as its measure of revenue in internal reports, rather than use turnover. This is because net fees exclude the remuneration of temporary workers, and payments to other recruitment agencies where the Group acts as principal, which are not considered relevant in allocating resources to segments. The Group’s Management Board considers net fees for the purpose of making decisions about allocating resources. The Group does not report items below operating profit by segment in its internal management reporting. The full detail of these items can be seen in the Group Consolidated Income Statement on page 96. The reconciliation of turnover to net fees can be found in note 5. (In £s million) 2016 2015 Net fees from continuing operations Asia Pacific 176.1 178.5 Continental Europe Rest of World 362.5 313.8 United Kingdom Ireland 271.7 271.9 810.3 764.2 (In £s million) 2016 2015 Operating profit from continuing operations Asia Pacific 50.2 49.7 Continental Europe Rest of World 78.7 68.7 United Kingdom Ireland 52.1 45.7 181.0 164.1 Net trade receivables For the purpose of monitoring performance and allocating resources from a balance sheet perspective, the Group’s Management Board monitors trade receivables net of provisions for impairments only on a segment by segment basis. These are monitored on a constant currency basis for comparability through the year. These are shown below and reconciled to the totals as shown in note 17. Net trade receivables (In £s million) As reported internally Foreign exchange 2016 As reported internally Foreign exchange 2015 Asia Pacific 58.2 7.6 65.8 55.1 (6.0) 49.1 Continental Europe Rest of World 202.4 34.5 236.9 185.7 (18.8) 166.9 United Kingdom Ireland 180.3 3.9 184.2 153.8 (0.1) 153.7 440.9 46.0 486.9 394.6 (24.9) 369.7 Major customers In the current year and prior year there was no one customer that exceeded 10% of the Group’s turnover. Hays plc | 2016 Annual Report and Financial Statements104 NOTES TO THE CONSOLIDATED FINANCIAL STATEMENTS CONTINUED
  • 109.
    5. Operating profitfrom continuing operations The following costs are deducted from turnover to determine net fees from continuing operations: (In £s million) 2016 2015 Turnover 4,231.4 3,842.8 Remuneration of temporary workers (3,236.5) (2,941.5) Remuneration of other recruitment agencies (184.6) (137.1) Net fees 810.3 764.2 Operating profit is stated after charging the following items to net fees of £810.3 million (2015: £764.2 million): (In £s million) 2016 2015 Staff costs (note 7) 476.3 440.6 Depreciation of property, plant and equipment 7.7 8.7 Amortisation of intangible assets 14.2 13.7 Operating lease rentals payable (note 32) 34.0 30.8 Impairment loss on trade receivables 3.0 2.5 Auditor remuneration (note 6) – for statutory audit services 0.9 0.9 – for other services 0.7 0.4 6. Auditor remuneration (In £s million) 2016 2015 Fees payable to the Company's Auditor for the audit of the Company's annual accounts 0.2 0.2 Fees payable to the Company's Auditor and their associates for other services to the Group: The audit of the Company's subsidiaries pursuant to legislation 0.7 0.7 Total audit fees 0.9 0.9 Half year review 0.1 0.1 Tax and other services 0.6 0.3 Total non-audit fees 0.7 0.4 Other services, principally relating to technical accounting advice, totalled £44,000 (2015: £33,000). No services were performed pursuant to contingent fee arrangements. Tax and other services includes the completion of a comprehensive review of our transfer pricing framework to enhance existing arrangements such that the Group will continue to conform to best practice under OECD guidelines. The Group’s existing arrangements are well known to Deloitte both in the UK and globally. This, together with the expertise within the firm, meant that they were best placed to partner us in this piece of work. Hays plc | 2016 Annual Report and Financial Statements105 OVERVIEW  STRATEGICREPORT  GOVERNANCE  FINANCIALSTATEMENTS  SHAREHOLDERINFORMATION
  • 110.
    7. Staff costs Theaggregate staff remuneration (including executive directors) was as follows: (In £s million) 2016 2015 Wages and salaries 400.5 370.8 Social security costs 50.0 46.4 Other pension costs 13.9 12.6 Share-based payments 11.9 10.8 476.3 440.6 Average number of persons employed (including executive directors): (Number) 2016 2015 Continuing operations Asia Pacific 1,662 1,577 Continental Europe Rest of World 3,923 3,504 United Kingdom Ireland 3,668 3,742 9,253 8,823 Closing number of persons employed (including executive directors): (Number) 2016 2015 Continuing operations Asia Pacific 1,660 1,639 Continental Europe Rest of World 4,040 3,643 United Kingdom Ireland 3,514 3,741 9,214 9,023 8. Net finance charge (In £s million) 2016 2015 Interest received on bank deposits 0.5 0.5 Interest payable on bank loans and overdrafts (3.4) (4.6) Interest unwind on acquisition liability (0.9) (0.4) Pension Protection Fund levy (0.3) (0.5) Net interest on pension obligations (3.9) (3.0) Net finance charge (8.0) (8.0) Included within the net finance charge is an unrealised gain of £6.6 million on the derivative current asset, offset by a £6.6 million revaluation loss on the Euro denominated overdraft within the Group’s European cash pool arrangements, the net impact of which is £nil, and therefore is not presented separately in the table above. There was no such gain or loss in the prior year. Further details of the Group’s treasury management are included in note 18 to the Consolidated Financial Statements and described on page 41 of the Financial Review. 9. Income taxes relating to continuing operations The tax (expense)/credit for the year is comprised of the following: Current tax (In £s million) 2016 2015 Current tax expense in respect of the current year (49.2) (49.6) Adjustments recognised in the current year in relation to the current tax of prior years – (0.2) (49.2) (49.8) Hays plc | 2016 Annual Report and Financial Statements106 NOTES TO THE CONSOLIDATED FINANCIAL STATEMENTS CONTINUED
  • 111.
    Deferred tax (In £smillion) 2016 2015 Deferred tax (charge)/credit in respect of the current year (3.1) 0.2 Adjustments to deferred tax attributable to changes in tax rates and laws – (0.8) Adjustments to deferred tax in relation to prior years 0.4 (0.3) (2.7) (0.9) Total income tax expense recognised in the current year relating to continuing operations (51.9) (50.7) Current tax expense for the year comprised of the following: (In £s million) 2016 2015 UK (6.5) (7.4) Overseas (42.7) (42.2) (49.2) (49.6) The income tax expense for the year can be reconciled to the accounting profit as follows: (In £s million) 2016 2015 Profit before tax from continuing operations 173.0 156.1 Income tax expense calculated at 20.00% (2015: 20.75%) (34.6) (32.4) Net effect of items that are non-taxable/(non-deductible) in determining taxable profit (1.4) (3.7) Effect of unused tax losses not recognised as deferred tax assets (1.5) – Effect of tax losses not recognised as deferred tax utilised in the year 0.7 – Effect of different tax rates of subsidiaries operating in other jurisdictions (14.6) (13.8) Effect on deferred tax balances due to the changes in income tax rates – (0.8) Effect of share-based payment charges and share options (0.9) 0.5 (52.3) (50.2) Adjustments recognised in the current year in relation to the current tax of prior years – (0.2) Adjustments to deferred tax in relation to prior years 0.4 (0.3) Income tax expense recognised in the Consolidated Income Statement relating to continuing operations (51.9) (50.7) Effective tax rate for the year on continuing operations 30.0% 32.5% The tax rate used for the 2016 reconciliations above is the corporate tax rate of 20.00% (2015: 20.75%) payable by corporate entities in the United Kingdom on taxable profits under tax law in that jurisdiction. Income tax recognised directly in equity (In £s million) 2016 2015 Current tax Excess tax deductions relating to share-based payments 0.9 0.9 Deferred tax Excess tax deductions relating to share-based payments (1.6) (0.1) Total income tax recognised in equity (0.7) 0.8 Income tax recognised in other comprehensive income (In £s million) 2016 2015 Current tax Contributions in respect of defined benefit pension scheme 1.8 2.3 Deductions in respect of foreign exchange – 1.1 Deferred tax Actuarial (gain)/loss in respect of defined benefit pension scheme (9.0) 2.9 Total income tax recognised in other comprehensive income (7.2) 6.3 Hays plc | 2016 Annual Report and Financial Statements107 OVERVIEW  STRATEGICREPORT  GOVERNANCE  FINANCIALSTATEMENTS  SHAREHOLDERINFORMATION
  • 112.
    10. Discontinued operations Theresults of the discontinued operations which have been included in the Consolidated Income Statement were as follows: (In £s million) 2016 2015 Profit from discontinued operations 4.6 – Profit before tax 4.6 – Tax charge (1.2) 0.2 Profit from discontinued operations after tax 3.4 0.2 The profit of £3.4 million arose from the write-back of provisions which in light of subsequent events and expiry of warranty periods were no longer required. In the prior year the profit of £0.2 million arose primarily from the write-back of tax provisions that were no longer required. The provisions were established when the Group completed the disposal of its non-core activities between March 2003 and November 2004. The cash outflows generated from discontinued operations were £0.6 million (2015: £0.3 million) and are recorded within net movements in provisions on the Consolidated Cash Flow Statement. There were no cash inflows generated from discontinued operations (2015: nil). 11. Dividends The following dividends were paid by the Group and have been recognised as distributions to equity shareholders in the year: 2016 pence per share 2016 £s million 2015 pence per share 2015 £s million Previous year final dividend 1.89 26.9 1.80 25.6 Current year interim dividend 0.91 13.0 0.87 12.3 39.9 37.9 The following dividends have been paid/proposed by the Group in respect of the accounting year presented: 2016 pence per share 2016 £s million 2015 pence per share 2015 £s million Interim dividend (paid) 0.91 13.0 0.87 12.3 Final dividend (proposed) 1.99 28.7 1.89 27.0 2.90 41.7 2.76 39.3 The final dividend for 2016 of 1.99 pence per share (£28.7 million) will be proposed at the Annual General Meeting on 9 November 2016 and has not been included as a liability as at 30 June 2016. If approved, the final dividend will be paid on 11 November 2016 to shareholders on the register at the close of business on 14 October 2016. Hays plc | 2016 Annual Report and Financial Statements108 NOTES TO THE CONSOLIDATED FINANCIAL STATEMENTS CONTINUED
  • 113.
    12. Earnings pershare For the year ended 30 June 2016 Earnings (£s million) Weighted average number of shares (million) Per share amount (pence) Continuing operations: Basic earnings per share from continuing operations 121.1 1,428.4 8.48 Dilution effect of share options – 19.0 (0.11) Diluted earnings per share from continuing operations 121.1 1,447.4 8.37 Discontinued operations: Basic earnings per share from discontinued operations 3.4 1,428.4 0.24 Dilution effect of share options – 19.0 (0.01) Diluted earnings per share from discontinued operations 3.4 1,447.4 0.23 Continuing and discontinued operations: Basic earnings per share from continuing and discontinued operations 124.5 1,428.4 8.72 Dilution effect of share options – 19.0 (0.12) Diluted earnings per share from continuing and discontinued operations 124.5 1,447.4 8.60 For the year ended 30 June 2015 Earnings (£s million) Weighted average number of shares (million) Per share amount (pence) Continuing operations: Basic earnings per share from continuing operations 105.4 1,416.4 7.44 Dilution effect of share options – 24.5 (0.13) Diluted earnings per share from continuing operations 105.4 1,440.9 7.31 Discontinued operations: Basic earnings per share from discontinued operations 0.2 1,416.4 0.01 Dilution effect of share options – 24.5 – Diluted earnings per share from discontinued operations 0.2 1,440.9 0.01 Continuing and discontinued operations: Basic earnings per share from continuing and discontinued operations 105.6 1,416.4 7.46 Dilution effect of share options – 24.5 (0.13) Diluted earnings per share from continuing and discontinued operations 105.6 1,440.9 7.33 The weighted average number of shares in issue for both years exclude shares held in treasury. Hays plc | 2016 Annual Report and Financial Statements109 OVERVIEW  STRATEGICREPORT  GOVERNANCE  FINANCIALSTATEMENTS  SHAREHOLDERINFORMATION
  • 114.
    13. Goodwill (In £smillion) 2016 2015 Cost At 1 July 198.4 170.6 Exchange adjustments 22.0 (8.1) Additions during the year – 35.9 At 30 June 220.4 198.4 Goodwill arising on business combinations is reviewed and tested on an annual basis or more frequently if there is indication that goodwill might be impaired. Goodwill has been tested for impairment by comparing the carrying amount of each cash-generating unit (CGU), including goodwill, with the recoverable amount. The recoverable amounts of the CGUs are determined from value-in-use calculations. The key assumptions for the value-in-use calculations are as follows: Assumption How determined Operating profit The operating profit is based on the latest one-year forecasts for the CGUs approved by the Group’s Management Board which are compiled using expectations of fee growth, consultant productivity and operating costs. The Group prepares cash flow forecasts derived from the most recent financial forecasts approved by management and extrapolates cash flows in perpetuity based on the long-term growth rates and expected cash conversion rates. Discount rates The pre-tax rates used to discount the forecast cash flows range between 9.3% and 16.7% (2015: 9.0% and 13.3%) reflecting current market assessments of the time value of money and the country risks specific to the relevant CGUs. The discount rate applied to the cash flows of each of the Group’s operations is generally based on the weighted average cost of capital (WACC), taking into account adjustments to the risk-free rate for 10-year bonds issued by the government in the respective market. Where government bond rates contain a material component of credit risk, high-quality local corporate bond rates may be used. These rates are adjusted for a risk premium to reflect the increased risk of investing in equities and, where appropriate, the systematic risk of the specific Group operating company. In making this adjustment, inputs required are the equity market risk premium (that is the increased return required over and above a risk-free rate by an investor who is investing in the market as a whole) and the risk adjustment, beta, applied to reflect the risk of the specific Group operating company relative to the market as a whole. Growth rates The medium-term growth rates are based on management forecasts. These are consistent with a minimum average estimated growth rate of 5.0% (2015: 5.0%), with the exception of the United Kingdom where an average of 2.0% has been applied for years two to five. The growth estimates reflect a combination of both past experience and the macroeconomic environment, including GDP expectations driving fee growth. The long-term growth rates are based on management forecasts, which are consistent with external sources of an average estimated growth rate of 2.0% (2015: 2.0%), reflecting a combination of GDP expectations and long-term wage inflation driving fee growth. GDP growth is a key driver of our business, and is therefore a key consideration in developing long-term forecasts. Wage inflation is also an important driver of net fees as net fees are derived directly from the salary level of candidates placed into employment. Based on past experience a combination of these two factors is considered to be an appropriate basis for assessing long-term growth rates. Management has determined that there has been no impairment to any of the CGUs and in respect of these a sensitivity analysis has been performed in assessing recoverable amounts of goodwill. This has been based on changes in key assumptions considered to be possible by management. This included a change in the discount rate of up to 1% and changes in the long-term growth rate from Year 2 onwards between 0% and 2% in absolute terms. The sensitivity analysis shows no impairment would arise under each scenario for any of the CGUs. The Veredus business, which is part of the Continental Europe Rest of World segment, was acquired in December 2014 and continues to perform well. As a result the Group has made significant investments in the business to accelerate its growth in line with the Group’s strategy to build a strong presence in the USA, and maximise the long-term growth opportunities available in the market. As a consequence of this investment, the headroom on goodwill has decreased from the prior year. Headroom based on the assumptions used in the goodwill calculation is £3.4 million arising on goodwill of £40.5 million. The key assumption in determining the value-in-use calculation is the discount rate used, which is 13%. An increase in the discount rate to 14% would result in no headroom. Hays plc | 2016 Annual Report and Financial Statements110 NOTES TO THE CONSOLIDATED FINANCIAL STATEMENTS CONTINUED
  • 115.
    Goodwill acquired ina business combination is considered its own CGU or allocated to the groups of CGUs that are expected to benefit from that business combination. Individual CGUs are either country or brand specific. For the purpose of disclosure individual CGUs have been aggregated and disclosed in accordance with segmental reporting. The carrying amount of goodwill has been allocated as follows: (In £s million) 2016 2015 Asia Pacific 25.8 19.1 Continental Europe Rest of World 101.5 86.2 United Kingdom Ireland 93.1 93.1 220.4 198.4 14. Other intangible assets (In £s million) 2016 2015 Cost At 1 July 93.2 91.2 Exchange adjustments 3.9 (1.1) Acquired – 3.0 Additions 4.7 4.3 Disposals – (4.2) At 30 June 101.8 93.2 Amortisation At 1 July 63.4 54.7 Exchange adjustments 2.6 (0.8) Charge for the year 14.2 13.7 Disposals – (4.2) At 30 June 80.2 63.4 Net book value At 30 June 21.6 29.8 At 1 July 29.8 36.5 All other intangible assets relate mainly to computer software additions, and of the additions in the current year, £3.5 million relate to internally generated assets (2015: £3.1 million). The estimated average useful life of the computer software related intangible assets is seven years (2015: seven years). Software incorporated into major Enterprise Resource Planning (ERP) implementations is amortised on a straight-line basis over a life of up to seven years. Other software is amortised on a straight-line basis between three and five years. In the prior year following the acquisition of Veredus Corp. an intangible asset of £3.0 million has been recognised in respect of the Veredus brand. This is amortised on a straight-line basis over three years from the date of acquisition. There were no capital commitments at the year end, as was the case in the prior year. Hays plc | 2016 Annual Report and Financial Statements111 OVERVIEW  STRATEGICREPORT  GOVERNANCE  FINANCIALSTATEMENTS  SHAREHOLDERINFORMATION
  • 116.
    15. Property, plantand equipment (In £s million) Freehold properties Leasehold properties (short) Plant and machinery Fixtures and fittings Total Cost At 1 July 2015 0.6 12.4 29.1 22.6 64.7 Exchange adjustments 0.1 2.1 2.6 2.1 6.9 Capital expenditure – 2.0 3.8 4.5 10.3 Disposals – (0.8) (2.0) (0.1) (2.9) At 30 June 2016 0.7 15.7 33.5 29.1 79.0 Accumulated depreciation At 1 July 2015 0.4 9.2 22.2 17.3 49.1 Exchange adjustments 0.1 1.5 2.0 1.7 5.3 Charge for the year – 1.2 3.9 2.6 7.7 Disposals – (0.8) (2.0) (0.1) (2.9) At 30 June 2016 0.5 11.1 26.1 21.5 59.2 Net book value At 30 June 2016 0.2 4.6 7.4 7.6 19.8 At 1 July 2015 0.2 3.2 6.9 5.3 15.6 There were no capital commitments at the year end (2015: £nil). (In £s million) Freehold properties Leasehold properties (short) Plant and machinery Fixtures and fittings Total Cost At 1 July 2014 1.8 12.1 26.1 28.0 68.0 Exchange adjustments (0.1) (1.2) (1.8) (1.5) (4.6) Capital expenditure – 1.7 4.4 1.7 7.8 Acquired – – – 0.2 0.2 Reclassification (1.1) 1.6 1.1 (1.6) – Disposals – (1.8) (0.7) (4.2) (6.7) At 30 June 2015 0.6 12.4 29.1 22.6 64.7 Accumulated depreciation At 1 July 2014 1.1 9.5 18.2 21.6 50.4 Exchange adjustments (0.2) (0.9) (1.3) (1.2) (3.6) Charge for the year – 1.3 5.1 2.3 8.7 Acquired – – – 0.1 0.1 Reclassification (0.5) 1.0 0.9 (1.4) – Disposals – (1.7) (0.7) (4.1) (6.5) At 30 June 2015 0.4 9.2 22.2 17.3 49.1 Net book value At 30 June 2015 0.2 3.2 6.9 5.3 15.6 At 1 July 2014 0.7 2.6 7.9 6.4 17.6 Hays plc | 2016 Annual Report and Financial Statements112 NOTES TO THE CONSOLIDATED FINANCIAL STATEMENTS CONTINUED
  • 117.
    16. Deferred tax Deferredtax assets in relation to: (In £s million) 1 July 2015 (Charge)/ credit to Consolidated Income Statement (Charge)/ credit to other comprehensive income (Charge)/ credit to equity Exchange difference 30 June 2016 Accelerated tax depreciation 14.7 (1.1) – – 0.2 13.8 Acquired tangibles and intangibles (1.2) (0.9) – – (0.3) (2.4) Retirement benefit obligation 11.7 – (9.0) – – 2.7 Share-based payments 4.5 (0.7) – (1.6) – 2.2 Provisions 2.1 0.5 – – 0.3 2.9 Tax losses 1.2 (1.0) – – 0.1 0.3 Other short-term timing differences 3.4 0.5 – – 0.5 4.4 36.4 (2.7) (9.0) (1.6) 0.8 23.9 (In £s million) 1 July 2014 (Charge)/ credit to Consolidated Income Statement (Charge)/ credit to other comprehensive income (Charge)/ credit to equity Exchange difference 30 June 2015 Accelerated tax depreciation 16.8 (2.1) – – – 14.7 Acquired tangibles and intangibles – (1.2) – – – (1.2) Retirement benefit obligation 8.8 – 2.9 – – 11.7 Share-based payments 4.1 0.5 – (0.1) – 4.5 Provisions 2.2 0.2 – – (0.3) 2.1 Tax losses – 1.2 – – – 1.2 Other short-term timing differences 3.2 0.5 – – (0.3) 3.4 35.1 (0.9) 2.9 (0.1) (0.6) 36.4 The UK deferred tax asset of £18.2 million (2015: £30.4 million) is recognised on the basis of the UK business performance in the year and the forecast approved by management. Other deferred tax assets of £5.7 million (2015: £6.0 million) arise in the other jurisdictions (primarily Australia) in which the Group operate. Deferred tax assets and liabilities are measured at the tax rates that are expected to apply in the periods in which they reverse. The date enacted or substantively enacted for the relevant periods of reversal are: 19% from 1 April 2017 and 18% from 1 April 2020 in the UK (2015: 19%) and 30% in Australia. In March 2016, the United Kingdom Government announced a reduction in the main rate of UK corporation tax to 17% with effect from 1 April 2020. The reduction to 17% has not been substantively enacted and has therefore not been reflected in the figures above. The impact of the future rate reduction will be accounted for to the extent that it is enacted at future balance sheet dates; however it is estimated that this will not have a material impact on the Group. Unrecognised deductible temporary differences, unused tax losses and unused tax credits Deductible temporary differences, unused tax losses and unused tax credits for which no deferred tax assets have been recognised are attributable to the following: (In £s million) Gross 2016 Tax 2016 Gross 2015 Tax 2015 Tax losses (revenue in nature) 150.7 37.8 155.4 40.1 Tax losses (capital in nature) 20.0 3.9 20.0 4.4 170.7 41.7 175.4 44.5 In tax losses (revenue in nature) £0.1 million is due to expire in 2017, £2.2 million in 2023, £1.5 million in 2027, £5.0 million in 2033 and £8.5 million in 2036. Hays plc | 2016 Annual Report and Financial Statements113 OVERVIEW  STRATEGICREPORT  GOVERNANCE  FINANCIALSTATEMENTS  SHAREHOLDERINFORMATION
  • 118.
    16. Deferred taxcontinued Unrecognised taxable temporary differences associated with investments and interests (In £s million) 2016 2015 Taxable temporary differences in relation to investments in subsidiaries, for which deferred tax liabilities have not been recognised are attributable to the following: Foreign subsidiaries 4.9 3.8 Tax thereon 0.3 0.2 17. Trade and other receivables (In £s million) 2016 2015 Trade receivables 503.2 385.2 Less provision for impairment (16.3) (15.5) Net trade receivables 486.9 369.7 Prepayments and accrued income 277.0 230.8 763.9 600.5 The directors consider that the carrying amount of trade receivables approximates to their fair value. The average credit period taken is 37 days (2015: 35 days). The ageing analysis of the trade receivables not impaired is as follows: (In £s million) 2016 2015 Not yet due 435.5 297.4 Up to one month past due 41.7 55.7 One to three months past due 9.7 16.6 486.9 369.7 The Group’s exposure to foreign currency translation is primarily in respect of the Euro and the Australian Dollar. The sensitivity of a 1 cent change in the year end closing exchange rates in respect of the Euro and Australian Dollar would result in a £1.7 million and £0.3 million movement in trade receivables respectively. The movement on the provision for impairment of trade receivables is as follows: (In £s million) 2016 2015 At 1 July 15.5 16.0 Exchange movement 1.3 (0.8) Charge for the year 3.0 2.5 Uncollectable amounts written off (3.5) (2.2) At 30 June 16.3 15.5 The ageing of impaired trade receivables relates primarily to trade receivables over three months past due. Credit risk The Group’s credit risk is primarily attributable to its trade receivables. The amounts presented in the Consolidated Balance Sheet are net of allowances for doubtful receivables. An allowance for impairment is made where there is an identified loss event which, based on previous experience, is evidence of a likely reduction in the recoverability of the cash flows. The Group reduces risk through its credit control process and by contractual arrangements with other recruitment agencies in situations where the Group invoices on their behalf. The Group’s exposure is spread over a large number of customers. The risk disclosures contained on pages 42 to 45 within the Strategic Report form part of these financial statements. Hays plc | 2016 Annual Report and Financial Statements114 NOTES TO THE CONSOLIDATED FINANCIAL STATEMENTS CONTINUED
  • 119.
    18. Cash andcash equivalents (In £s million) 2016 2015 Cash at bank and in hand 62.9 69.8 The effective interest rate on short-term deposits was 1.0% (2015: 1.3%). The average maturity of short-term deposits was one day (2015: one day). Capital management The Board’s priorities for free cash flow are to fund the Group’s investment and development, maintain a strong balance sheet and deliver a sustainable dividend at a level that is affordable and appropriate. The Board targets a dividend cover range of 2.0x to 3.0x, and remains committed to paying a sustainable and progressive dividend. Further details can be found in the Financial Review on page 41. The capital structure of the Group consists of net cash/(debt), which is represented by cash and cash equivalents, bank loans and overdrafts (note 20) and equity attributable to equity holders of the parent, comprising issued share capital, reserves and retained earnings as disclosed in notes 24 to 29. The Group is not restricted to any externally imposed capital requirements. Risk management A description of the Group’s treasury policy and controls is included in the Financial Review on page 41. Cash management and foreign exchange risk The Group’s cash management policy is to minimise interest payments by closely managing Group cash balances and external borrowings. Euro-denominated cash positions are managed centrally using a cash pooling facility which provides visibility over participating country bank balances on a daily basis. Any Group surplus balance is used to repay any maturing loans under the Group’s revolving credit facility or invested in overnight money market funds. As the Group holds a sterling denominated debt facility and generates significant foreign currency cash flows, the Board considers it appropriate in certain cases to use derivative financial instruments as part of its day-to-day cash management to reduce the Group’s exposure to foreign exchange risk. The Group’s operating profit exposure to foreign currency translation is primarily in respect of the Euro and the Australian Dollar. The sensitivity of a 1 cent change in the average exchange rates for the year in respect of the Euro and Australian Dollar would result in a £0.7 million and £0.2 million change in operating profit respectively. The Group does not use derivatives to hedge balance sheet and income statement translation exposure. Interest rate risk The Group is exposed to interest rate risk on floating rate bank loans and overdrafts. It is the Group’s policy to limit its exposure to fluctuating interest rates by selectively hedging interest rate risk using derivative financial instruments. Cash and cash equivalents carry interest at floating rates based on local money market rates. Counterparty credit risk Counterparty credit risk arises primarily from the investment of surplus funds. Risks are closely monitored using credit ratings assigned to financial institutions by international credit rating agencies. The Group restricts transactions to banks and money market funds that have an acceptable credit profile and limits its exposure to each institution accordingly. 19. Derivative financial instruments (In £s million) 2016 2015 Derivative asset 6.6 – Derivative liability – – Net derivative asset 6.6 – As set out in note 18 and in the Treasury management section of the Financial Review on page 41, in certain cases the Group uses derivative financial instruments to manage its foreign exchange exposures as part of its day-to-day cash management. As at 30 June 2016, the Group had entered into eight forward exchange contract arrangements with counterparty banks (2015: eight forward contracts). The fair market value of the contracts as at 30 June 2016 gave rise to an unrealised gain resulting in the presentation of a net derivative asset of £6.6 million (2015: £nil) in the Consolidated Balance Sheet. Some of the derivative assets and liabilities meet the offsetting criteria of IAS 32 paragraph 42. Consequently, the qualifying gross derivative liabilities are set off against the qualifying gross derivative assets. The derivative liabilities not qualifying for offset is less than the rounding factor presented in the financial statements and thus presented as £nil (2015: £nil). Hays plc | 2016 Annual Report and Financial Statements115 OVERVIEW  STRATEGICREPORT  GOVERNANCE  FINANCIALSTATEMENTS  SHAREHOLDERINFORMATION
  • 120.
    19. Derivative financialinstruments continued The Group does not use derivatives for speculative purposes and all transactions are undertaken to manage the risks arising from underlying business activities. These instruments are classified as Level 2 in the IFRS 7 fair value hierarchy. In the prior year the Group held two interest rate swaps which have subsequently matured in the current year. Categories of financial assets and liabilities held by the Group are as shown below: (In £s million) 2016 2015 Financial assets Net trade receivables 486.9 369.7 Cash and cash equivalents 62.9 69.8 Derivative financial instruments 6.6 – 556.4 439.5 Financial liabilities Trade creditors 170.0 116.6 Bank loans and overdrafts 26.1 100.5 196.1 217.1 20. Bank loans and overdrafts (In £s million) 2016 2015 Bank loans 25.0 100.0 Overdrafts 1.1 0.5 26.1 100.5 Risk management A description of the Group’s treasury policy and controls is included in the Financial Review on page 41. Committed facilities The Group has a £210 million unsecured revolving credit facility which expires in April 2020. The financial covenants require the Group’s interest cover ratio to be at least 4:1 and its leverage ratio (net debt to EBITDA) to be no greater than 2.5:1. The interest rate of the facility is based on a ratchet mechanism with a margin payable over LIBOR in the range of 0.90% to 1.55%. At 30 June 2016, £185 million of the committed facility was un-drawn. Maturities of bank loans and overdrafts The maturity of borrowings are as follows: (In £s million) 2016 2015 Within one year 1.1 0.5 More than one year 25.0 100.0 26.1 100.5 Fair values of financial assets and bank loans and overdrafts The fair value of financial assets and bank loans and overdrafts is not materially different to their book value due to the short-term maturity of the instruments, which are based on floating rates. The interest rate profile of bank loans and overdrafts is as follows: (In £s million) 2016 2015 Floating rate – sterling 26.1 100.5 The floating rate liabilities comprise bank loans and unsecured overdrafts bearing interest at rates based on local market rates. Hays plc | 2016 Annual Report and Financial Statements116 NOTES TO THE CONSOLIDATED FINANCIAL STATEMENTS CONTINUED
  • 121.
    Interest rates The weightedaverage interest rates paid were as follows: 2016 2015 Bank borrowings 2.3% 2.5% For each 10 basis point fall or rise in the average LIBOR rate in the year there would be a reduction or increase in profit before tax by approximately £0.1 million. 21. Trade and other payables (In £s million) 2016 2015 Current Trade creditors 170.0 116.6 Other tax and social security 65.1 66.2 Other creditors 25.5 34.3 Accruals 312.7 261.6 573.3 478.7 The directors consider that the carrying amount of trade payables approximates to their fair value. The average credit period taken for trade purchases is 29 days (2015: 30 days). 22. Retirement benefit obligations The Group operates a number of retirement benefit schemes in the UK and in other countries. The Group’s principal schemes are within the UK where the Group operates one defined contribution scheme and two defined benefit schemes. The majority of overseas arrangements are either defined contribution or government-sponsored schemes and these arrangements are not material in the context of the Group results. UK Defined Contribution Scheme The Group’s principal defined contribution retirement benefit scheme is the Hays Group Personal Pension Plan which is operated for all qualifying employees and is funded via an employee salary sacrifice arrangement, and for qualifying employees additional employer contributions. Employer contributions are in the range of 2% to 12% of pensionable salary depending on the level of employee contribution and seniority. The total cost charged to the Consolidated Income Statement of £6.2 million (2015: £6.2 million) represents employer’s contributions payable to the money purchase arrangements. There were no contributions outstanding at the end of the year (2015: £0.5 million). The assets of the money purchase arrangements are held separately from those of the Group. UK Defined Benefit Schemes The Group’s principal defined benefit schemes are the Hays Pension Scheme and the Hays Supplementary Scheme both in the UK. The Hays Pension Scheme is a funded final salary defined benefit scheme providing pensions and death benefits to members. The Hays Supplementary Scheme is an unfunded unapproved retirement benefit scheme for employees who were subject to HMRC’s earnings cap on pensionable salary. The Schemes were closed to future accrual from 30 June 2012 with pensions calculated up until the point of closure. The Schemes are governed by a trustee board, which is independent of the Group and is subject to full actuarial valuation on a triennial basis. The last formal actuarial valuation of the Hays Pension Scheme was performed at 30 June 2015 and quantified the deficit at c.£95 million. A revised deficit funding schedule was agreed with effect from 1 July 2015 which maintained the annual contribution at its previous level, subject to a 3% per annum fixed uplift over a period of just under 10 years. During the year ended 30 June 2016, the Group made a contribution of £14.0 million to the Hays Pension Scheme (2015: £13.5 million) in accordance with the agreed deficit funding schedule. The cash contributions during the year mainly related to deficit funding payments. Settlement arising from transfer exercise During the year a transfer exercise was undertaken. A number of members included in this exercise elected to transfer out of the scheme to access the new flexible retirement options now available. This resulted in £21.1 million being paid out of scheme assets to members in the form of individual transfer values and equated to a reduction in the associated IAS 19 liabilities of £19.5 million. As the transfer eliminated all further legal and constructive obligations for all of the benefits under the scheme to these individuals, the resulting £1.6 million net settlement charge has been recognised in the Consolidated Income Statement and is recorded within staff costs. The defined benefit schemes expose the Group to actuarial risks, such as longevity risk, inflation risk, interest rate risk and market (investment) risk. The Group is not exposed to any unusual, entity-specific or scheme-specific risks. Hays plc | 2016 Annual Report and Financial Statements117 OVERVIEW  STRATEGICREPORT  GOVERNANCE  FINANCIALSTATEMENTS  SHAREHOLDERINFORMATION
  • 122.
    22. Retirement benefitobligations continued The net amount included in the Consolidated Balance Sheet arising from the Group’s obligations in respect of its defined benefit pension schemes is as follows: (In £s million) 2016 2015 Present value of defined benefit obligations (726.3) (685.3) Less fair value of defined benefit scheme assets: Equities 132.3 131.8 Bonds and gilts 293.3 277.2 Absolute return funds 36.6 37.2 Cash and LDI funds 227.1 159.1 Real estate 22.7 21.3 712.0 626.6 Net liability arising from defined benefit obligation (14.3) (58.7) Virtually all scheme assets have quoted prices in active markets. Real estate can be classified as Level 3 instruments. The £132.3 million scheme assets held in equities comprise: UK Equities £32.9 million; Global Equities £70.5 million; and £28.9 million Emerging Market Equities. To reduce volatility risk a liability driven investment (LDI) strategy forms part of the Trustee’s management of the defined benefit schemes’ assets, including government bonds, corporate bonds and derivatives. The government bonds asset category in the table above includes gross assets of £965.5 million and associated repurchase agreements of £740.8 million. Repurchase agreements are entered into with counterparties to better offset the schemes’ exposure to interest and inflation rates, whilst remaining invested in assets of a similar risk profile. Interest rate and inflation rate derivatives are also used to complement the use of fixed and index-linked bonds in matching the profile of the schemes’ liabilities. The change in the present value of defined benefit obligations was: (In £s million) 2016 2015 Change in benefit obligation Opening defined benefit obligation at 1 July (685.3) (612.3) Administration costs (1.9) (1.3) Effect of settlement 19.5 – Interest on defined benefit scheme liabilities (25.7) (26.6) Net remeasurement gains – change in experience assumptions 28.9 11.2 Net remeasurement gains – change in demographic assumptions 14.7 – Net remeasurement losses – change in financial assumptions (99.2) (74.5) Benefits and expenses paid 22.7 18.2 Closing defined benefit obligation at 30 June (726.3) (685.3) Analysis of defined benefit obligation Plans that are wholly or partly funded (714.7) (675.6) Plans that are wholly unfunded (11.6) (9.7) Total (726.3) (685.3) The defined benefit schemes’ liabilities comprise 68% (2015: 72%) in respect of deferred scheme participants and 32% (2015: 28%) in respect of retirees. The weighted average duration of the UK defined benefit scheme liabilities at the end of the reporting period is 22.0 years (2015: 23.0 years). Hays plc | 2016 Annual Report and Financial Statements118 NOTES TO THE CONSOLIDATED FINANCIAL STATEMENTS CONTINUED
  • 123.
    The change inthe fair value of defined benefit schemes’ assets was: (In £s million) 2016 2015 Change in the fair value of scheme assets  Fair value of plan assets at 1 July 626.6 568.4 Effect of settlement (21.1) – Interest income on defined benefit scheme assets 23.7 24.9 Return on scheme assets 91.1 37.5 Employer contributions (towards funded and unfunded schemes) 14.4 14.0 Benefits and expenses paid (22.7) (18.2) Fair value of plan assets at 30 June 712.0 626.6 During the year the Company made deficit funding contributions of £14.0 million (2015: £13.5 million) into the funded Hays Pension Scheme, and made pension payments amounting to £0.4 million (2015: £0.5 million) in respect of the unfunded Hays Supplementary Scheme. The amount of deficit funding contributions expected to be paid into the funded Hays Pension Scheme in the year to 30 June 2017 is £14.4 million. Following the closure of the Schemes in 2012 future service contributions are no longer payable. The net expense recognised in the Consolidated Income Statement comprised: (In £s million) 2016 2015 Net interest expense (2.0) (1.7) Administration costs (1.9) (1.3) Effect of settlement (1.6) – Net expense recognised in the Consolidated Income Statement (5.5) (3.0) The net interest expense and administration costs in the current year and prior year were recognised within finance costs. The amounts recognised in the Consolidated Statement of Comprehensive Income are as follows: (In £s million) 2016 2015 The return on plan assets (excluding amounts included in net interest expense) 91.1 37.5 Actuarial remeasurement: Net remeasurement gains – change in experience assumptions 28.9 11.2 Net remeasurement gains – change in demographic assumptions 14.7 – Net remeasurement losses – change in financial assumptions (99.2) (74.5) Remeasurement of the net defined benefit liability 35.5 (25.8) A roll forward of the actuarial valuation of the Hays Pension Scheme to 30 June 2016 and a valuation of the Hays Supplementary Pension Scheme have been performed by an independent actuary, who is an employee of Hymans Robertson LLP. The key assumptions used at 30 June 2016 are listed below. 2016 2015 Discount rate 2.8% 3.8% RPI inflation 2.8% 3.3% CPI inflation 1.8% 2.3% Rate of increase of pensions in payment 2.8% 3.2% Rate of increase of pensions in deferment 1.8% 2.3% The discount rate has been constructed to reference the Hymans Robertson AA corporate bond curve (which fits a curve to iBoxx AA corporate data). The corporate bond yield curve has been used to discount the Scheme cash flows using the rates available at each future duration and this had been converted into a single flat rate assumption to give equivalent liabilities to the Scheme’s cash flows. The duration of the Scheme’s liabilities using this approach is circa 22 years. The RPI inflation assumption has been set as gilt market implied RPI appropriate to the duration of the liabilities (circa 22 years) less a 0.2% p.a. inflation risk premium. The CPI inflation assumption has been determined as 1% p.a. below the RPI assumption. This approach for both RPI and CPI assumptions is consistent with last year. Hays plc | 2016 Annual Report and Financial Statements119 OVERVIEW  STRATEGICREPORT  GOVERNANCE  FINANCIALSTATEMENTS  SHAREHOLDERINFORMATION
  • 124.
    22. Retirement benefitobligations continued The life expectancy assumptions have been calculated using Club Vita base tables and future improvements in line with the CMI 2013 model with a long-term improvement rate of 1.5% per annum and ‘non peaked’ short-term future improvements. On this basis a 65-year-old current pensioner has a life expectancy of 24.3 years and 24.8 years for males and females respectively. A sensitivity analysis on the principal assumptions used to measure the Scheme’s liabilities at the year end is: Change in assumption Impact on Schemes Discount rate 0.5% £88m RPI inflation 0.5% £55m Assumed life expectancy at age 60 (rate of mortality) +1 year £29m The sensitivity analysis presented above may not be representative of the actual change in the defined benefit obligation as it is unlikely that the change in assumptions would occur in isolation to one another as some of the assumptions may be correlated. In presenting the above sensitivity analysis the present value of the defined benefit obligation has been calculated using the projected unit credit method at the end of the reporting period, which is the same as that applied in calculating the defined benefit obligation liability recognised in the Consolidated Balance Sheet. 23. Provisions (In £s million) Discontinued Continuing Total At 1 July 2015 12.1 2.8 14.9 Exchange adjustments – 0.2 0.2 (Credited)/charged to income statement (4.6) (0.6) (5.2) Utilised (0.6) – (0.6) At 30 June 2016 6.9 2.4 9.3 (In £s million) 2016 2015 Current 3.1 3.0 Non-current 6.2 11.9 9.3 14.9 Discontinued provisions comprise potential exposures arising as a result of the business disposals that were completed in 2004, together with deferred employee benefits relating to former employees. During the year a number of property leases and warranty periods associated with those business disposals expired resulting in a release of £4.6 million to the income statement and is included in profit from discontinued operations. Of the total provisions of £9.3 million, £0.1 million relates to property exposures, a further £1.3 million to deferred employee benefit obligations, and the remaining £7.9 million relates mainly to potential warranty claim liabilities arising from the business disposals which took place in 2004. Of the provisions that remain, £3.1 million is expected to be paid in the next 12 months and it is not possible to estimate the timing of the payments for the other items. Hays plc | 2016 Annual Report and Financial Statements120 NOTES TO THE CONSOLIDATED FINANCIAL STATEMENTS CONTINUED
  • 125.
    24. Called upshare capital Called up, allotted and fully paid Ordinary shares of 1 pence each Share capital number (thousand) Share capital £s million At 1 July 2015 and 30 June 2016 1,464,097 14.7 In accordance with the Companies Act 2006, the Company no longer has an authorised share capital. The Company is allowed to hold 10% of issued share capital in treasury. As at 30 June 2016, the Company held 31.2 million (2015: 43.1 million) Hays plc shares in treasury. 25. Share premium account (In £s million) 2016 2015 At 30 June 369.6 369.6 26. Capital redemption reserve (In £s million) 2016 2015 At 30 June 2.7 2.7 27. Retained earnings (In £s million) 2016 2015 At 1 July (138.2) (197.7) Remeasurement of defined benefit pension schemes 35.5 (25.8) Tax on items taken directly to reserves (7.9) 7.1 Profit for the year 124.5 105.6 Dividends paid (39.9) (37.9) Share-based payments 10.2 10.5 At 30 June (15.8) (138.2) 28. Cumulative translation reserve (In £s million) 2016 2015 At 1 July 2.1 33.4 Currency translation adjustments 64.3 (31.3) At 30 June 66.4 2.1 29. Equity reserve (In £s million) 2016 2015 At 1 July 18.7 18.3 Share-based payments 1.5 0.4 At 30 June 20.2 18.7 The equity reserve is generated as a result of IFRS 2 ‘Share-based payments’. Hays plc | 2016 Annual Report and Financial Statements121 OVERVIEW  STRATEGICREPORT  GOVERNANCE  FINANCIALSTATEMENTS  SHAREHOLDERINFORMATION
  • 126.
    30. Share-based payments Duringthe year, £11.9 million (2015: £10.8 million) was charged to the Consolidated Income Statement in relation to equity-settled share-based payments. Share options At 30 June 2016 the following options had been granted and remained outstanding in respect of the Company’s Ordinary shares of 1 pence each under the Company’s share option schemes: Number of shares Nominal value of shares £ Subscription price pence/share Date normally exercisable Hays UK Sharesave Scheme 347,894 3,479 88 2016 720,336 7,203 131 2017 1,025,790 10,258 142 2018 2,529,308 25,293 107 2019 4,623,328 46,233 Hays International Sharesave Scheme 218,670 2,187 88 2016 332,802 3,328 131 2017 369,729 3,697 142 2018 826,241 8,262 107 2019 1,747,442 17,474 Total Sharesave options outstanding 6,370,770 63,707 The Hays International Sharesave Scheme is available to employees in Australia, New Zealand, Germany, the Republic of Ireland, Canada, Hong Kong, Singapore and the United Arab Emirates. Details of the share options outstanding during the year are as follows: 2016 Number of share options (thousand) 2016 Weighted average exercise price (pence) 2015 Number of share options (thousand) 2015 Weighted average exercise price (pence) Sharesave Outstanding at the beginning of the year 6,252 111 7,642 94 Granted during the year 3,457 107 1,896 142 Forfeited/cancelled during the year (1,545) 110 (882) 108 Exercised during the year (1,748) 85 (2,318) 81 Expired during the year (45) 91 (86) 106 Outstanding at the end of the year 6,371 117 6,252 111 Exercisable at the end of the year 567 88 993 78 On 31 March 2016, 3.5 million Sharesave options were granted. The aggregate of the estimated fair values of the options granted on that date is £0.9 million. In the prior year, 1.9 million Sharesave options were granted. The aggregate of the estimated fair values of the options granted in the prior year was £0.7 million. The inputs into the valuation model (a binomial valuation model) are as follows: Share price at grant 119 pence Exercise price 107 pence Expected volatility 27.2% Expected life 3.33 years Risk-free rate 0.50% Expected dividends 2.30% Expected volatility was determined by calculating the historical volatility of the Group’s share price over the previous three years. Hays plc | 2016 Annual Report and Financial Statements122 NOTES TO THE CONSOLIDATED FINANCIAL STATEMENTS CONTINUED
  • 127.
    Performance Share Plan(PSP) and Deferred Annual Bonus (DAB) The PSP is designed to link reward to the key long-term value drivers of the business and to align the interests of the executive directors and approximately 320 of the global senior management population with the long-term interests of shareholders. PSP awards are discretionary and vesting is dependent upon the achievement of performance conditions measured over either a three-year period or a one-year period with a two-year holding period. Only the executive directors and other members of the Management Board participate in the DAB which promotes a stronger link between short-term and long-term performance through the deferral of annual bonuses into shares for a three-year period. Further details of the schemes for the executive directors can be found in the directors’ Remuneration Report on pages 64 to 85. Details of the share awards outstanding during the year are as follows: 2016 Number of share options (thousand) 2016 Weighted average fair value at grant (pence) 2015 Number of share options (thousand) 2015 Weighted average fair value at grant (pence) Performance Share Plan Outstanding at the beginning of the year 25,762 97 30,897 79 Granted during the year 6,755 153 8,446 116 Exercised during the year (8,729) 74 (10,361) 71 Lapsed during the year (1,100) 123 (3,220) 69 Outstanding at the end of the year 22,688 122 25,762 97 2016 Number of share options (thousand) 2016 Weighted average fair value at grant (pence) 2015 Number of share options (thousand) 2015 Weighted average fair value at grant (pence) Deferred Annual Bonus Outstanding at the beginning of the year 2,628 107 2,994 86 Granted during the year 747 162 918 133 Exercised during the year (712) 80 (1,284) 75 Outstanding at the end of the year 2,663 130 2,628 107 31. Related parties Remuneration of key management personnel The remuneration of the Management Board, who are key management personnel of the Group, is set out below in aggregate for each of the categories specified in IAS 24 ‘Related Party Disclosures’ and represents the total compensation costs incurred by the Group in respect of remuneration, not the benefit to the individuals. Further information about the remuneration of executive directors is provided in the directors’ Remuneration Report on pages 64 to 85. (In £s million) 2016 2015 Short-term employee benefits 8.5 6.6 Post-employment benefits 0.1 0.1 Share-based payments 5.2 4.8 13.8 11.5 Information relating to pension fund arrangements is disclosed in note 22. Hays plc | 2016 Annual Report and Financial Statements123 OVERVIEW  STRATEGICREPORT  GOVERNANCE  FINANCIALSTATEMENTS  SHAREHOLDERINFORMATION
  • 128.
    32. Operating leasearrangements The Group as lessee (In £s million) 2016 2015 Lease payments under operating leases recognised as an expense for the year 34.0 30.8 At 30 June 2016, the Group had outstanding commitments for future minimum lease payments under non-cancellable operating leases which fall due as follows: (In £s million) 2016 2015 Within one year 39.4 30.0 Between two and five years 70.3 46.0 After five years 6.6 4.3 116.3 80.3 IFRS 16 ‘Leases’ will become effective in the Group’s financial year 2020 and will primarily change the lease accounting requirements for lessees as currently disclosed above. 33. Movement in net cash/(debt) (In £s million) 1 July 2015 Cash flow Exchange movement 30 June 2016 Cash and cash equivalents 69.8 (28.1) 21.2 62.9 Bank loans and overdrafts (100.5) 74.4 – (26.1) Net cash/(debt) (30.7) 46.3 21.2 36.8 The table above is presented as additional information to show movement in net cash/(debt), defined as cash and cash equivalents less bank loans and overdrafts. 34. Acquisition liabilities (In £s million) Total At 1 July 2015 (8.6) Exchange adjustments (1.7) Interest unwind on acquisition liability (0.9) At 30 June 2016 (11.2) Acquisition liabilities relate to the deferred consideration payable following the acquisition of 80% of Veredus Corp., a pure play US IT staffing company in December 2014. The business was acquired for a total cash consideration of £36.1 million and to reflect the substance of the transaction using the principles of IFRS 10, the acquisition was accounted for as if 100% of the equity had been acquired. The deferred consideration is subject to a put/call arrangement which provides Hays with an option to acquire the remaining 20% of the equity from the shareholders. The option is first available for exercise in March 2018. A liability of £8.6 million was recognised in the prior year representing management’s best estimate of the amount payable discounted to its present value. The unwind of the discount in the year of £0.9 million is recognised as a finance cost in the income statement. Full details can be found in the disclosures in note 32 to the 2015 financial statements. 35. Subsequent events The final dividend for 2016 of 1.99 pence per share (£28.7 million) will be proposed at the Annual General Meeting on 9 November 2016 and has not been included as a liability as at 30 June 2016. If approved, the final dividend will be paid on 11 November 2016 to shareholders on the register at close of business on 14 October 2016. Hays plc | 2016 Annual Report and Financial Statements124 NOTES TO THE CONSOLIDATED FINANCIAL STATEMENTS CONTINUED
  • 129.
    (In £s million)Note 2016 2015 Non-current assets Property, plant and equipment 4 0.9 0.3 Investment in subsidiaries 5 910.4 910.4 Trade and other receivables 6 115.9 120.8 Deferred tax assets 7 3.0 12.1 1,030.2 1,043.6 Current assets Trade and other receivables 8 11.5 10.2 Cash and bank balances 3.1 – 14.6 10.2 Total assets 1,044.8 1,053.8 Current liabilities Trade and other payables 9 (352.8) (358.2) Bank overdraft 10 – (22.5) Net current liabilities (338.2) (370.5) Total assets less current liabilities 692.0 673.1 Non-current liabilities Retirement benefit obligations 11 (14.3) (58.7) Provisions 12 (5.3) (7.8) (19.6) (66.5) Total liabilities (372.4) (424.7) Net assets 672.4 629.1 Equity Share capital 14.7 14.7 Share premium account 369.6 369.6 Capital redemption reserve 2.7 2.7 Retained earnings 265.2 223.4 Equity reserve 20.2 18.7 Equity attributable to owners of the Company 672.4 629.1 The financial statements of Hays plc, registered number 2150950, were approved by the Board of Directors and authorised for issue on 1 September 2016. Signed on behalf of the Board of Directors A R Cox P Venables Hays plc | 2016 Annual Report and Financial Statements125 OVERVIEW  STRATEGICREPORT  GOVERNANCE  FINANCIALSTATEMENTS  SHAREHOLDERINFORMATION COMPANY BALANCE SHEET AT 30 JUNE
  • 130.
    (In £s million) Share capital Share premium account Capital redemption reserve Retained earnings Equity reserve Own sharesTotal At 1 July 2015 14.7 369.6 2.7 223.4 18.7 – 629.1 Remeasurement of defined benefit pension schemes – – – 35.5 – – 35.5 Tax relating to components of other comprehensive income – – – (7.2) – – (7.2) Net expense recognised in other comprehensive income – – – 28.3 – – 28.3 Profit for the year – – – 43.3 – – 43.3 Total comprehensive income for the year – – – 71.6 – – 71.6 Dividends paid – – – (39.9) – – (39.9) Share-based payments – – – 10.1 1.5 – 11.6 At 30 June 2016 14.7 369.6 2.7 265.2 20.2 – 672.4 (In £s million) Share capital Share premium account Capital redemption reserve Retained earnings Equity reserve Own shares Total At 1 July 2014 14.7 369.6 2.7 224.4 18.3 (0.2) 629.5 Remeasurement of defined benefit pension schemes – – – (25.8) – – (25.8) Tax relating to components of other comprehensive income – – – 4.3 – – 4.3 Net expense recognised in other comprehensive income – – – (21.5) – – (21.5) Profit for the year – – – 47.0 – – 47.0 Total comprehensive income for the year – – – 25.5 – – 25.5 Dividends paid – – – (37.9) – – (37.9) Share-based payments – – – 10.6 0.4 0.2 11.2 Tax on share-based payment transactions – – – 0.8 – – 0.8 At 30 June 2015 14.7 369.6 2.7 223.4 18.7 – 629.1 Hays plc | 2016 Annual Report and Financial Statements126 COMPANY STATEMENT OF CHANGES IN EQUITY FOR THE YEAR ENDED 30 JUNE 2016 FOR THE YEAR ENDED 30 JUNE 2015
  • 131.
    1. Accounting policies a. Basis of accounting The financial statements have been prepared under the historical cost convention, in accordance with Financial Reporting standard 101 (FRS101) ‘Reduced Disclosure Framework’ as issued by the Financial Reporting Council. The prior financial statements were prepared in accordance with UK GAAP and have been restated for material adjustments on adoption of FRS 101 in the current year. The last financial statements under a previous GAAP (UK GAAP) were for the year ended 30 June 2015 and the date of transition to FRS 101 was therefore 1 July 2014. There has been no movement in total equity due to the change in accounting framework from UK GAAP to FRS 101. Movements in equity are detailed on page 126. As permitted by Section 408 of the Companies Act 2006, the Company’s income statement has not been presented. The Company, as permitted by FRS 101, has taken advantage of the disclosure exemptions available under that standard in relation to share-based payments, financial instruments, certain disclosures regarding the Company’s capital, capital management, presentation of comparative information in respect of certain assets, presentation of a cash flow statement, certain related party transactions and the effect of future accounting standards not yet adopted. Where required, equivalent disclosures are provided in the Group financial statements of Hays plc. The significant accounting policies and significant judgments and key estimates relevant to the Company are the same as those set out in note 2 and note 3 to the Group financial statements. 2. Employee information There are no staff employed by the Company (2015: none). Therefore no remuneration has been disclosed. Details of directors’ emoluments and interests are included in the directors’ Remuneration Report on pages 64 to 85 of the Annual Report. 3. Profit for the year Hays plc has not presented its own income statement and related notes as permitted by Section 408 of the Companies Act 2006. The profit for the financial year in the Hays plc Company financial statements is £43.3 million (2015: profit £47.0 million). 4. Property, plant and equipment (In £s million) Plant and machinery Fixtures and fittings Total Cost At 1 July 2015 1.2 1.2 2.4 Additions – 0.8 0.8 Disposals (0.4) – (0.4) At 30 June 2016 0.8 2.0 2.8 Depreciation At 1 July 2015 1.1 1.0 2.1 Charge for the year – 0.1 0.1 Disposals (0.3) – (0.3) At 30 June 2016 0.8 1.1 1.9 Net book value At 30 June 2016 – 0.9 0.9 At 1 July 2015 0.1 0.2 0.3 5. Investment in subsidiaries (In £s million) Shares in subsidiary undertakings Cost At 1 July 2015 and 30 June 2016 910.4 Provision for impairment At 1 July 2015 and 30 June 2016 – Total At 30 June 2015 and 30 June 2016 910.4 The principal subsidiary undertakings of the Group are listed in note 13. Hays plc | 2016 Annual Report and Financial Statements127 OVERVIEW  STRATEGICREPORT  GOVERNANCE  FINANCIALSTATEMENTS  SHAREHOLDERINFORMATION NOTES TO THE COMPANY FINANCIAL STATEMENTS
  • 132.
    6. Trade andother receivables: amounts falling due after more than one year (In £s million) 2016 2015 Prepayments 1.5 1.7 Amounts owed by subsidiary undertakings 114.4 119.1 115.9 120.8 The Company charges interest on amounts owed by subsidiary undertakings at a rate of three-month LIBOR plus 1%. 7. Deferred tax Deferred tax assets in relation to: (In £s million) 2016 2015 Retirement benefit obligations 2.7 11.7 Other short-term timing differences 0.3 0.4 3.0 12.1 8. Trade and other receivables: amounts falling due within one year (In £s million) 2016 2015 Corporation tax debtor 8.8 8.1 Prepayments 2.7 2.1 11.5 10.2 9. Trade and other payables (In £s million) 2016 2015 Accruals 15.9 19.5 Amounts owed to subsidiary undertakings 336.9 316.2 352.8 335.7 Amounts owed to subsidiary undertakings are repayable on demand. The Company is charged interest on amounts owed to subsidiary undertakings at a rate of three-month LIBOR less 1%. 10. Bank overdraft Bank overdrafts are unsecured and repayable on demand. There was no overdraft repayable at the end of the year (2015: £22.5 million). 11. Retirement benefit obligations (In £s million) 2016 2015 Defined benefit scheme deficit 14.3 58.7 The details of this UK scheme, for which Hays plc is the sponsoring employer, are set out in note 22 to the Group financial statements. 12. Provisions (In £s million) At 1 July 2015 7.8 Credited to the income statement (1.9) Utilised during the year (0.6) At 30 June 2016 5.3 Provisions comprise of potential exposures arising as a result of the business disposals relating to the Group transformation that concluded in 2004. During the year warranty claim liabilities relating to the discontinued operations expired resulting in a £1.9 million release to the income statement. It is not possible to estimate the timing of payments against the remaining provisions. Hays plc | 2016 Annual Report and Financial Statements128 NOTES TO THE COMPANY FINANCIAL STATEMENTS CONTINUED
  • 133.
    13. Subsidiaries Country ofregistration Accountancy Personnel Pty Limited Australia Accountancy Placements (Australia) Pty Limited Australia Ampoza Holdings Pty Limited Australia Hays Construction Pty Limited Australia Hays Property Pty Limited Australia Hays Specialist Recruitment (Australia) Pty Limited Australia Hays Superannuation Pty Limited Australia Hays Österreich GmbH Personnel Services Austria Hays NV Belgium Hays Services NV Belgium Hays Recruitment and Selection Ltda Brazil Hays Specialist Recruitment (Canada) Inc. Canada Hays Especialistas En Reclutamiento Limitada Chile Hays Specialist Recruitment (Shanghai) Co. Limited* (90% owned) China Hays Colombia SAS Colombia Hays Czech Republic, s.r.o Czech Republic Hays Specialist Recruitment (Denmark) A/S Denmark Axis Resources Holdings Limited England Wales Axis Resources Limited England Wales EPS Pension Trustees Limited England Wales H101 Limited England Wales Hays Commercial Services Limited England Wales Hays Finance Technology Limited England Wales Hays Group Holdings Limited England Wales Hays Healthcare Limited England Wales Hays Holdings Limited England Wales Hays International Holdings Limited England Wales Hays Nominees Limited England Wales Hays Overseas Holdings Limited England Wales Hays Pension Trustee Limited England Wales Hays Personnel (Managed Solutions) Limited England Wales Hays Personnel Payroll Services Limited England Wales Hays Personnel Services Limited England Wales Hays Pharma Consulting Limited England Wales Hays Pharma Limited England Wales Hays Project Solutions Limited England Wales Hays Property Holdings Limited England Wales Hays Recruitment Services Limited England Wales Hays Social Care Limited England Wales Hays Specialist Recruitment (Holdings) Limited England Wales Hays Specialist Recruitment Limited England Wales Hays SRA Limited England Wales Hays Stakeholder Life Assurance Trustee Limited England Wales Hays ZMB Limited England Wales James Harvard International Group Limited England Wales Krooter Limited England Wales Myriad Computer Services Limited England Wales Oval (1620) Limited England Wales Owen, Thornhill and Harper Limited England Wales Paperstream Limited England Wales Hays plc | 2016 Annual Report and Financial Statements129 OVERVIEW  STRATEGICREPORT  GOVERNANCE  FINANCIALSTATEMENTS  SHAREHOLDERINFORMATION
  • 134.
    Country of registration RecruitmentSolutions Group Limited (IOM) England Wales RSG EBT Limited England Wales Weyside 23 Limited England Wales Weyside Group Limited England Wales Weyside Office Services Limited England Wales Weyside Telecoms Limited England Wales Weyside Turngate Limited England Wales Hays BTP Immobilier SASU France Hays Clinical Research SASU France Hays Consulting SASU France Hays Executive SASU France Hays Finance SASU France Hays France SAS France Hays Ile de France SASU France Hays IT Services SASU France Hays Medias SASU France Hays Nord Est SASU France Hays Ouest SASU France Hays Pharma Consulting SASU France Hays Pharma SASU France Hays Pharma Services SASU France Hays Sud Est SASU France Hays Sud Ouest SASU France Hays Talent Solutions SAS France Hays Travail Temporaire SASU France Hays AG Germany Hays Talent Solutions GmbH Germany Hays Holding GmbH Germany Hays Technology Solutions GmbH Germany Hays Temp GmbH Germany Hays Hong Kong Limited Hong Kong Hays Specialist Recruitment Hong Kong Limited Hong Kong Hays Hungary Kft. Hungary Hays Business Solutions Private Limited (Gurgaon) India Hays Specialist Recruitment Private Limited India Hays Business Services Ireland Limited Ireland Hays Specialist Recruitment (Ireland) Limited Ireland Hays Professional Services S.r.l Italy Hays S.r.l Italy Hays Resource Management Japan K.K. Japan Hays Specialist Recruitment Japan K.K. Japan Hays Finance (Jersey) Limited Jersey Hays S.a.r.l Luxembourg Hays Travail Temporaire Luxembourg Luxembourg Hays Specialist Recruitment (Malaysia) Sdn. Bhd.* (49% owned) Malaysia Hays Solution Sdn. Bhd. Malaysia Hays Specialist Recruitment Holdings Sdn. Bhd. Malaysia Hays Servicios, S.A. de C.V. Mexico Hays, S.A. de C.V. Mexico Hays B.V. Netherlands 13. Subsidiaries continued Hays plc | 2016 Annual Report and Financial Statements130 NOTES TO THE COMPANY FINANCIAL STATEMENTS CONTINUED
  • 135.
    Country of registration HaysCommercial Services B.V. Netherlands Hays Holdings B.V. Netherlands Hays Services B.V. Netherlands Hays Temp B.V. Netherlands Hays Specialist Recruitment (NZ) Limited New Zealand Hays Document Management (Private) Limited Pakistan Hays Poland sp. z.o.o. Poland Hays Poland Centre of Excellence sp. z.o.o. Poland Hays Recrutamento Seleccao e Empresa de Trabalho Tempoario Unipessoal LDA Portugal Hays Specialist Recruitment Romania SRL Romania Hays Business Solutions Limited Liability Company Russia Hays IT Solutions Limited Liability Company Russia Hays Specialist Recruitment Limited Liability Company Russia Hays Specialist Recruitment P.T.E Limited Singapore Hays Business Services S.L Spain Hays Personnel Espana Empresa de Trabajo Temporal SA Spain Hays Personnel Services Espana SA Spain Hays Specialist Recruitment AB Sweden Hays (Schweiz) AG Switzerland Hays FZ-LLC UAE 3 Story Software LLC United States of America Hays Holding Corporation United States of America Hays Specialist Recruitment LLC United States of America Hays Talent Solutions LLC United States of America Hays USA Holdings Inc United States of America Veredus Corporation* (80% owned) United States of America Veredus Government Solutions LLC* (80% owned) United States of America Veredus Holdings Inc* (80% owned) United States of America Veredus LLC* (80% owned) United States of America As at 30 June 2016, Hays plc and/or a subsidiary or subsidiaries in aggregate owned 100% of each class of the issued shares of each of these companies with the exception of companies marked with an asterisk (*) in which case each class of issued shares held was as stated. 14. Other related party transactions Hays plc has taken advantage of the exemption granted under paragraph 8(k) of FRS 101 not to disclose transactions with fellow wholly owned subsidiaries. Transactions entered into and trading balances outstanding that were owed to Hays plc at 30 June 2016 with other related parties was £1.7 million (2015: £0.1 million). 15. Subsequent events The final dividend for 2016 of 1.99 pence per share (£28.7 million) will be proposed at the Annual General Meeting on 9 November 2016 and has not been included as a liability as at 30 June 2016. If approved, the final dividend will be paid on 11 November 2016 to shareholders on the register at close of business on 14 October 2016. Hays plc | 2016 Annual Report and Financial Statements131 OVERVIEW  STRATEGICREPORT  GOVERNANCE  FINANCIALSTATEMENTS  SHAREHOLDERINFORMATION
  • 136.
    Hays plc |2016 Annual Report and Financial Statements132
  • 137.
    Shareholder information Supporting information forinvestors. In this section: 134 Shareholder information 135 Financial calendar 136 Hays online Hays plc | 2016 Annual Report and Financial Statements133 OVERVIEW  STRATEGICREPORT  GOVERNANCE  FINANCIALSTATEMENTS  SHAREHOLDERINFORMATION
  • 138.
    Equiniti provides arange of services for shareholders: Service What it offers How to participate Shareholder service You can access details of your shareholding and a range of other shareholder services. You can register at www.shareview.co.uk Enquiries relating to your shareholding You can inform Equiniti of lost share certificates, dividend warrants or tax vouchers, change of address or if you would like to transfer shares to another person. Please contact Equiniti. Dividend payments Dividends may be paid directly into your bank or building society account. Tax vouchers will continue to be sent to the shareholder’s registered address. Complete a dividend bank mandate instruction form which can be downloaded from www.shareview.co.uk or by telephoning Equiniti. Dividend payment direct to bank account for overseas shareholders Equiniti can convert your dividend in over 83 currencies to over 90 countries worldwide and send it directly to your bank account. For more details please visit www.shareview.co.uk or contact Equiniti. Dividend Reinvestment Plan (DRIP) The Company has a DRIP to allow shareholders to reinvest the cash dividend that they receive in Hays plc shares on competitive dealing terms. Further information is available from the Share Dividend helpline on 0371 384 2268 or visit www.shareview.co.uk Amalgamation of accounts If you receive more than one copy of the Annual Report Financial Statements, it could be because you have more than one record on the register. Equiniti can amalgamate your accounts into one record. Please contact Equiniti. Share dealing service(2) Equiniti offers Shareview Dealing, a service which allows you to sell your Hays plc shares or add to your holding if you are a UK resident. If you wish to deal, you will need your account/shareholder reference number which appears on your share certificate. Alternatively, if you hold a share certificate, you can also use any bank, building society or stockbroker offering share dealing facilities to buy or sell shares.(2) You can deal in your shares on the internet or by phone. For more information about this service and for details of the rates, log on to www.shareview.co.uk/ dealing or telephone Equiniti on 0345 603 7037 between 8.00am and 4.30pm, Monday to Friday. Individual Savings Accounts (ISAs)(2) Investors in Hays plc Ordinary shares may take advantage of a low-cost individual savings account (ISA) and/or an investment account where they can hold their Hays plc shares electronically. The ISA and investment account are operated by Equiniti Financial Services Limited and are subject to standard dealing commission rates. For further information or to apply for an ISA or investment account, visit Equiniti’s website at www.shareview.co.uk/ dealing or telephone them on 0345 300 0430. (1) Lines open 8.30am to 5.30pm (UK time), Monday to Friday (excluding public holidays in England and Wales). (2) The provision of share dealing services is not intended to be an invitation or inducement to engage in an investment activity. Advice on share dealing should be obtained from a professional independent financial adviser. Registrar The Company’s registrar is: Equiniti Limited Aspect House, Spencer Road, Lancing West Sussex BN99 6DA www.shareview.co.uk Telephone: 0371 384 2843(1) International: +44 121 415 7047 Textphone: 0371 384 2255 ID fraud and unsolicited mail Share-related fraud and identity theft affects shareholders of many companies and we urge you to be vigilant. If you receive any unsolicited mail offering advice, you should inform Equiniti immediately. As the Company’s share register is, by law, open to public inspection, shareholders may receive unsolicited mail from organisations that use it as a mailing list. To reduce the amount of unsolicited mail you receive, contact the Mailing Preference Service, FREEPOST 29 LON20771, London W1E 0ZT. Telephone: 0845 703 4599 or 020 7291 3310. Website: www.mpsonline.org.uk ShareGift ShareGift is a charity share donation scheme for shareholders and is administered by the Orr Mackintosh Foundation. It is especially useful for those shareholders who wish to dispose of a small number of shares whose value makes it uneconomical to sell on a normal commission basis. Further information can be obtained from www.sharegift.org or from Equiniti. Website The Company has a corporate website at haysplc.com, which holds, amongst other information, a copy of our latest Annual Report Financial Statements and copies of all announcements made over the last 12 months. Registered office 250 Euston Road London NW1 2AF Registered in England Wales no. 2150950 Telephone: +44 (0) 20 7383 2266 Company Secretary Doug Evans Email: cosec@hays.com Investor Relations contact David Walker, Head of Investor Relations Email: ir@hays.com Hays plc | 2016 Annual Report and Financial Statements134 SHAREHOLDER INFORMATION
  • 139.
    2016 18 October TradingUpdate for quarter ending 30 September 2016 9 November Annual General Meeting 11 November Payment of final dividend 2017 12 January Trading Update for quarter ending 31 December 2016 Hays plc | 2016 Annual Report and Financial Statements135 OVERVIEW  STRATEGICREPORT  GOVERNANCE  FINANCIALSTATEMENTS  SHAREHOLDERINFORMATION FINANCIAL CALENDAR
  • 140.
    Hays’ comprehensive investor sitegives you fast direct access to a wide range of Company information. haysplc.com Our investor site includes: –– Investment case –– Results centre –– Events calendar –– Corporate governance –– Investor day –– Regulatory news –– Alerts –– Share price information –– Shareholder services –– Advisors analysts’ consensus –– Annual reports archive LinkedIn linkedin.com/company/hays Twitter twitter.com/HaysWorldwide twitter.com/haysplcIR Facebook facebook.com/HaysUK YouTube youtube.com/user/HaysTV Follow and like us on social media: Hays plc | 2016 Annual Report and Financial Statements136 HAYS ONLINE
  • 141.
    This document isproduced using materials that are certified as FSC© mixed sources from well- managed forests. This document is printed on Heaven 42 paper that has been independently certified on behalf of the Forest Stewardship Council (FSC). Design and production: Gather +44 (0)20 7610 6140 www.gather.london © Copyright Hays plc 2016 HAYS, the Corporate and Sector H devices, Recruiting experts worldwide, the HAYS Recruiting experts worldwide logo, and Powering the World of Work are trademarks of Hays plc. The Corporate and Sector H devices are original designs protected by registration in many countries. All rights are reserved.
  • 142.