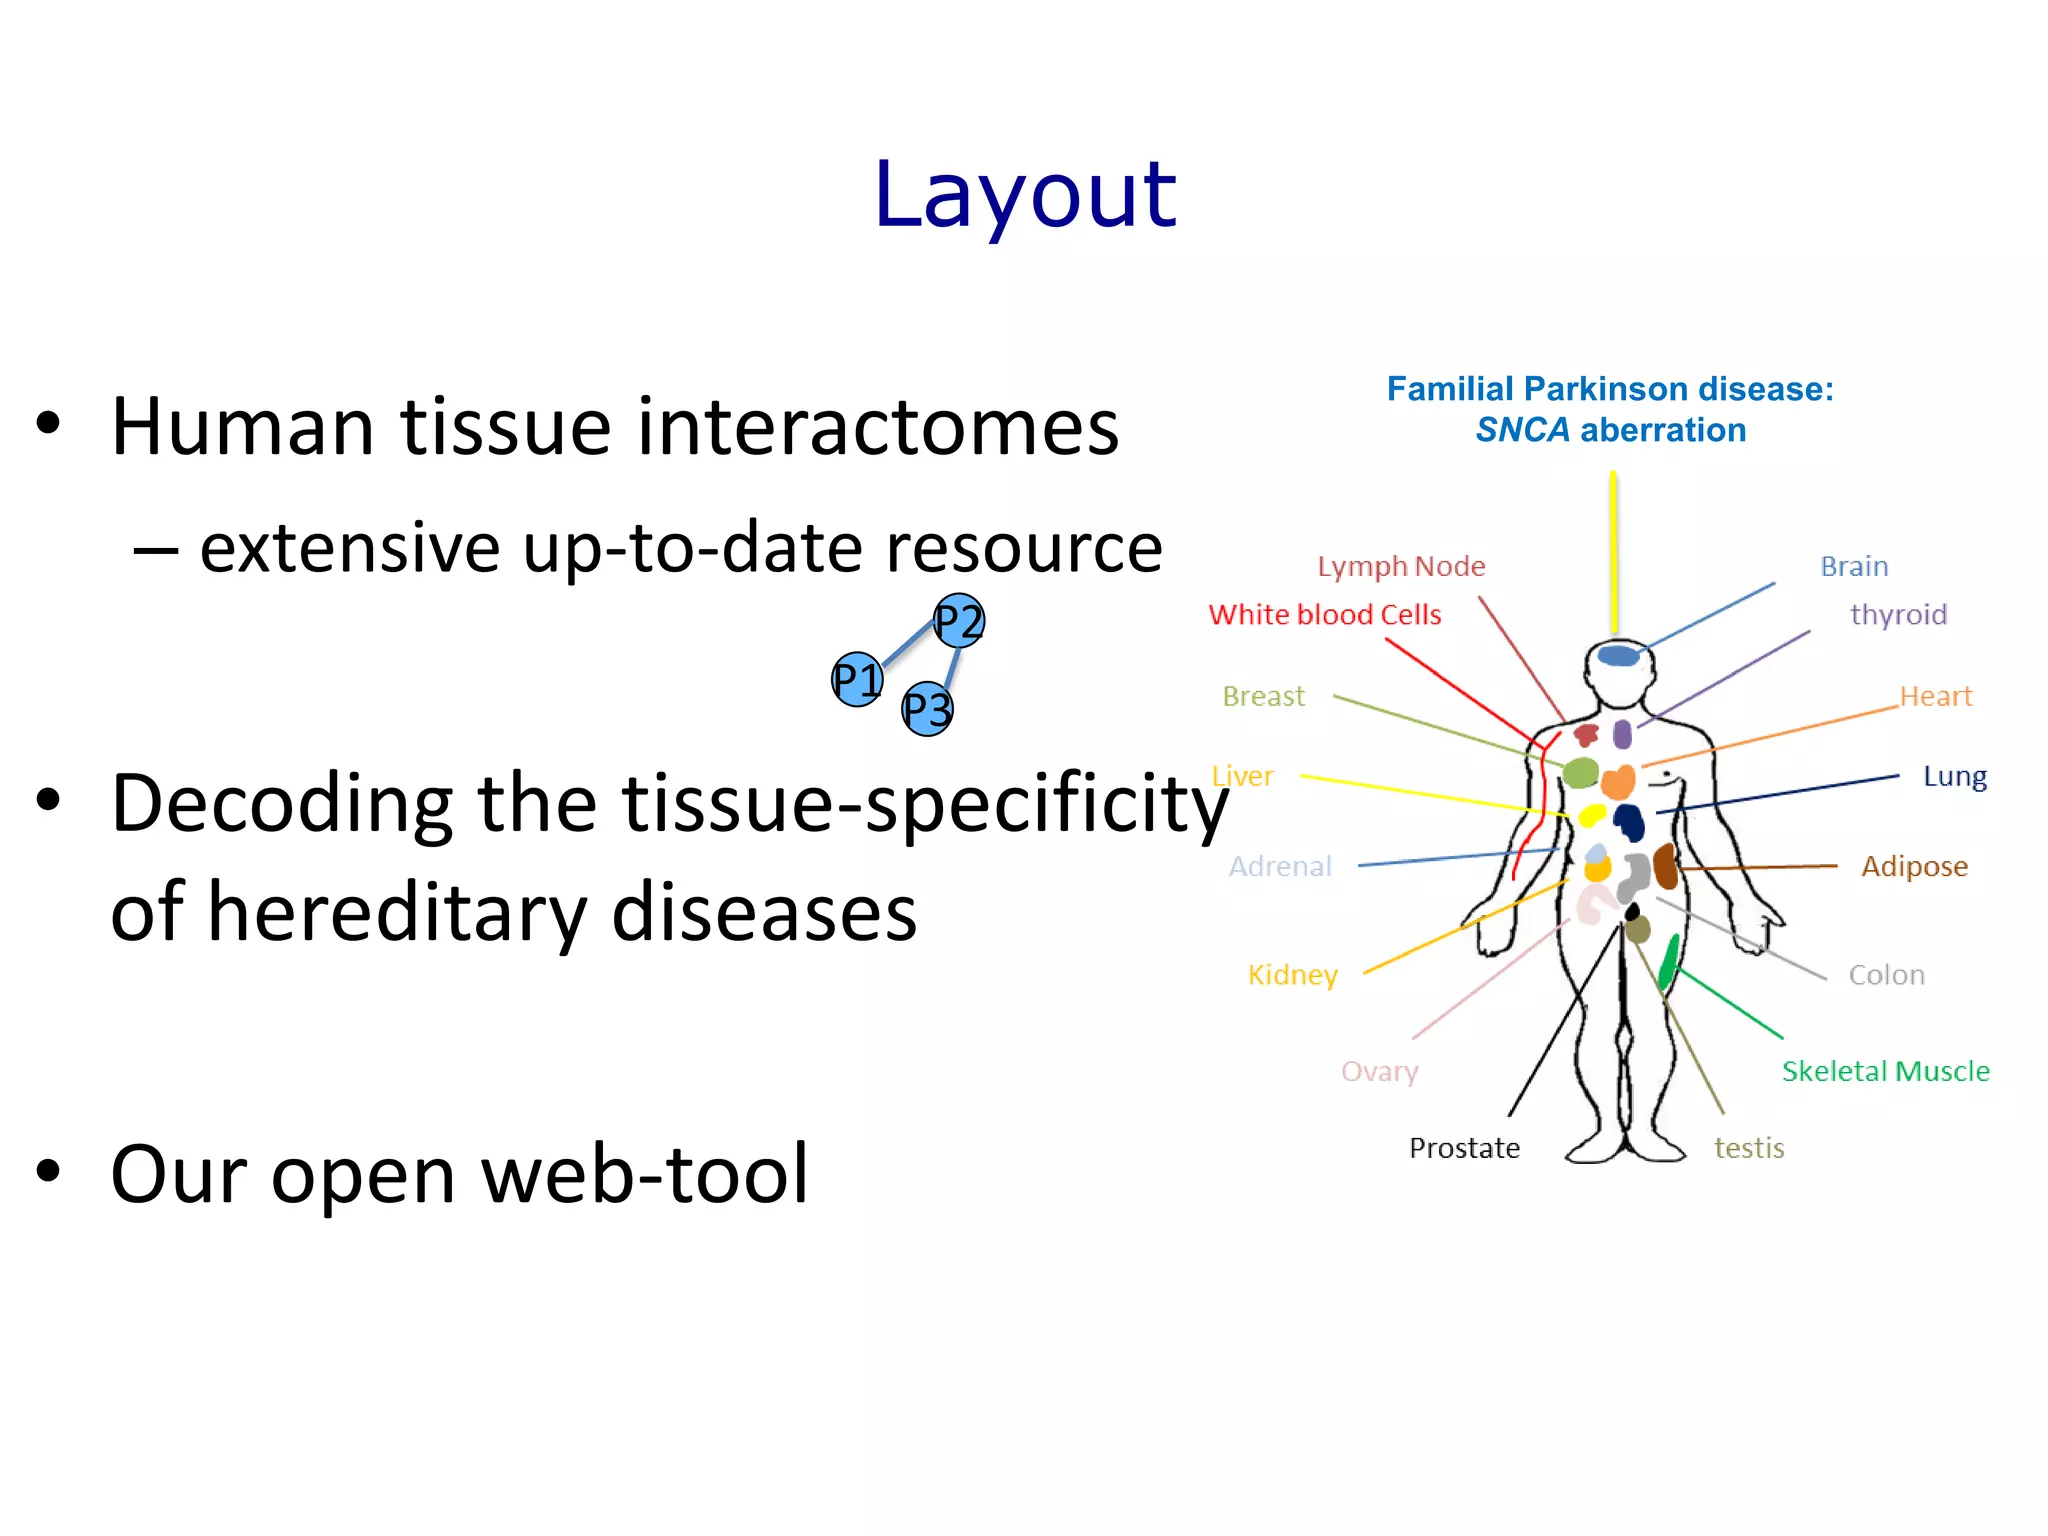
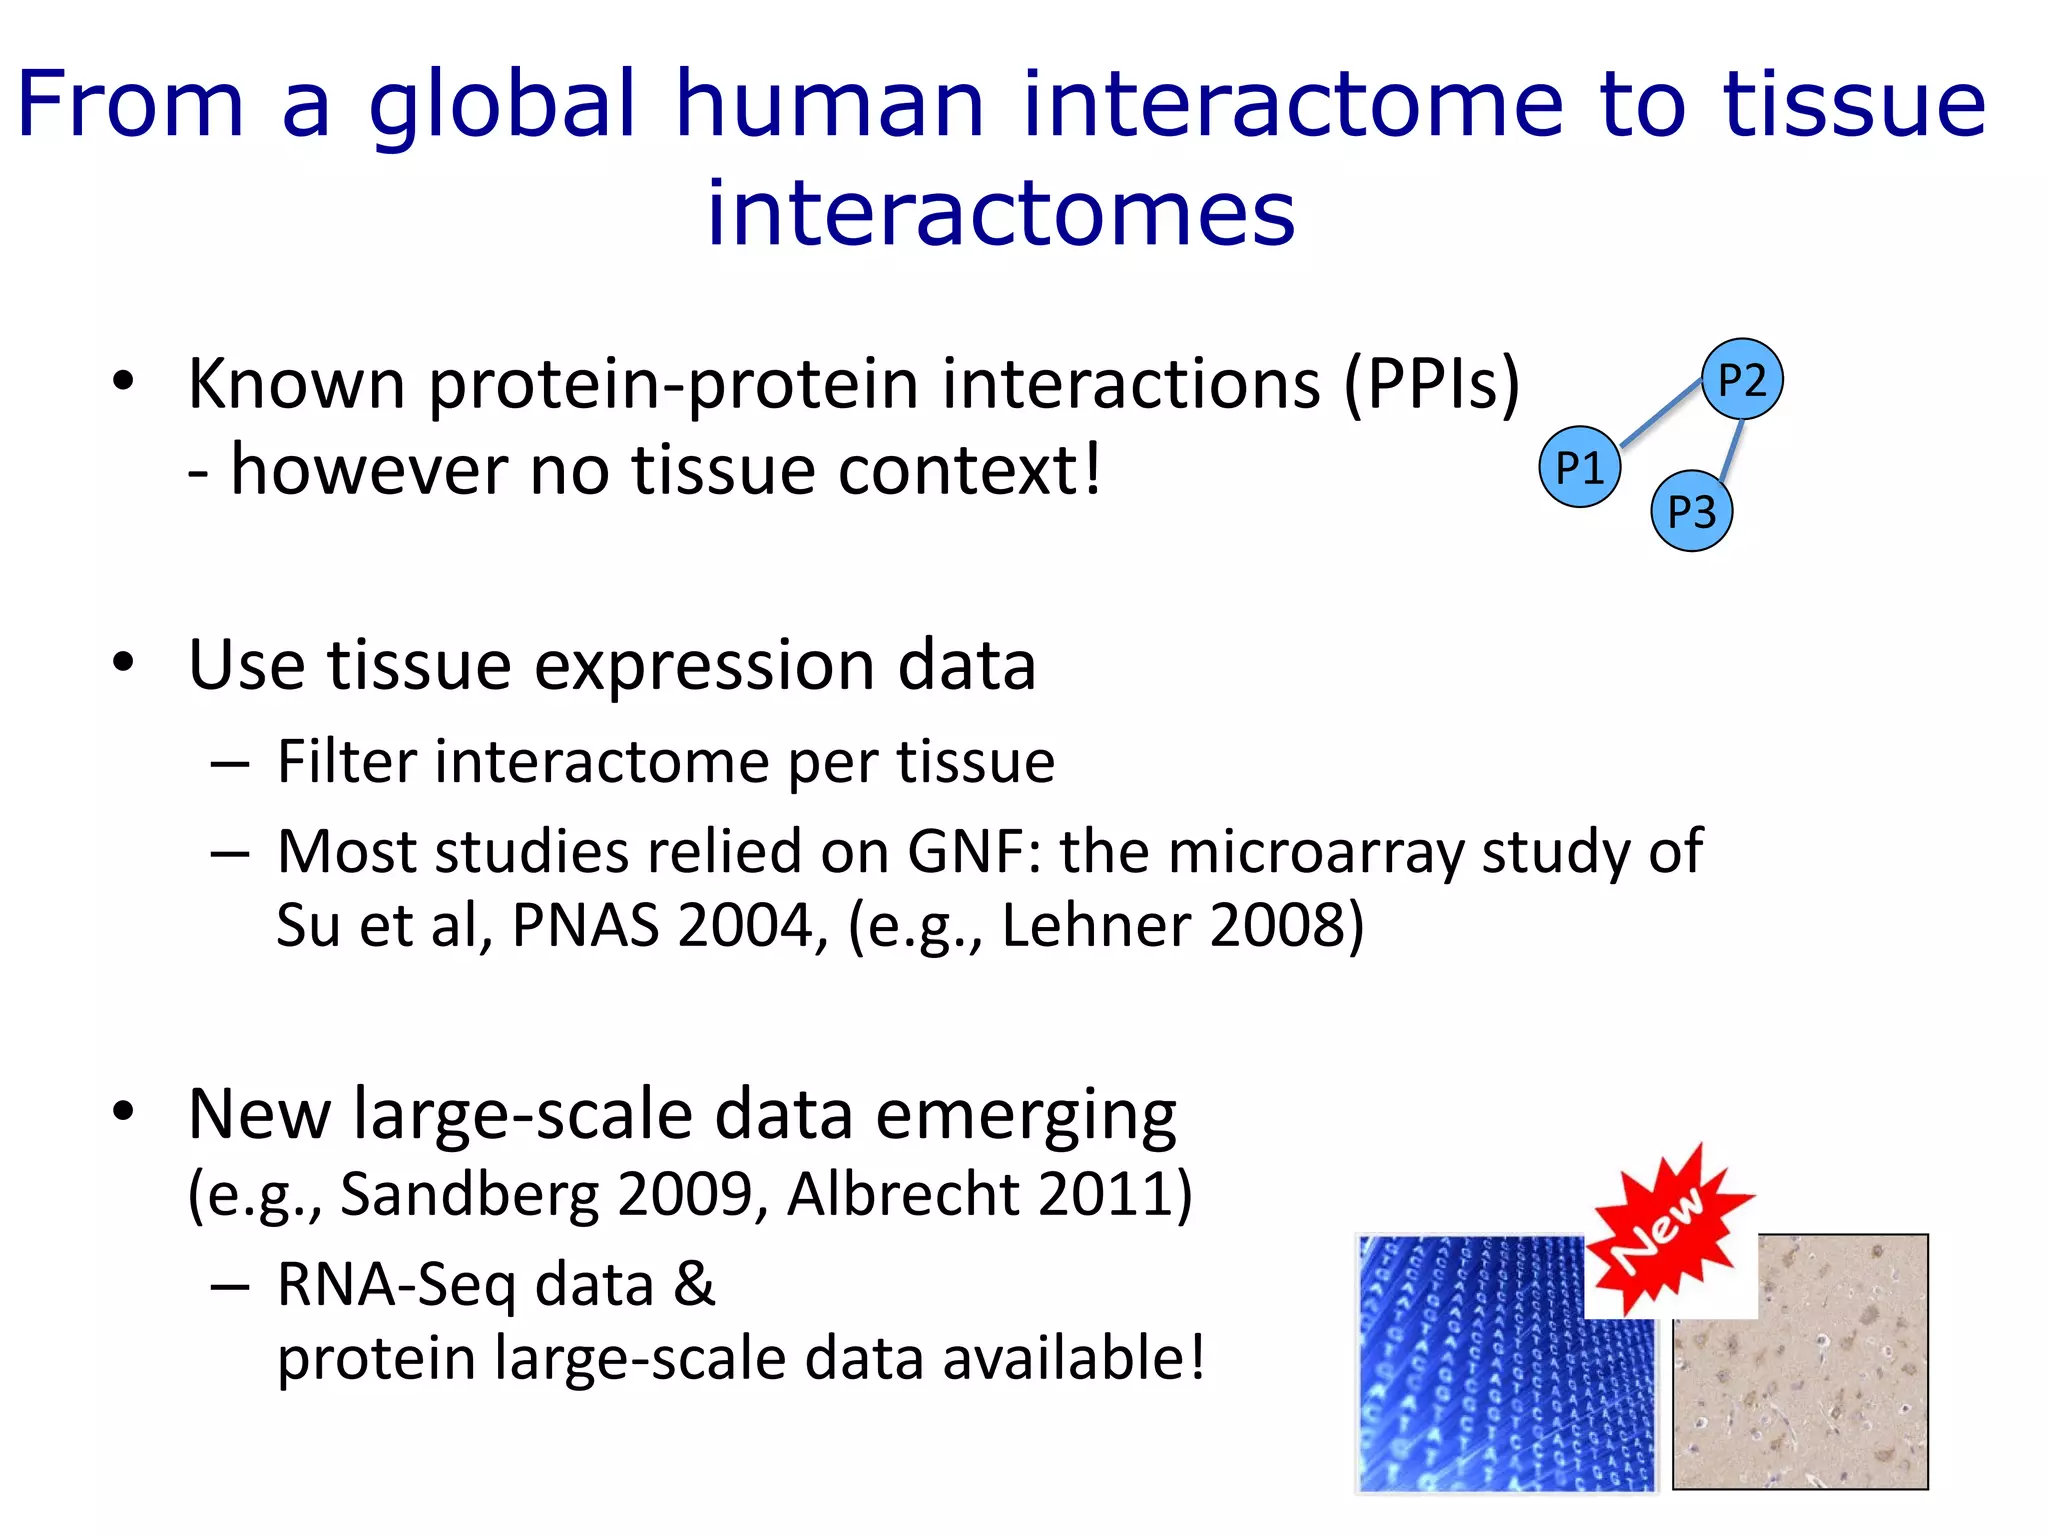
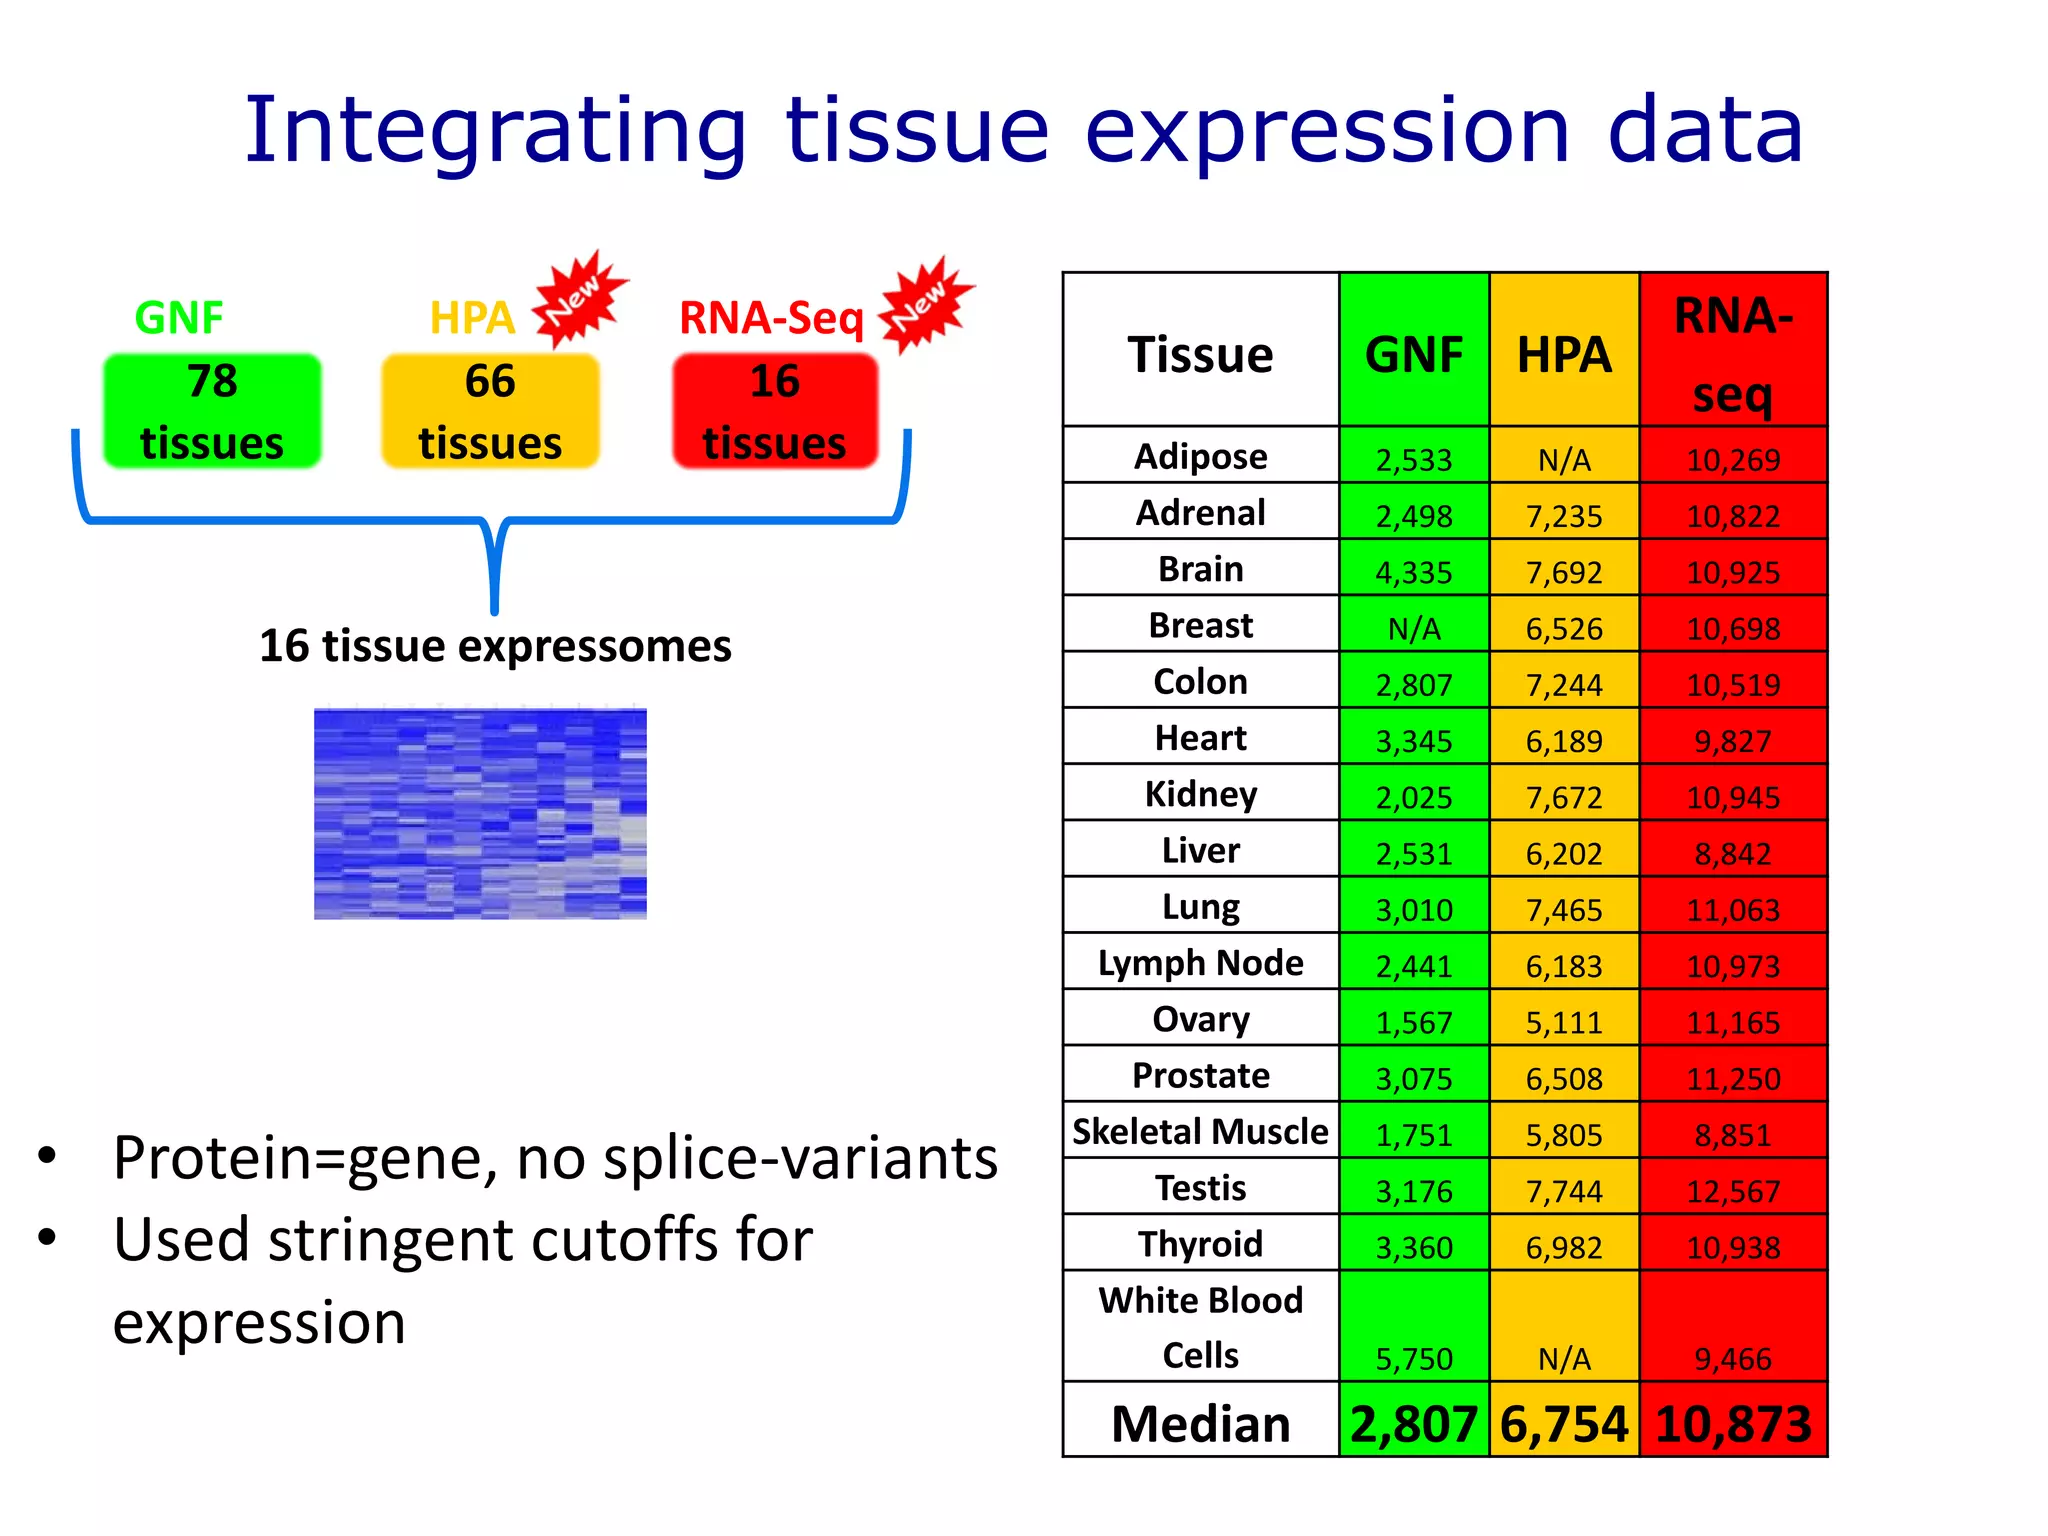
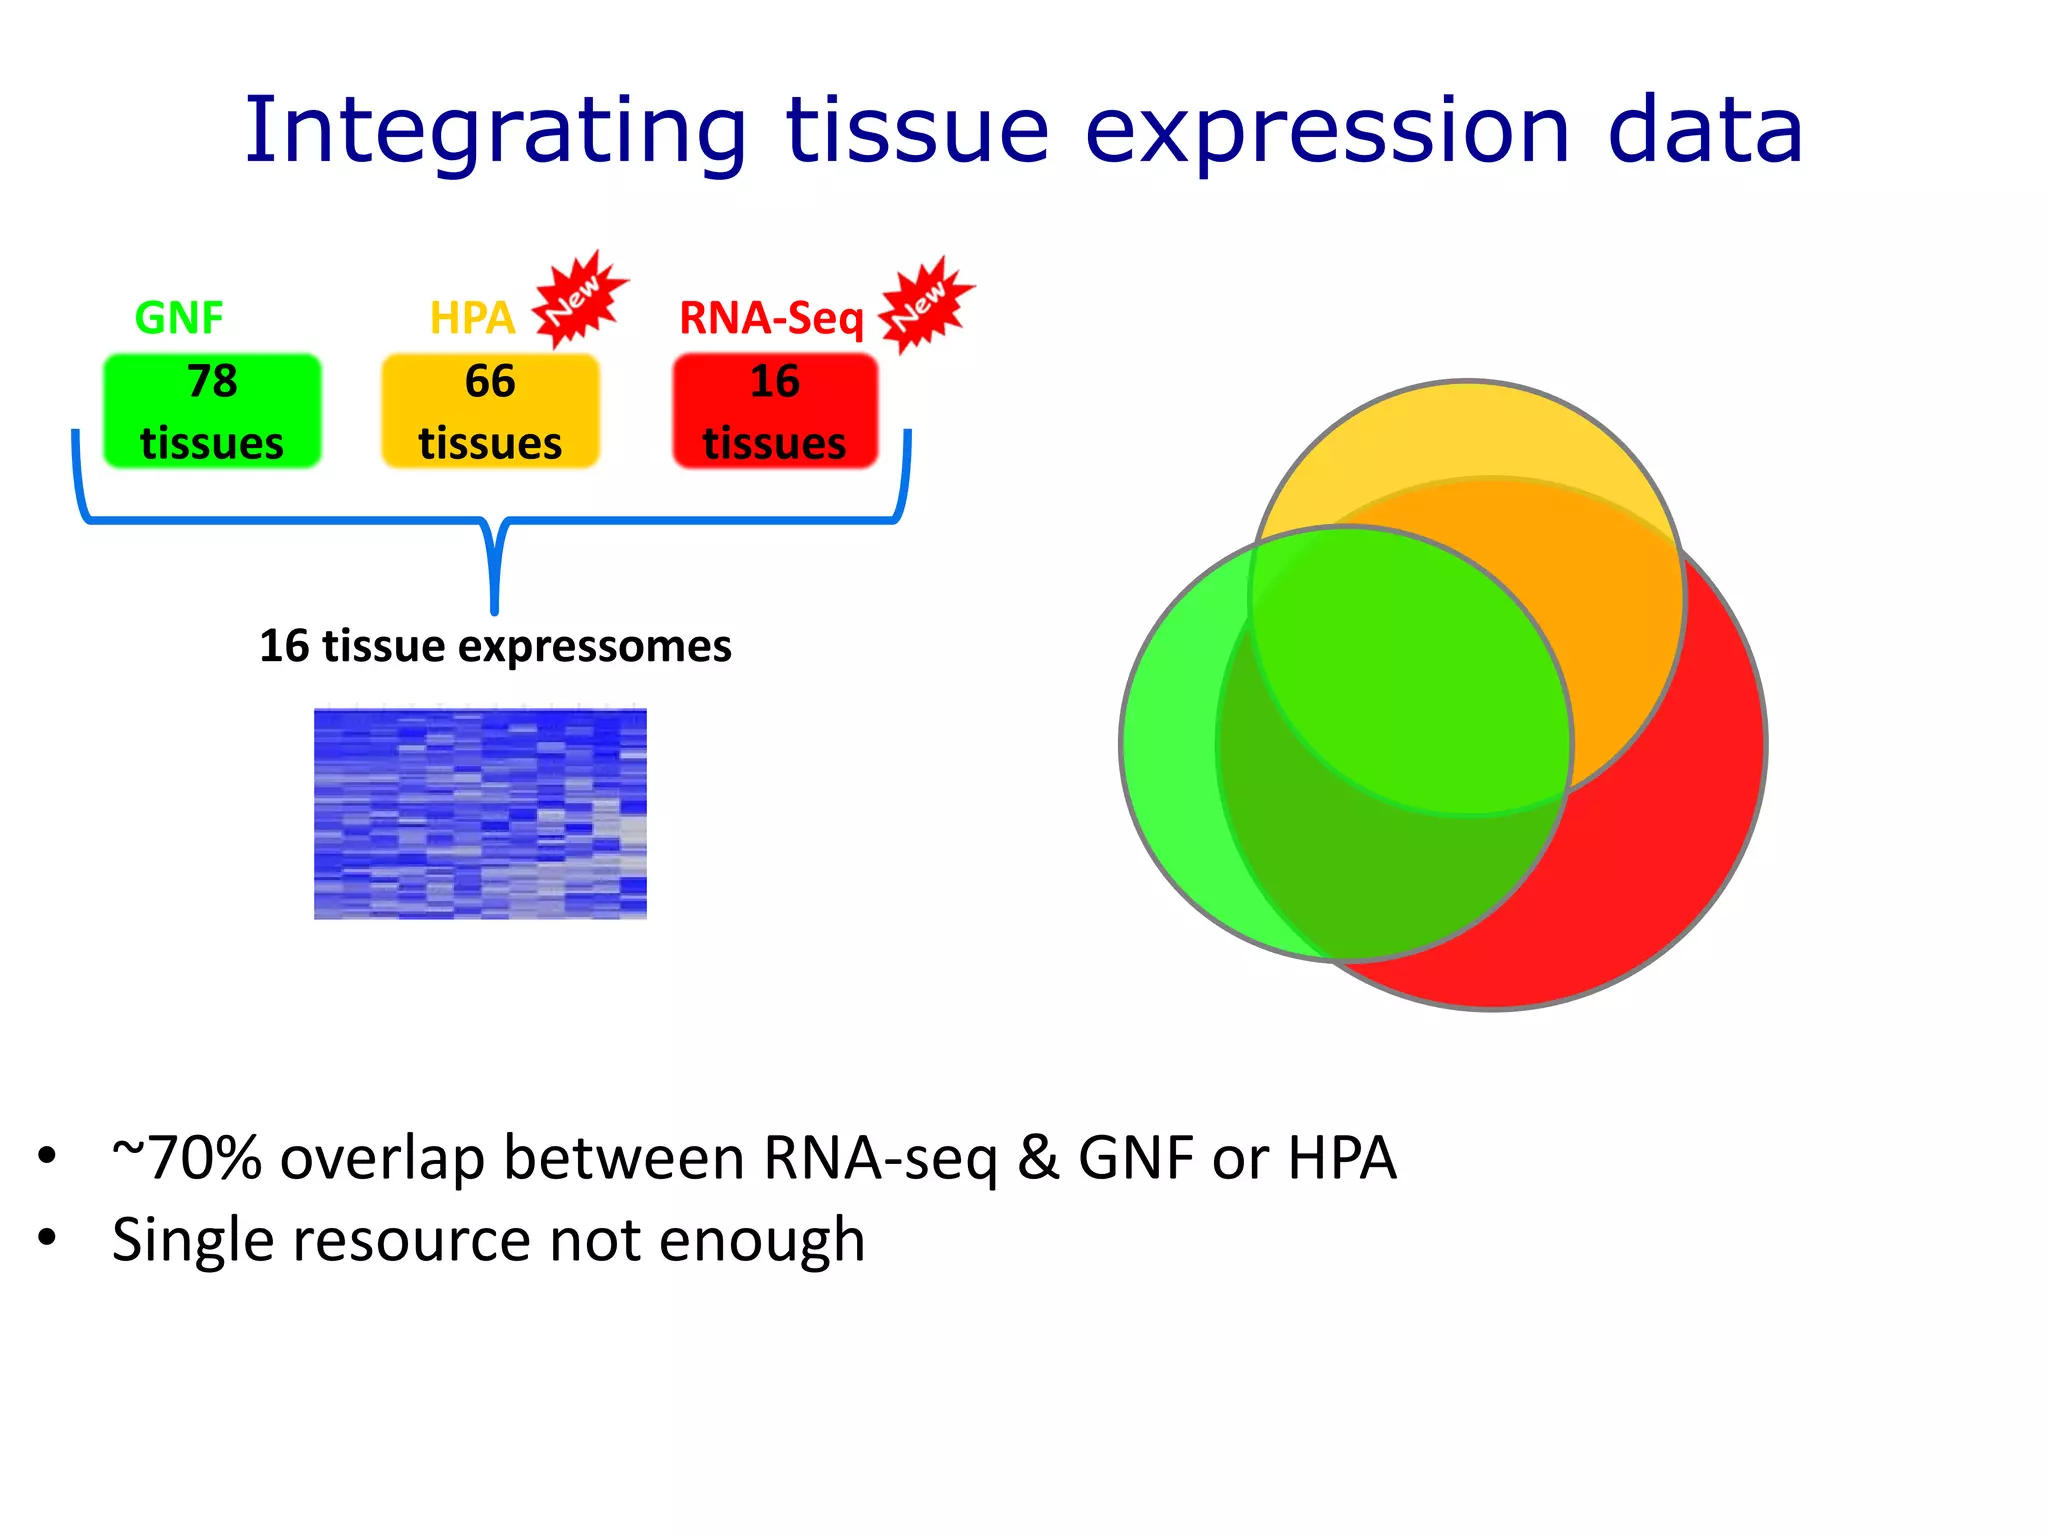
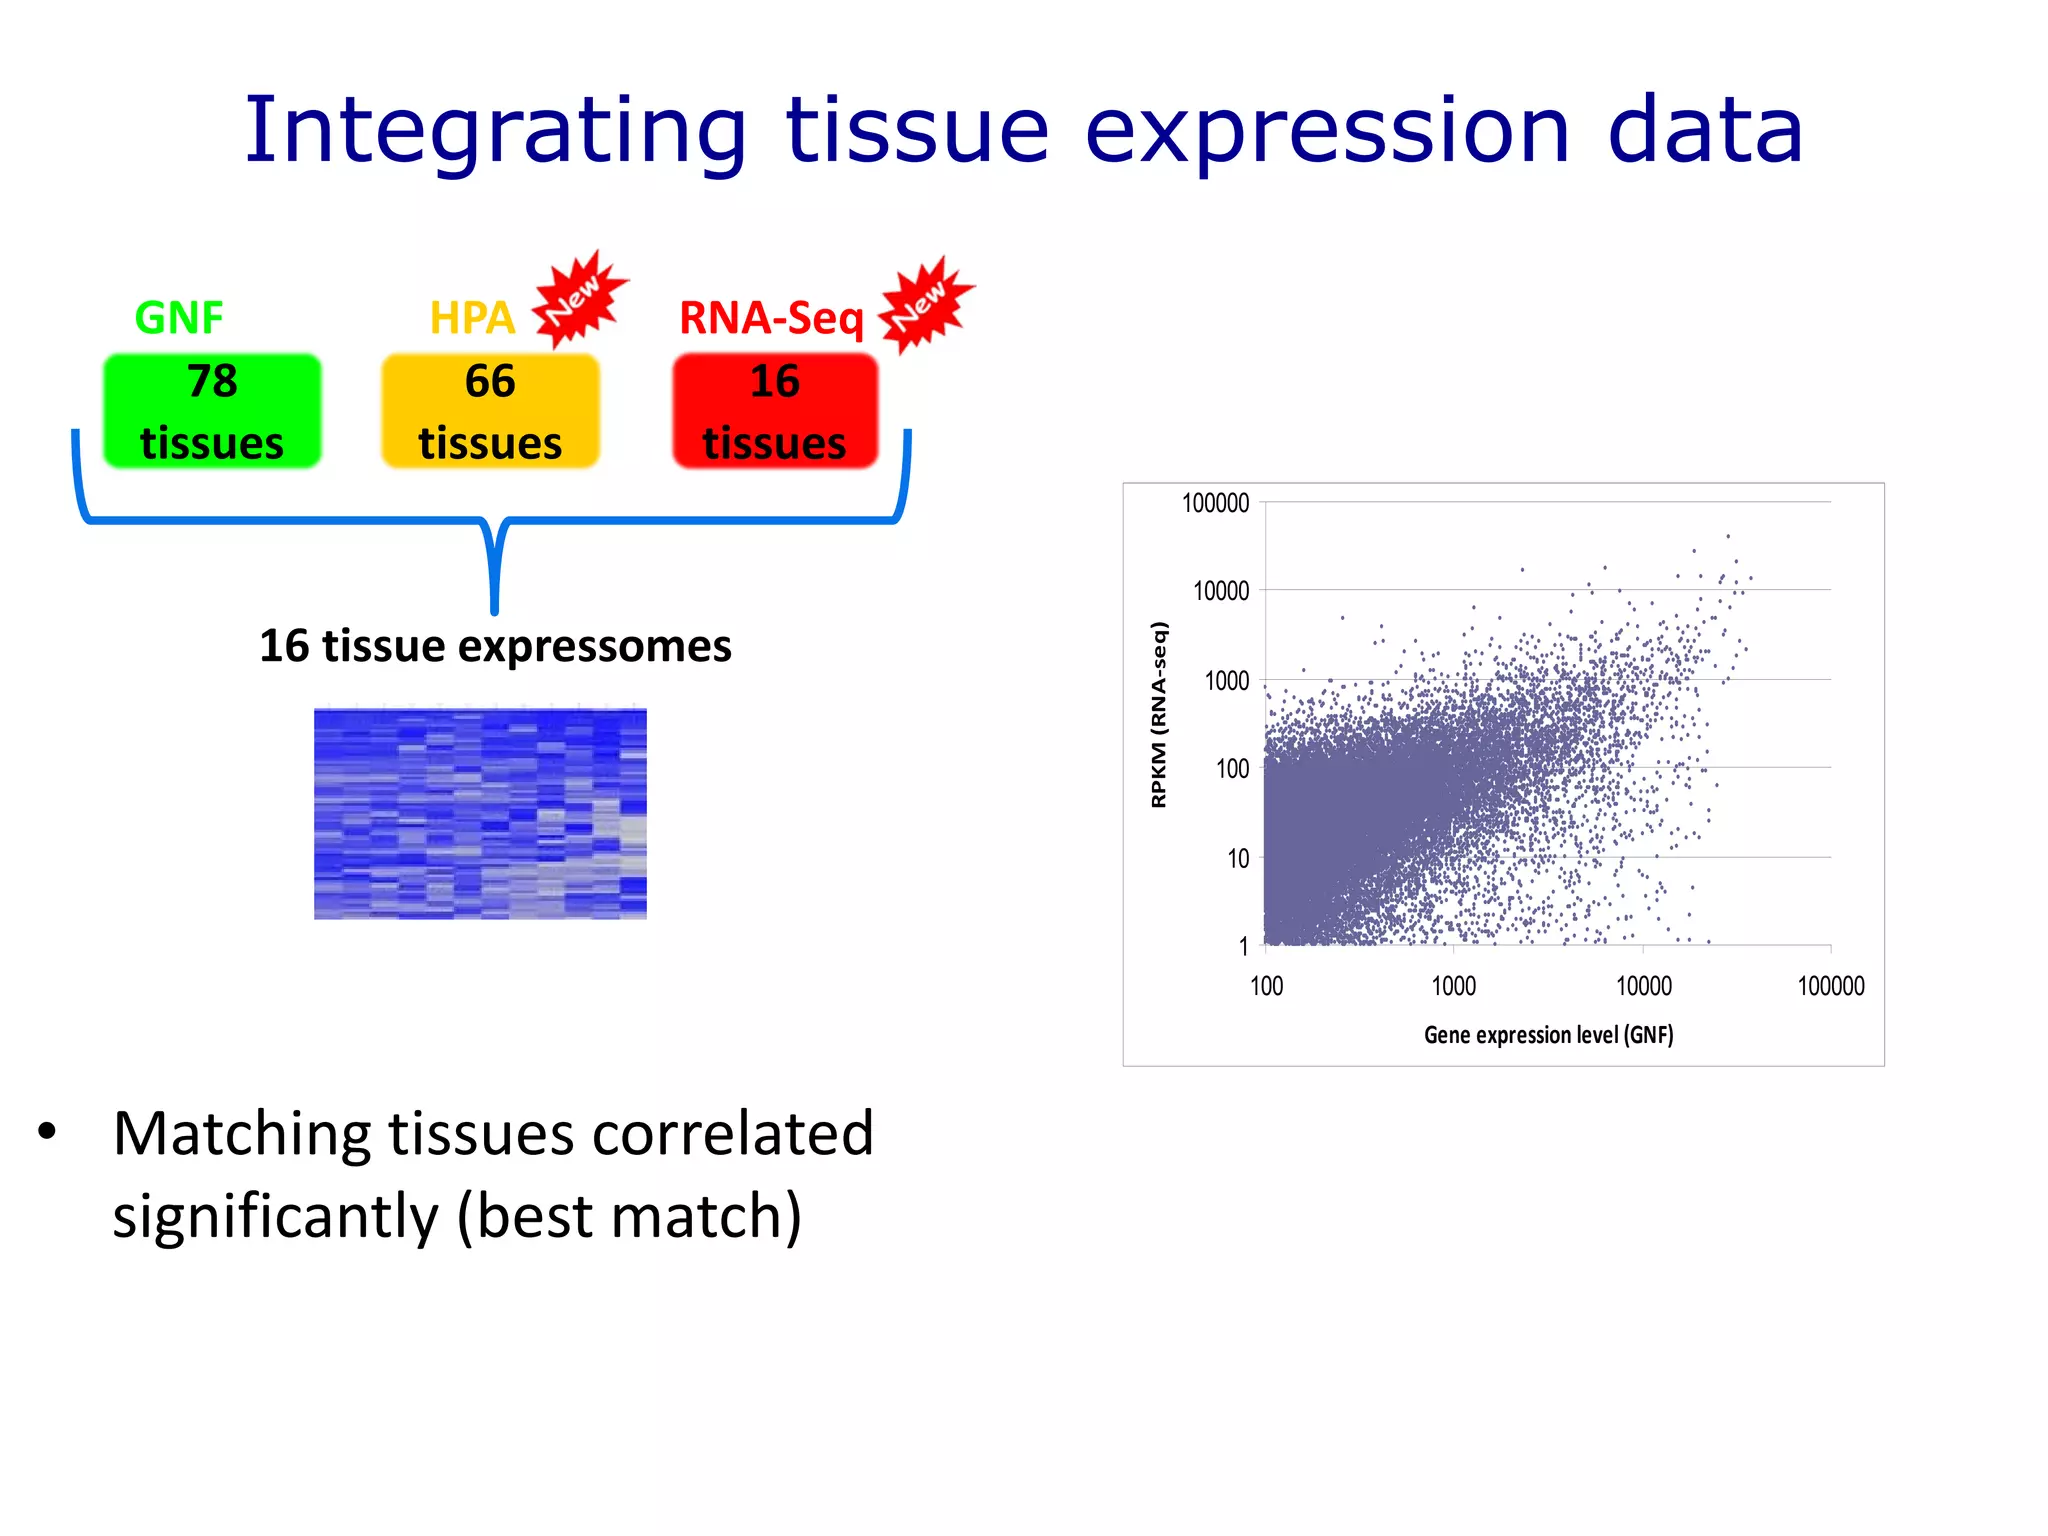
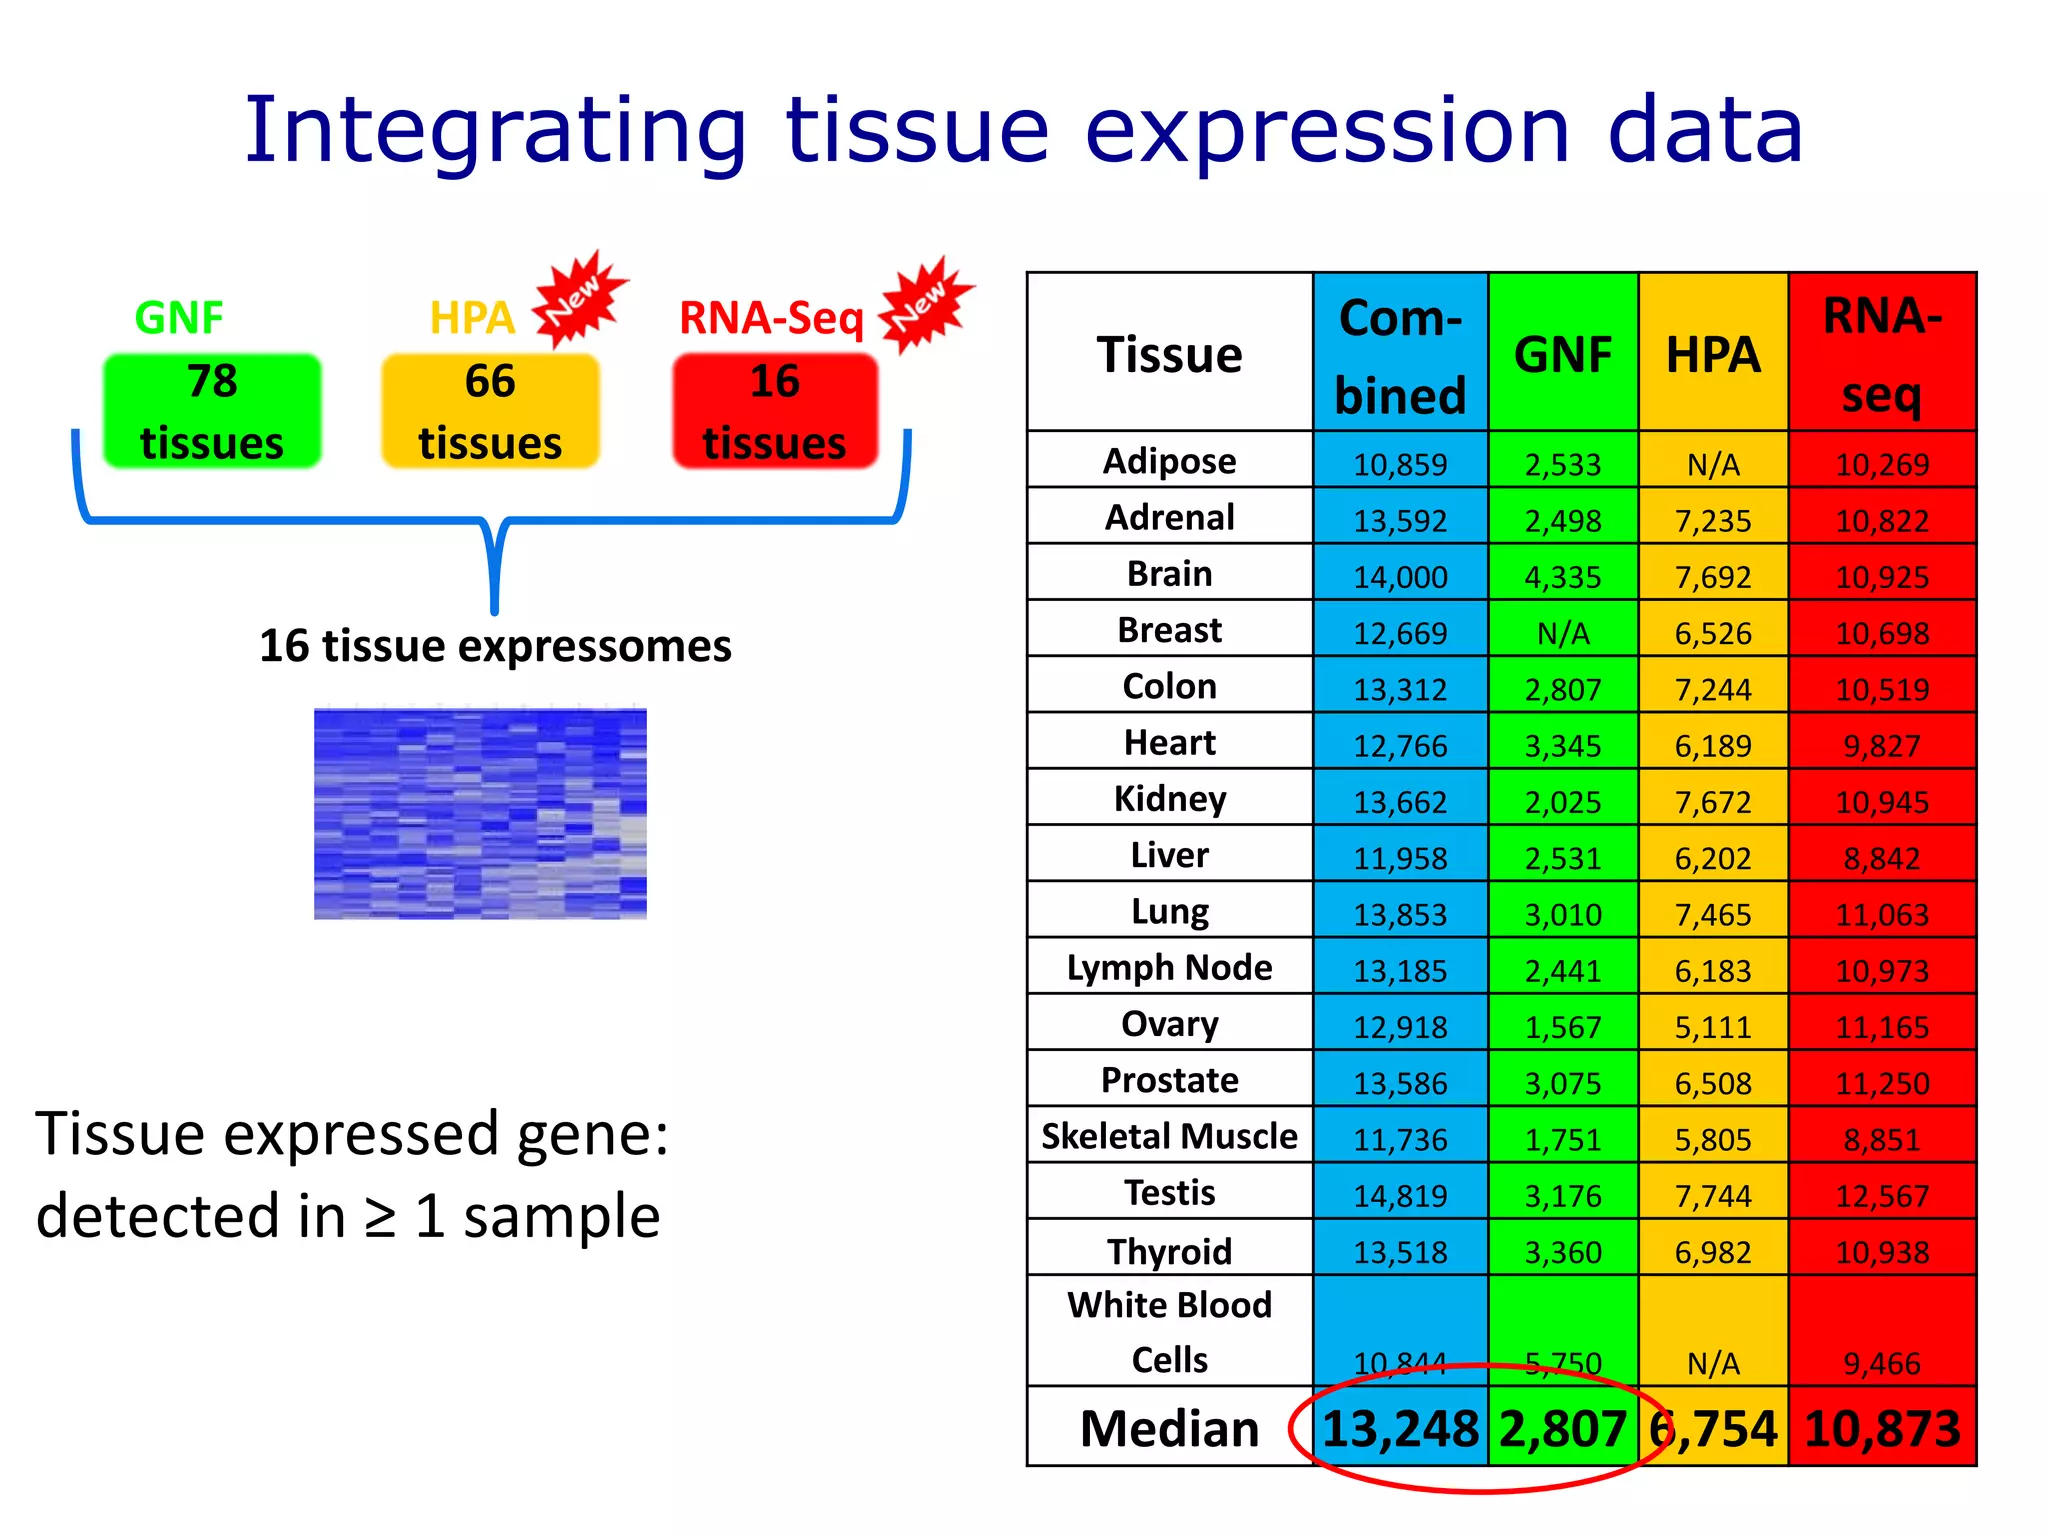
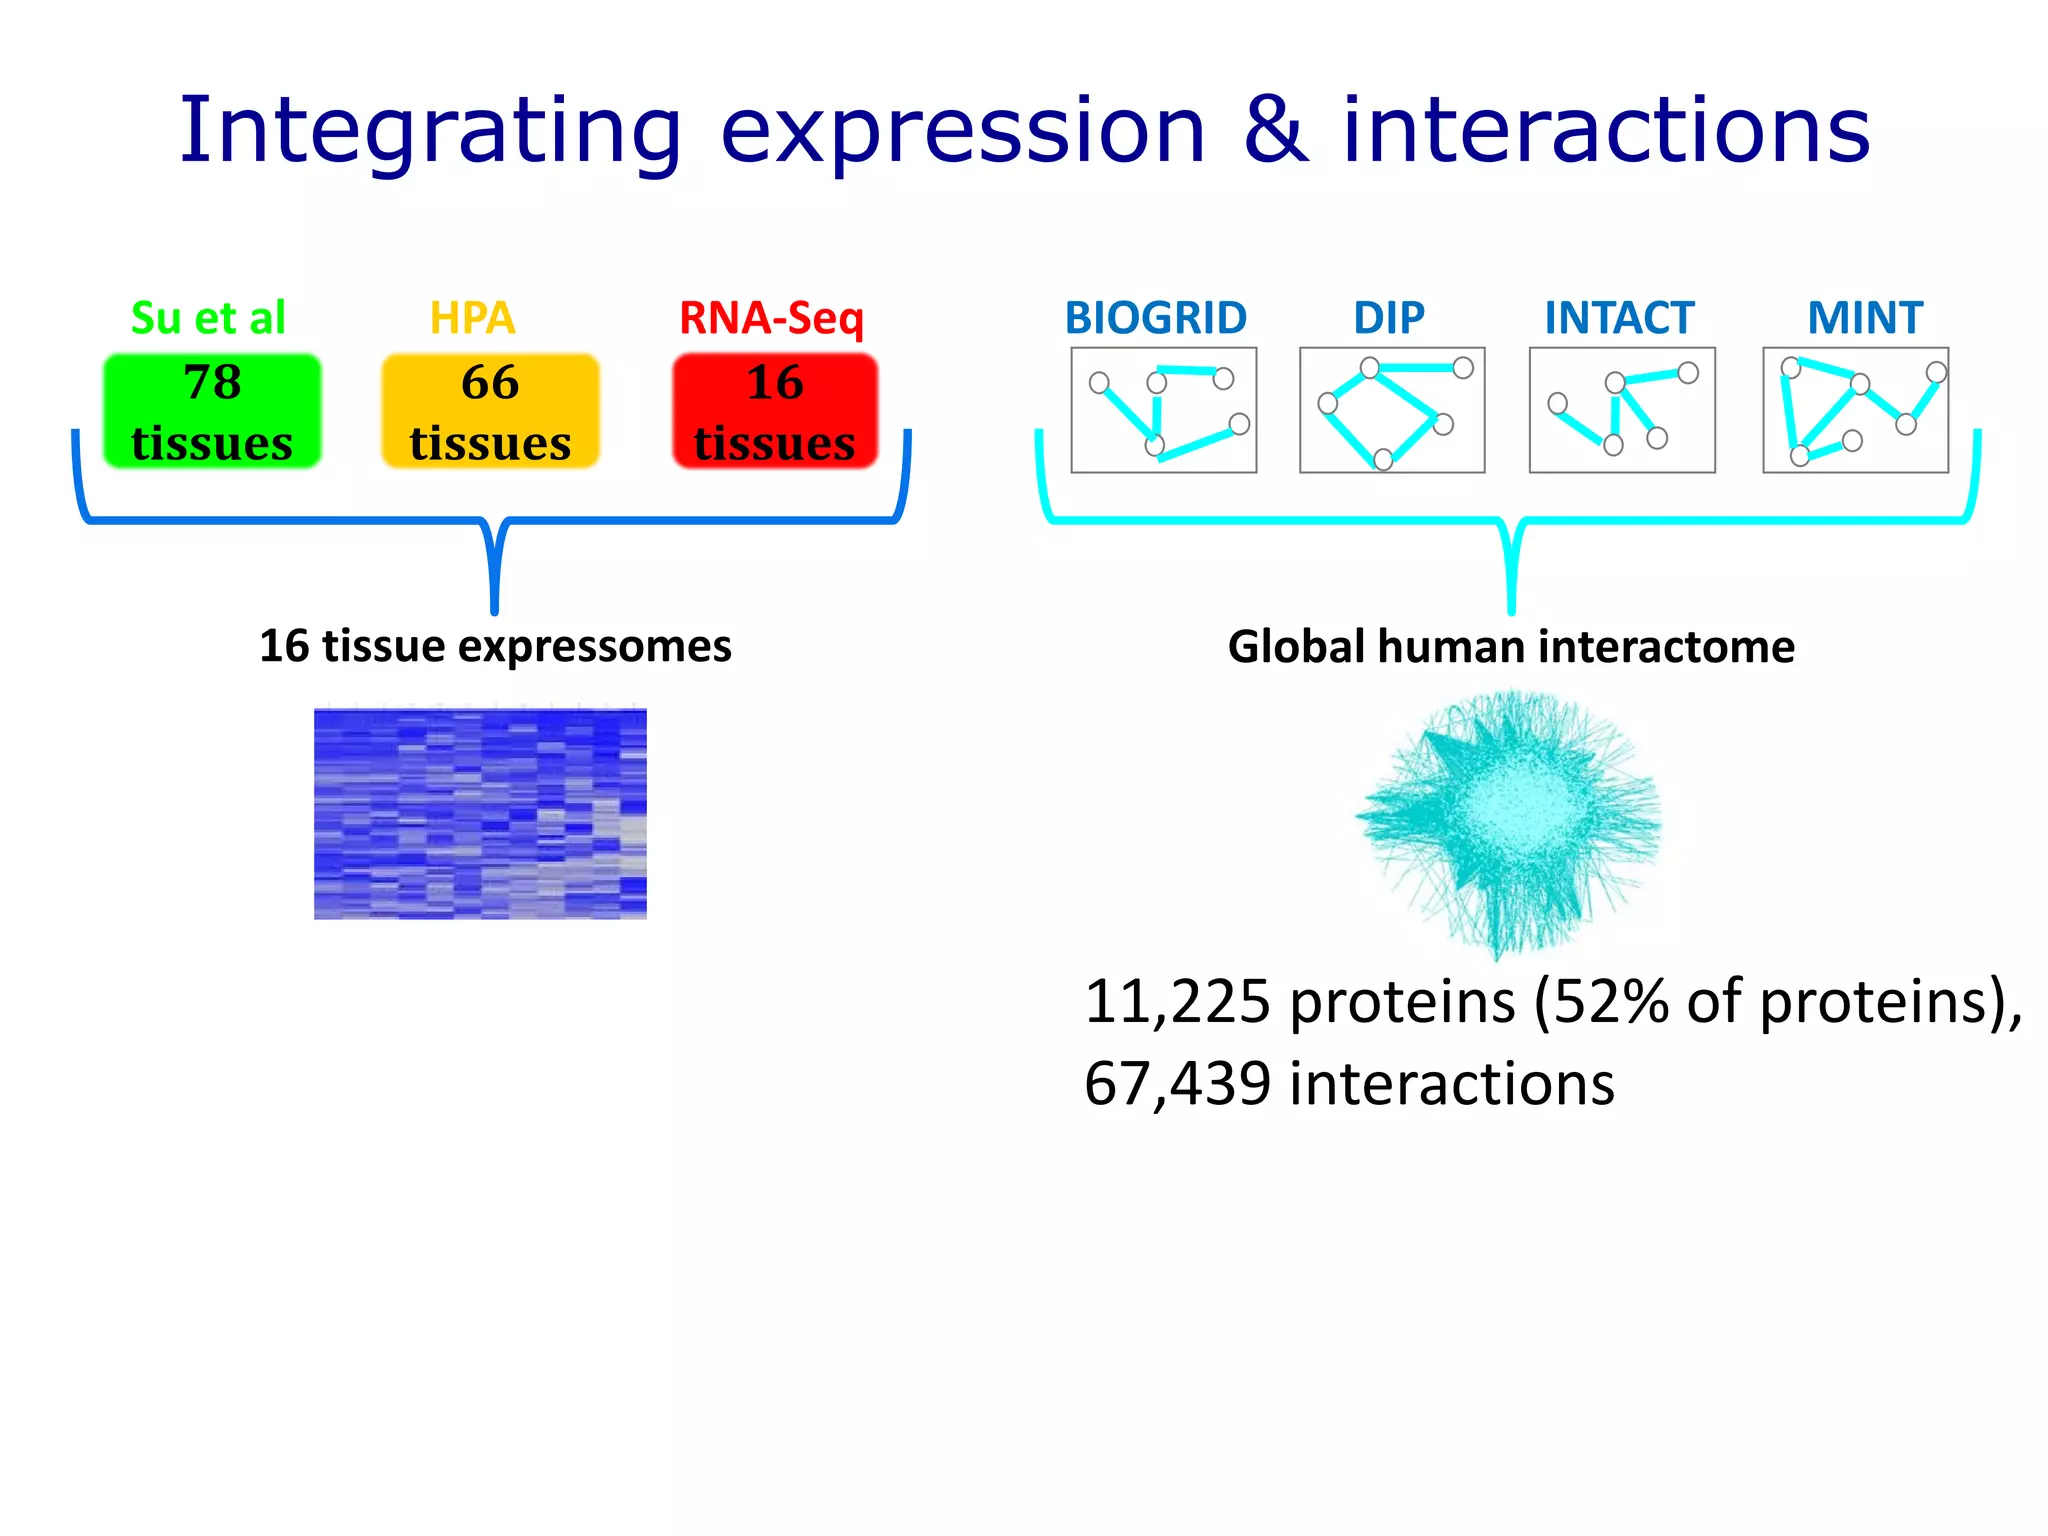
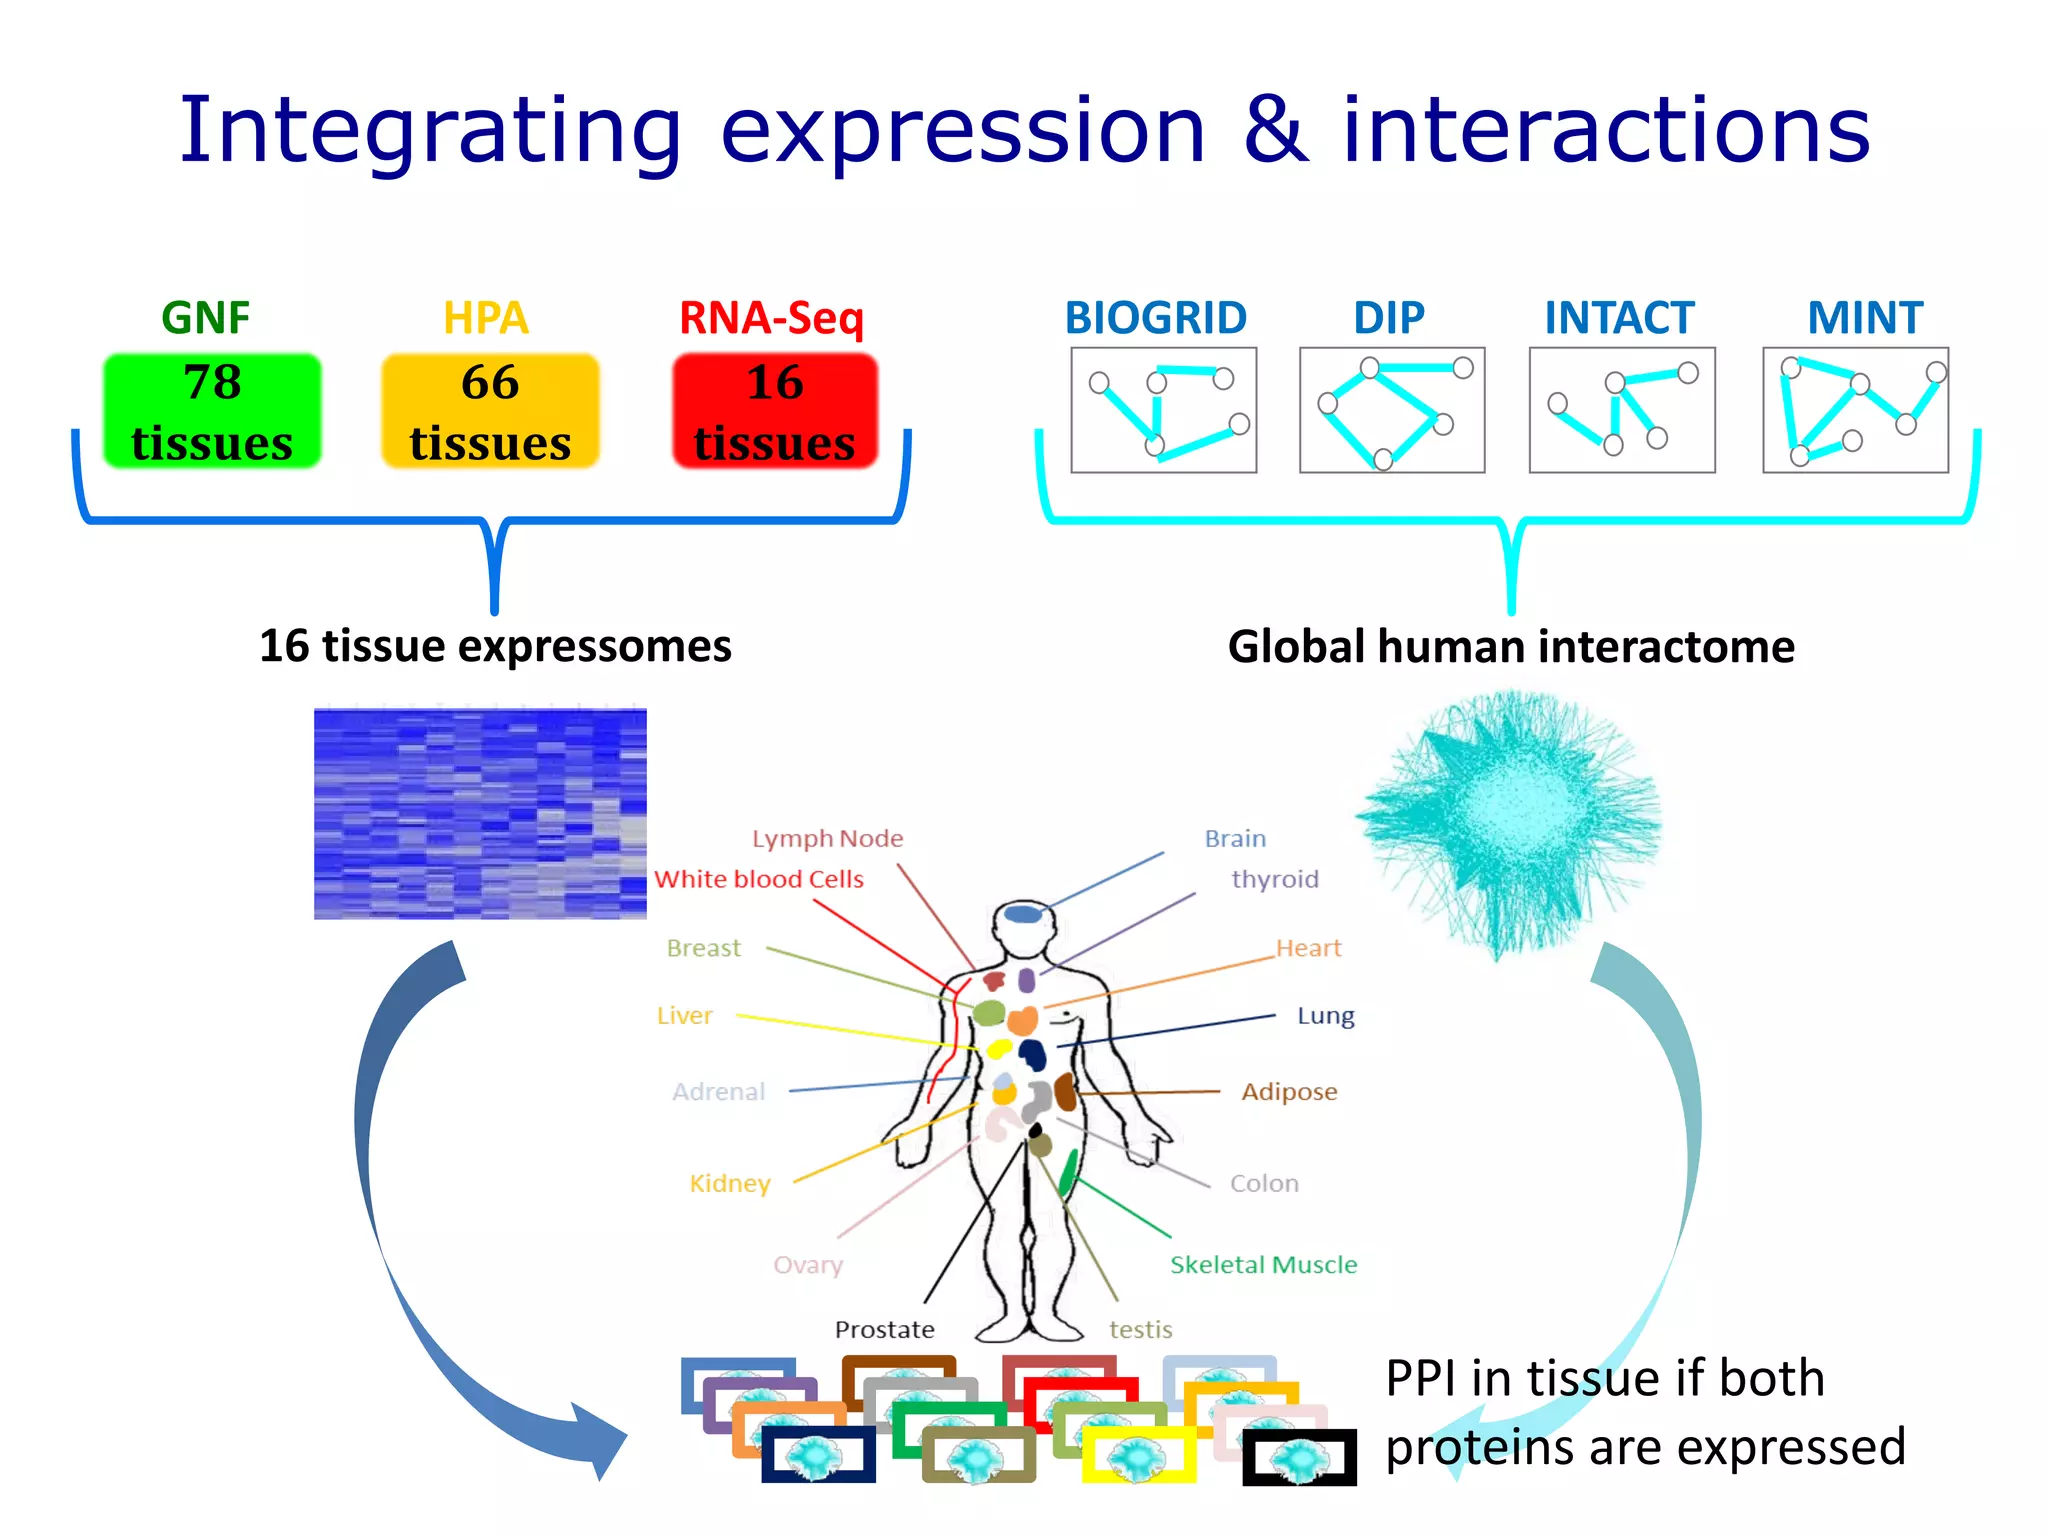
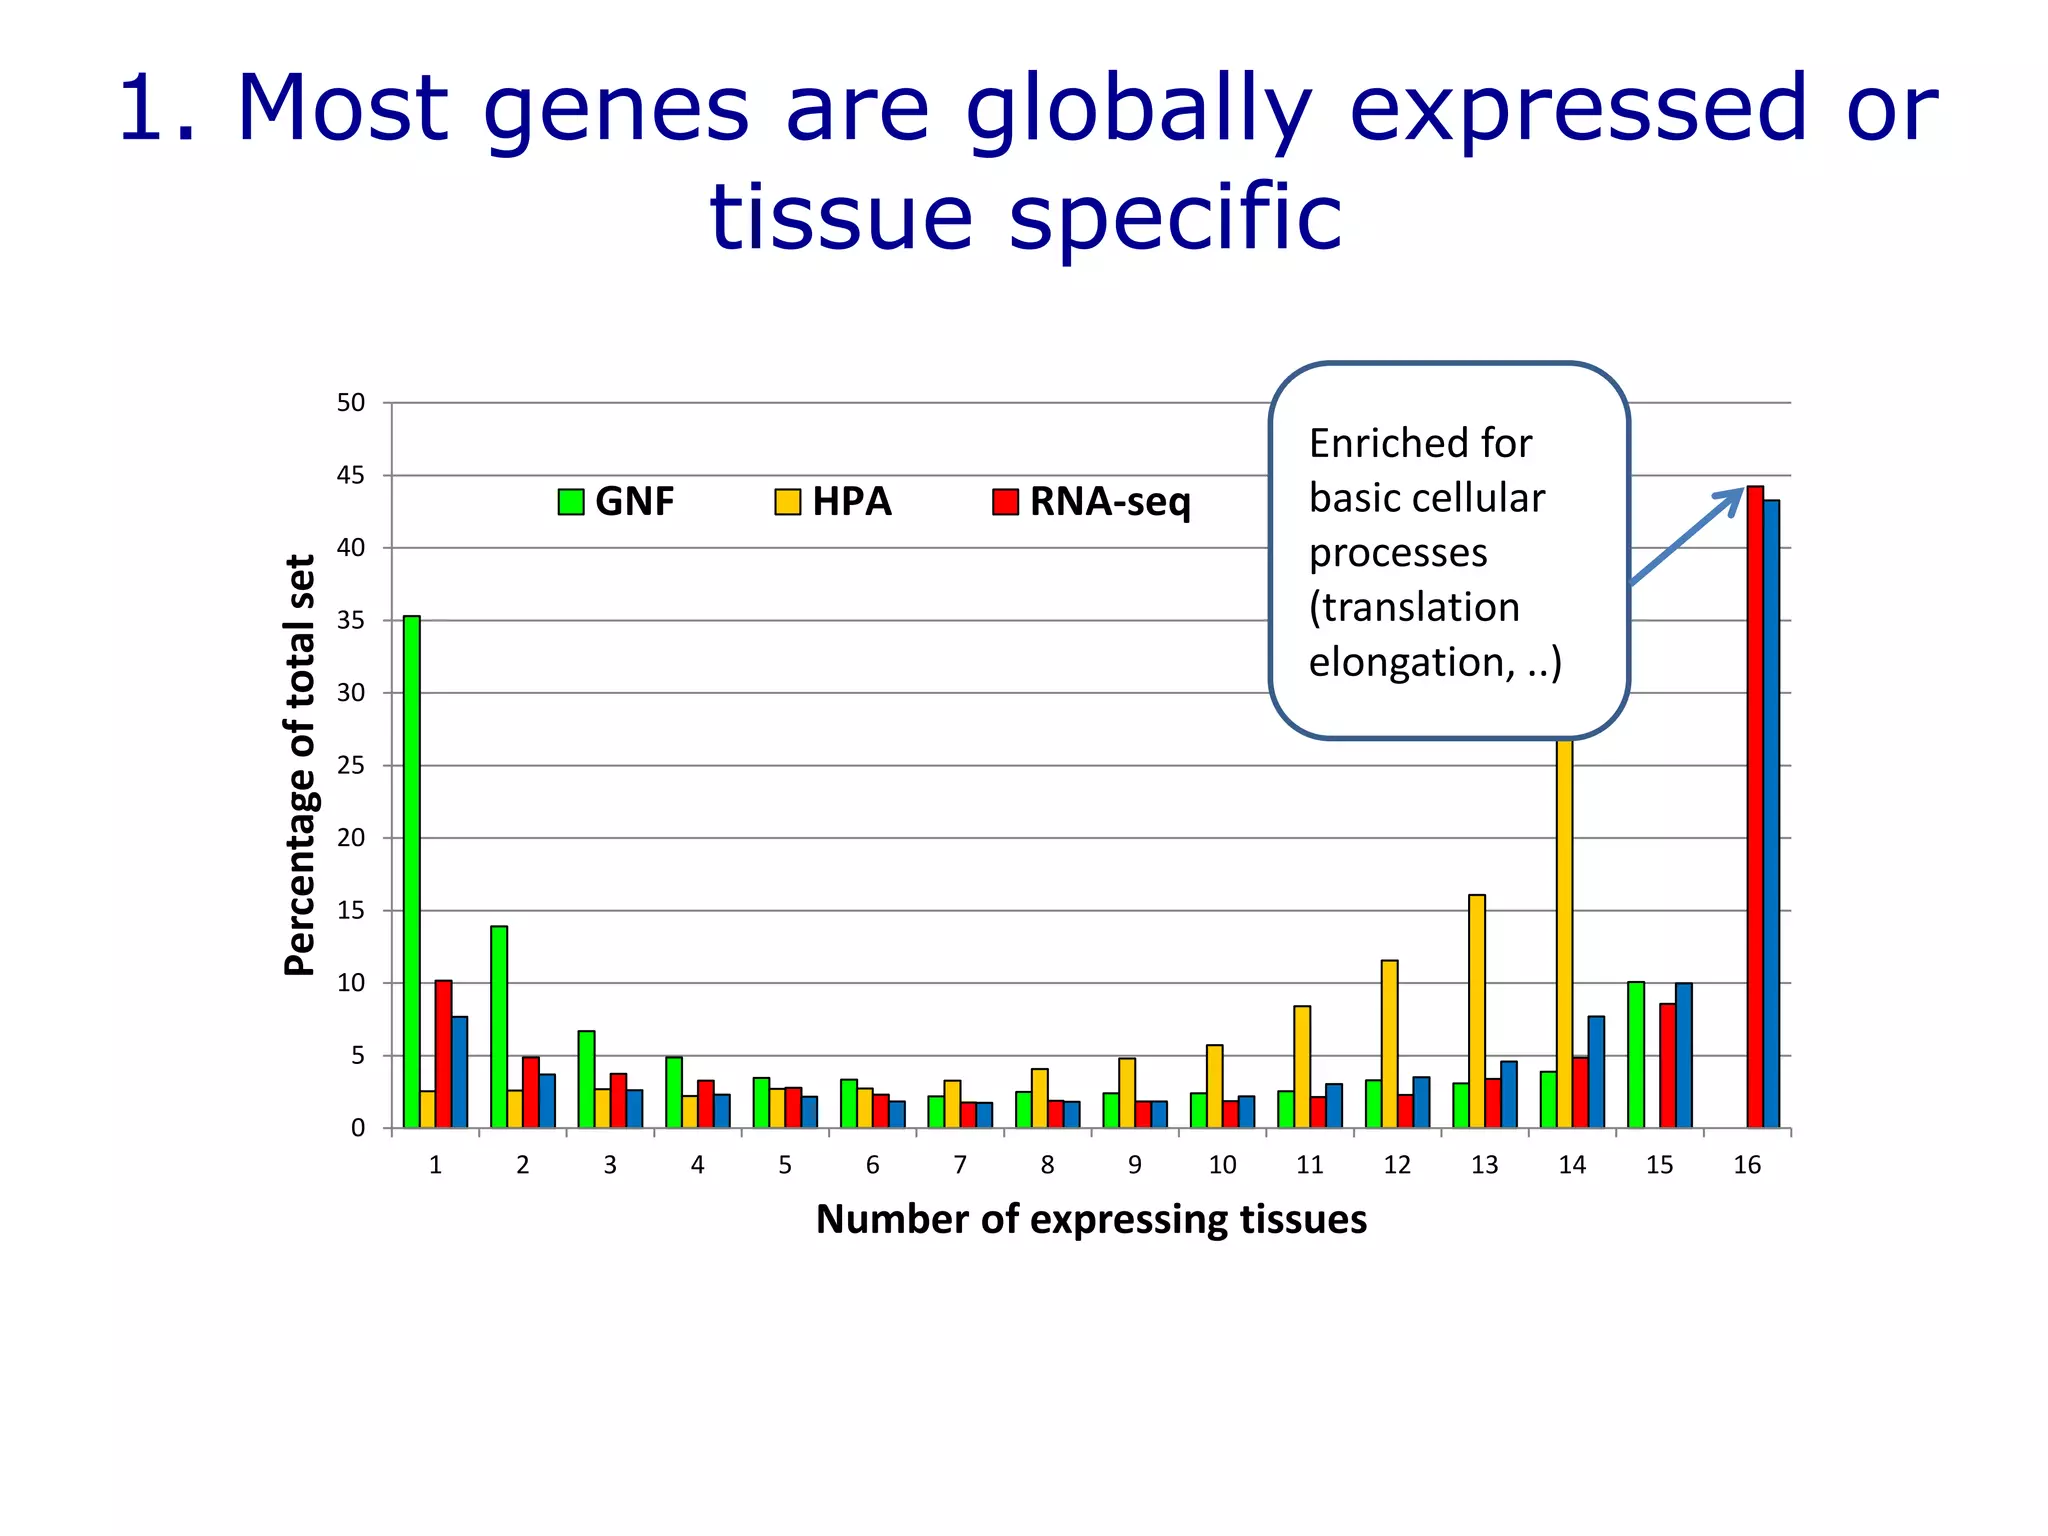
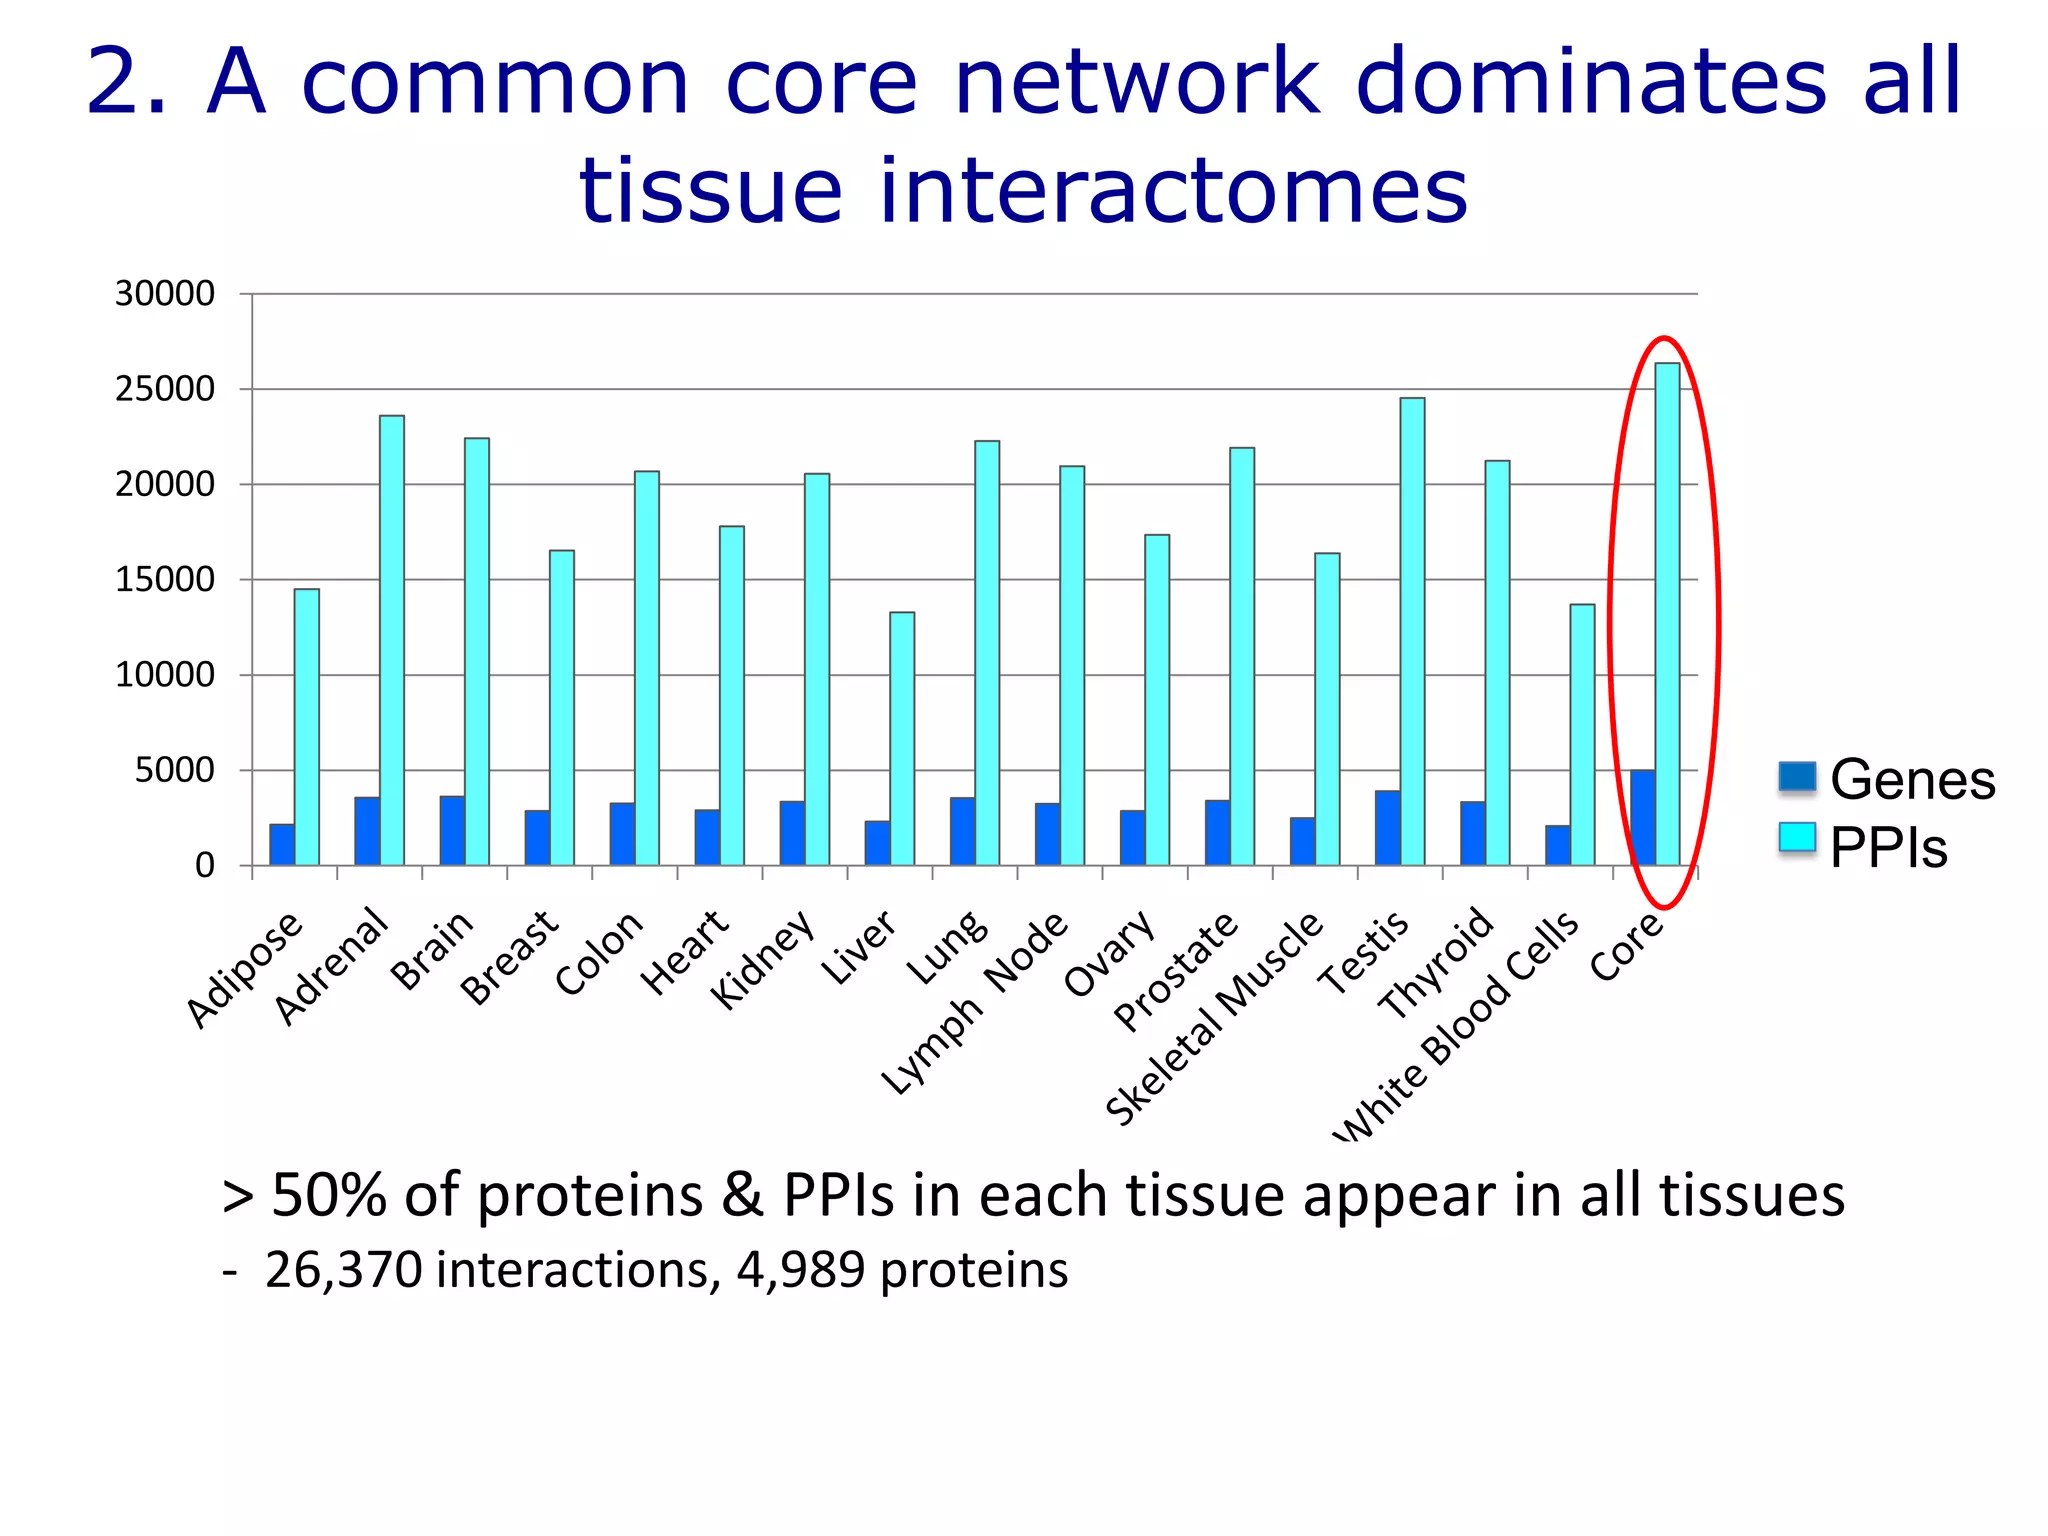
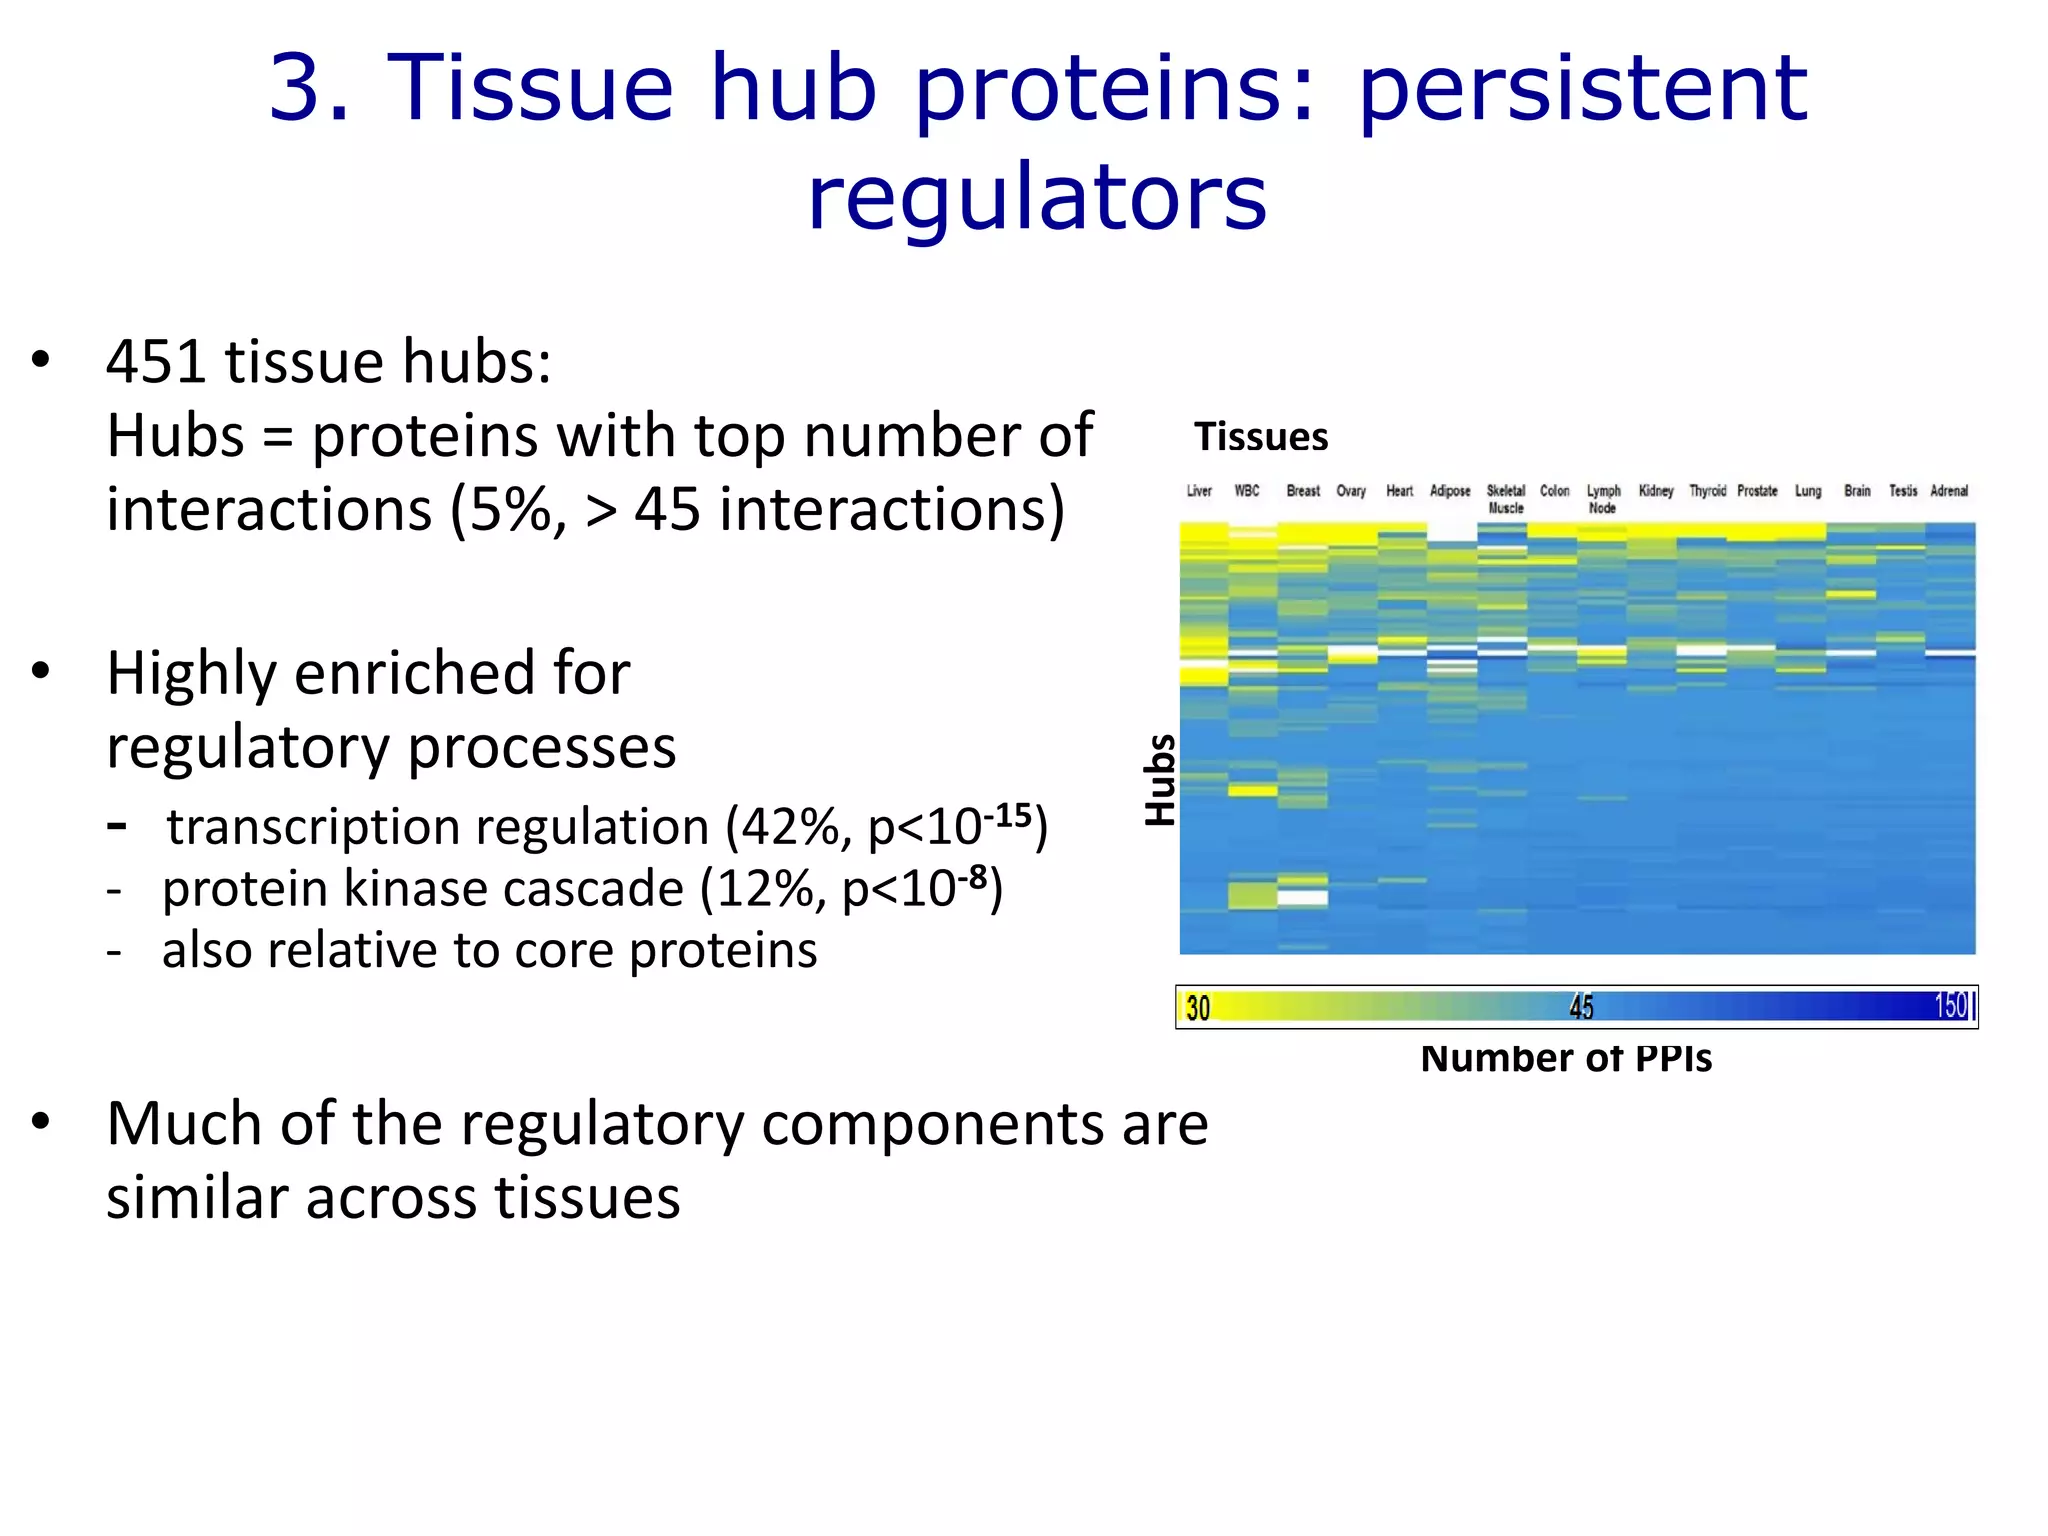
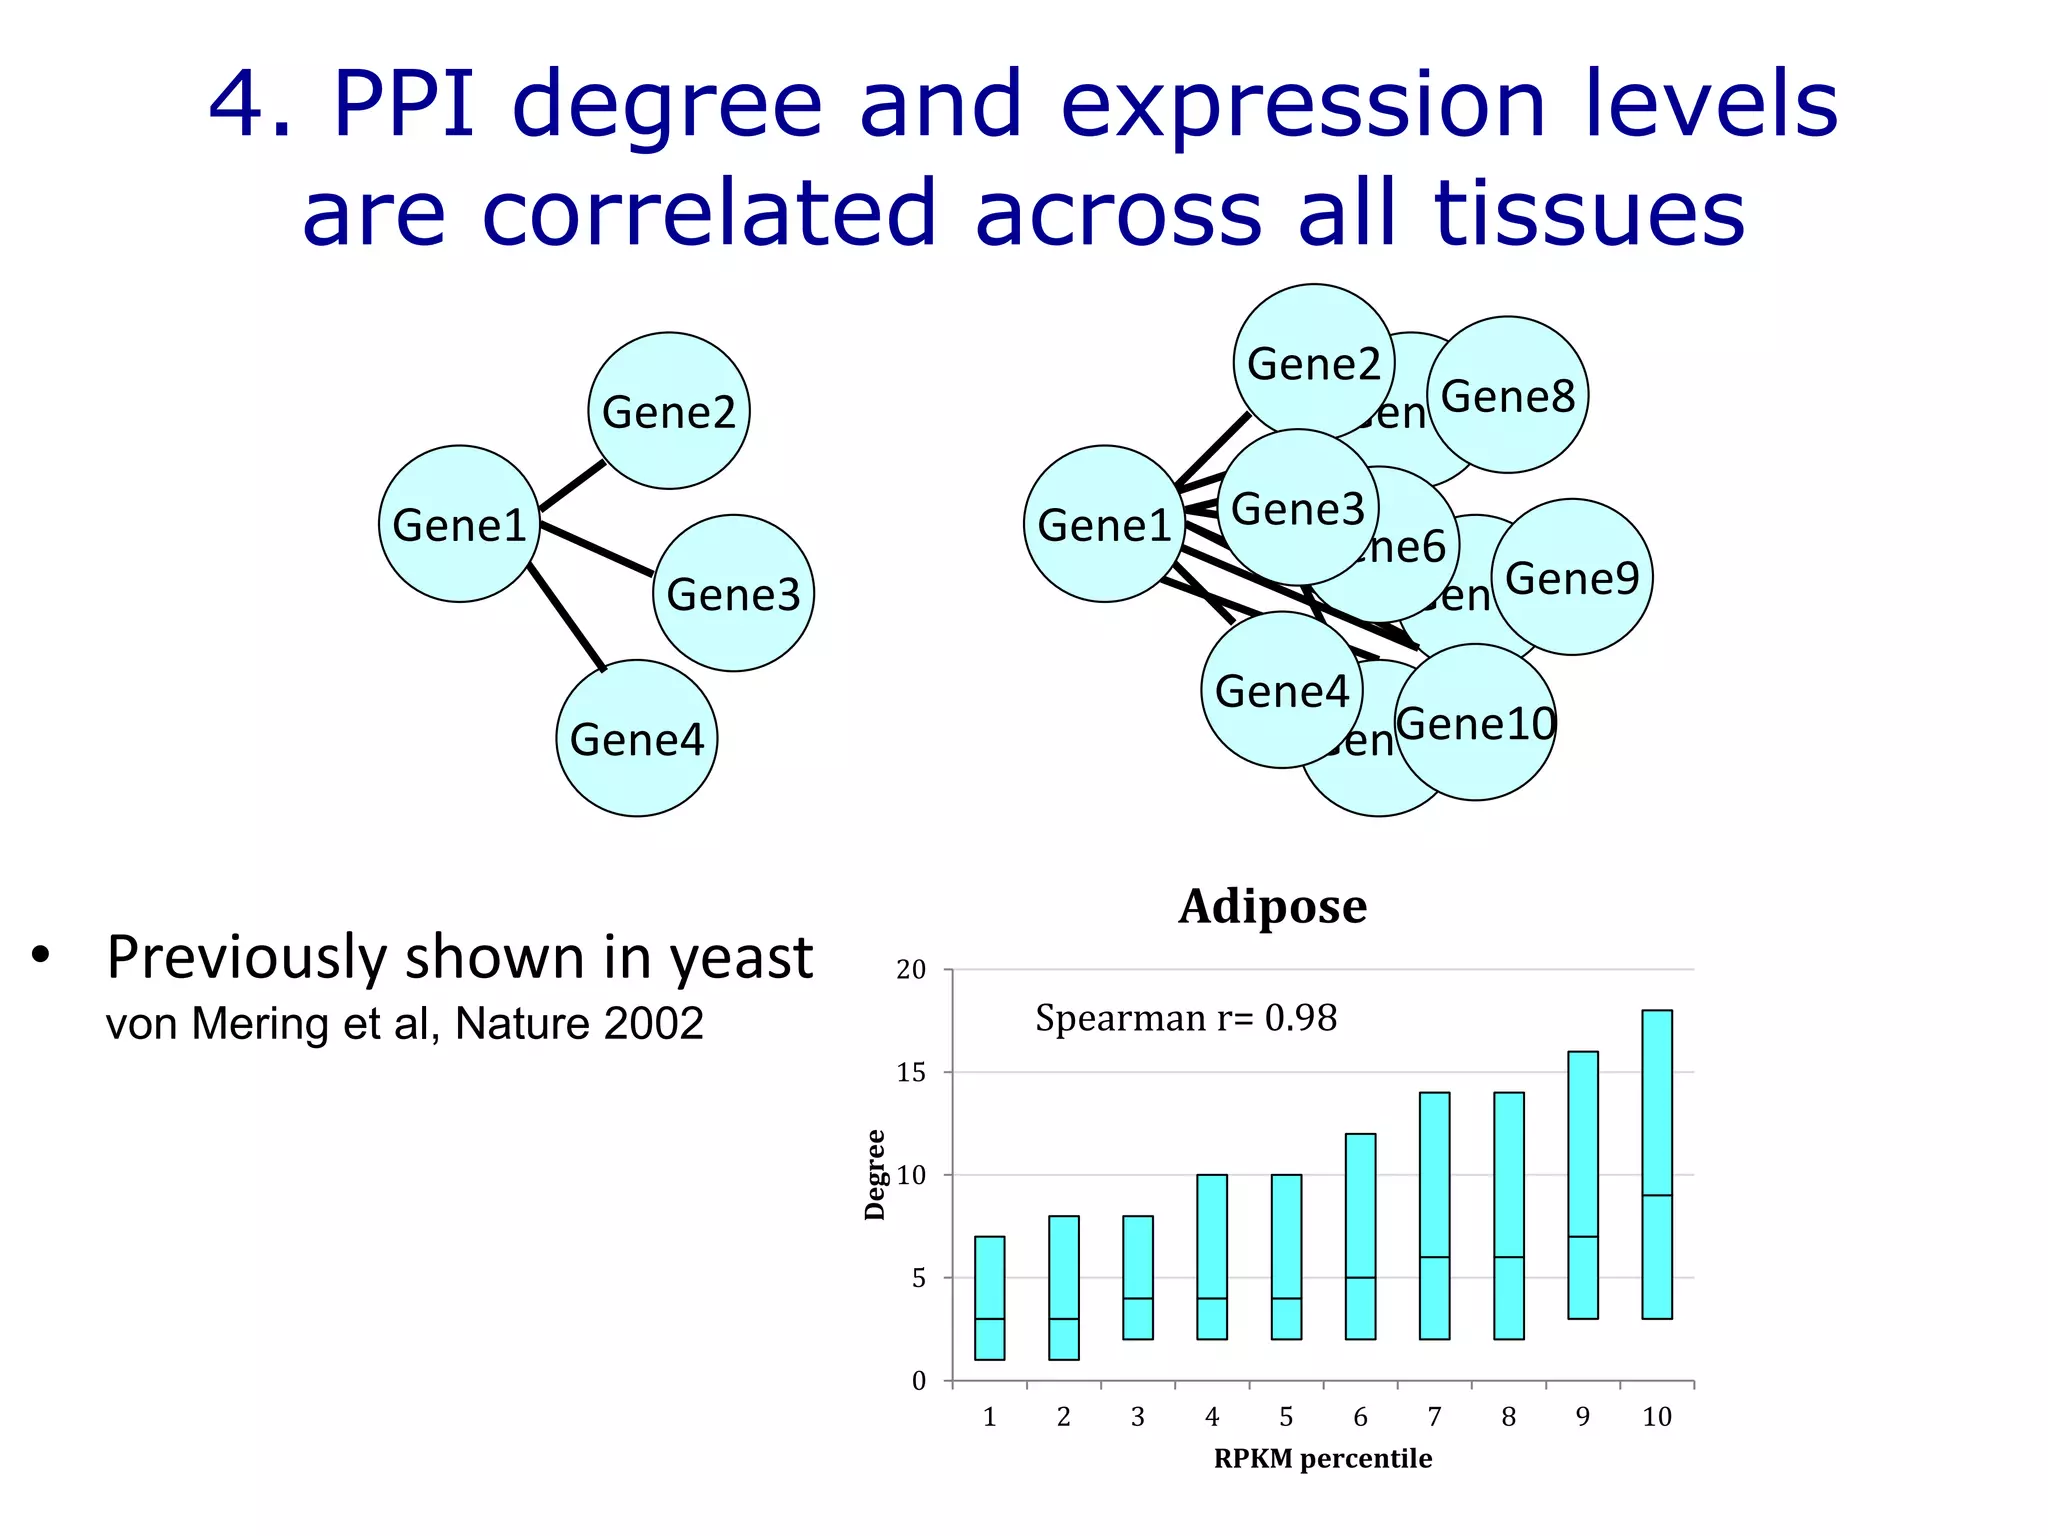
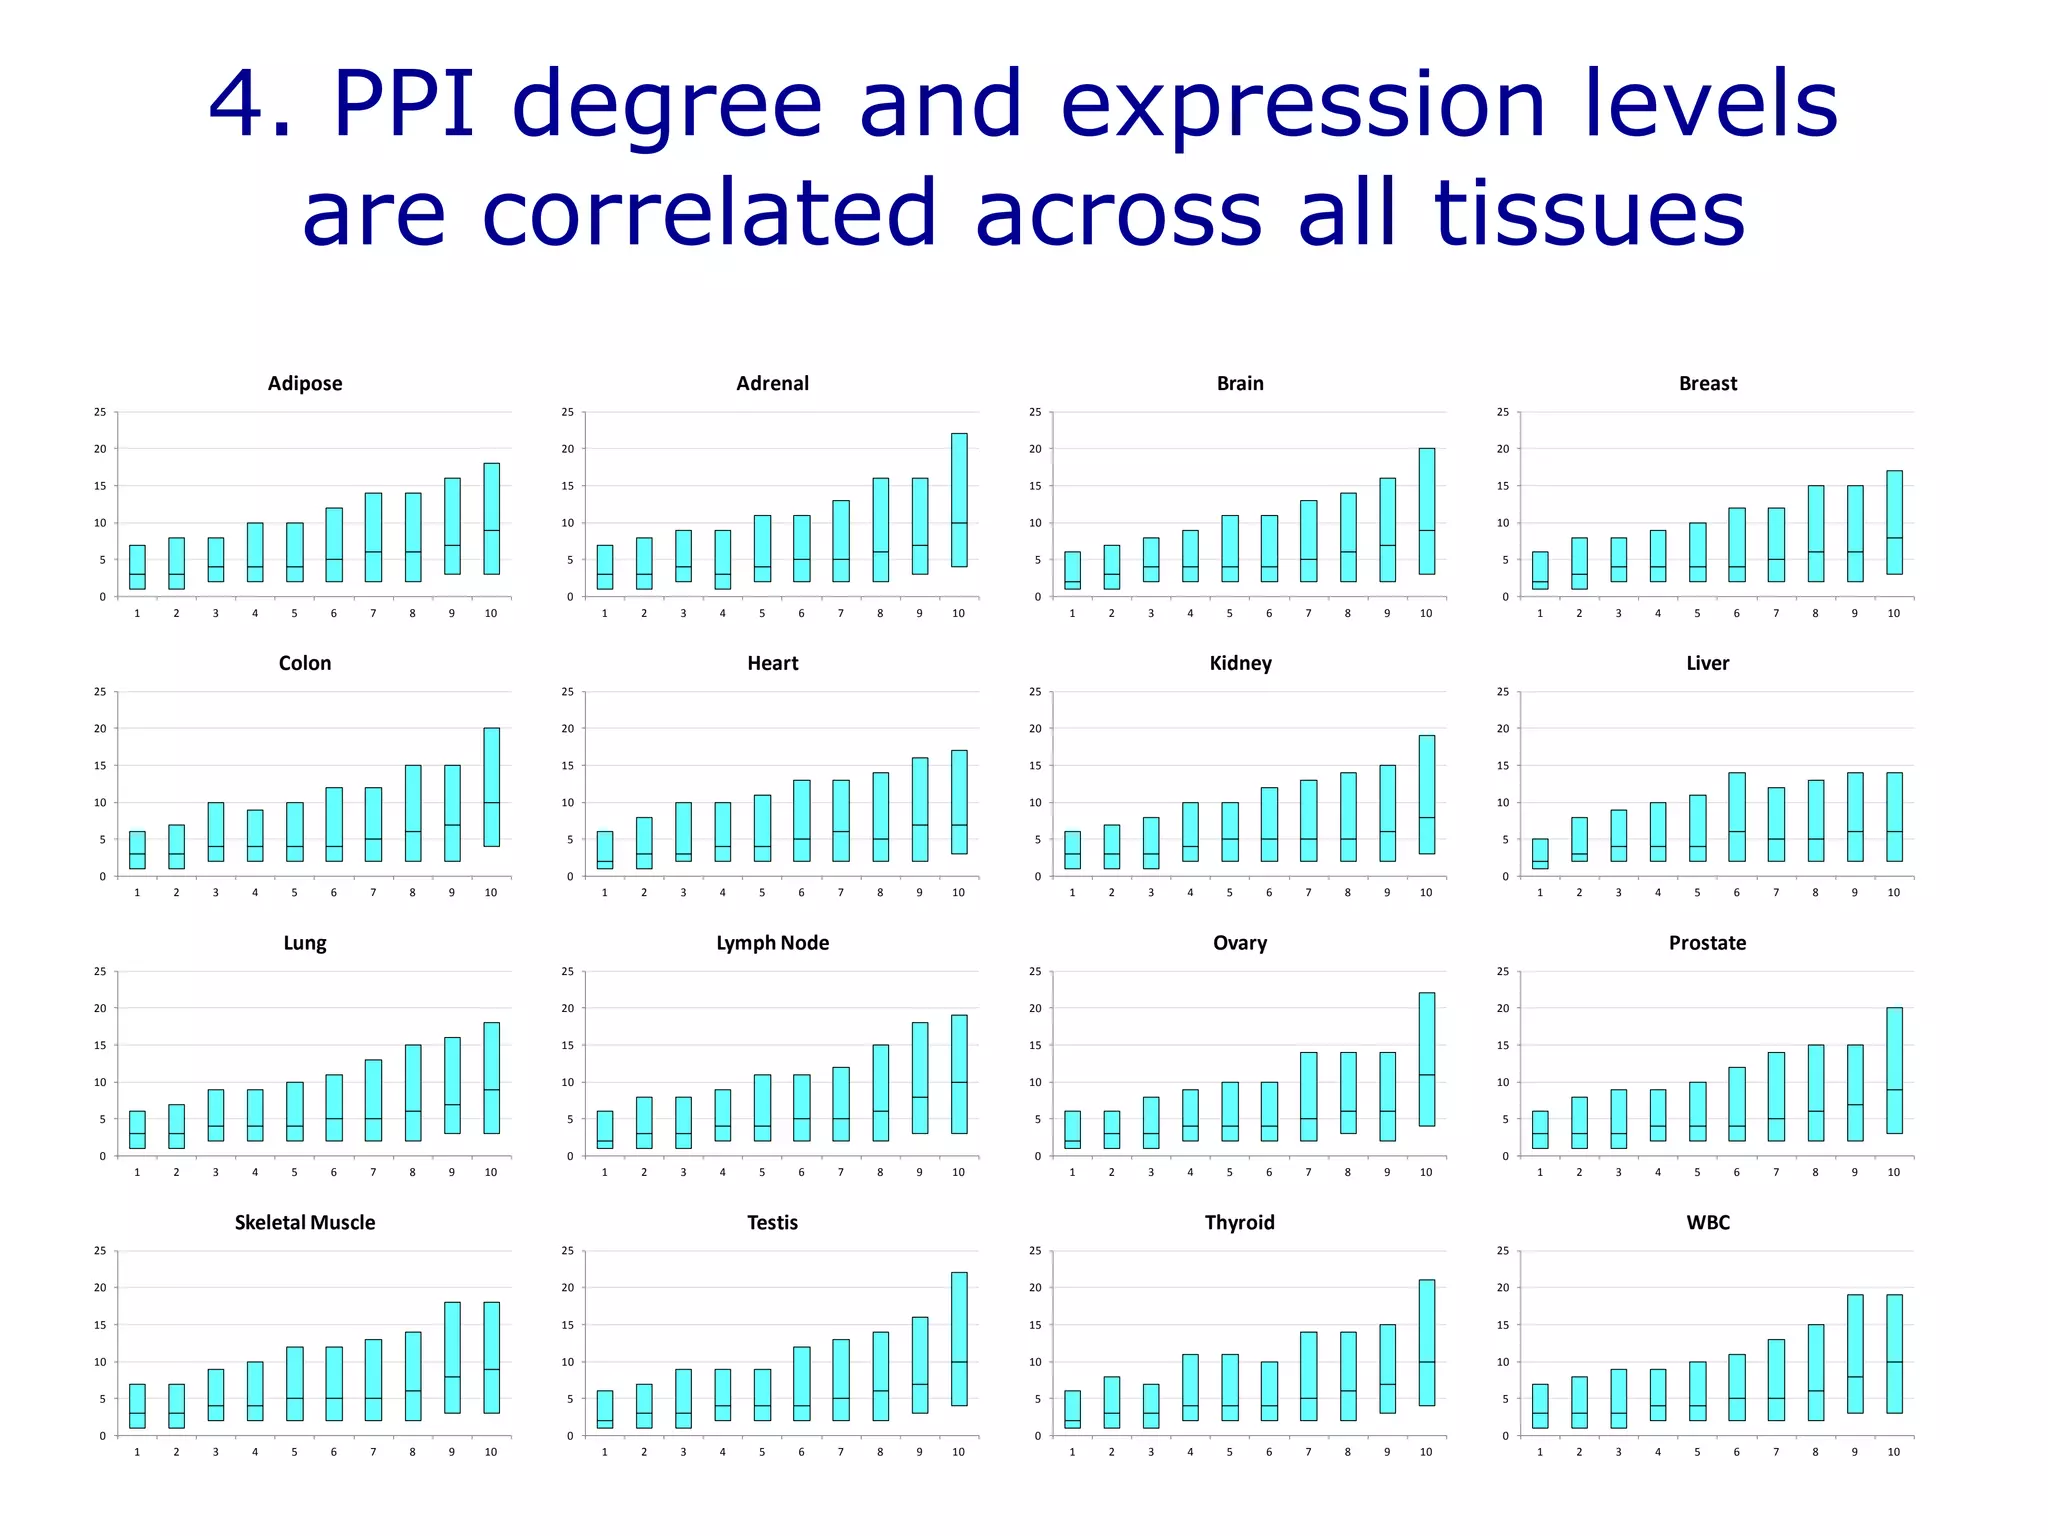
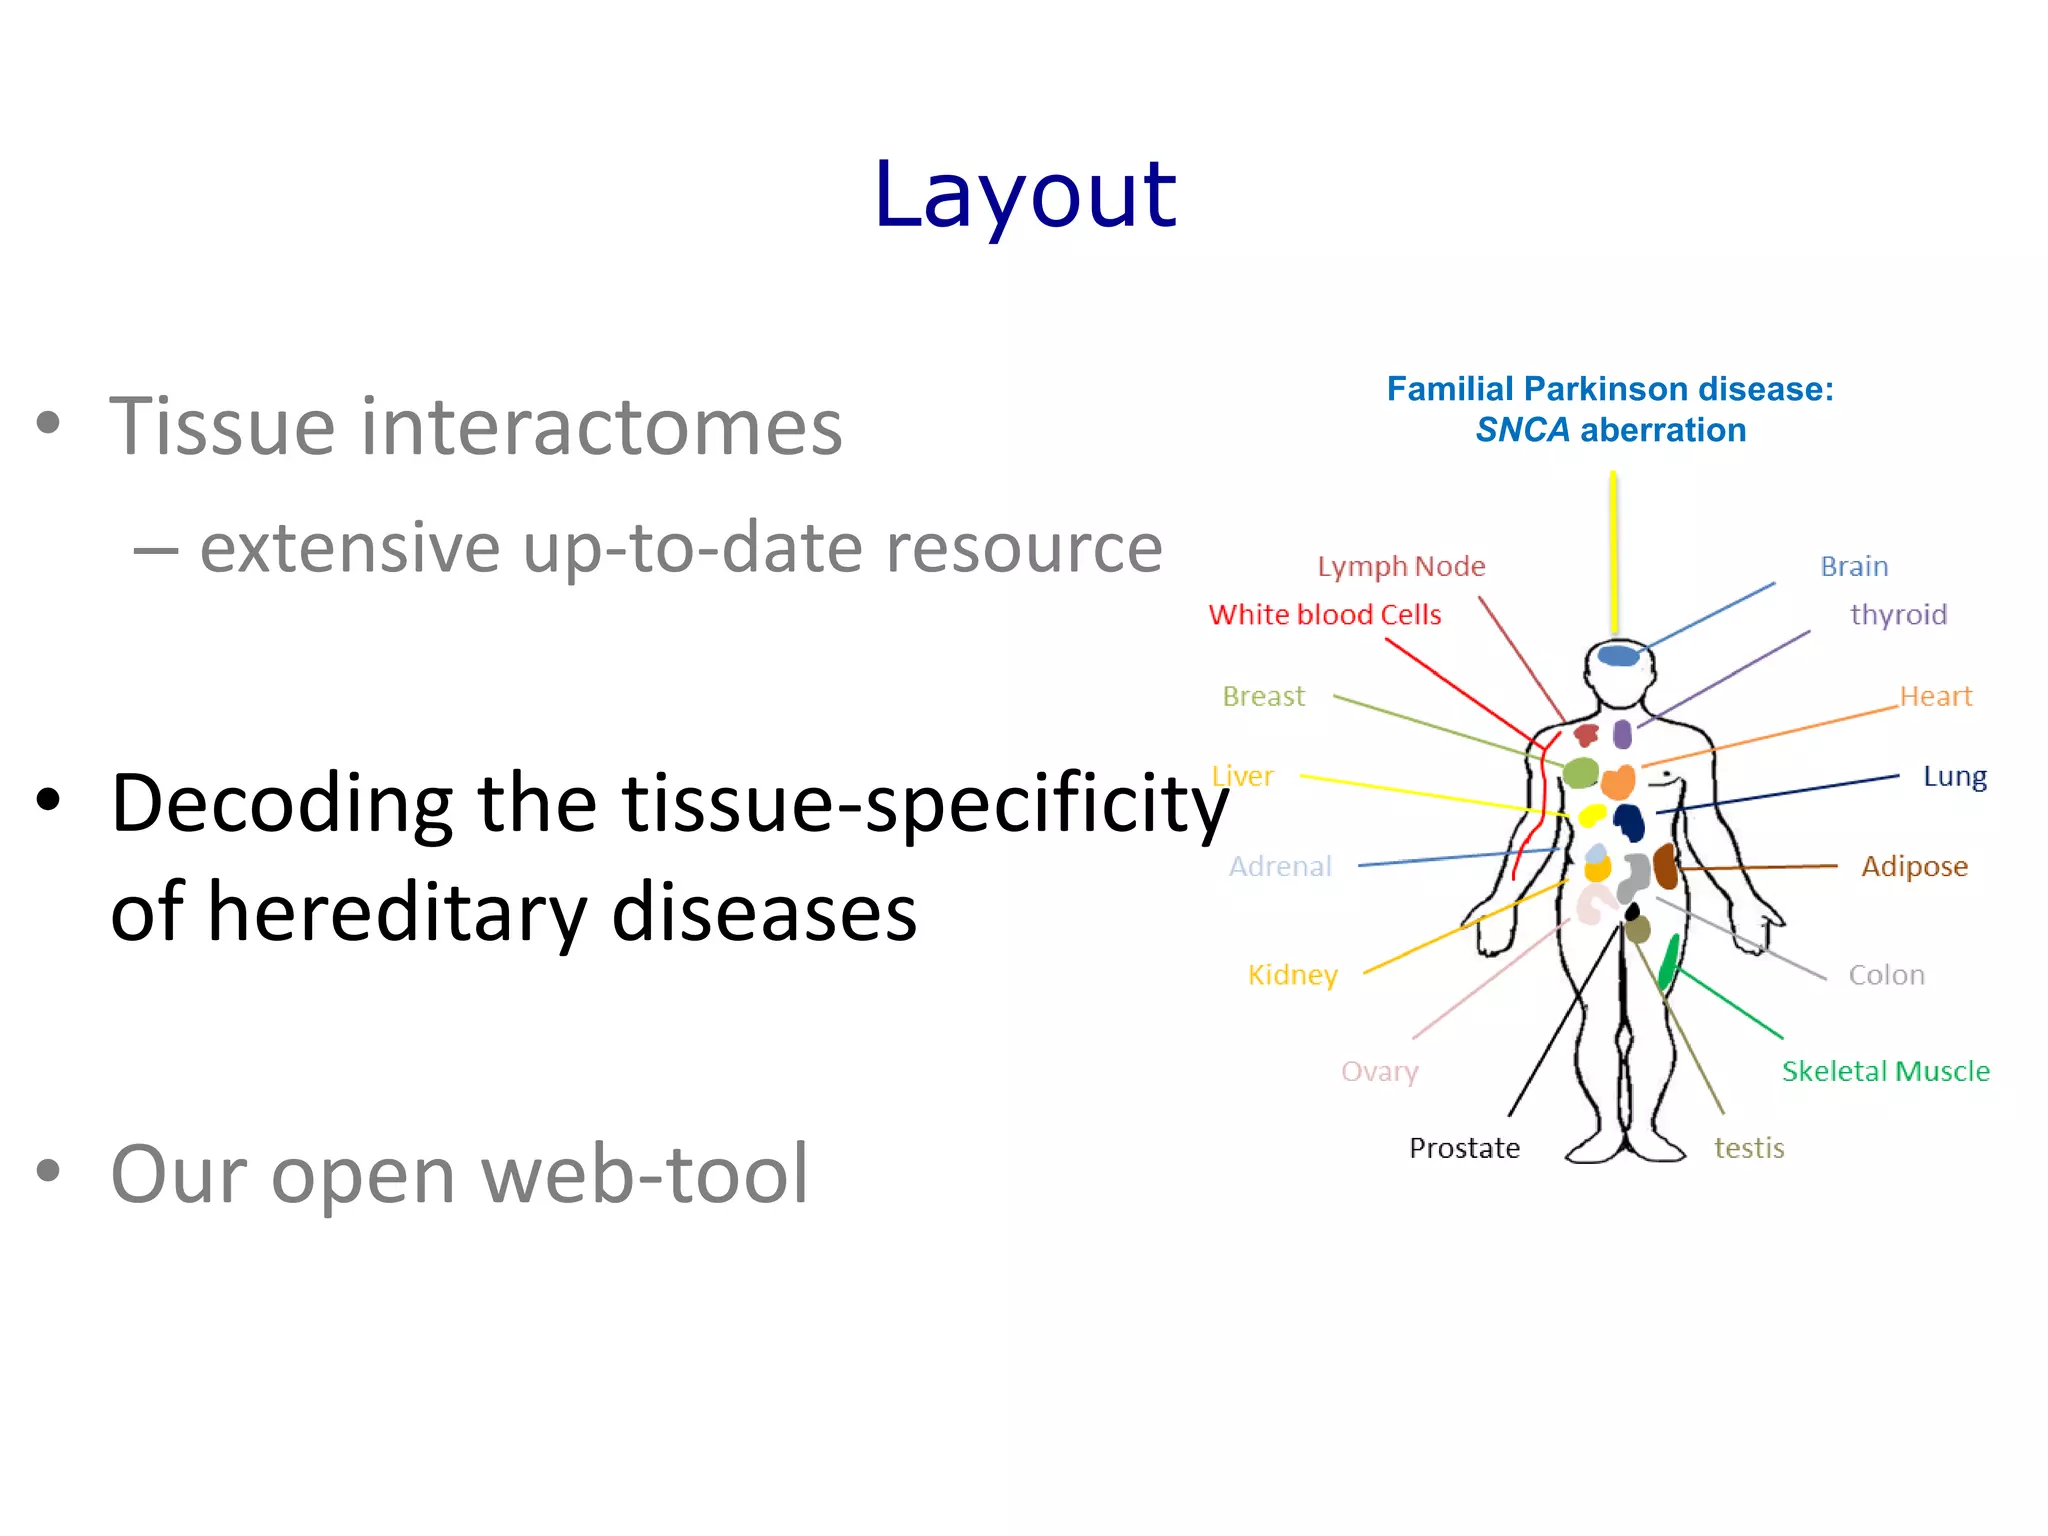
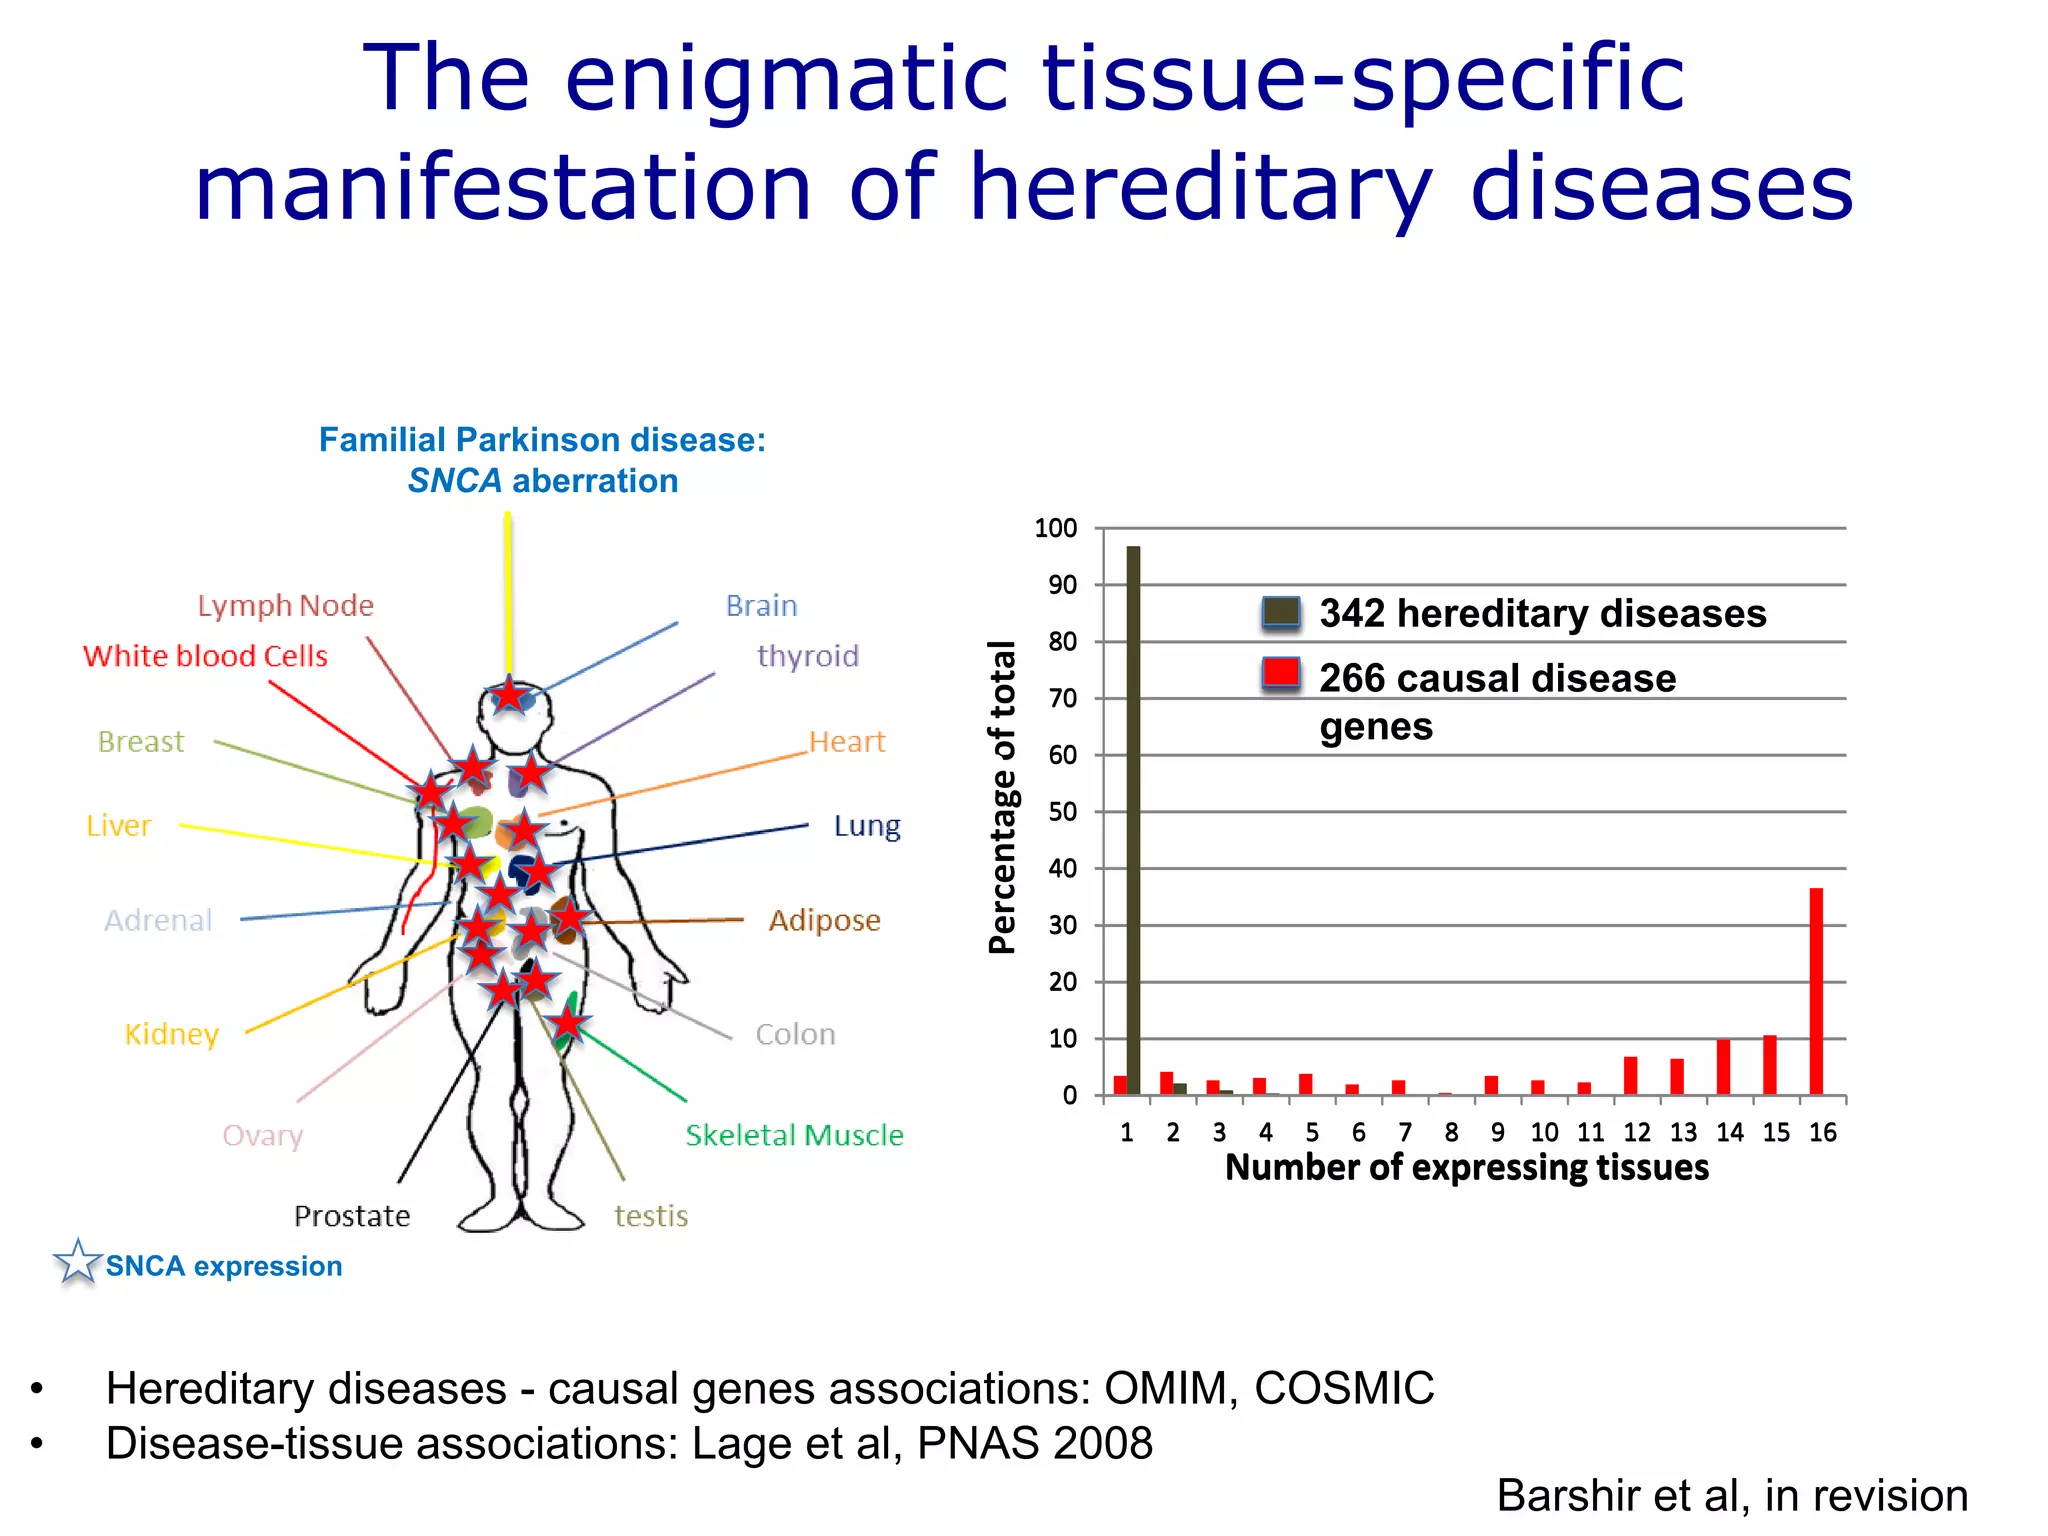
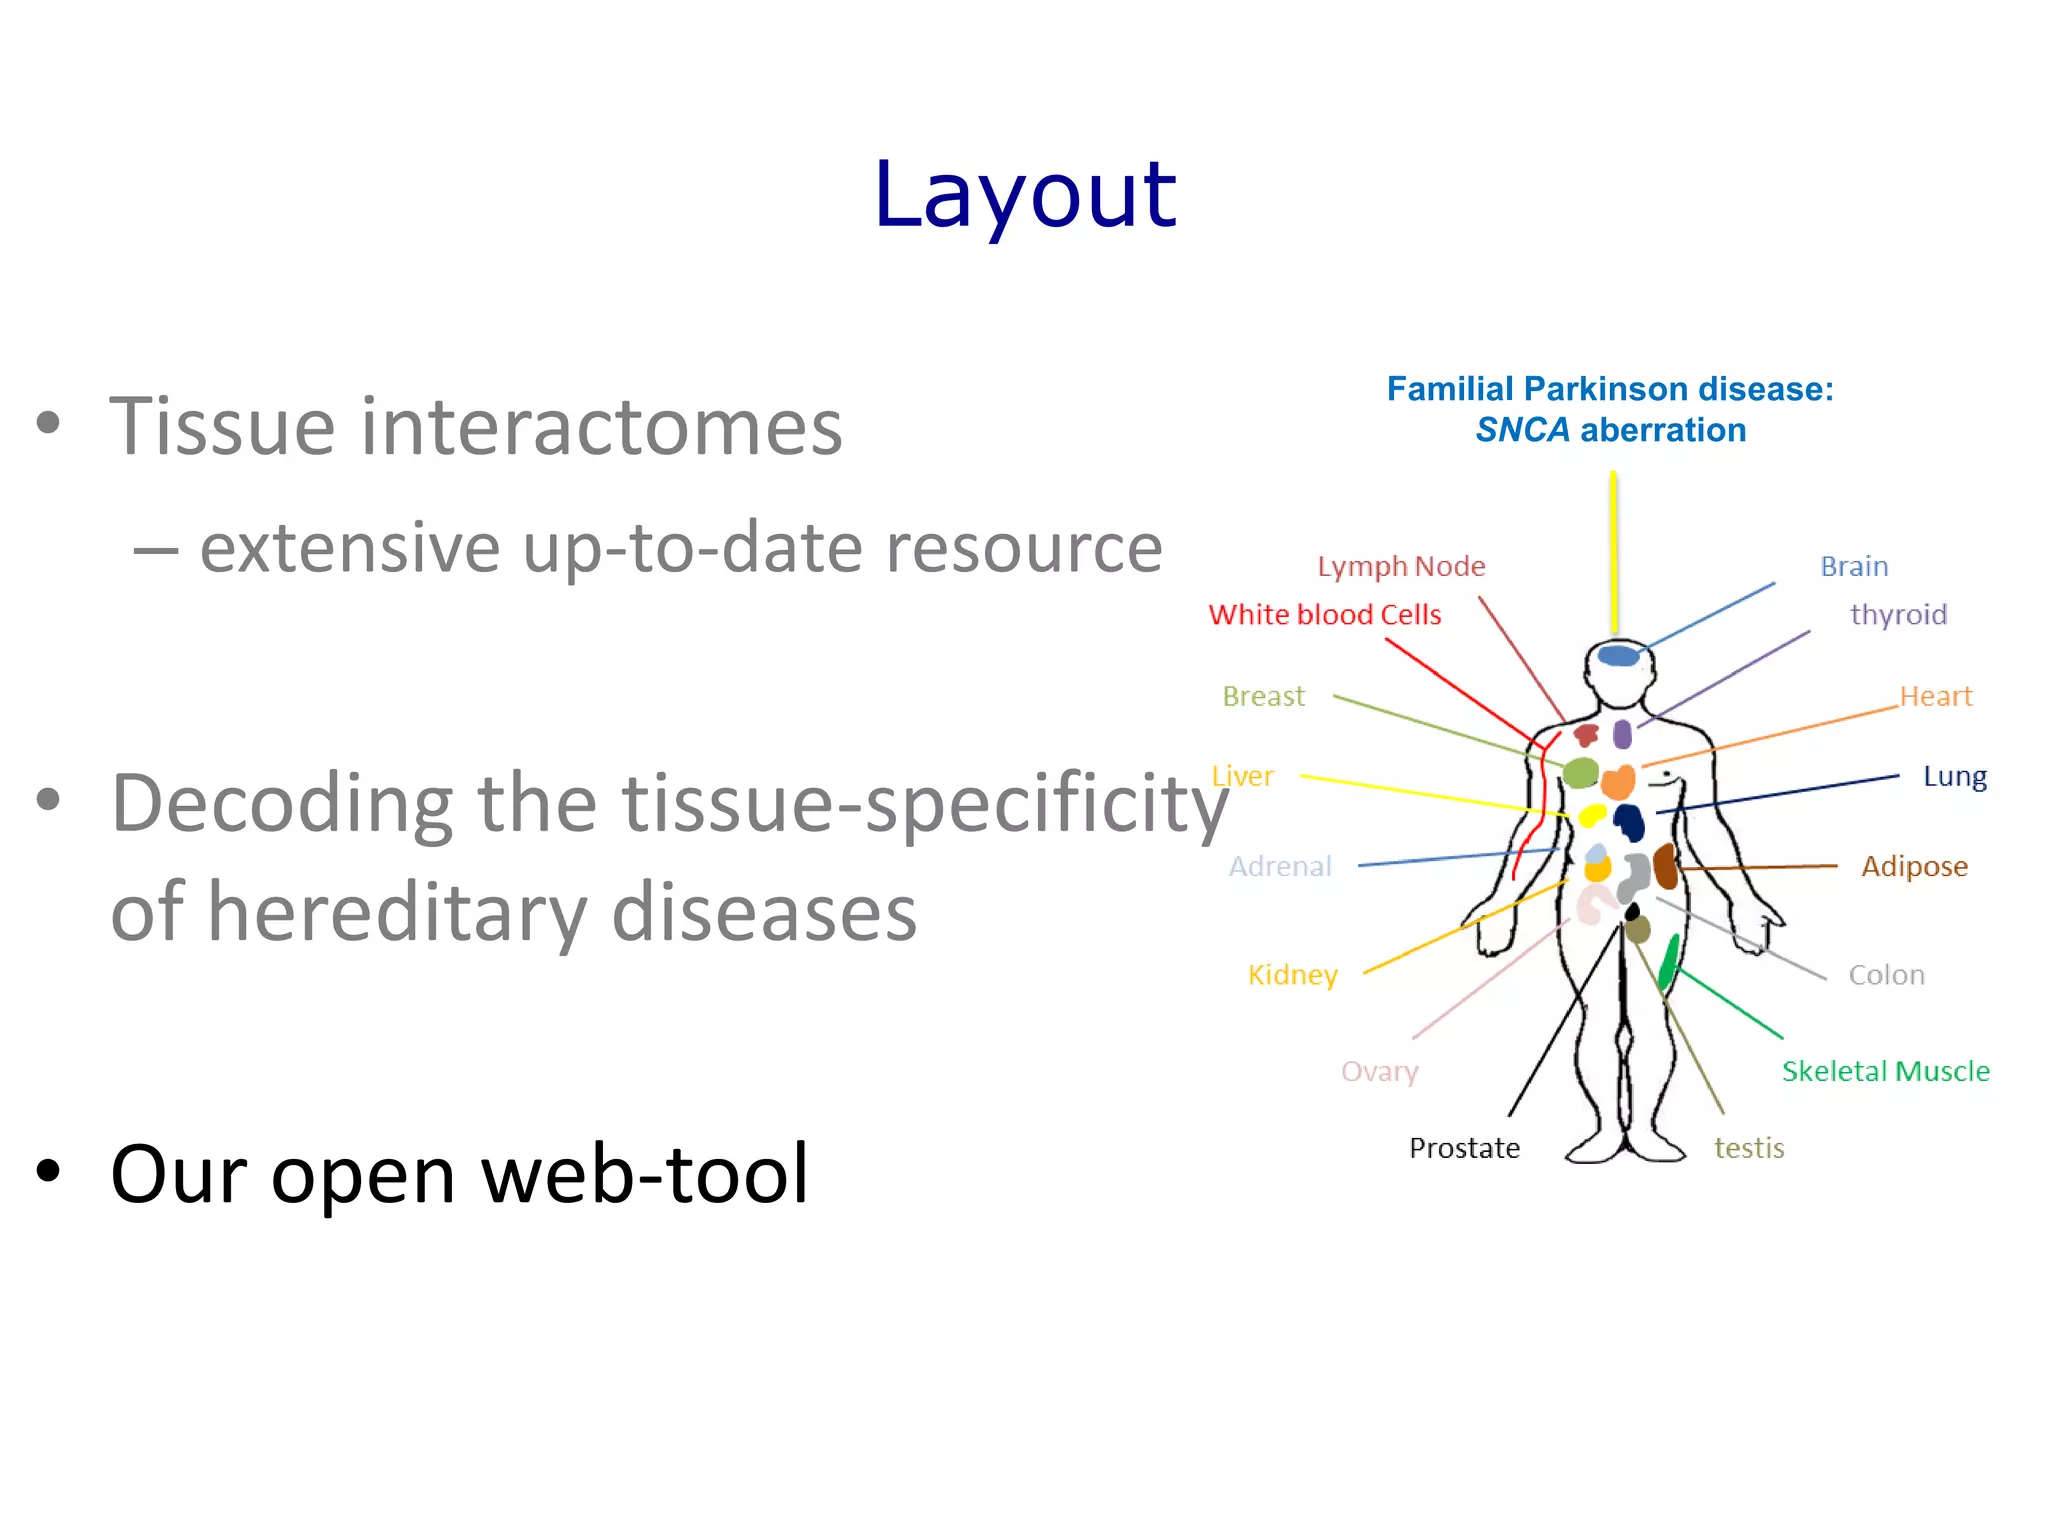
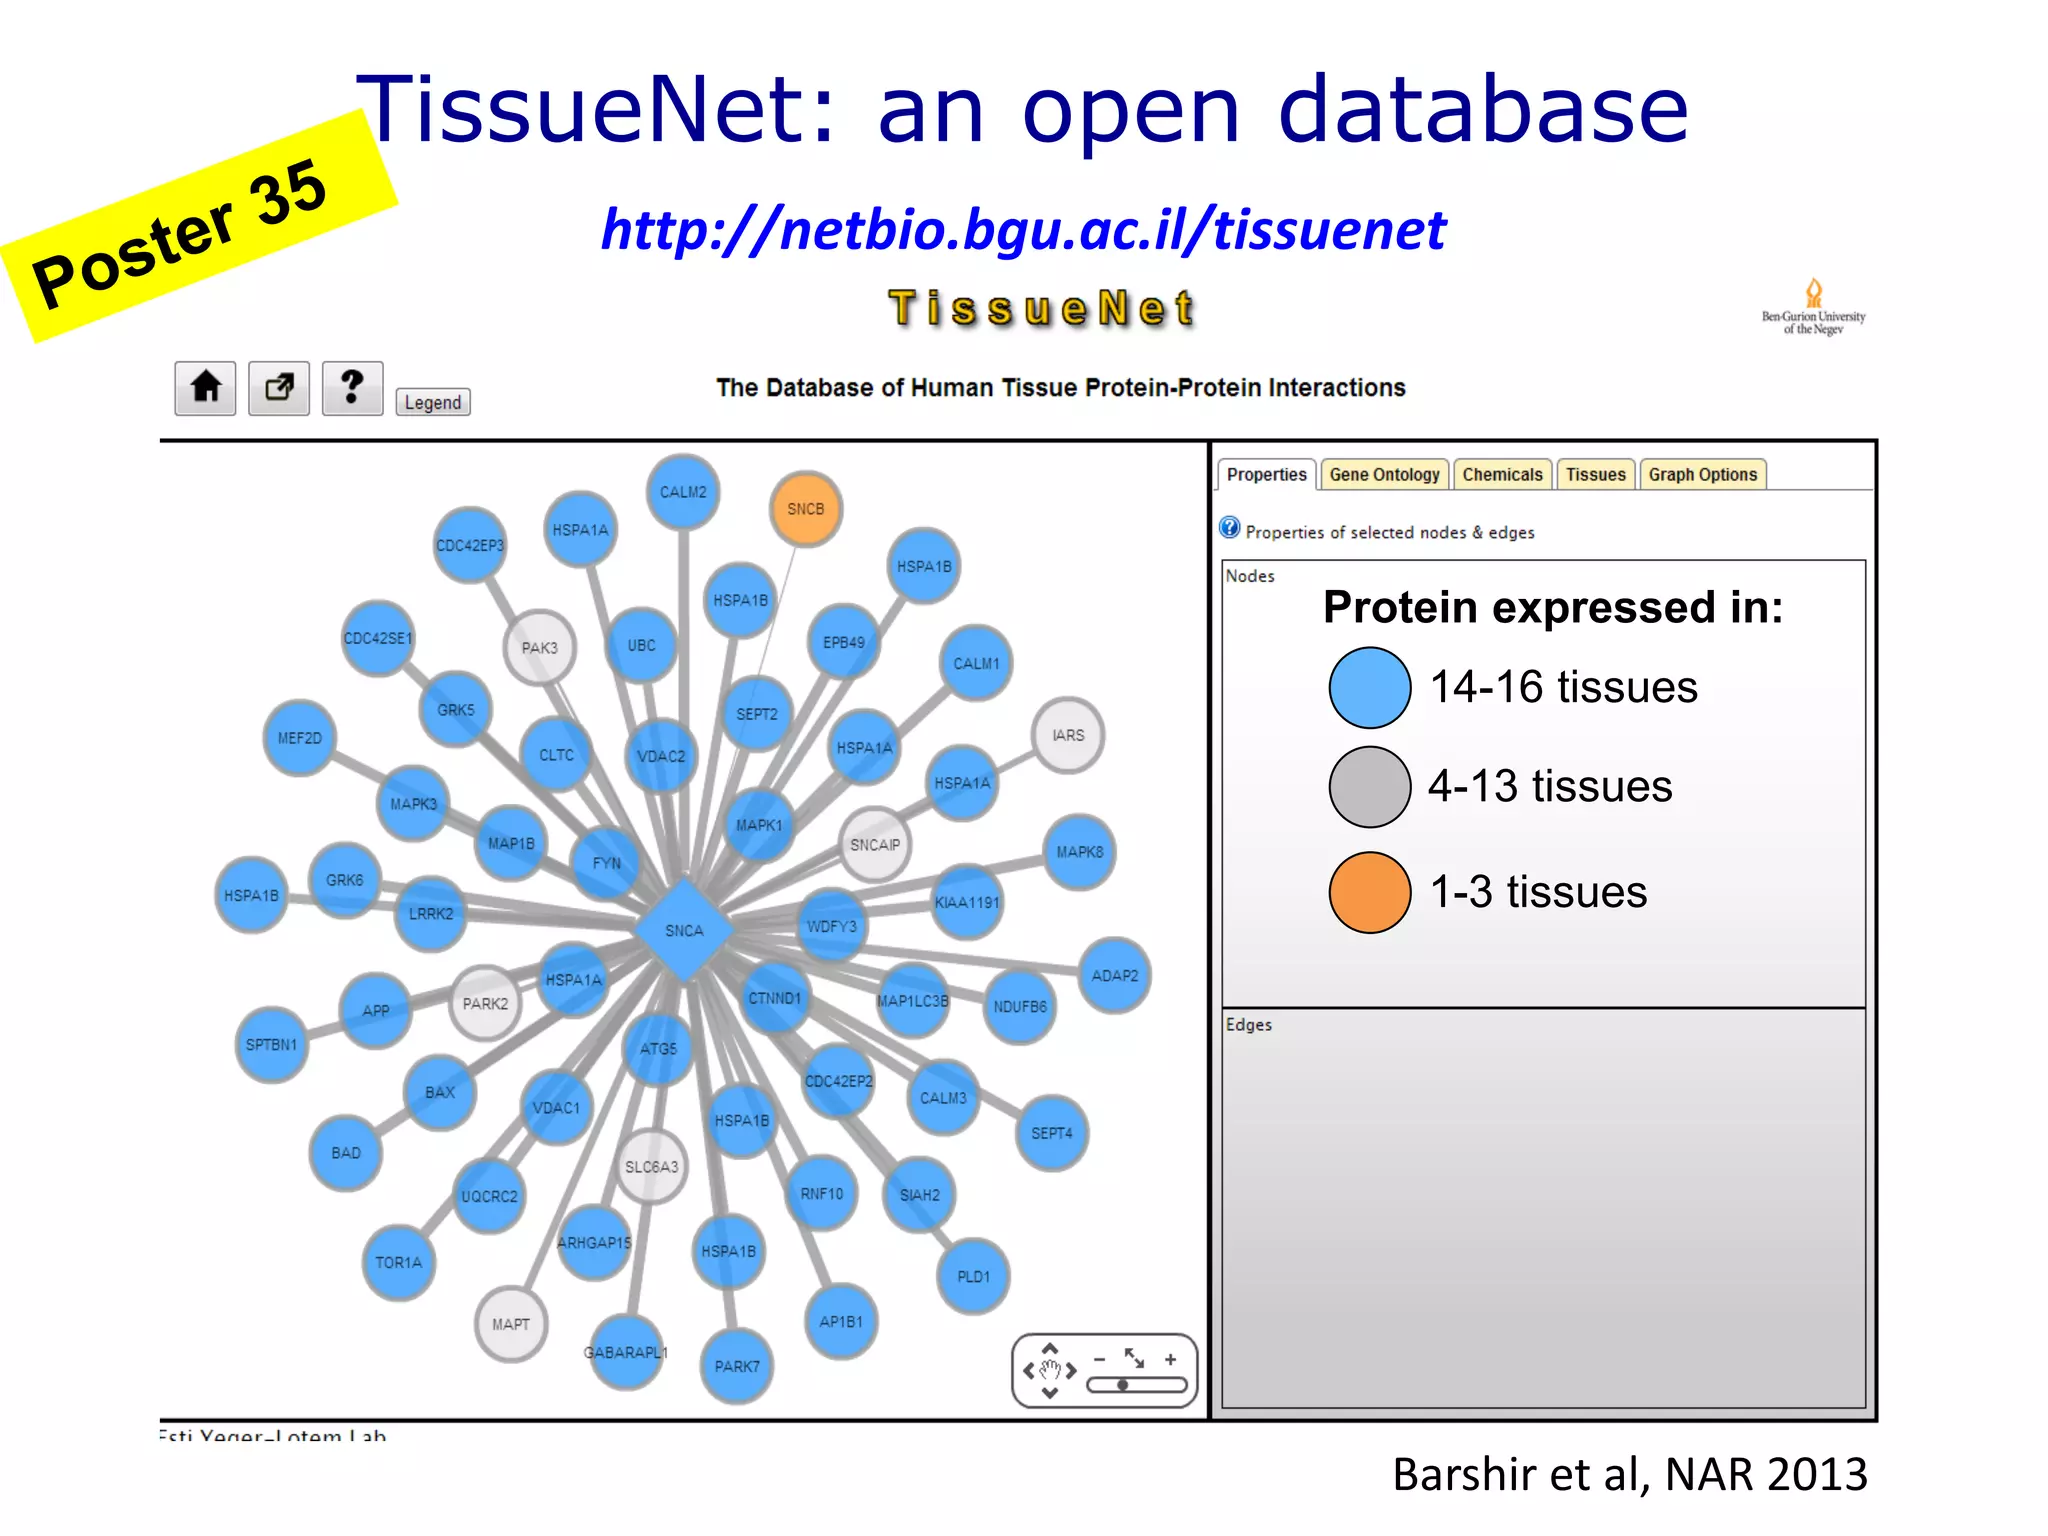
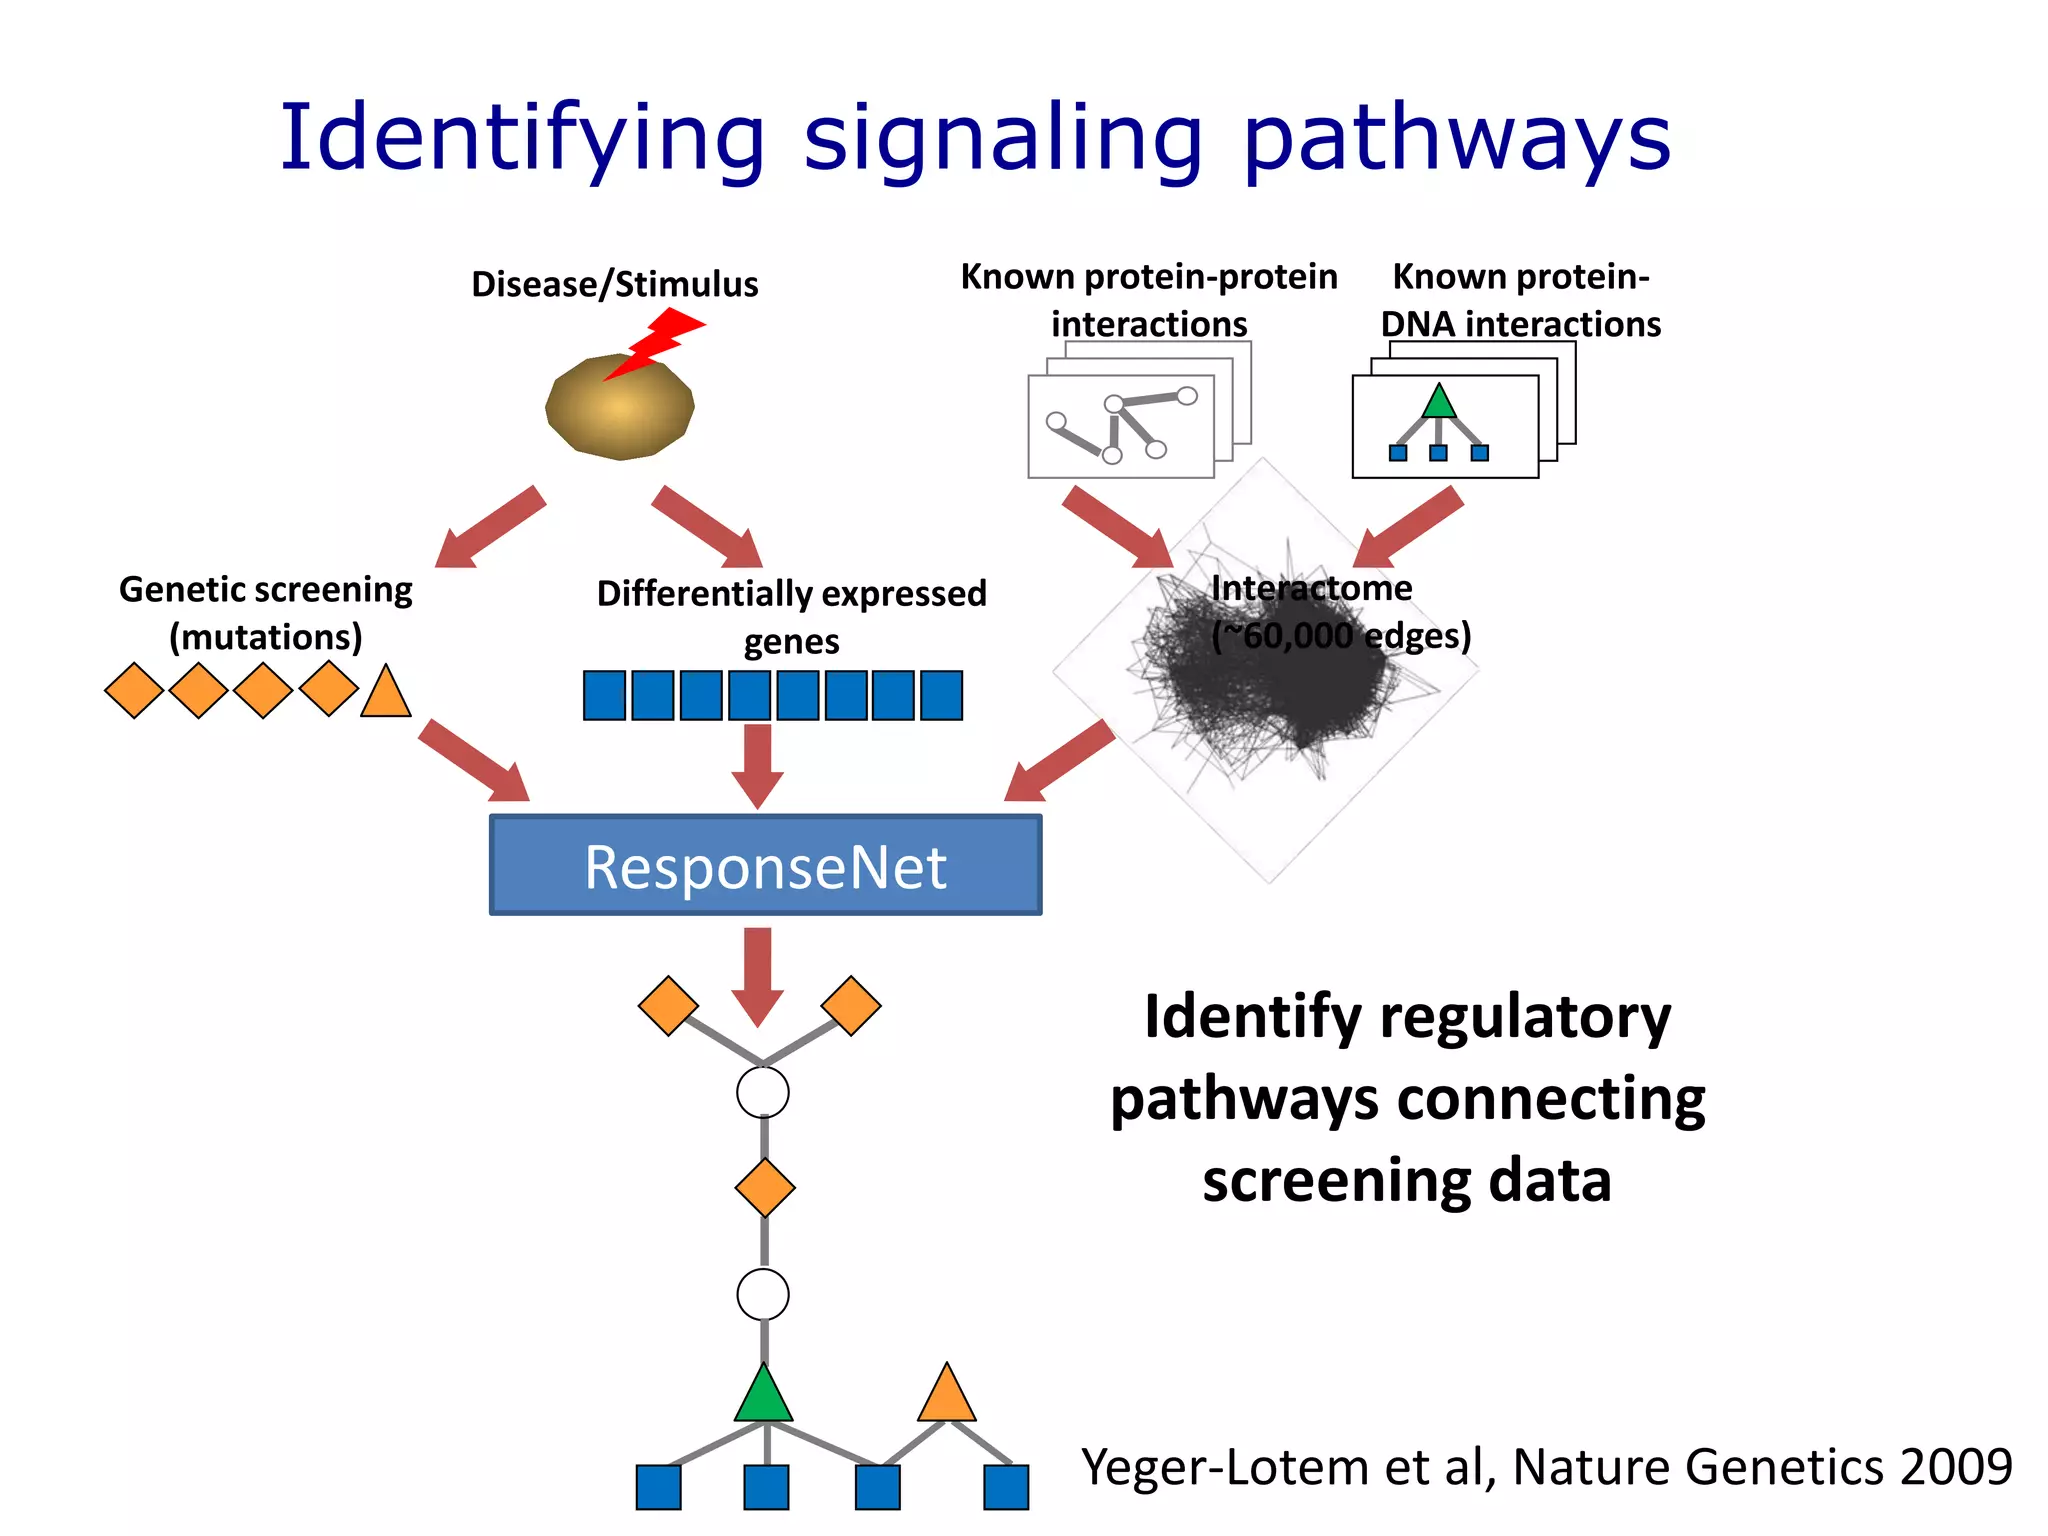
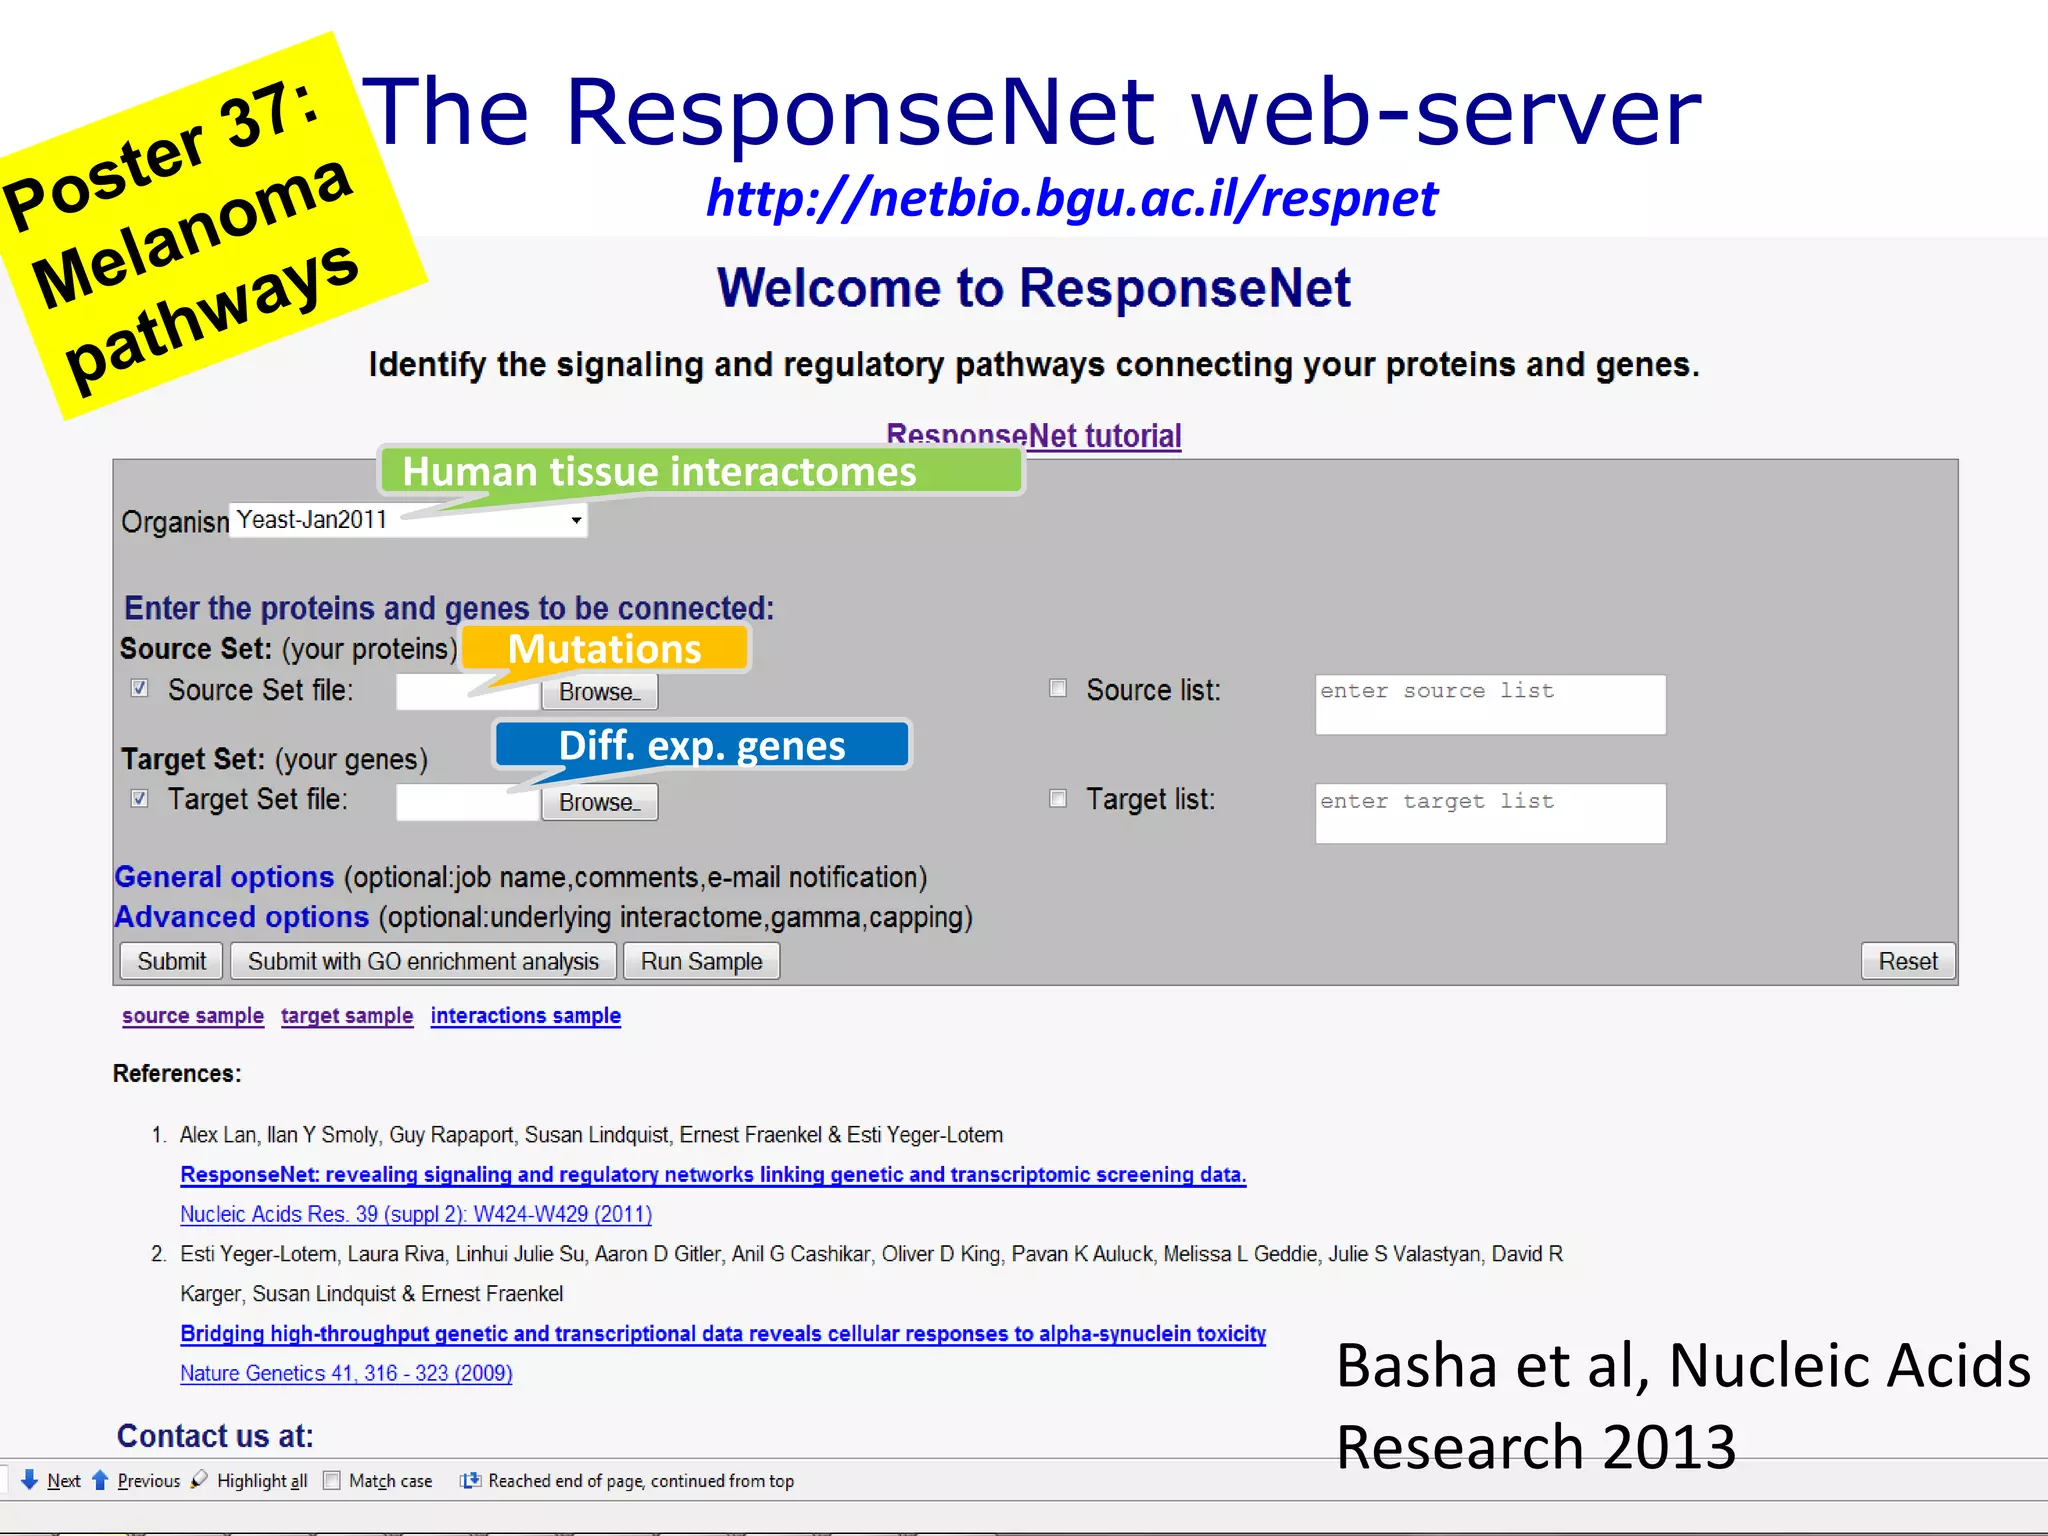
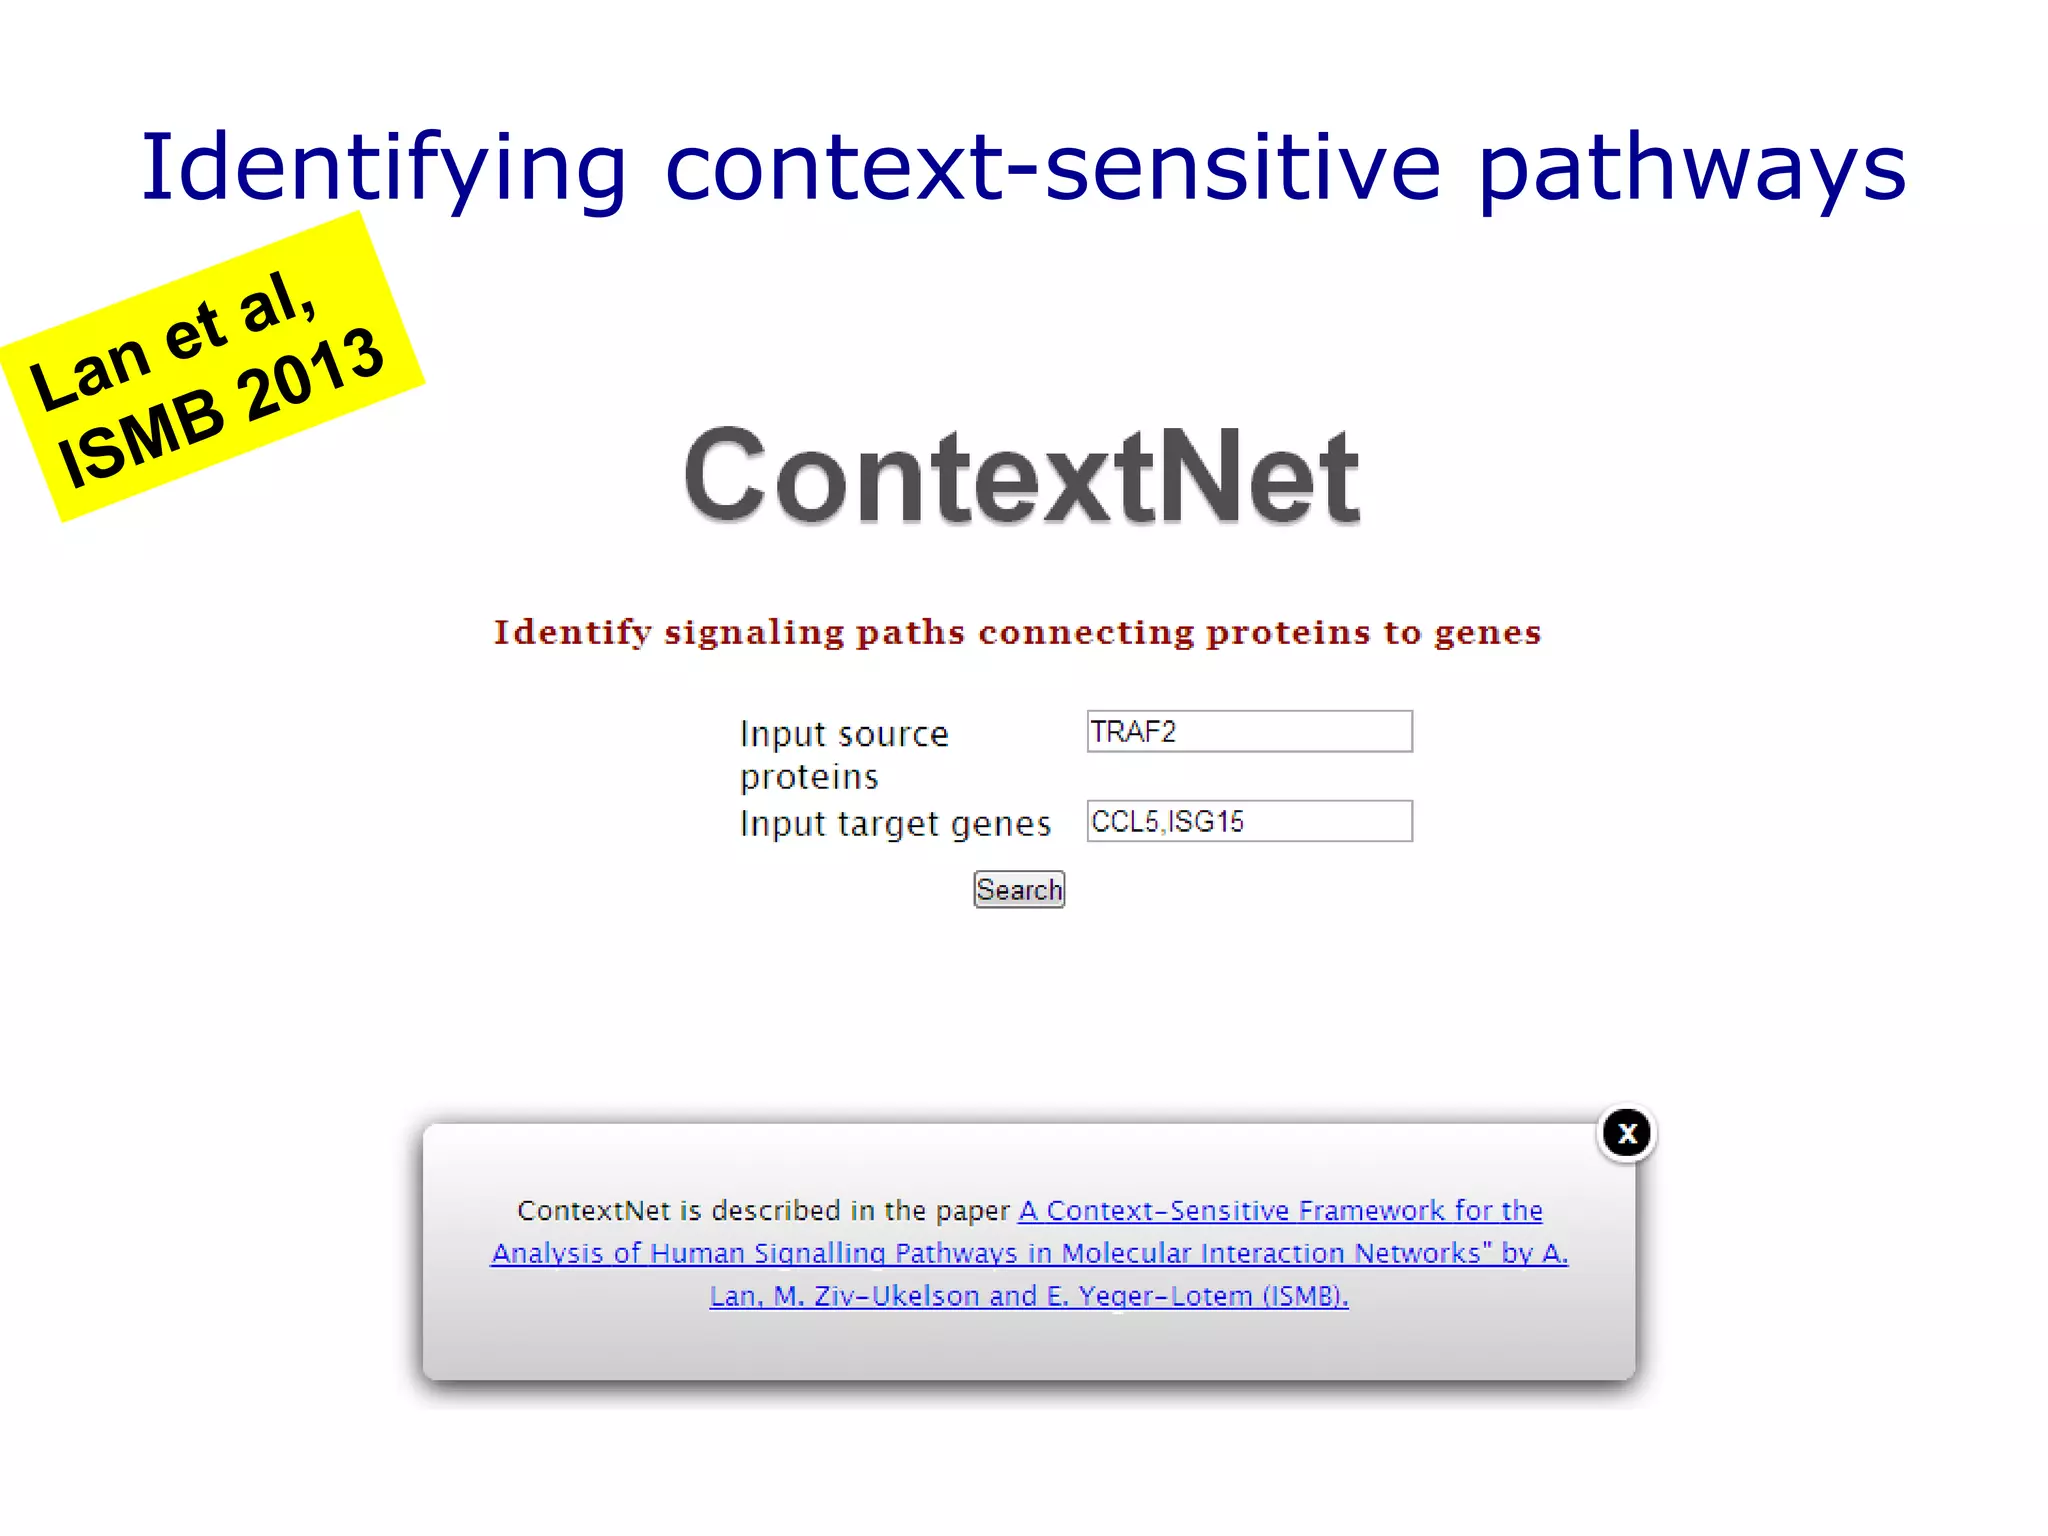
Decoding the Tissue-Specificity
of Hereditary Diseases
by using Tissue Interactomes
Esti Yeger-Lotem
Layout
• Human tissue interactomes
– extensive up-to-date resource
• Decoding the tissue-specificity
of hereditary diseases
• Our open web-tool
Familial Parkinson disease:
SNCA aberration
P1
P2
P3
From a global human interactome to tissue
interactomes
• Known protein-protein interactions (PPIs)
- however no tissue context!
• Use tissue expression data
– Filter interactome per tissue
– Most studies relied on GNF: the microarray study of
Su et al, PNAS 2004, (e.g., Lehner 2008)
• New large-scale data emerging
(e.g., Sandberg 2009, Albrecht 2011)
– RNA-Seq data &
protein large-scale data available!
P1
P2
P3
66
tissues
78
tissues
GNF HPA RNA-Seq
16
tissues
16 tissue expressomes
Integrating tissue expression data
• Protein=gene, no splice-variants
• Used stringent cutoffs for
expression
Tissue GNF HPA
RNA-
seq
Adipose 2,533 N/A 10,269
Adrenal 2,498 7,235 10,822
Brain 4,335 7,692 10,925
Breast N/A 6,526 10,698
Colon 2,807 7,244 10,519
Heart 3,345 6,189 9,827
Kidney 2,025 7,672 10,945
Liver 2,531 6,202 8,842
Lung 3,010 7,465 11,063
Lymph Node 2,441 6,183 10,973
Ovary 1,567 5,111 11,165
Prostate 3,075 6,508 11,250
Skeletal Muscle 1,751 5,805 8,851
Testis 3,176 7,744 12,567
Thyroid 3,360 6,982 10,938
White Blood
Cells 5,750 N/A 9,466
Median 2,807 6,754 10,873
66
tissues
78
tissues
GNF HPA RNA-Seq
16
tissues
16 tissue expressomes
Integrating tissue expression data
• ~70% overlap between RNA-seq & GNF or HPA
• Single resource not enough
66
tissues
78
tissues
GNF HPA RNA-Seq
16
tissues
16 tissue expressomes
Integrating tissue expression data
• Matching tissues correlated
significantly (best match)
1
10
100
1000
10000
100000
100 1000 10000 100000
Gene expression level (GNF)
RPKM(RNA-seq)
66
tissues
78
tissues
GNF HPA RNA-Seq
16
tissues
16 tissue expressomes
Integrating tissue expression data
Tissue
Com-
bined
GNF HPA
RNA-
seq
Adipose 10,859 2,533 N/A 10,269
Adrenal 13,592 2,498 7,235 10,822
Brain 14,000 4,335 7,692 10,925
Breast 12,669 N/A 6,526 10,698
Colon 13,312 2,807 7,244 10,519
Heart 12,766 3,345 6,189 9,827
Kidney 13,662 2,025 7,672 10,945
Liver 11,958 2,531 6,202 8,842
Lung 13,853 3,010 7,465 11,063
Lymph Node 13,185 2,441 6,183 10,973
Ovary 12,918 1,567 5,111 11,165
Prostate 13,586 3,075 6,508 11,250
Skeletal Muscle 11,736 1,751 5,805 8,851
Testis 14,819 3,176 7,744 12,567
Thyroid 13,518 3,360 6,982 10,938
White Blood
Cells 10,844 5,750 N/A 9,466
Median 13,248 2,807 6,754 10,873
Tissue expressed gene:
detected in ≥ 1 sample
66
tissues
78
tissues
Su et al HPA RNA-Seq
16
tissues
MINTBIOGRID DIP INTACT
16 tissue expressomes Global human interactome
Integrating expression & interactions
11,225 proteins (52% of proteins),
67,439 interactions
66
tissues
78
tissues
HPA RNA-Seq
16
tissues
MINTBIOGRID DIP INTACT
16 tissue expressomes Global human interactome
Integrating expression & interactions
PPI in tissue if both
proteins are expressed
GNF
0
5
10
15
20
25
30
35
40
45
50
1 2 3 4 5 6 7 8 9 10 11 12 13 14 15 16
Percentageoftotalset
Number of expressing tissues
GNF HPA RNA-seq Combined
Enriched for
basic cellular
processes
(translation
elongation, ..)
1. Most genes are globally expressed or
tissue specific
0
5000
10000
15000
20000
25000
30000
2. A common core network dominates all
tissue interactomes
> 50% of proteins & PPIs in each tissue appear in all tissues
- 26,370 interactions, 4,989 proteins
Genes
PPIs
3. Tissue hub proteins: persistent
regulators
• 451 tissue hubs:
Hubs = proteins with top number of
interactions (5%, > 45 interactions)
• Highly enriched for
regulatory processes
- transcription regulation (42%, p<10-15)
- protein kinase cascade (12%, p<10-8)
- also relative to core proteins
• Much of the regulatory components are
similar across tissues
Number of PPIs
30 45 150
Hubs
Tissues
4. PPI degree and expression levels
are correlated across all tissues
Gene2
Gene3
Gene4
Gene1
Gene1
Gene1
Gene2
Gene6
Gene4
Gene3
Gene8
Gene9
Gene10
Gene1Gene1
0
5
10
15
20
1 2 3 4 5 6 7 8 9 10
Degree
RPKM percentile
Adipose
Spearman r= 0.98
• Previously shown in yeast
von Mering et al, Nature 2002
0
5
10
15
20
25
1 2 3 4 5 6 7 8 9 10
Adipose
0
5
10
15
20
25
1 2 3 4 5 6 7 8 9 10
Adrenal
0
5
10
15
20
25
1 2 3 4 5 6 7 8 9 10
Brain
0
5
10
15
20
25
1 2 3 4 5 6 7 8 9 10
Breast
0
5
10
15
20
25
1 2 3 4 5 6 7 8 9 10
Heart
0
5
10
15
20
25
1 2 3 4 5 6 7 8 9 10
Kidney
0
5
10
15
20
25
1 2 3 4 5 6 7 8 9 10
Liver
0
5
10
15
20
25
1 2 3 4 5 6 7 8 9 10
Colon
0
5
10
15
20
25
1 2 3 4 5 6 7 8 9 10
Lymph Node
0
5
10
15
20
25
1 2 3 4 5 6 7 8 9 10
Lung
0
5
10
15
20
25
1 2 3 4 5 6 7 8 9 10
Ovary
0
5
10
15
20
25
1 2 3 4 5 6 7 8 9 10
Prostate
0
5
10
15
20
25
1 2 3 4 5 6 7 8 9 10
Skeletal Muscle
0
5
10
15
20
25
1 2 3 4 5 6 7 8 9 10
Testis
0
5
10
15
20
25
1 2 3 4 5 6 7 8 9 10
Thyroid
0
5
10
15
20
25
1 2 3 4 5 6 7 8 9 10
WBC
4. PPI degree and expression levels
are correlated across all tissues
Layout
• Tissue interactomes
– extensive up-to-date resource
• Decoding the tissue-specificity
of hereditary diseases
• Our open web-tool
Familial Parkinson disease:
SNCA aberration
Familial Parkinson disease:
SNCA aberration
SNCA expression
0
10
20
30
40
50
60
70
80
90
100
1 2 3 4 5 6 7 8 9 10 11 12 13 14 15 16
Number of expressing tissues
Percentageoftotal
342 hereditary diseases
266 causal disease
genes
The enigmatic tissue-specific
manifestation of hereditary diseases
0
10
20
30
40
50
60
70
80
90
100
1 2 3 4 5 6 7 8 9 10 11 12 13 14 15 16
Number of expressing tissues
P
• Hereditary diseases - causal genes associations: OMIM, COSMIC
• Disease-tissue associations: Lage et al, PNAS 2008
Barshir et al, in revision
0
10
20
30
40
50
60
disease tissues non disease tissues
Factors governing tissue-specificity (TS)
Disease tissues Other expressing tissues
63% of the genes, p<10-4
Expression level (RPKM)
0
0.5
1
1.5
2
2.5
Disease tissues Other expressing
tissues
MediannumberofTS-PPIof
diseasegenes
Tissue-specific PPIs
21% of the genes, p<10-4
Barshir et al, in revision
TS-PPIs illuminate disease-related
mechanisms
Hereditary breast cancer predisposition
BRCA1 network in breast
Familial lung adenocarcinoma
EGFR network in lung
Muscular dystrophy
DAG1 network in muscle
14-16 tissues
4-13 tissues
1-3 tissues
Protein expressed in:
~90% PPIs filtered
out
Barshir et al, in revision
Factors distribution across hereditary
diseases
TS-PPIs 15%
TS-PPIs +
elevated
expression
12%
Elevated
expression:
33%
Unknown
33%
Disease
genes tissue-
specific:
7%
Barshir et al, in revision
Layout
• Tissue interactomes
– extensive up-to-date resource
• Decoding the tissue-specificity
of hereditary diseases
• Our open web-tool
Familial Parkinson disease:
SNCA aberration
Barshir et al, NAR 2013
TissueNet: an open database
14-16 tissues
4-13 tissues
1-3 tissues
Protein expressed in:
http://netbio.bgu.ac.il/tissuenet
Disease/Stimulus
Differentially expressed
genes
Genetic screening
(mutations)
Known protein-
DNA interactions
Known protein-protein
interactions
Interactome
(~60,000 edges)
Identifying signaling pathways
Identify regulatory
pathways connecting
screening data
ResponseNet
Yeger-Lotem et al, Nature Genetics 2009
The ResponseNet web-server
http://netbio.bgu.ac.il/respnet
Basha et al, Nucleic Acids
Research 2013
Mutations
Diff. exp. genes
Human tissue interactomes
Identifying context-sensitive pathways
http://netbio.bgu.ac.il/ContextNet
Thanks!
Marie Curie
International
Reintegration Grant
TissueNet
Galila Agam
Haim Belmaker
Assaf Rudich
Vered Chalifa-Caspi
Inbar plaschkes
My lab @ BGU
Ruth Barshir
Omer Basha
Alex Lan
Ilan Smoly
Shoval Tirman
Amir Eluk
Omer Schwartz
ContextNet
Michal Ziv-Ukelson
ResponseNet
Ernest Fraenkel
Susan Lindquist

NetBioSIG2013-KEYNOTE Esti Yeger-Lotem

  • 1.
    Decoding the Tissue-Specificity ofHereditary Diseases by using Tissue Interactomes Esti Yeger-Lotem
  • 2.
    Layout • Human tissueinteractomes – extensive up-to-date resource • Decoding the tissue-specificity of hereditary diseases • Our open web-tool Familial Parkinson disease: SNCA aberration P1 P2 P3
  • 3.
    From a globalhuman interactome to tissue interactomes • Known protein-protein interactions (PPIs) - however no tissue context! • Use tissue expression data – Filter interactome per tissue – Most studies relied on GNF: the microarray study of Su et al, PNAS 2004, (e.g., Lehner 2008) • New large-scale data emerging (e.g., Sandberg 2009, Albrecht 2011) – RNA-Seq data & protein large-scale data available! P1 P2 P3
  • 4.
    66 tissues 78 tissues GNF HPA RNA-Seq 16 tissues 16tissue expressomes Integrating tissue expression data • Protein=gene, no splice-variants • Used stringent cutoffs for expression Tissue GNF HPA RNA- seq Adipose 2,533 N/A 10,269 Adrenal 2,498 7,235 10,822 Brain 4,335 7,692 10,925 Breast N/A 6,526 10,698 Colon 2,807 7,244 10,519 Heart 3,345 6,189 9,827 Kidney 2,025 7,672 10,945 Liver 2,531 6,202 8,842 Lung 3,010 7,465 11,063 Lymph Node 2,441 6,183 10,973 Ovary 1,567 5,111 11,165 Prostate 3,075 6,508 11,250 Skeletal Muscle 1,751 5,805 8,851 Testis 3,176 7,744 12,567 Thyroid 3,360 6,982 10,938 White Blood Cells 5,750 N/A 9,466 Median 2,807 6,754 10,873
  • 5.
    66 tissues 78 tissues GNF HPA RNA-Seq 16 tissues 16tissue expressomes Integrating tissue expression data • ~70% overlap between RNA-seq & GNF or HPA • Single resource not enough
  • 6.
    66 tissues 78 tissues GNF HPA RNA-Seq 16 tissues 16tissue expressomes Integrating tissue expression data • Matching tissues correlated significantly (best match) 1 10 100 1000 10000 100000 100 1000 10000 100000 Gene expression level (GNF) RPKM(RNA-seq)
  • 7.
    66 tissues 78 tissues GNF HPA RNA-Seq 16 tissues 16tissue expressomes Integrating tissue expression data Tissue Com- bined GNF HPA RNA- seq Adipose 10,859 2,533 N/A 10,269 Adrenal 13,592 2,498 7,235 10,822 Brain 14,000 4,335 7,692 10,925 Breast 12,669 N/A 6,526 10,698 Colon 13,312 2,807 7,244 10,519 Heart 12,766 3,345 6,189 9,827 Kidney 13,662 2,025 7,672 10,945 Liver 11,958 2,531 6,202 8,842 Lung 13,853 3,010 7,465 11,063 Lymph Node 13,185 2,441 6,183 10,973 Ovary 12,918 1,567 5,111 11,165 Prostate 13,586 3,075 6,508 11,250 Skeletal Muscle 11,736 1,751 5,805 8,851 Testis 14,819 3,176 7,744 12,567 Thyroid 13,518 3,360 6,982 10,938 White Blood Cells 10,844 5,750 N/A 9,466 Median 13,248 2,807 6,754 10,873 Tissue expressed gene: detected in ≥ 1 sample
  • 8.
    66 tissues 78 tissues Su et alHPA RNA-Seq 16 tissues MINTBIOGRID DIP INTACT 16 tissue expressomes Global human interactome Integrating expression & interactions 11,225 proteins (52% of proteins), 67,439 interactions
  • 9.
    66 tissues 78 tissues HPA RNA-Seq 16 tissues MINTBIOGRID DIPINTACT 16 tissue expressomes Global human interactome Integrating expression & interactions PPI in tissue if both proteins are expressed GNF
  • 10.
    0 5 10 15 20 25 30 35 40 45 50 1 2 34 5 6 7 8 9 10 11 12 13 14 15 16 Percentageoftotalset Number of expressing tissues GNF HPA RNA-seq Combined Enriched for basic cellular processes (translation elongation, ..) 1. Most genes are globally expressed or tissue specific
  • 11.
    0 5000 10000 15000 20000 25000 30000 2. A commoncore network dominates all tissue interactomes > 50% of proteins & PPIs in each tissue appear in all tissues - 26,370 interactions, 4,989 proteins Genes PPIs
  • 12.
    3. Tissue hubproteins: persistent regulators • 451 tissue hubs: Hubs = proteins with top number of interactions (5%, > 45 interactions) • Highly enriched for regulatory processes - transcription regulation (42%, p<10-15) - protein kinase cascade (12%, p<10-8) - also relative to core proteins • Much of the regulatory components are similar across tissues Number of PPIs 30 45 150 Hubs Tissues
  • 13.
    4. PPI degreeand expression levels are correlated across all tissues Gene2 Gene3 Gene4 Gene1 Gene1 Gene1 Gene2 Gene6 Gene4 Gene3 Gene8 Gene9 Gene10 Gene1Gene1 0 5 10 15 20 1 2 3 4 5 6 7 8 9 10 Degree RPKM percentile Adipose Spearman r= 0.98 • Previously shown in yeast von Mering et al, Nature 2002
  • 14.
    0 5 10 15 20 25 1 2 34 5 6 7 8 9 10 Adipose 0 5 10 15 20 25 1 2 3 4 5 6 7 8 9 10 Adrenal 0 5 10 15 20 25 1 2 3 4 5 6 7 8 9 10 Brain 0 5 10 15 20 25 1 2 3 4 5 6 7 8 9 10 Breast 0 5 10 15 20 25 1 2 3 4 5 6 7 8 9 10 Heart 0 5 10 15 20 25 1 2 3 4 5 6 7 8 9 10 Kidney 0 5 10 15 20 25 1 2 3 4 5 6 7 8 9 10 Liver 0 5 10 15 20 25 1 2 3 4 5 6 7 8 9 10 Colon 0 5 10 15 20 25 1 2 3 4 5 6 7 8 9 10 Lymph Node 0 5 10 15 20 25 1 2 3 4 5 6 7 8 9 10 Lung 0 5 10 15 20 25 1 2 3 4 5 6 7 8 9 10 Ovary 0 5 10 15 20 25 1 2 3 4 5 6 7 8 9 10 Prostate 0 5 10 15 20 25 1 2 3 4 5 6 7 8 9 10 Skeletal Muscle 0 5 10 15 20 25 1 2 3 4 5 6 7 8 9 10 Testis 0 5 10 15 20 25 1 2 3 4 5 6 7 8 9 10 Thyroid 0 5 10 15 20 25 1 2 3 4 5 6 7 8 9 10 WBC 4. PPI degree and expression levels are correlated across all tissues
  • 15.
    Layout • Tissue interactomes –extensive up-to-date resource • Decoding the tissue-specificity of hereditary diseases • Our open web-tool Familial Parkinson disease: SNCA aberration
  • 16.
    Familial Parkinson disease: SNCAaberration SNCA expression 0 10 20 30 40 50 60 70 80 90 100 1 2 3 4 5 6 7 8 9 10 11 12 13 14 15 16 Number of expressing tissues Percentageoftotal 342 hereditary diseases 266 causal disease genes The enigmatic tissue-specific manifestation of hereditary diseases 0 10 20 30 40 50 60 70 80 90 100 1 2 3 4 5 6 7 8 9 10 11 12 13 14 15 16 Number of expressing tissues P • Hereditary diseases - causal genes associations: OMIM, COSMIC • Disease-tissue associations: Lage et al, PNAS 2008 Barshir et al, in revision
  • 17.
    0 10 20 30 40 50 60 disease tissues nondisease tissues Factors governing tissue-specificity (TS) Disease tissues Other expressing tissues 63% of the genes, p<10-4 Expression level (RPKM) 0 0.5 1 1.5 2 2.5 Disease tissues Other expressing tissues MediannumberofTS-PPIof diseasegenes Tissue-specific PPIs 21% of the genes, p<10-4 Barshir et al, in revision
  • 18.
    TS-PPIs illuminate disease-related mechanisms Hereditarybreast cancer predisposition BRCA1 network in breast Familial lung adenocarcinoma EGFR network in lung Muscular dystrophy DAG1 network in muscle 14-16 tissues 4-13 tissues 1-3 tissues Protein expressed in: ~90% PPIs filtered out Barshir et al, in revision
  • 19.
    Factors distribution acrosshereditary diseases TS-PPIs 15% TS-PPIs + elevated expression 12% Elevated expression: 33% Unknown 33% Disease genes tissue- specific: 7% Barshir et al, in revision
  • 20.
    Layout • Tissue interactomes –extensive up-to-date resource • Decoding the tissue-specificity of hereditary diseases • Our open web-tool Familial Parkinson disease: SNCA aberration
  • 21.
    Barshir et al,NAR 2013 TissueNet: an open database 14-16 tissues 4-13 tissues 1-3 tissues Protein expressed in: http://netbio.bgu.ac.il/tissuenet
  • 22.
    Disease/Stimulus Differentially expressed genes Genetic screening (mutations) Knownprotein- DNA interactions Known protein-protein interactions Interactome (~60,000 edges) Identifying signaling pathways Identify regulatory pathways connecting screening data ResponseNet Yeger-Lotem et al, Nature Genetics 2009
  • 23.
    The ResponseNet web-server http://netbio.bgu.ac.il/respnet Bashaet al, Nucleic Acids Research 2013 Mutations Diff. exp. genes Human tissue interactomes
  • 24.
  • 25.
    Thanks! Marie Curie International Reintegration Grant TissueNet GalilaAgam Haim Belmaker Assaf Rudich Vered Chalifa-Caspi Inbar plaschkes My lab @ BGU Ruth Barshir Omer Basha Alex Lan Ilan Smoly Shoval Tirman Amir Eluk Omer Schwartz ContextNet Michal Ziv-Ukelson ResponseNet Ernest Fraenkel Susan Lindquist