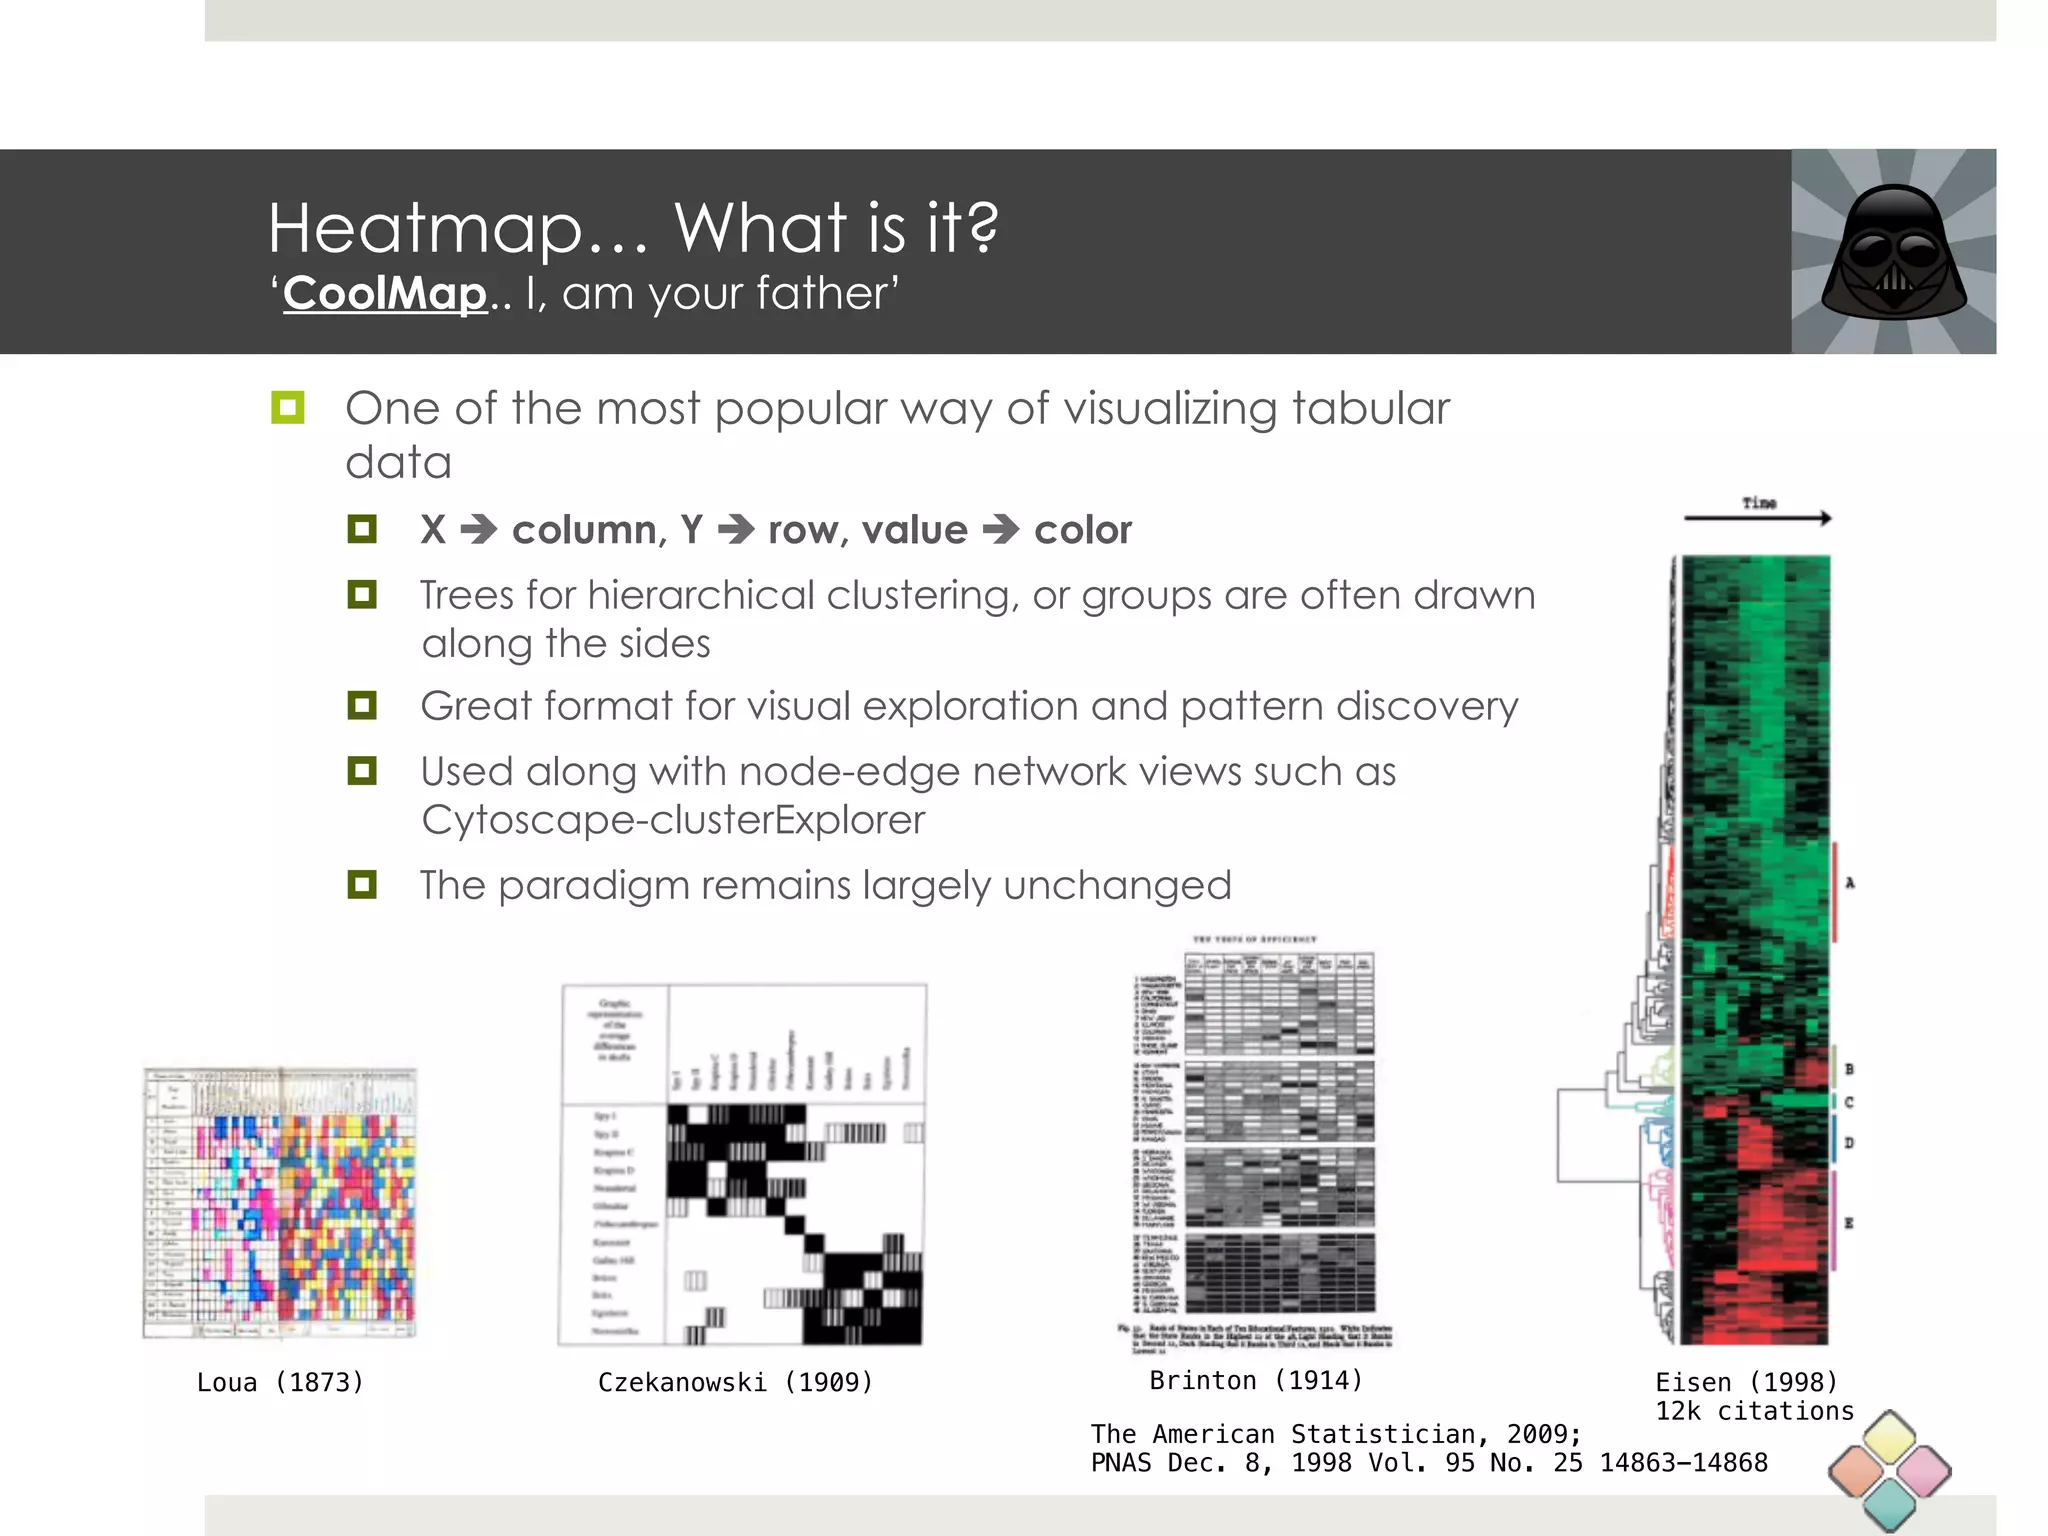
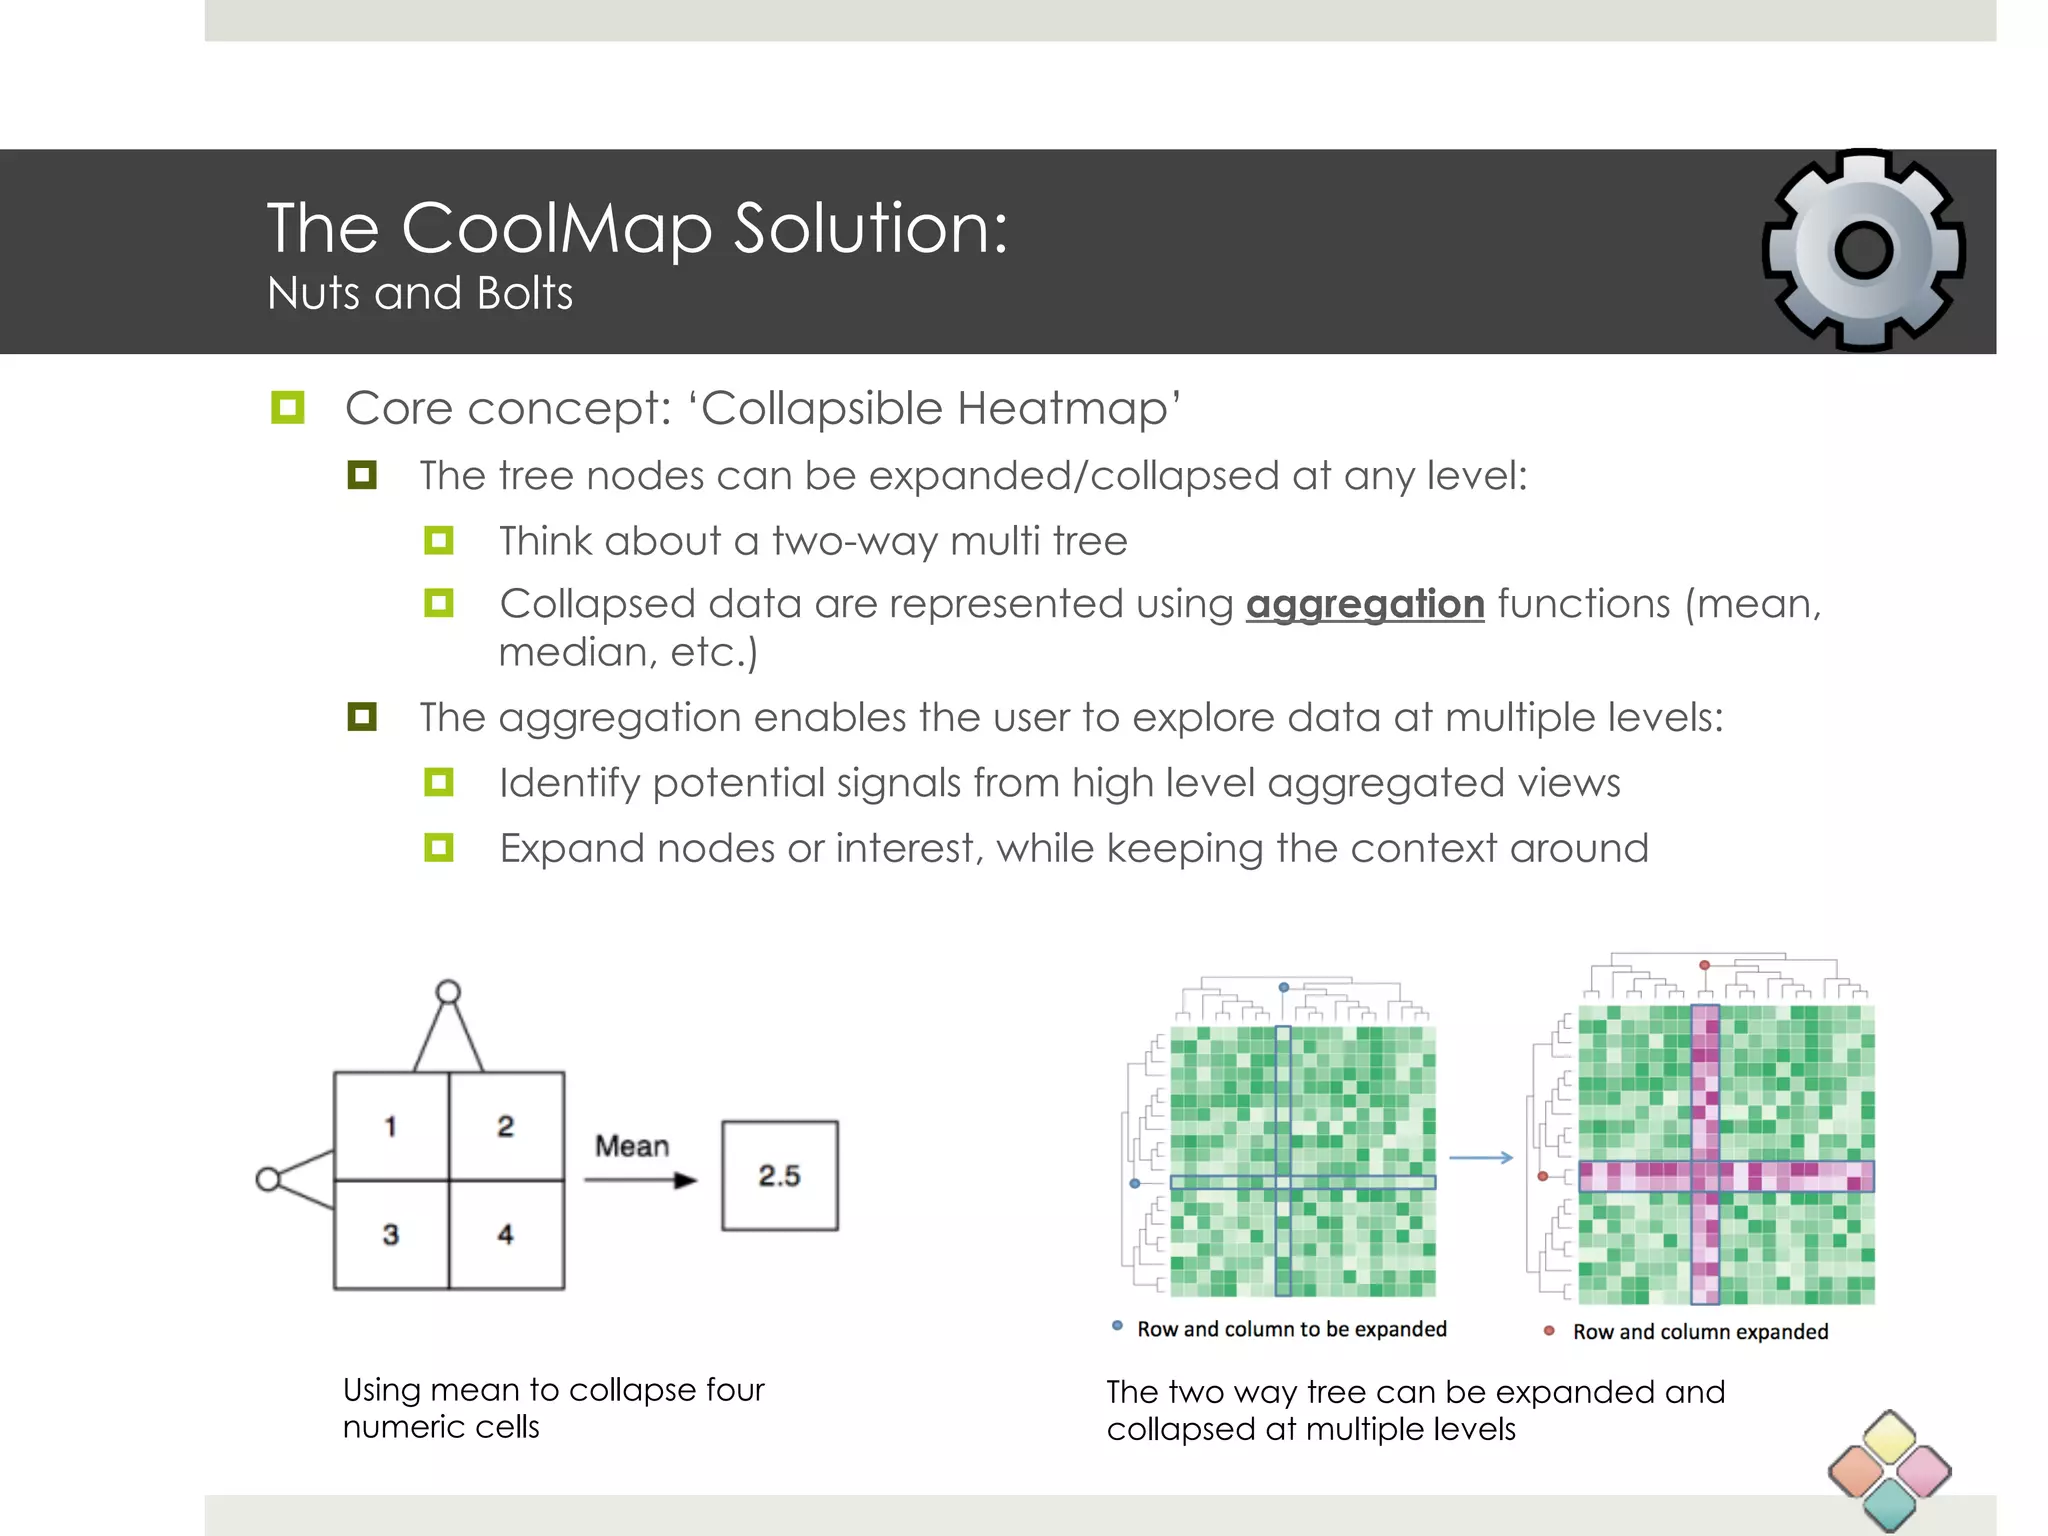
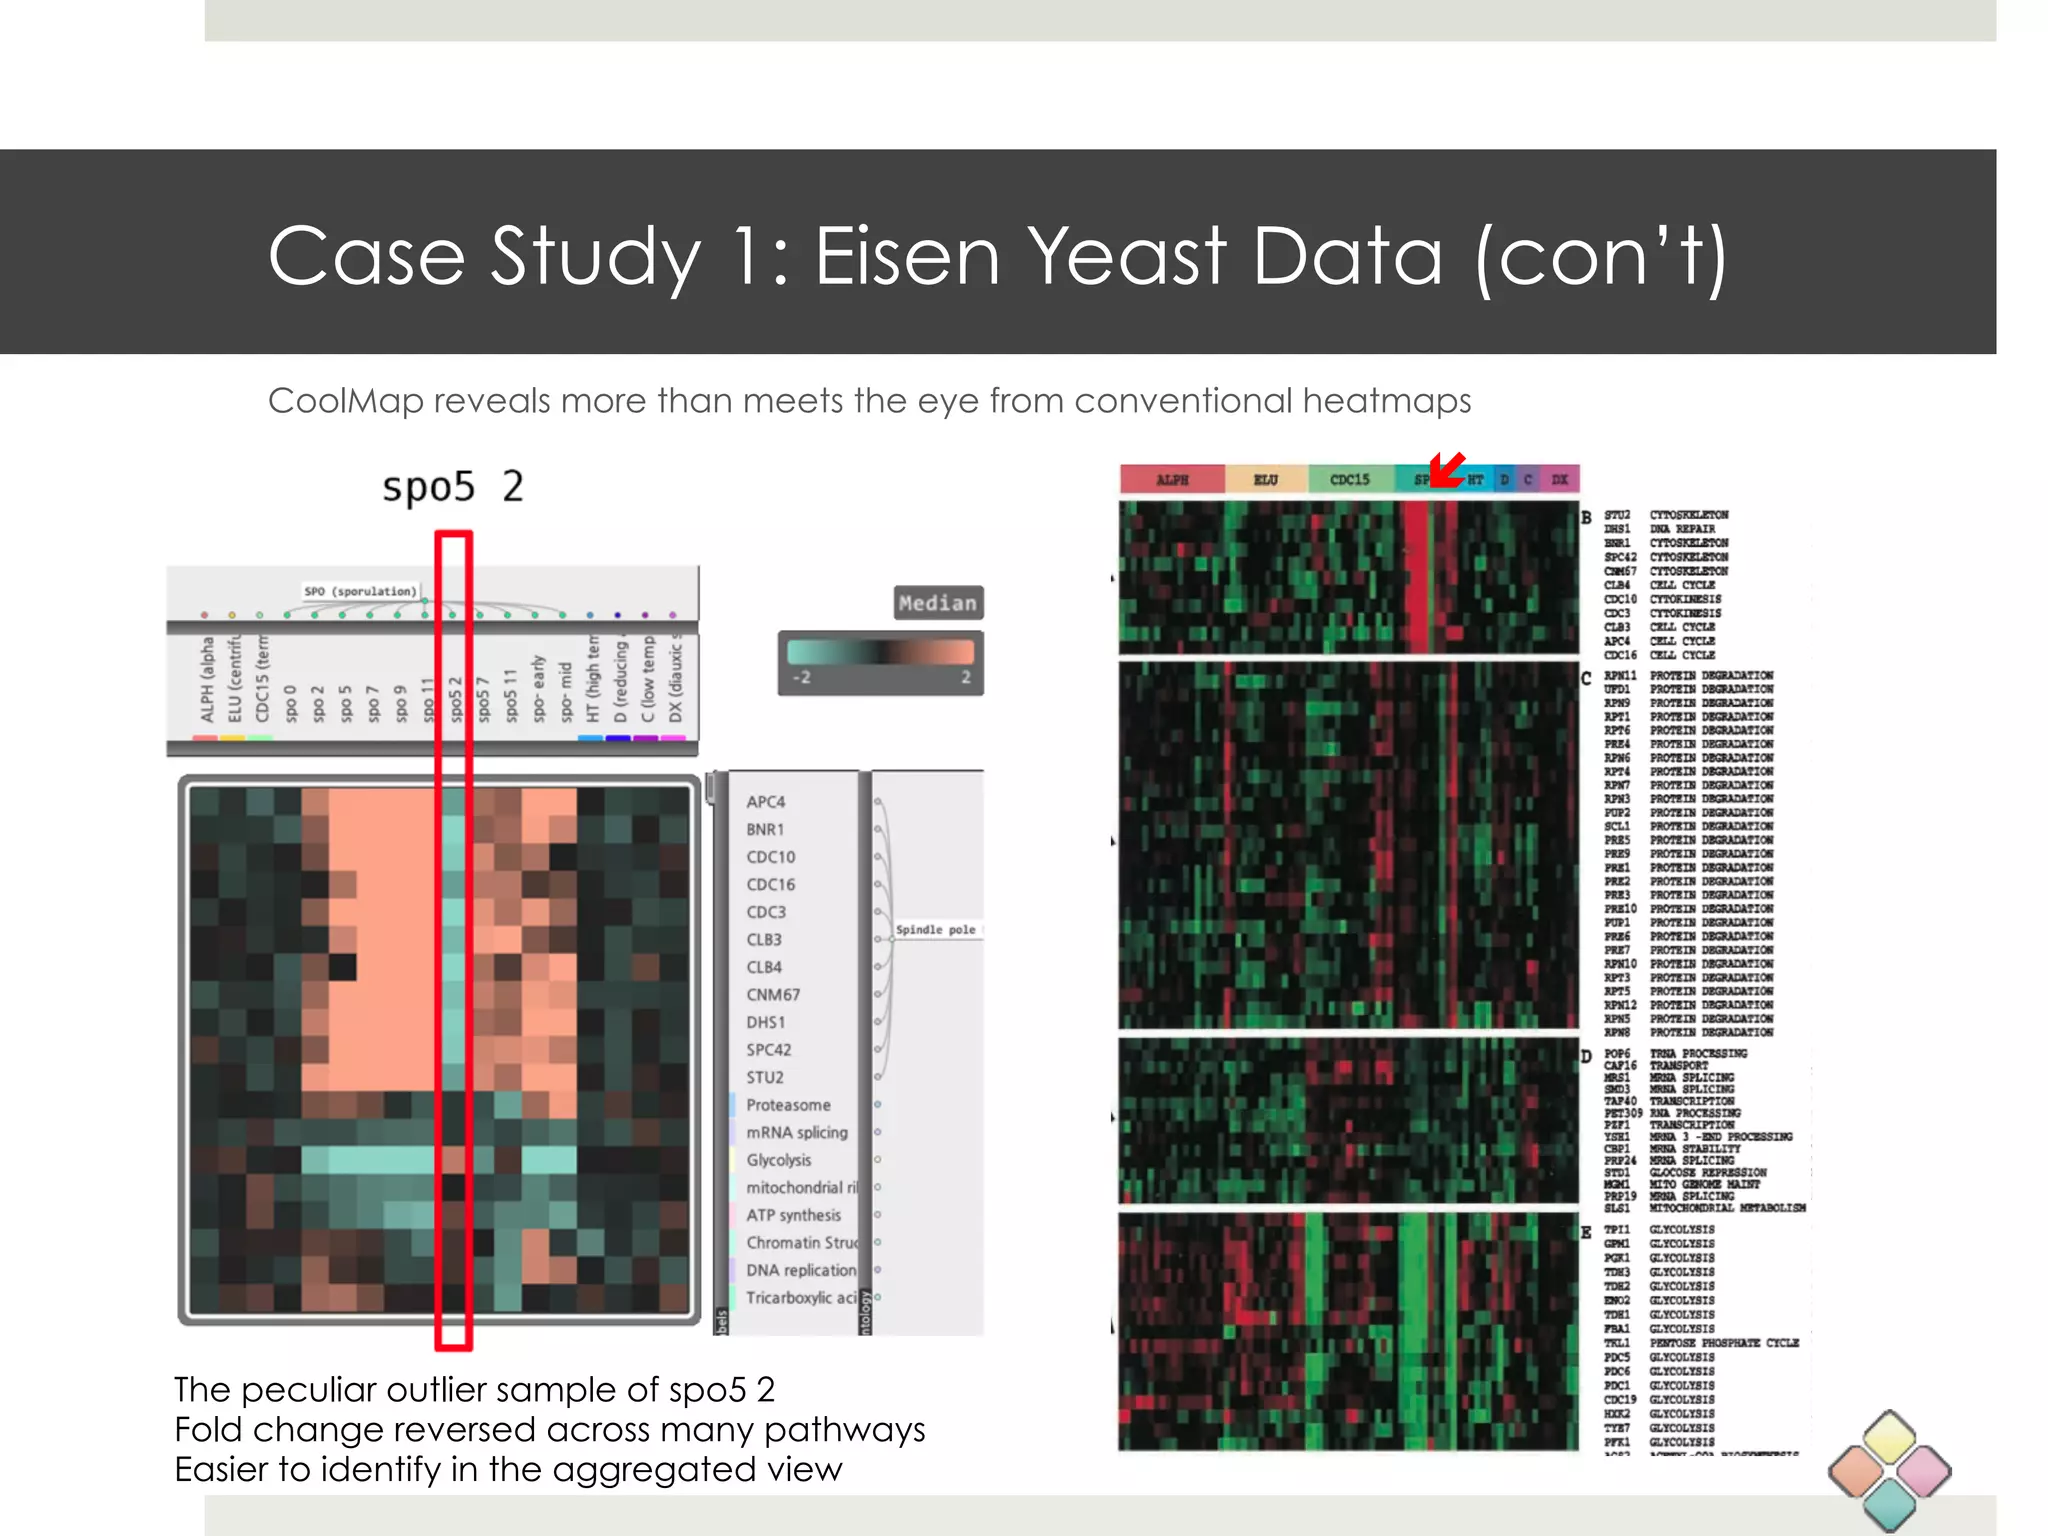
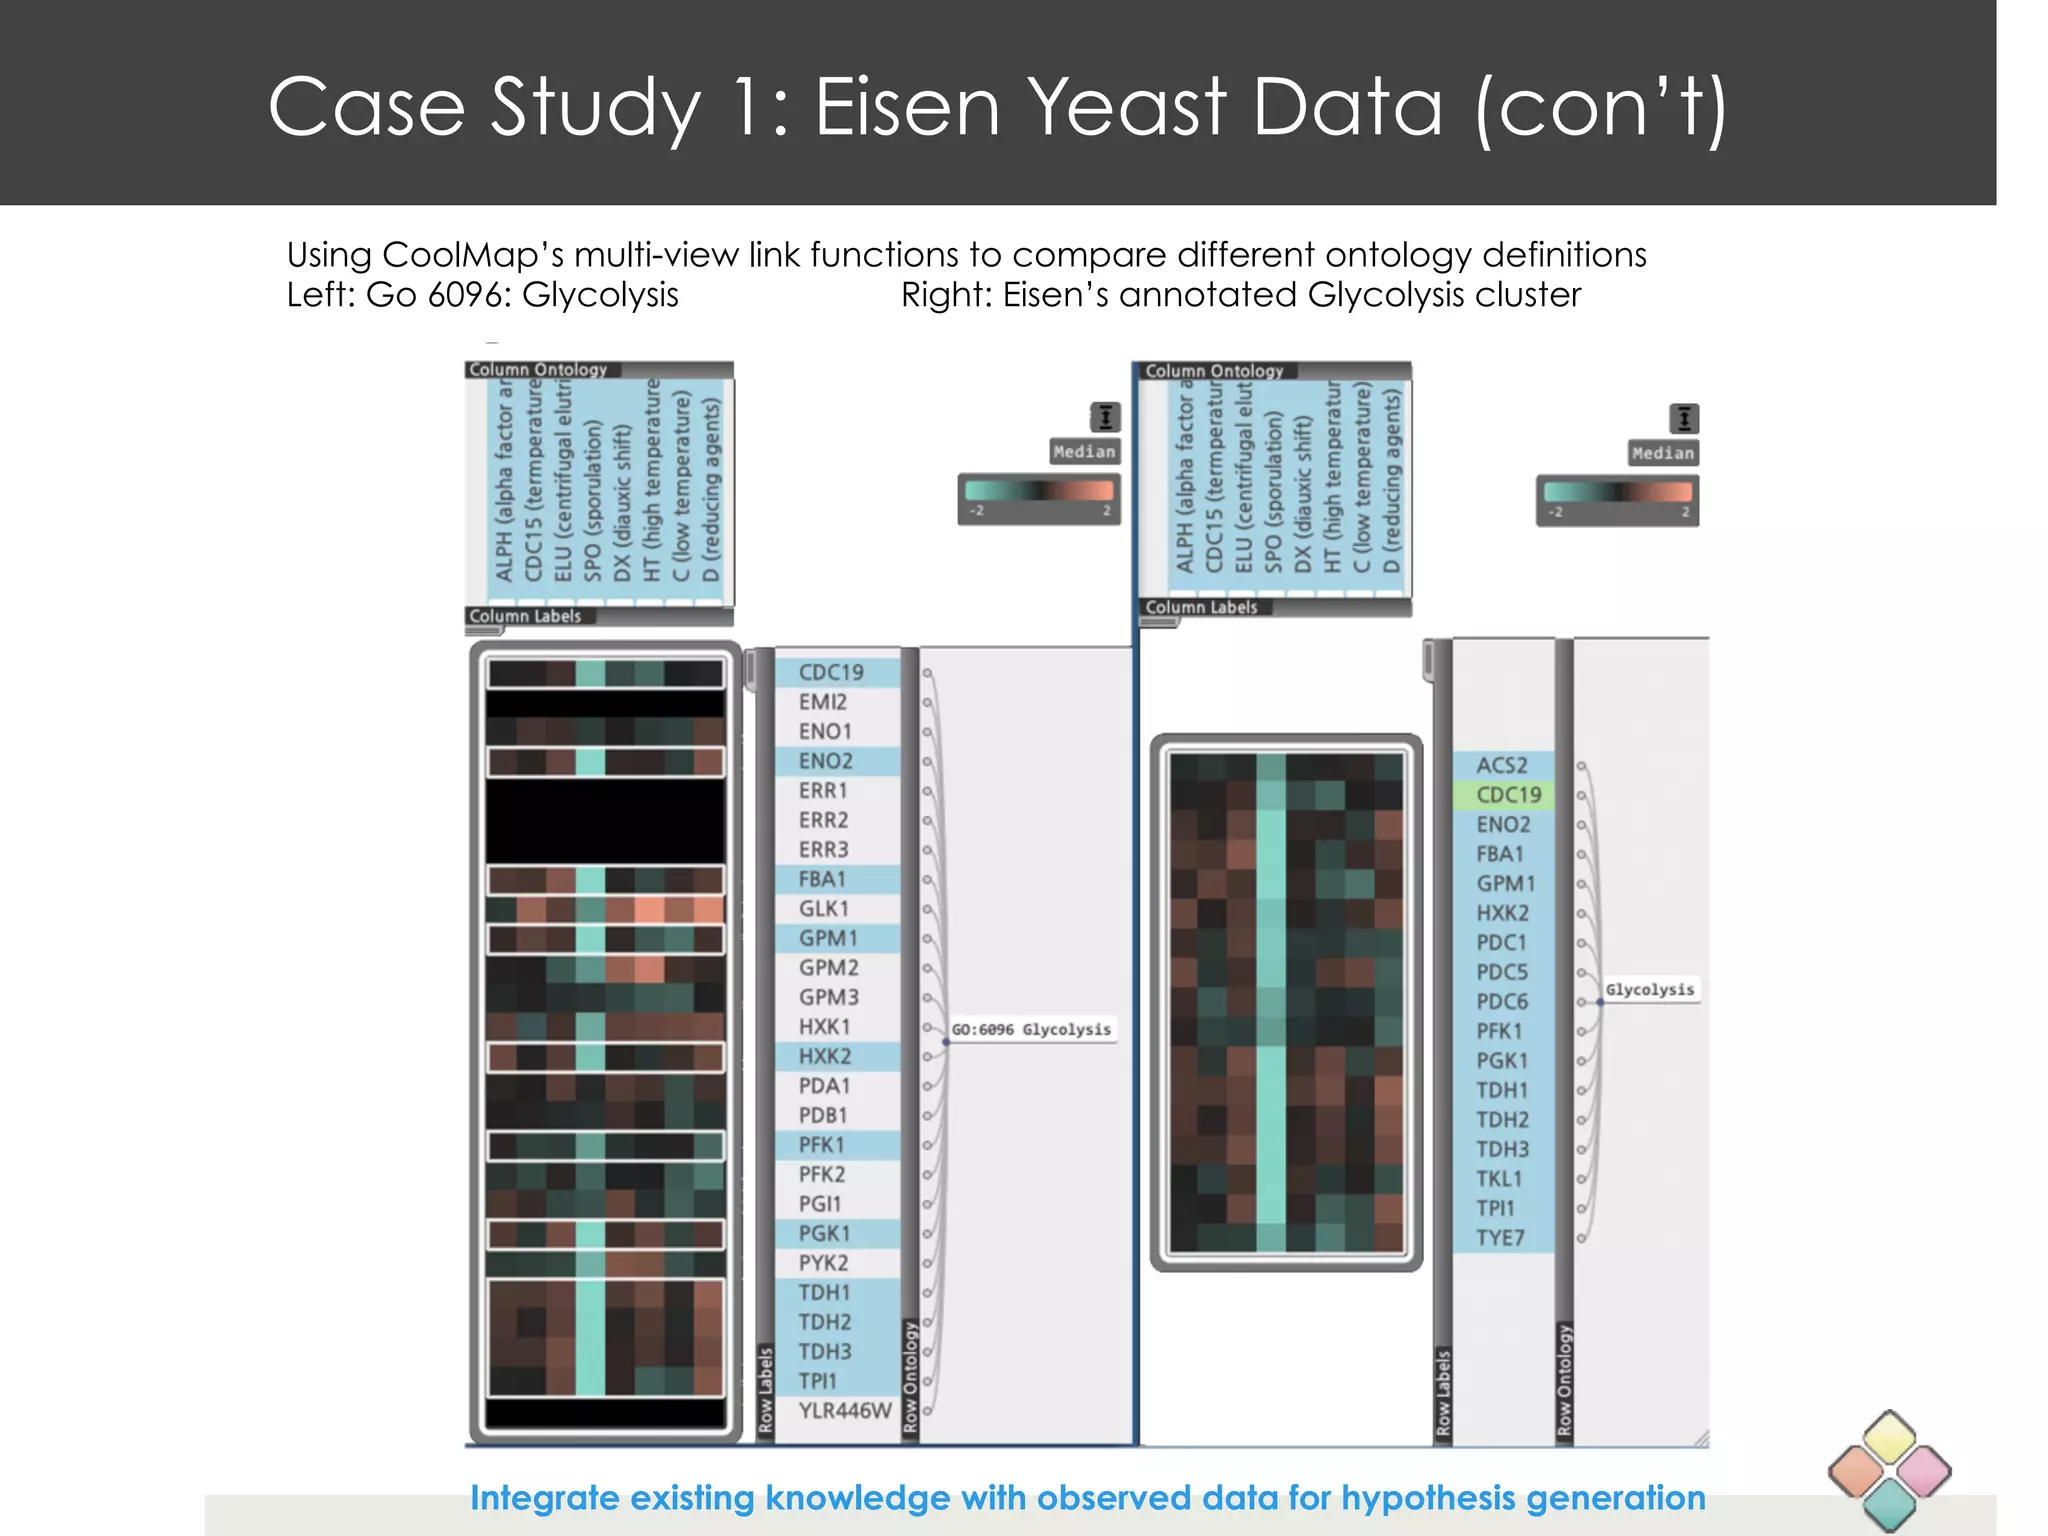
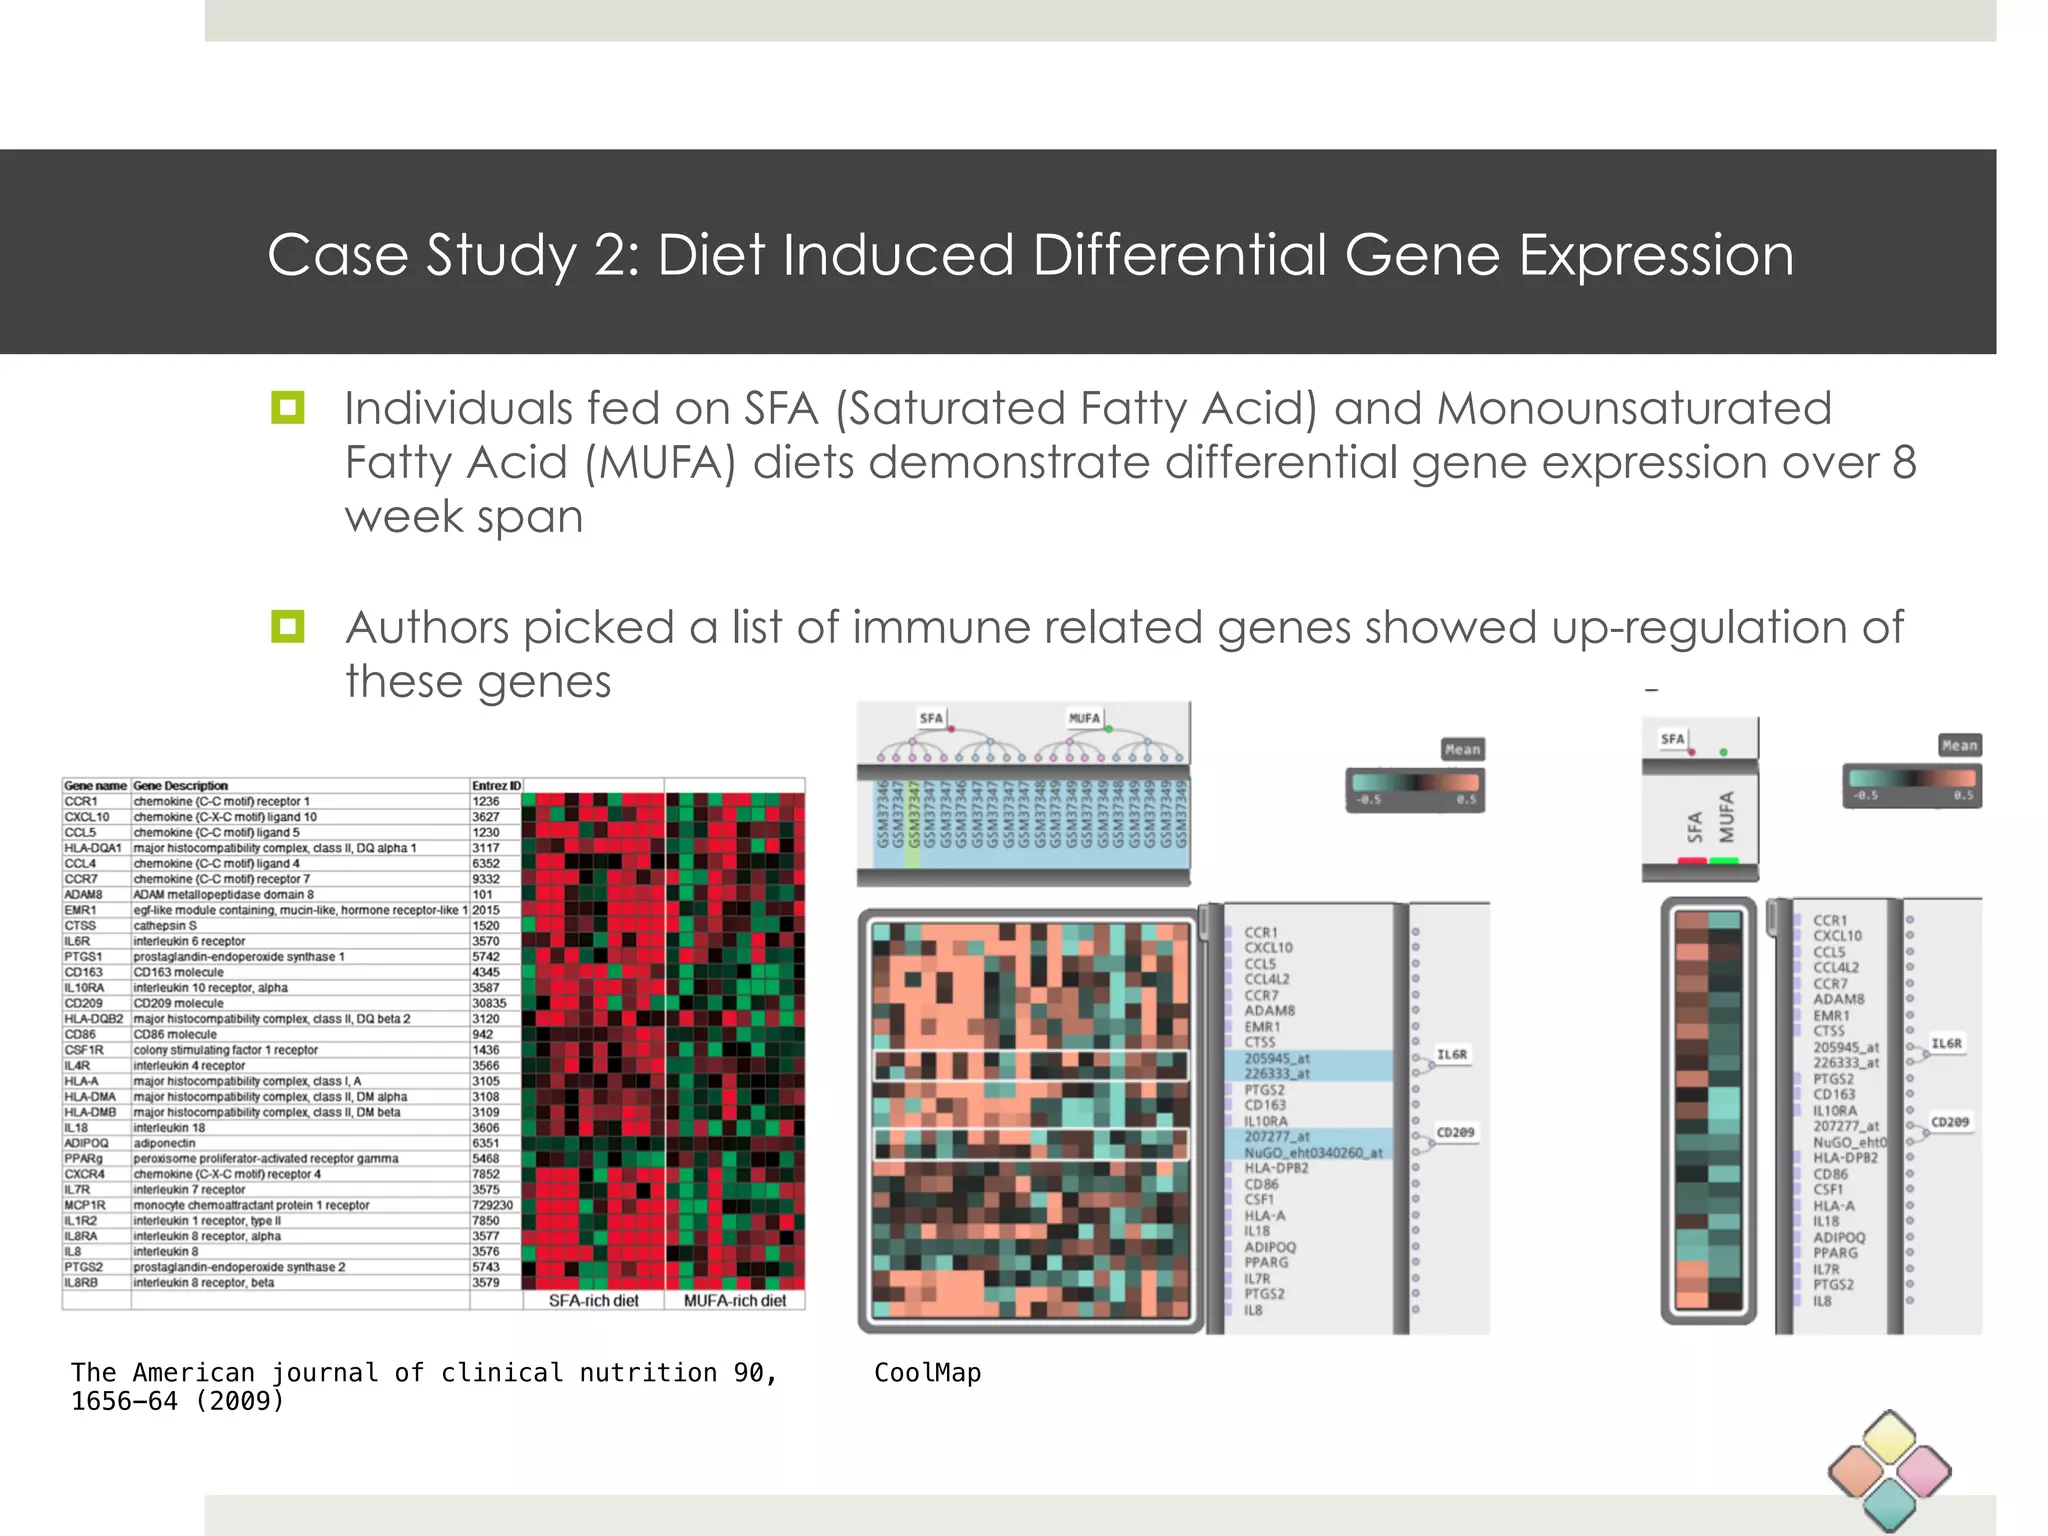
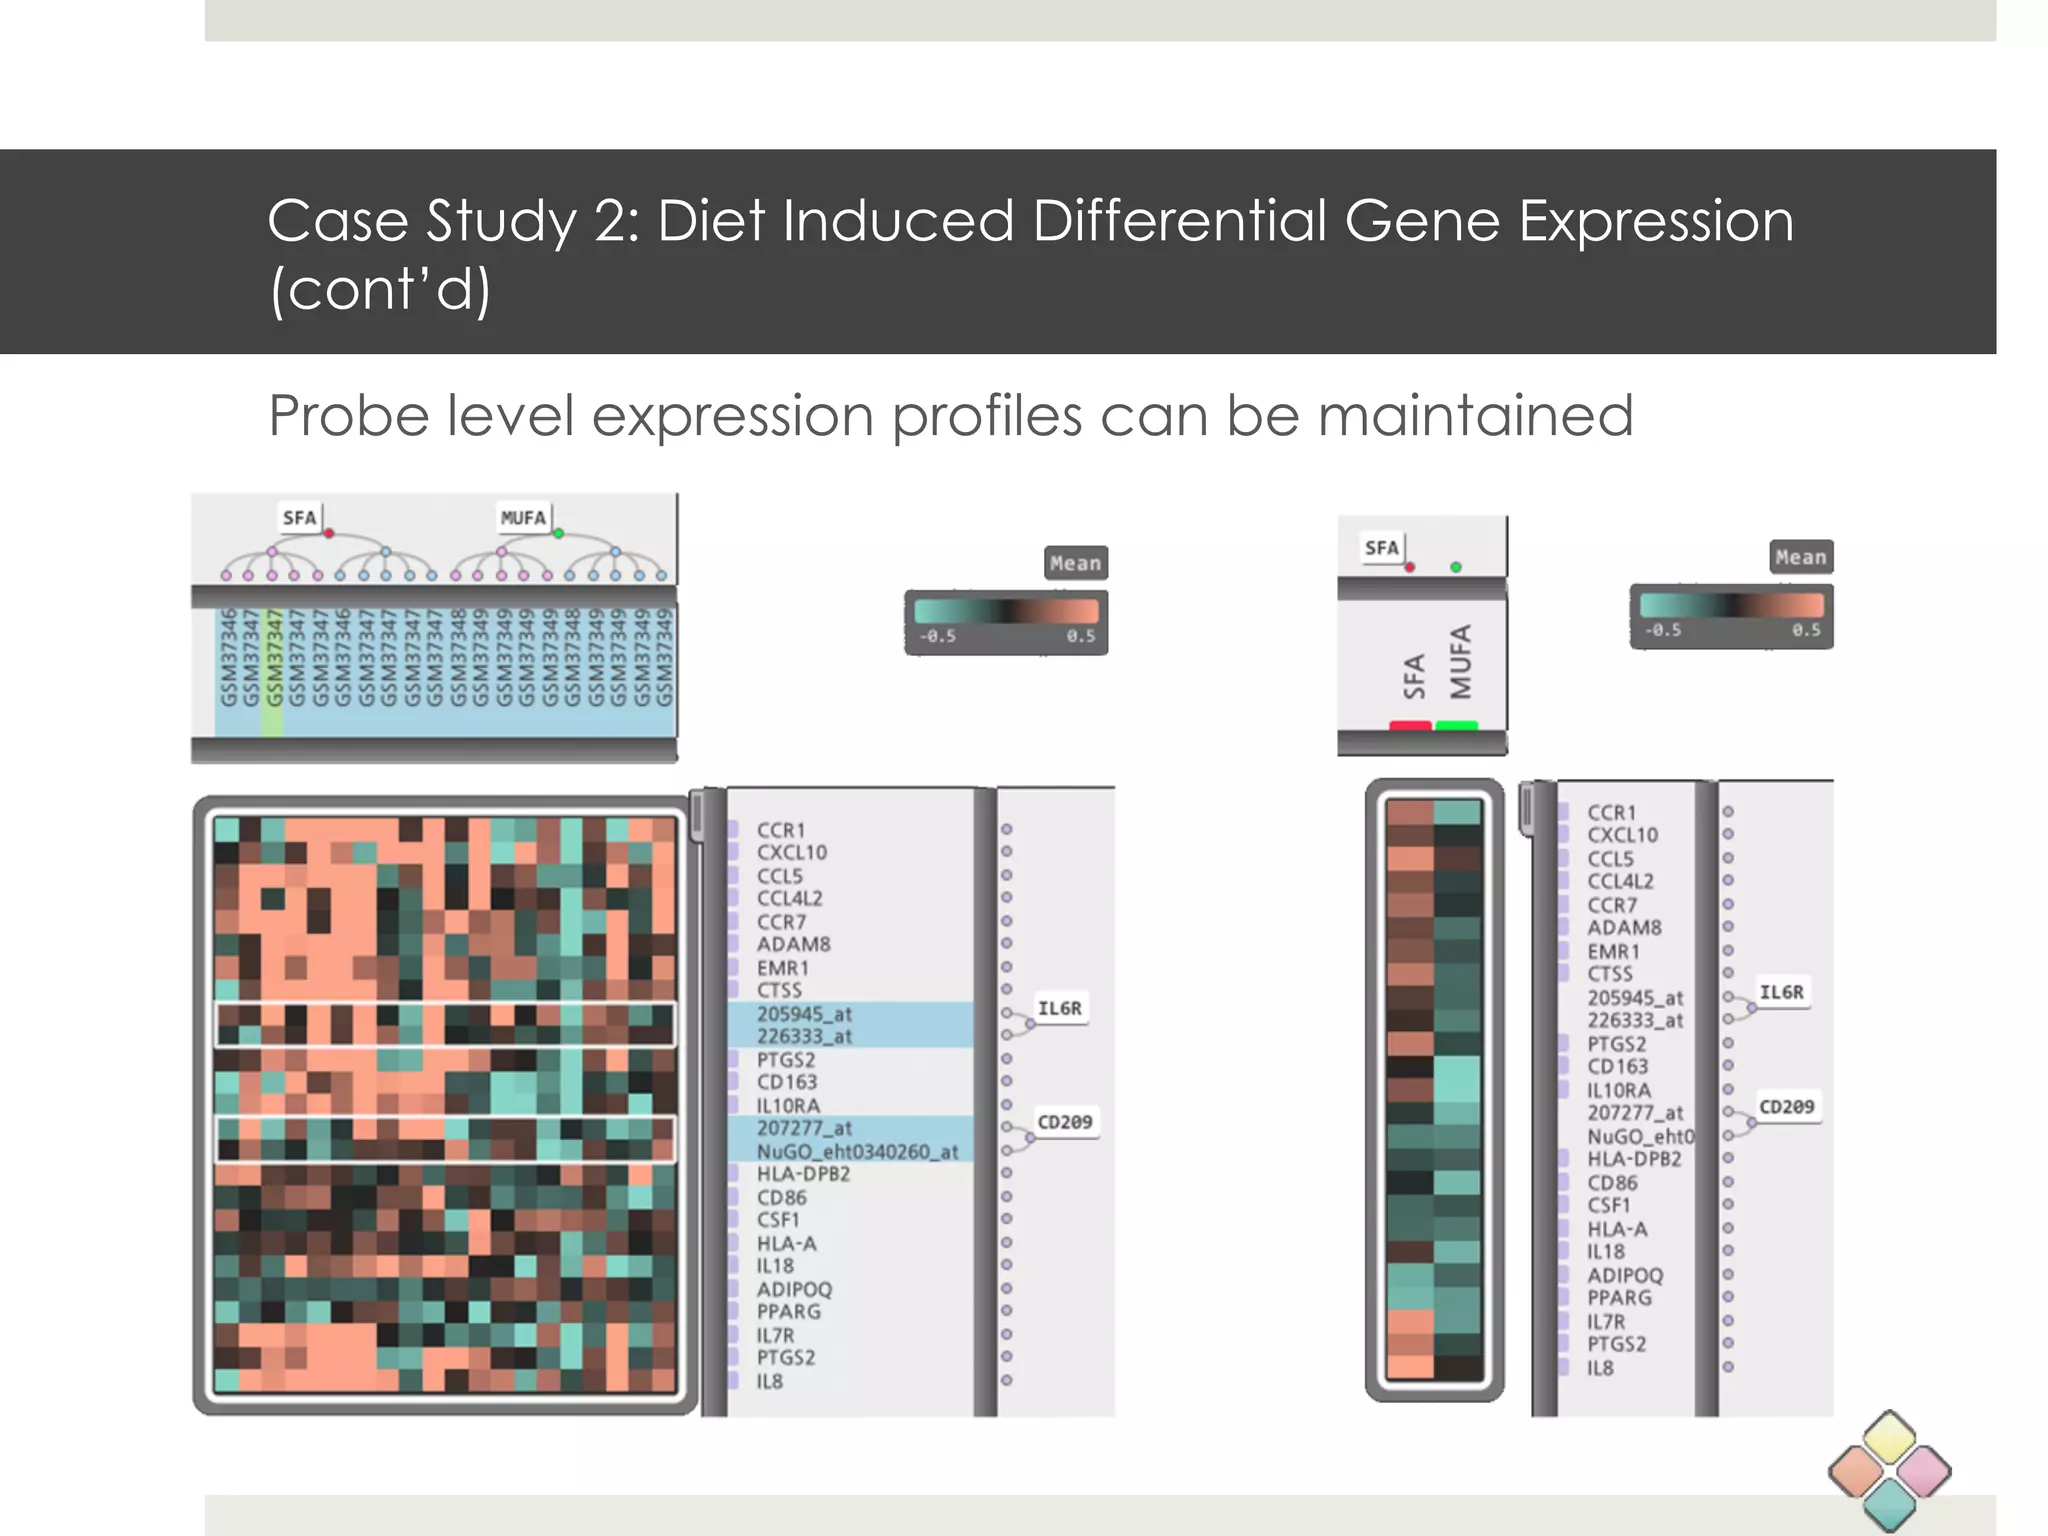
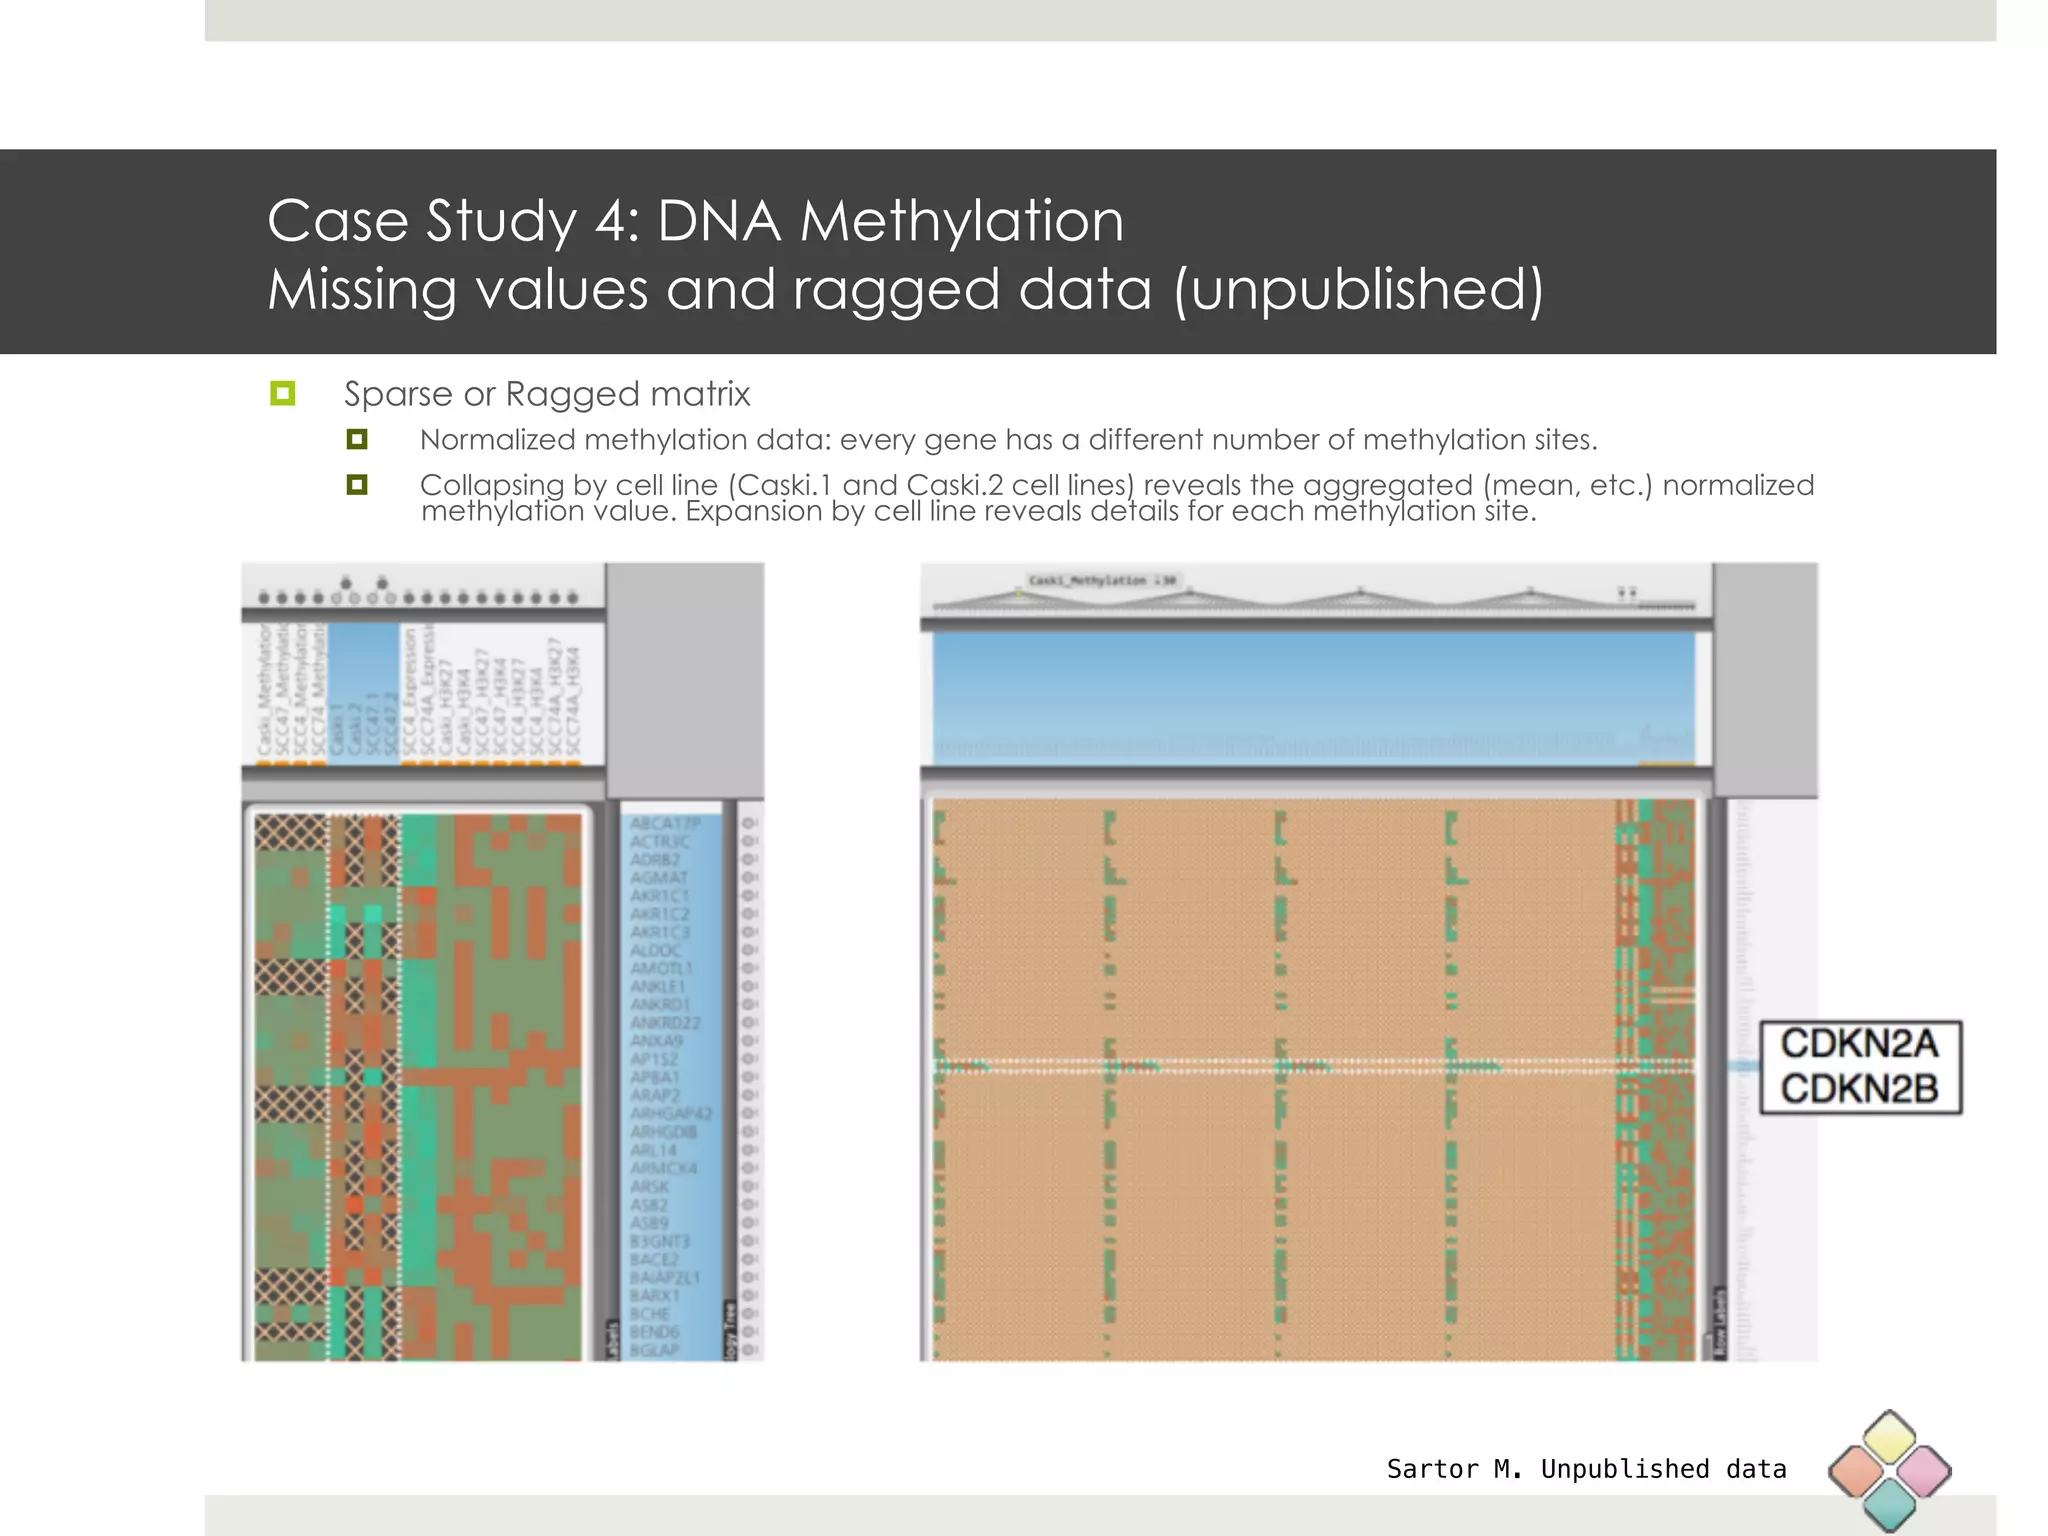
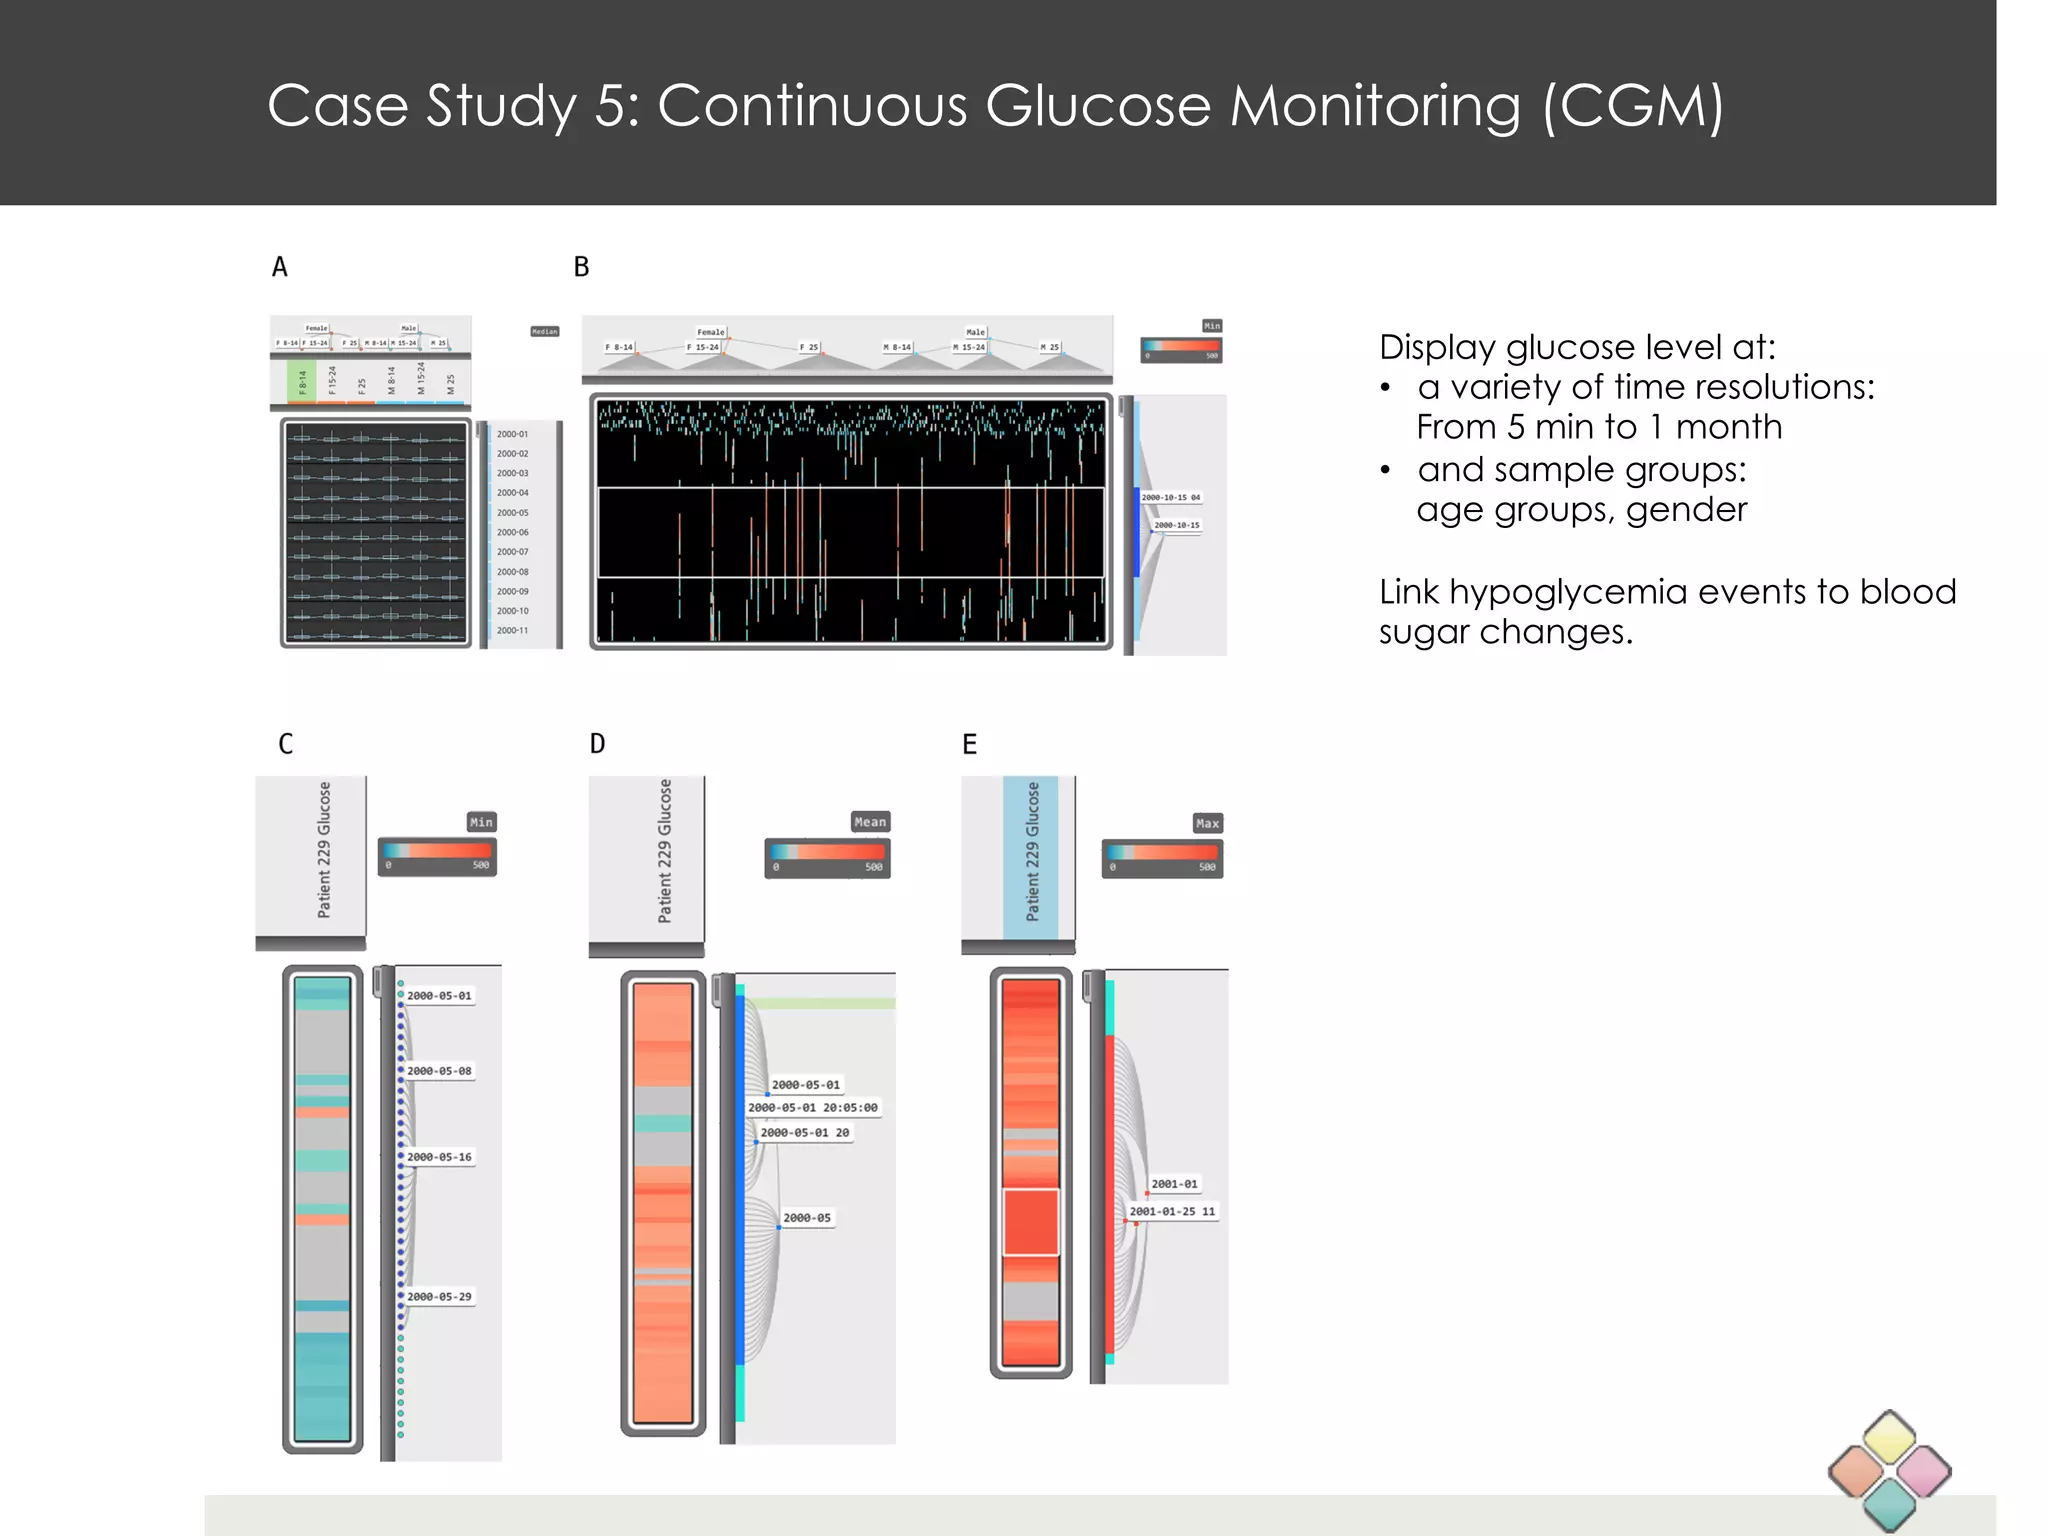
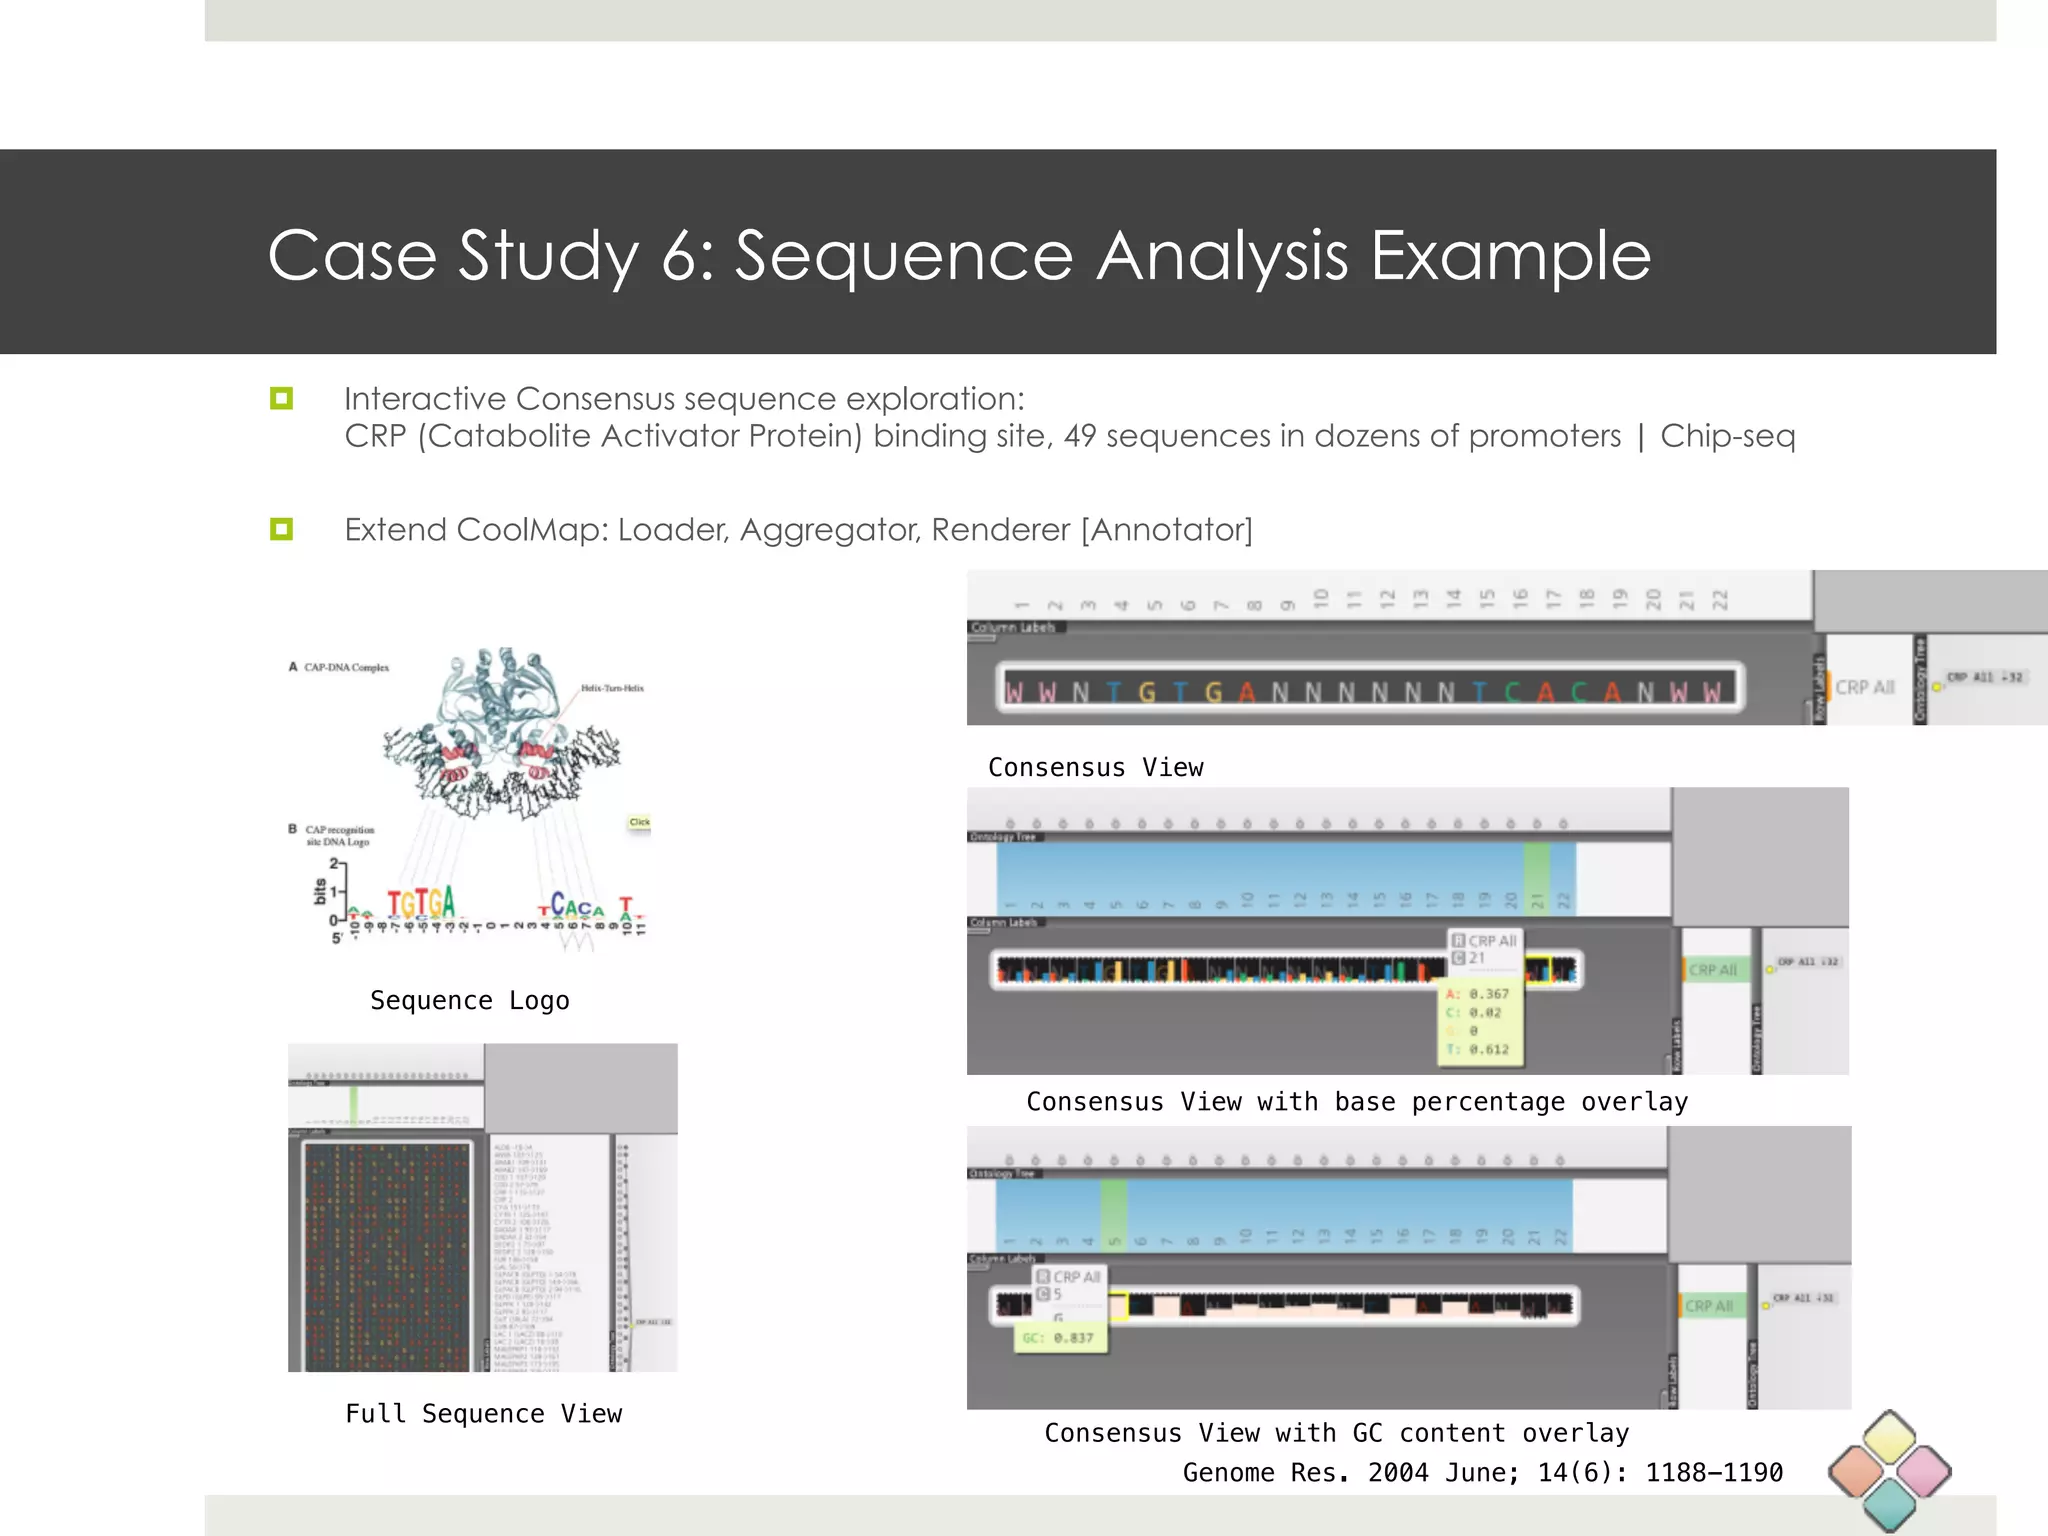
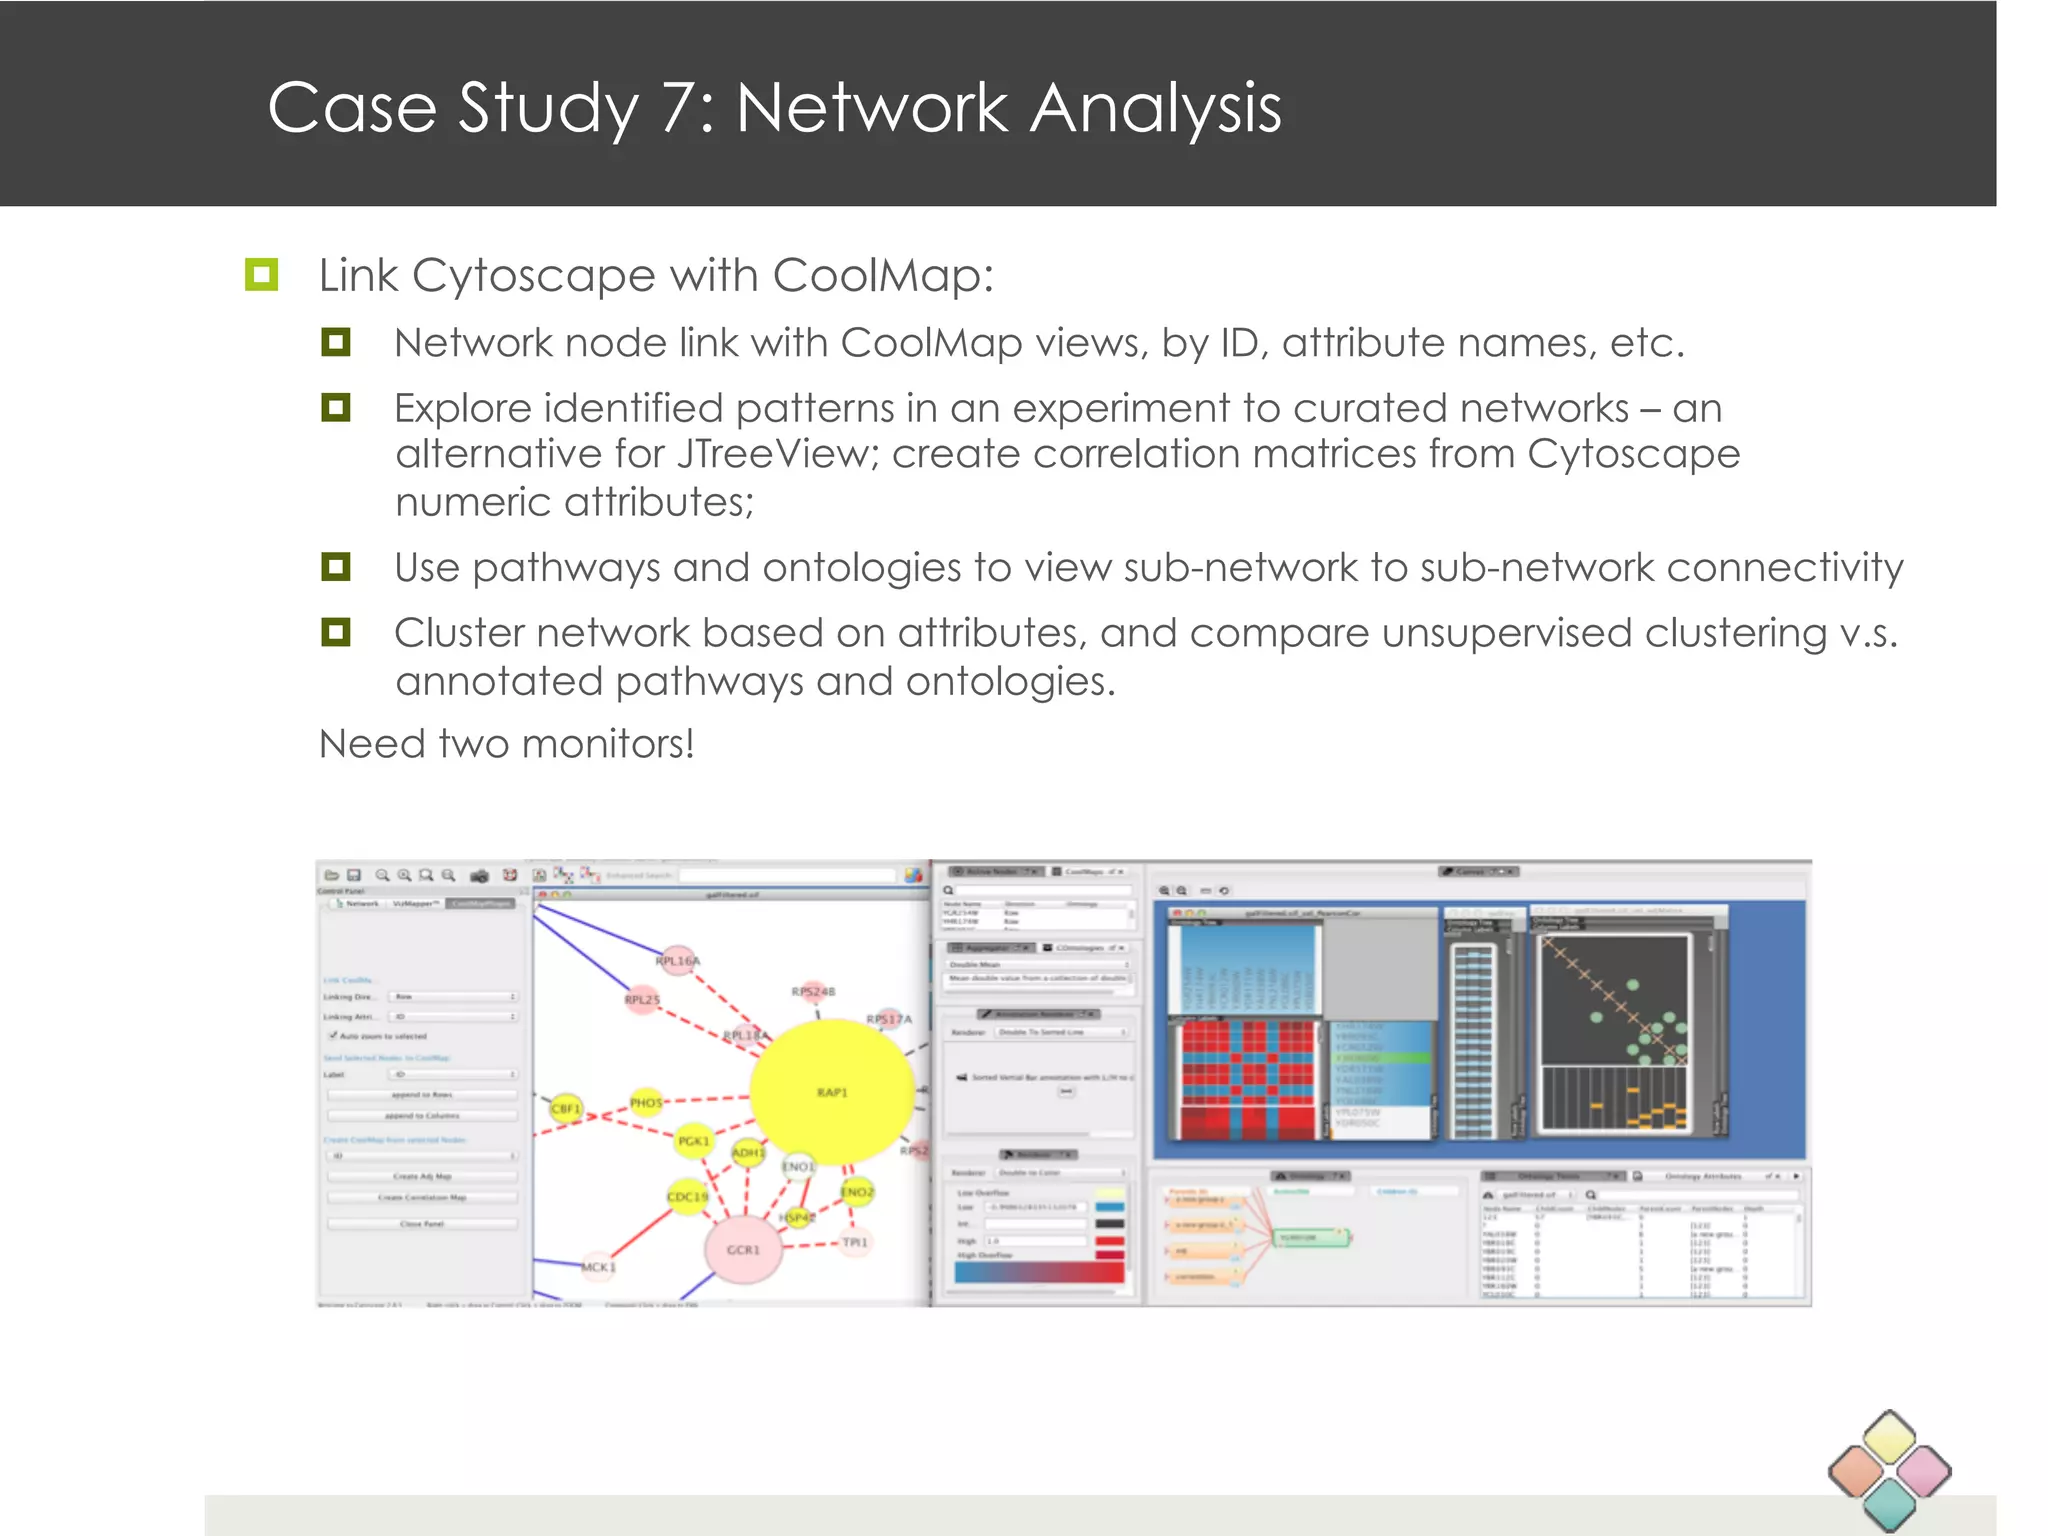
This document describes a new type of heatmap called a "CoolMap" that allows for flexible multi-scale exploration of molecular network data. CoolMaps allow data to be collapsed and aggregated at different levels of a hierarchical tree, enabling visualization and pattern discovery across scales. This approach addresses limitations of conventional heatmaps and enables linking data to existing biological knowledge. Several case studies demonstrate how CoolMaps can provide new insights into gene expression, nutrition, DNA methylation, glucose monitoring, and network data. The core concepts and near-ready software releases are presented, along with acknowledgments.
National Resource for Networks Biology's TR&D Theme 1: In this theme, we will develop a series of tools and methodologies for conducting differential analyses of biological networks perturbed under multiple conditions. The novel algorithmic methodologies enable us to make use of high-throughput proteomic level data to recover biological networks under specific biological perturbations. The software tools developed in this project enable researchers to further predict, analyze, and visualize the effects of these perturbations and alterations, while enabling researchers to aggregate additional information regarding the known roles of the involved interactions and their participants.
The NRNB has been funded as an NIGMS Biomedical Technology Research Resource since 2010. During the previous five-year period, NRNB investigators introduced a series of innovative methods for network biology including network-based biomarkers, network-based stratification of genomes, and automated inference of gene ontologies using network data. Over the next five years, we will seek to catalyze major phase transitions in how biological networks are represented and used, working across three broad themes: (1) From static to differential networks, (2) From descriptive to predictive networks, and (3) From flat to hierarchical networks bridging across scales. All of these efforts leverage and further support our growing stable of network technologies, including the popular Cytoscape network analysis infrastructure.
National Resource for Networks Biology's TR&D Theme 3: Although networks have been very useful for representing molecular interactions and mechanisms, network diagrams do not visually resemble the contents of cells. Rather, the cell involves a multi-scale hierarchy of components – proteins are subunits of protein complexes which, in turn, are parts of pathways, biological processes, organelles, cells, tissues, and so on. In this technology research project, we will pursue methods that move Network Biology towards such hierarchical, multi-scale views of cell structure and function.
Technology R&D Theme 2: From Descriptive to Predictive NetworksAlexander Pico
National Resource for Networks Biology's TR&D Theme 2: Genomics is mapping complex data about human biology and promises major medical advances. However, the routine use of genomics data in medical research is in its infancy, due mainly to the challenges of working with highly complex “big data”. In this theme, we will use network information to help organize, analyze and integrate these data into models that can be used to make clinically relevant diagnoses and predictions about an individual.
Summary: ENViz performs enrichment analysis for pathways and gene ontology (GO) terms in matched datasets of multiple data types (e.g. gene expression and metabolites or miRNA), then visualizes results as a Cytoscape network that can be navigated to show data overlaid on pathways and GO DAGs.
Background: Modern genomic, metabolomics, and proteomic assays produce multiplexed measurements that characterize molecular composition and biological activity from complimentary angles. Integrative analysis of such measurements remains a challenge to life science and biomedical researchers. We present an enrichment network approach to jointly analyzing two types of sample matched datasets and systematic annotations, implemented as a plugin to the Cytoscape [1] network biology software platform.
Approach: ENViz analyses a primary dataset (e.g. gene expression) with respect to a ‘pivot’ dataset (e.g. miRNA expression, metabolomics or proteomics measurements) and primary data annotation (e.g. pathway or GO). For each pivot entity, we rank elements of the primary data based on the correlation to the pivot across all samples, and compute statistical enrichment of annotation sets in the top of this ranked list based on minimum hypergeometric statistics [2]. Significant results are represented as an enrichment network - a bipartite graph with nodes corresponding to pivot and annotation entities, and edges corresponding to pivot-annotation pairs with statistical enrichmentscores above the user defined threshold. Correlations of primary data and pivot data are visually overlaid on biological pathways for significant pivot-annotation pairs using the WikiPathways resource [3], and on gene ontology terms. Edges of the enrichment network may point to functionally relevant mechanisms. In [4], a significant association between miR-19a and the cell-cycle module was substantiated as an association to proliferation, validated using a high-throughput transfection assay. The figures below show a pathway enrichment network, with pathway nodes green and miRNAs gray (left), network view of the edge between Inflammatory Response Pathway and mir-337-5p (center), and GO enrichment network with red areas indicating high enrichment for immune response and metabolic processes (right).
Presentation for NetBio SIG 2013 by Martina Kutmon, PhD Researcher in the BiGCaT Bioinformatics Dept at the University of Maastricht in the Netherlands. “Building Biological Regulatory Networks in Cytoscape Using CyTargetLinker”
Visualization and Analysis of Dynamic Networks Alexander Pico
DynNetwork development was taken up initially by Sabina Sara Pfister back in GSoC 2012. She laid out a strong foundation for dynamic network visualization in Cytoscape and my job was to extend the plugin’s functionality to help users analyse time changing networks. The two of us were mentored by Jason Montojo. We had developed a decent tool over the course of two GSoC programs to aid dynamic network analysis and our efforts culminated in DynNetwork getting accepted for an oral presentation at the International Network for Social Network Analysis (INSNA), Sunbelt 2014 which was held in St. Petersburg, FL in February.
Community Finding with Applications on Phylogenetic Networks [Extended Abstract]Luís Rita
[Master Thesis Extended Abstract]
With the advent of high-throughput sequencing methods, new ways of visualizing and analyzing increasingly amounts of data are needed. Although some software already exist, they do not scale well or require advanced skills to be useful in phylogenetics.
The aim of this thesis was to implement three community finding algorithms – Louvain, Infomap and Layered Label Propagation (LLP); to benchmark them using two synthetic networks – Girvan-Newman (GN) and Lancichinetti-Fortunato-Radicchi (LFR); to test them in real networks, particularly, in one derived from a Staphylococcus aureus MLST dataset; to compare visualization frameworks – Cytoscape.js and D3.js, and, finally, to make it all available online (mscthesis.herokuapp.com).
Louvain, Infomap and LLP were implemented in JavaScript. Unless otherwise stated, next conclusions are valid for GN and LFR. In terms of speed, Louvain outperformed all others. Considering accuracy, in networks with well-defined communities, Louvain was the most accurate. For higher mixing, LLP was the best. Contrarily to weakly mixed, it is advantageous to increase the resolution parameter in highly mixed GN. In LFR, higher resolution decreases the accuracy of detection, independently of the mixing parameter. The increase of the average node degree enhanced partitioning accuracy and suggested detection by chance was minimized. It is computationally more intensive to generate GN with higher mixing or average degree, using the algorithm developed in the thesis or the LFR implementation. In S. aureus network, Louvain was the fastest and the most accurate in detecting the clusters of seven groups of strains directly evolved from the common ancestor.
Visual Exploration of Clinical and Genomic Data for Patient StratificationNils Gehlenborg
Talk presented at the Simons Foundation Biotech Symposium "Complex Data Visualization: Approach and Application" (12 September 2014)
http://www.simonsfoundation.org/event/complex-data-visualization-approach-and-application/
In this talk I describe how we integrated a sophisticated computational framework directly into the StratomeX visualization technique to enable rapid exploration of tens of thousands of stratifications in cancer genomics data, creating a unique and powerful tool for the identification and characterization of tumor subtypes. The tool can handle a wide range of genomic and clinical data types for cohorts with hundreds of patients. StratomeX also provides direct access to comprehensive data sets generated by The Cancer Genome Atlas Firehose analysis pipeline.
http://stratomex.caleydo.org
The increased availability of biomedical data, particularly in the public domain, offers the opportunity to better understand human health and to develop effective therapeutics for a wide range of unmet medical needs. However, data scientists remain stymied by the fact that data remain hard to find and to productively reuse because data and their metadata i) are wholly inaccessible, ii) are in non-standard or incompatible representations, iii) do not conform to community standards, and iv) have unclear or highly restricted terms and conditions that preclude legitimate reuse. These limitations require a rethink on data can be made machine and AI-ready - the key motivation behind the FAIR Guiding Principles. Concurrently, while recent efforts have explored the use of deep learning to fuse disparate data into predictive models for a wide range of biomedical applications, these models often fail even when the correct answer is already known, and fail to explain individual predictions in terms that data scientists can appreciate. These limitations suggest that new methods to produce practical artificial intelligence are still needed.
In this talk, I will discuss our work in (1) building an integrative knowledge infrastructure to prepare FAIR and "AI-ready" data and services along with (2) neurosymbolic AI methods to improve the quality of predictions and to generate plausible explanations. Attention is given to standards, platforms, and methods to wrangle knowledge into simple, but effective semantic and latent representations, and to make these available into standards-compliant and discoverable interfaces that can be used in model building, validation, and explanation. Our work, and those of others in the field, creates a baseline for building trustworthy and easy to deploy AI models in biomedicine.
Bio
Dr. Michel Dumontier is the Distinguished Professor of Data Science at Maastricht University, founder and executive director of the Institute of Data Science, and co-founder of the FAIR (Findable, Accessible, Interoperable and Reusable) data principles. His research explores socio-technological approaches for responsible discovery science, which includes collaborative multi-modal knowledge graphs, privacy-preserving distributed data mining, and AI methods for drug discovery and personalized medicine. His work is supported through the Dutch National Research Agenda, the Netherlands Organisation for Scientific Research, Horizon Europe, the European Open Science Cloud, the US National Institutes of Health, and a Marie-Curie Innovative Training Network. He is the editor-in-chief for the journal Data Science and is internationally recognized for his contributions in bioinformatics, biomedical informatics, and semantic technologies including ontologies and linked data.
Principle of DNA Microarray Technique
The principle of DNA microarrays lies on the hybridization between the nucleic acid strands.
The property of complementary nucleic acid sequences is to specifically pair with each other by forming hydrogen bonds between complementary nucleotide base pairs.
large data set is not available for some disease such as Brain Tumor. This and part2 presentation shows how to find "Actionable solution from a difficult cancer dataset
Making effective use of graphics processing units (GPUs) in computationsOregon State University
Graphics processing units (GPUs) are specialized computer processors used in computers and video game systems to accelerate the creation and display of images. Due to their inherent parallel structure, they also have great potential to speed up computations in many scientific and engineering applications. GPUs are attractive for their ability to perform a large number of computations in parallel at an attractive price. Many of the world¹s largest supercomputers use GPUs to achieve their high performance, and personal computers and laptops use them for graphics displays and image processing. This seminar will explore the use of GPUs in general, describe examples of the use of GPUs in computations, and introduce some best practices for GPU computing.
CINECA webinar slides: Modular and reproducible workflows for federated molec...CINECAProject
Genetic analysis of molecular traits such as gene expression, splicing and chromatin accessibility requires a number of complex analysis steps that can easily take weeks or months for a analyst to implement from scratch. In the CINECA project, we have developed a number of modular Nextflow workflows that standardise and automate these steps. In this webinar, we will give an overview of the CINECA workflows for genotype imputation, gene expression and splicing quantification, data normalisation and association testing, and demonstrate how these workflows can be used in a federated setting without transferring identifiable personal data between partners.
The CINECA webinar series aims to discuss ways to address common challenges and share best practices in the field of cohort data analysis, as well as distribute CINECA project results. All CINECA webinars include an audience Q&A session during which attendees can ask questions and make suggestions. Please note that all webinars are recorded and available for posterior viewing.
This webinar took place on 10th November 2020 and is part of the CINECA webinar series.
For previous and upcoming CINECA webinars see:
https://www.cineca-project.eu/webinars
Introduction to graph databases and Neo4j for the bachelors student in Life sciences. Hands-on workshop for Neo4j and Cypher query language. The source of material for the hands-on training is: https://neo4j.com/graphacademy/online-training/introduction-to-neo4j/
Keynote presentation for Network Biology SIG 2013 by Esti Yeger-Lotem, Senior Lecturer in Clinical Biochemistry at The National Institute for Biotechnology in the Negev, Israel
Report Back from SGO 2024: What’s the Latest in Cervical Cancer?bkling
Are you curious about what’s new in cervical cancer research or unsure what the findings mean? Join Dr. Emily Ko, a gynecologic oncologist at Penn Medicine, to learn about the latest updates from the Society of Gynecologic Oncology (SGO) 2024 Annual Meeting on Women’s Cancer. Dr. Ko will discuss what the research presented at the conference means for you and answer your questions about the new developments.
Lung Cancer: Artificial Intelligence, Synergetics, Complex System Analysis, S...Oleg Kshivets
RESULTS: Overall life span (LS) was 2252.1±1742.5 days and cumulative 5-year survival (5YS) reached 73.2%, 10 years – 64.8%, 20 years – 42.5%. 513 LCP lived more than 5 years (LS=3124.6±1525.6 days), 148 LCP – more than 10 years (LS=5054.4±1504.1 days).199 LCP died because of LC (LS=562.7±374.5 days). 5YS of LCP after bi/lobectomies was significantly superior in comparison with LCP after pneumonectomies (78.1% vs.63.7%, P=0.00001 by log-rank test). AT significantly improved 5YS (66.3% vs. 34.8%) (P=0.00000 by log-rank test) only for LCP with N1-2. Cox modeling displayed that 5YS of LCP significantly depended on: phase transition (PT) early-invasive LC in terms of synergetics, PT N0—N12, cell ratio factors (ratio between cancer cells- CC and blood cells subpopulations), G1-3, histology, glucose, AT, blood cell circuit, prothrombin index, heparin tolerance, recalcification time (P=0.000-0.038). Neural networks, genetic algorithm selection and bootstrap simulation revealed relationships between 5YS and PT early-invasive LC (rank=1), PT N0—N12 (rank=2), thrombocytes/CC (3), erythrocytes/CC (4), eosinophils/CC (5), healthy cells/CC (6), lymphocytes/CC (7), segmented neutrophils/CC (8), stick neutrophils/CC (9), monocytes/CC (10); leucocytes/CC (11). Correct prediction of 5YS was 100% by neural networks computing (area under ROC curve=1.0; error=0.0).
CONCLUSIONS: 5YS of LCP after radical procedures significantly depended on: 1) PT early-invasive cancer; 2) PT N0--N12; 3) cell ratio factors; 4) blood cell circuit; 5) biochemical factors; 6) hemostasis system; 7) AT; 8) LC characteristics; 9) LC cell dynamics; 10) surgery type: lobectomy/pneumonectomy; 11) anthropometric data. Optimal diagnosis and treatment strategies for LC are: 1) screening and early detection of LC; 2) availability of experienced thoracic surgeons because of complexity of radical procedures; 3) aggressive en block surgery and adequate lymph node dissection for completeness; 4) precise prediction; 5) adjuvant chemoimmunoradiotherapy for LCP with unfavorable prognosis.
Factory Supply Best Quality Pmk Oil CAS 28578–16–7 PMK Powder in Stockrebeccabio
Factory Supply Best Quality Pmk Oil CAS 28578–16–7 PMK Powder in Stock
Telegram: bmksupplier
signal: +85264872720
threema: TUD4A6YC
You can contact me on Telegram or Threema
Communicate promptly and reply
Free of customs clearance, Double Clearance 100% pass delivery to USA, Canada, Spain, Germany, Netherland, Poland, Italy, Sweden, UK, Czech Republic, Australia, Mexico, Russia, Ukraine, Kazakhstan.Door to door service
Hot Selling Organic intermediates
These simplified slides by Dr. Sidra Arshad present an overview of the non-respiratory functions of the respiratory tract.
Learning objectives:
1. Enlist the non-respiratory functions of the respiratory tract
2. Briefly explain how these functions are carried out
3. Discuss the significance of dead space
4. Differentiate between minute ventilation and alveolar ventilation
5. Describe the cough and sneeze reflexes
Study Resources:
1. Chapter 39, Guyton and Hall Textbook of Medical Physiology, 14th edition
2. Chapter 34, Ganong’s Review of Medical Physiology, 26th edition
3. Chapter 17, Human Physiology by Lauralee Sherwood, 9th edition
4. Non-respiratory functions of the lungs https://academic.oup.com/bjaed/article/13/3/98/278874
Couples presenting to the infertility clinic- Do they really have infertility...Sujoy Dasgupta
Dr Sujoy Dasgupta presented the study on "Couples presenting to the infertility clinic- Do they really have infertility? – The unexplored stories of non-consummation" in the 13th Congress of the Asia Pacific Initiative on Reproduction (ASPIRE 2024) at Manila on 24 May, 2024.
Tom Selleck Health: A Comprehensive Look at the Iconic Actor’s Wellness Journeygreendigital
Tom Selleck, an enduring figure in Hollywood. has captivated audiences for decades with his rugged charm, iconic moustache. and memorable roles in television and film. From his breakout role as Thomas Magnum in Magnum P.I. to his current portrayal of Frank Reagan in Blue Bloods. Selleck's career has spanned over 50 years. But beyond his professional achievements. fans have often been curious about Tom Selleck Health. especially as he has aged in the public eye.
Follow us on: Pinterest
Introduction
Many have been interested in Tom Selleck health. not only because of his enduring presence on screen but also because of the challenges. and lifestyle choices he has faced and made over the years. This article delves into the various aspects of Tom Selleck health. exploring his fitness regimen, diet, mental health. and the challenges he has encountered as he ages. We'll look at how he maintains his well-being. the health issues he has faced, and his approach to ageing .
Early Life and Career
Childhood and Athletic Beginnings
Tom Selleck was born on January 29, 1945, in Detroit, Michigan, and grew up in Sherman Oaks, California. From an early age, he was involved in sports, particularly basketball. which played a significant role in his physical development. His athletic pursuits continued into college. where he attended the University of Southern California (USC) on a basketball scholarship. This early involvement in sports laid a strong foundation for his physical health and disciplined lifestyle.
Transition to Acting
Selleck's transition from an athlete to an actor came with its physical demands. His first significant role in "Magnum P.I." required him to perform various stunts and maintain a fit appearance. This role, which he played from 1980 to 1988. necessitated a rigorous fitness routine to meet the show's demands. setting the stage for his long-term commitment to health and wellness.
Fitness Regimen
Workout Routine
Tom Selleck health and fitness regimen has evolved. adapting to his changing roles and age. During his "Magnum, P.I." days. Selleck's workouts were intense and focused on building and maintaining muscle mass. His routine included weightlifting, cardiovascular exercises. and specific training for the stunts he performed on the show.
Selleck adjusted his fitness routine as he aged to suit his body's needs. Today, his workouts focus on maintaining flexibility, strength, and cardiovascular health. He incorporates low-impact exercises such as swimming, walking, and light weightlifting. This balanced approach helps him stay fit without putting undue strain on his joints and muscles.
Importance of Flexibility and Mobility
In recent years, Selleck has emphasized the importance of flexibility and mobility in his fitness regimen. Understanding the natural decline in muscle mass and joint flexibility with age. he includes stretching and yoga in his routine. These practices help prevent injuries, improve posture, and maintain mobilit
Explore natural remedies for syphilis treatment in Singapore. Discover alternative therapies, herbal remedies, and lifestyle changes that may complement conventional treatments. Learn about holistic approaches to managing syphilis symptoms and supporting overall health.
TEST BANK for Operations Management, 14th Edition by William J. Stevenson, Ve...kevinkariuki227
TEST BANK for Operations Management, 14th Edition by William J. Stevenson, Verified Chapters 1 - 19, Complete Newest Version.pdf
HOT NEW PRODUCT! BIG SALES FAST SHIPPING NOW FROM CHINA!! EU KU DB BK substit...GL Anaacs
Contact us if you are interested:
Email / Skype : kefaya1771@gmail.com
Threema: PXHY5PDH
New BATCH Ku !!! MUCH IN DEMAND FAST SALE EVERY BATCH HAPPY GOOD EFFECT BIG BATCH !
Contact me on Threema or skype to start big business!!
Hot-sale products:
NEW HOT EUTYLONE WHITE CRYSTAL!!
5cl-adba precursor (semi finished )
5cl-adba raw materials
ADBB precursor (semi finished )
ADBB raw materials
APVP powder
5fadb/4f-adb
Jwh018 / Jwh210
Eutylone crystal
Protonitazene (hydrochloride) CAS: 119276-01-6
Flubrotizolam CAS: 57801-95-3
Metonitazene CAS: 14680-51-4
Payment terms: Western Union,MoneyGram,Bitcoin or USDT.
Deliver Time: Usually 7-15days
Shipping method: FedEx, TNT, DHL,UPS etc.Our deliveries are 100% safe, fast, reliable and discreet.
Samples will be sent for your evaluation!If you are interested in, please contact me, let's talk details.
We specializes in exporting high quality Research chemical, medical intermediate, Pharmaceutical chemicals and so on. Products are exported to USA, Canada, France, Korea, Japan,Russia, Southeast Asia and other countries.
31. Heatmap… What is it?
‘CoolMap.. I, am your father’
¤ One of the most popular way of visualizing tabular
data
¤ X column, Y row, value color
¤ Trees for hierarchical clustering, or groups are often drawn
along the sides
¤ Great format for visual exploration and pattern discovery
¤ Used along with node-edge network views such as
Cytoscape-clusterExplorer
¤ The paradigm remains largely unchanged
The American Statistician, 2009;!
PNAS Dec. 8, 1998 Vol. 95 No. 25 14863-14868!
Czekanowski (1909)! Brinton (1914)!Loua (1873)! Eisen (1998)!
12k citations!
32. The Good, the Bad, and the Ugly…
of the conventional heatmaps
¤ The Good
¤ Mapping number to color makes it intuitive
¤ Clustering patterns become conspicuous and interpretable
¤ The Bad
¤ Increasingly difficult to visualize and explore big datasets
¤ Difficult for data other than numeric
¤ The Ugly
¤ Difficult to incorporate existing annotations such as pathways and ontologies
¤ Difficult to visualize high-level relationships such as overall pathway to
pathway correlations
The “Figure 1” Phenomena
33. There are known knowns, and there are known unknowns.
PLoS Genet. 2008 Mar 14;4(3):e1000034! BMC Bioinformatics. 2011; 12(Suppl 1); 2011!
How do we relate the unknown to the known:
From observed patterns to existing knowledge interactively and intuitively?
35. The CoolMap Solution:
Nuts and Bolts
¤ Core concept: ‘Collapsible Heatmap’
¤ The tree nodes can be expanded/collapsed at any level:
¤ Think about a two-way multi tree
¤ Collapsed data are represented using aggregation functions (mean,
median, etc.)
¤ The aggregation enables the user to explore data at multiple levels:
¤ Identify potential signals from high level aggregated views
¤ Expand nodes or interest, while keeping the context around
!
Using mean to collapse four
numeric cells
The two way tree can be expanded and
collapsed at multiple levels
36. CoolMap: Core Design Concepts
¤ Extensible Interfaces:
¤ A Loader that imports custom data objects into a ‘base’ matrix
¤ An aggregator that transforms a group of ‘base’ data objects into a ‘view’ data object
¤ A render that renders the ‘view’ data object to the designated region in the interactive view
Example:
¤ Gene expression values of all genes in pathway A, sample group B, aggregated using median,
and rendered in color
[0.5, 1, 2.1, 3.2, 4.3] [2.1]
¤ Nucleotide sequences belong to the same transcription factor binding sites, aggregated using
IUPAC consensus code to a single letter, and rendered in text:
[A,A,A,A,T] [A] A
¤ The ‘base’ matrix can use a variety of data structures, such as arrays, lists, sparse matrices or even remote
services
¤ Flexible Row/Column Ontological Trees:
¤ Multiple-inheritance tree
¤ Genes or metabolites may be shared by multiple pathways or ontological terms, and may
occur more than once.
¤ Trees from different sources
¤ Side by side comparison of different ontologies (GO, KEGG, Hierarchical Clustering)
¤ Trees may be used at any level
¤ Tree nodes at any level can be inserted into any place in the tree.
37. Near-ready Releases
¤ CoolMap Core
¤ Core interfaces, data structures and utility functions for base matrix, view
matrix, ontology trees, renderers, interactive view panels, etc.
¤ CoolMap Application
¤ An application with auxiliary modules such as dynamic multiple dataset
synchronization, searcher, filters, sorters, data persistence etc.
¤ Followed many best practices from Cytoscape
¤ CoolMap Cytoscape Prototype Plugin
¤ A Cytoscape plugin that enables two way communication between
Cytoscape and CoolMap
Our user classroom user study of a group of undergraduate students
with preliminary computer and bioinformatics background shows:
65% found it easy or not difficult to learn
74% highly enjoyed or enjoyed the software
39. Case Study 1: Eisen Yeast Data
Eisen (1998)!
Gene expression fold change of selected gene groups and experiment conditions
CoolMap makes it easier to interpret data from the higher concept levels
CoolMap!
40. Case Study 1: Eisen Yeast Data (con’t)
CoolMap reveals more than meets the eye from conventional heatmaps
The peculiar outlier sample of spo5 2
Fold change reversed across many pathways
Easier to identify in the aggregated view
í
41. Case Study 1: Eisen Yeast Data (con’t)
Using CoolMap’s multi-view link functions to compare different ontology definitions
Left: Go 6096: Glycolysis Right: Eisen’s annotated Glycolysis cluster
Integrate existing knowledge with observed data for hypothesis generation
42. Case Study 2: Diet Induced Differential Gene Expression
¤ Individuals fed on SFA (Saturated Fatty Acid) and Monounsaturated
Fatty Acid (MUFA) diets demonstrate differential gene expression over 8
week span
¤ Authors picked a list of immune related genes showed up-regulation of
these genes
The American journal of clinical nutrition 90,
1656-64 (2009)!
CoolMap!
43. Probe level expression profiles can be maintained
Case Study 2: Diet Induced Differential Gene Expression
(cont’d)
44. Using ontology groups (genders) leads to new discoveries: up-regulated gene groups
and gender-specific responses: weaker patterns. Total of 25k probes
Case Study 2: Diet Induced Differential Gene Expression
(cont’d)
Up-regulated clusters Female-specific Male-specific
45. Case Study 3: Mother-Child Nutrition Data (Unpublished)
v The aggregated group view makes it much easier to interpret at concept level
v We can immediately identify that:
§ BCAA AcylCarnitines(0.45), Long Chain AcylCarnitines(0.34), PPARa methylation
(0.52), ESR Methylation (0.32) are highly correlated between mother and child
Burant C. Unpublished data!
46. Case Study 3: Mother-Child Nutrition Data (Unpublished)
PPARa: One Level Down ê
¤ Validation
¤ Boxplot overlay (left) and expanded view (right) shows the high correlation is unlikely to be a result
from error, outliers or noise (mean 0.52)
¤ Strong association of PPARa methylation levels in mother and child.
¤ Hypothesis
¤ As PPARa regulates genes involved in cell proliferation, cell differentiation and inflammation
responses, the expression profile of these genes may also be correlated in mother and child.
http://www.ncbi.nlm.nih.gov/gene/5465!
Burant C. Unpublished data!
47. Case Study 3: Mother-Child Nutrition Data (Unpublished)
BCAA AcylCarnitines
¤ The Mother-child correlation is lower (mean 0.45)
¤ The BCAA AcylCarnitines intra-child group have a larger variance comparing with Mother
¤ While C3 is highly correlated, C4 has low correlation
48. Case Study 4: DNA Methylation
Missing values and ragged data (unpublished)
¤ Sparse or Ragged matrix
¤ Normalized methylation data: every gene has a different number of methylation sites.
¤ Collapsing by cell line (Caski.1 and Caski.2 cell lines) reveals the aggregated (mean, etc.) normalized
methylation value. Expansion by cell line reveals details for each methylation site.
Sartor M. Unpublished data!
49. Case Study 5: Continuous Glucose Monitoring (CGM)
Display glucose level at:
• a variety of time resolutions:
From 5 min to 1 month
• and sample groups:
age groups, gender
Link hypoglycemia events to blood
sugar changes.
50. Case Study 6: Sequence Analysis Example
¤ Interactive Consensus sequence exploration:
CRP (Catabolite Activator Protein) binding site, 49 sequences in dozens of promoters | Chip-seq
¤ Extend CoolMap: Loader, Aggregator, Renderer [Annotator]
Full Sequence View!
Sequence Logo!
Consensus View!
Consensus View with base percentage overlay!
Consensus View with GC content overlay!
Genome Res. 2004 June; 14(6): 1188-1190!
51. Case Study 7: Network Analysis
¤ Link Cytoscape with CoolMap:
¤ Network node link with CoolMap views, by ID, attribute names, etc.
¤ Explore identified patterns in an experiment to curated networks – an
alternative for JTreeView; create correlation matrices from Cytoscape
numeric attributes;
¤ Use pathways and ontologies to view sub-network to sub-network connectivity
¤ Cluster network based on attributes, and compare unsupervised clustering v.s.
annotated pathways and ontologies.
Need two monitors!
52. Case Study 7: Network Analysis (con’t)
Top Left: MAPK pathway in ‘galFiltered.cys’ network from Cytoscape
Bottom Left: Part of the same network arranged with pathways and the adjacency matrix, and sum as
aggregator. Each cell shows the number of edges within each pathway, as well as the number of
inter-pathway edges. A good ‘community’ clustering will have most of the green dots along the
diagonal
Right: The same view with MAPK pathway expanded, showing dense intra-cluster connectivity
53. Case Study 7: Network Analysis (con’t)
Left: a correlation matrix can be created from gal expression profiles, and then use
pathways to arrange them into a condensed concept correlation view. Hierarchical
clustering can be run from the concept level.
Right: The selected region contains nodes are annotated with KEGG pathway: Cell
cycle and are close to each other in the network
54. Acknowledgement
Thank you!
Primary Advisor
Dr Fan Meng
Committee Mentors
Dr Brian D. Athey (Co-chair)
Dr Charles F. Burant and his lab
Dr Barbara Mirel
Dr Maureen Sartor
Testers
Usability testers and software testers, fellow Bioinformatics brethren.
Development
Please contact me if you are interested in development or testing:
sugang@umich.edu