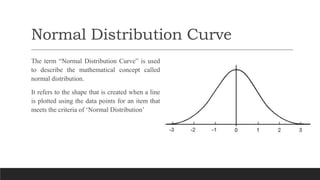
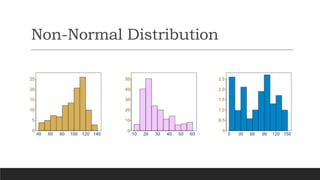
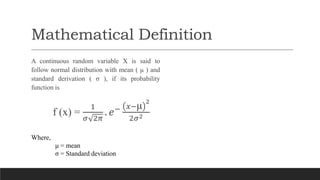
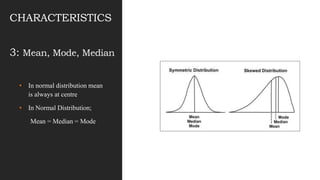
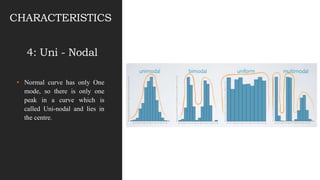
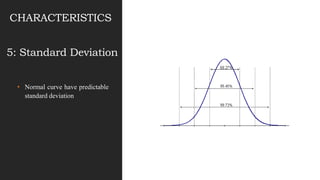
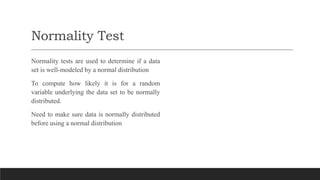
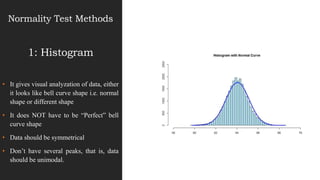
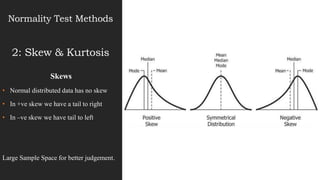
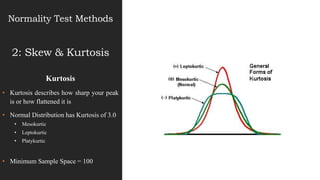
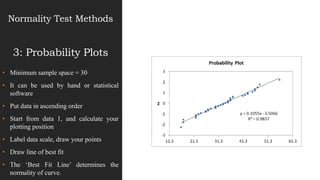
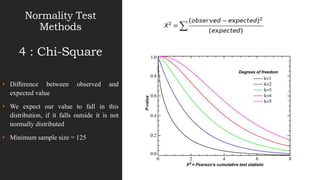
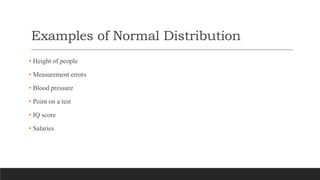
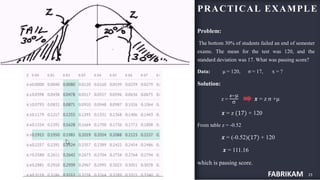
This document discusses normal distribution and normality testing. It defines the normal distribution curve as a bell-shaped curve created by plotting data points that meet the criteria for normal distribution. It provides the mathematical definition of a normal distribution using mean, standard deviation, and the probability density function. It lists key characteristics of the normal distribution curve including its bell shape, symmetry, and that the mean, median, and mode are equal. The document discusses different methods for testing if a data set is normally distributed, including histograms, measures of skew and kurtosis, probability plots, and chi-square goodness of fit tests. It provides an example of how to use the normal distribution and z-scores to calculate a passing score from mean and standard