DEPARTMENT OF COMMUNITYMEDICINE
PT. JNM MEDICAL COLLEGE, RAIPUR (C.G.)
GUIDED BY:
DR. MINI SHARMA MAM
(HOD, DEPT. OF COMMUNITY MEDICINE)
PRESENTED BY:
1. SUDHA RATHOR (156)
2. SUJAL KUMAR PATWA(157)
3. SUNIL DHAKA(158)
4. SUNIL KUMAR(159)
5. SUNITA JANGID(160)
ASSISTED BY:
Mrs. MOINKA DENGANI MA
(Statstician, Community medicine)
TOPIC : NON-PARAMETRIC TEST
2.
TABLE OF CONTENT
•INTRODUCTION
• DEFINATION
• PARAMETRIC V/S NON-PARAMETRIC
• TYPES OF NON-PARAMERTIC TEST
• ADVANTAGE
• DISADVANTAGE
• SUMMARY
• BIBLOGRAPHY
3.
HYPOTHESIS TESTING
• Hypothesistesting is a statistical method used to make inferences or draw
conclusions about a population based on sample data.
4.
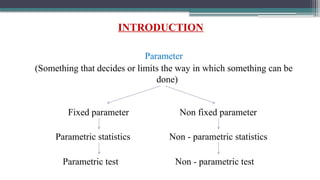
INTRODUCTION
Parameter
(Something that decidesor limits the way in which something can be
done)
Fixed parameter Non fixed parameter
Parametric statistics Non - parametric statistics
Parametric test Non - parametric test
5.
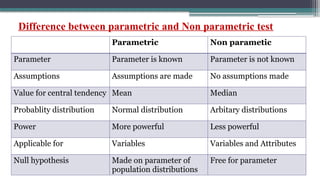
Difference between parametricand Non parametric test
Parametric Non parametic
Parameter Parameter is known Parameter is not known
Assumptions Assumptions are made No assumptions made
Value for central tendency Mean Median
Probablity distribution Normal distribution Arbitary distributions
Power More powerful Less powerful
Applicable for Variables Variables and Attributes
Null hypothesis Made on parameter of
population distributions
Free for parameter
6.
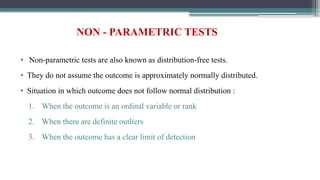
NON - PARAMETRICTESTS
• Non-parametric tests are also known as distribution-free tests.
• They do not assume the outcome is approximately normally distributed.
• Situation in which outcome does not follow normal distribution :
1. When the outcome is an ordinal variable or rank
2. When there are definite outliers
3. When the outcome has a clear limit of detection
7.
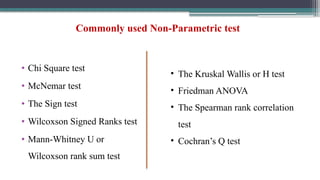
Commonly used Non-Parametrictest
• Chi Square test
• McNemar test
• The Sign test
• Wilcoxson Signed Ranks test
• Mann-Whitney U or
Wilcoxson rank sum test
• The Kruskal Wallis or H test
• Friedman ANOVA
• The Spearman rank correlation
test
• Cochran’s Q test
8.
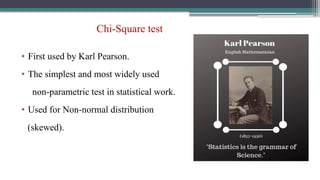
Chi-Square test
• Firstused by Karl Pearson.
• The simplest and most widely used
non-parametric test in statistical work.
• Used for Non-normal distribution
(skewed).
9.
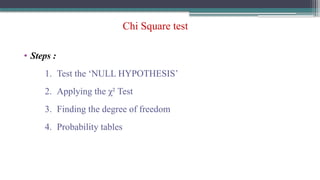
Chi Square test
•Steps :
1. Test the ‘NULL HYPOTHESIS’
2. Applying the χ² Test
3. Finding the degree of freedom
4. Probability tables
10.
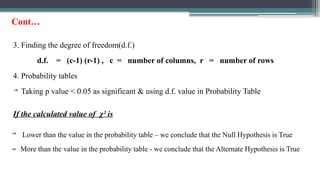
3. Finding thedegree of freedom(d.f.)
d.f. = (c-1) (r-1) , c = number of columns, r = number of rows
4. Probability tables
Taking p value < 0.05 as significant & using d.f. value in Probability Table
If the calculated value of χ² is
Lower than the value in the probability table – we conclude that the Null Hypothesis is True
More than the value in the probability table - we conclude that the Alternate Hypothesis is True
Cont…
12.
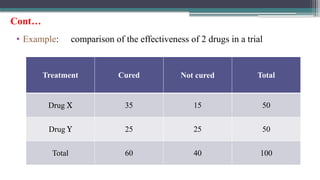
• Example: comparisonof the effectiveness of 2 drugs in a trial
Treatment Cured Not cured Total
Drug X 35 15 50
Drug Y 25 25 50
Total 60 40 100
Cont…
14.
Cont…
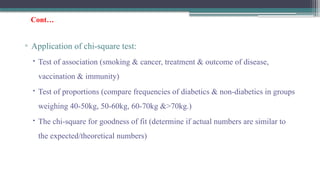
▫ Application ofchi-square test:
Test of association (smoking & cancer, treatment & outcome of disease,
vaccination & immunity)
Test of proportions (compare frequencies of diabetics & non-diabetics in groups
weighing 40-50kg, 50-60kg, 60-70kg &>70kg.)
The chi-square for goodness of fit (determine if actual numbers are similar to
the expected/theoretical numbers)
15.
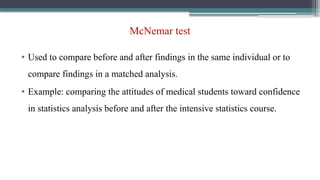
McNemar test
• Usedto compare before and after findings in the same individual or to
compare findings in a matched analysis.
• Example: comparing the attitudes of medical students toward confidence
in statistics analysis before and after the intensive statistics course.
16.
McNemar test
After: ConfidentAfter: Not confident
Before: Confident 20 17 (b)
Before: Not confident 5 (c) 8
McNemar test = [(b – c) – 1]2
= 5.5
b + c
P < 0.05
Critical value (at p = 0.05 & df = 1) is 3.84
Our test statistic = 5.5
Since 5.5 > 3.84 ; we reject null hypothesis – that means the
17.
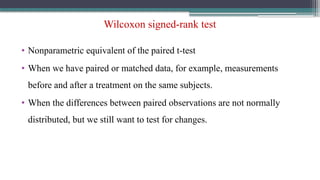
Wilcoxon signed-rank test
•Nonparametric equivalent of the paired t-test
• When we have paired or matched data, for example, measurements
before and after a treatment on the same subjects.
• When the differences between paired observations are not normally
distributed, but we still want to test for changes.
18.
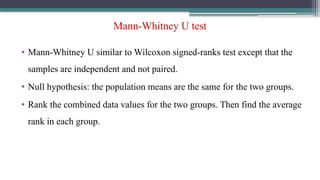
Mann-Whitney U test
•Mann-Whitney U similar to Wilcoxon signed-ranks test except that the
samples are independent and not paired.
• Null hypothesis: the population means are the same for the two groups.
• Rank the combined data values for the two groups. Then find the average
rank in each group.
19.
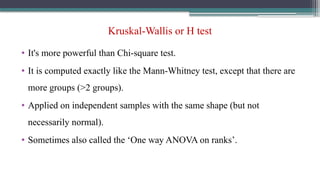
Kruskal-Wallis or Htest
• It's more powerful than Chi-square test.
• It is computed exactly like the Mann-Whitney test, except that there are
more groups (>2 groups).
• Applied on independent samples with the same shape (but not
necessarily normal).
• Sometimes also called the ‘One way ANOVA on ranks’.
20.
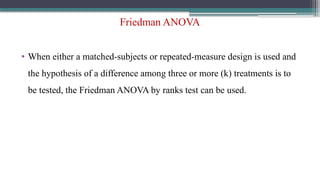
Friedman ANOVA
• Wheneither a matched-subjects or repeated-measure design is used and
the hypothesis of a difference among three or more (k) treatments is to
be tested, the Friedman ANOVA by ranks test can be used.
21.
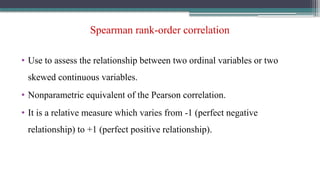
Spearman rank-order correlation
•Use to assess the relationship between two ordinal variables or two
skewed continuous variables.
• Nonparametric equivalent of the Pearson correlation.
• It is a relative measure which varies from -1 (perfect negative
relationship) to +1 (perfect positive relationship).
22.
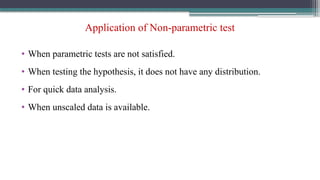
Application of Non-parametrictest
• When parametric tests are not satisfied.
• When testing the hypothesis, it does not have any distribution.
• For quick data analysis.
• When unscaled data is available.
23.
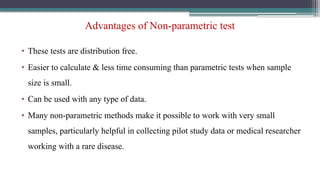
Advantages of Non-parametrictest
• These tests are distribution free.
• Easier to calculate & less time consuming than parametric tests when sample
size is small.
• Can be used with any type of data.
• Many non-parametric methods make it possible to work with very small
samples, particularly helpful in collecting pilot study data or medical researcher
working with a rare disease.
24.
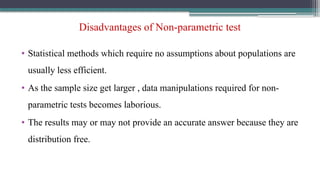
Disadvantages of Non-parametrictest
• Statistical methods which require no assumptions about populations are
usually less efficient.
• As the sample size get larger , data manipulations required for non-
parametric tests becomes laborious.
• The results may or may not provide an accurate answer because they are
distribution free.
25.
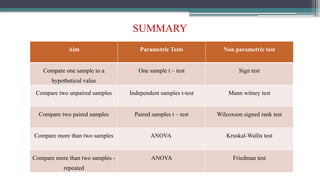
SUMMARY
Aim Parametric TestsNon parametric test
Compare one sample to a
hypothetical value
One sample t – test Sign test
Compare two unpaired samples Independent samples t-test Mann witney test
Compare two paired samples Paired samples t – test Wilcoxson signed rank test
Compare more than two samples ANOVA Kruskal-Wallis test
Compare more than two samples -
repeated
ANOVA Friedman test
26.
BIBLIOGRAPHY
• Park K.Textbook of Preventive and Social Medicine , 27th
ed.
• Mahajan’s Methods in Biostatistics for Medical Students and Research
Workers , 8th
ed.
27.
Take Home Message
•“Non-parametric tests: Your go-to solution for data that doesn't play by
the rules.”
• “When assumptions fail, non-parametric tests prevail: Your flexible
toolkit for community medicine research.”
29.
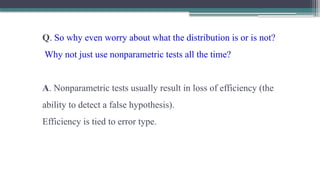
Q. So whyeven worry about what the distribution is or is not?
Why not just use nonparametric tests all the time?
30.
Q. So whyeven worry about what the distribution is or is not?
Why not just use nonparametric tests all the time?
A. Nonparametric tests usually result in loss of efficiency (the
ability to detect a false hypothesis).
Efficiency is tied to error type.


![McNemar test
After: Confident After: Not confident
Before: Confident 20 17 (b)
Before: Not confident 5 (c) 8
McNemar test = [(b – c) – 1]2
= 5.5
b + c
P < 0.05
Critical value (at p = 0.05 & df = 1) is 3.84
Our test statistic = 5.5
Since 5.5 > 3.84 ; we reject null hypothesis – that means the](https://image.slidesharecdn.com/nonparametrictest-41-260115135338-f2d1eaa3/85/Non_parametric_test-4-1-pptx-1-2-pptx-16-320.jpg)