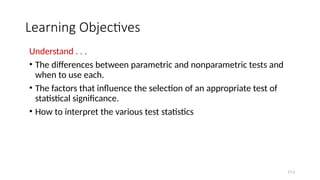
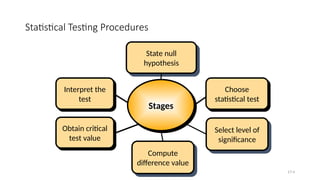
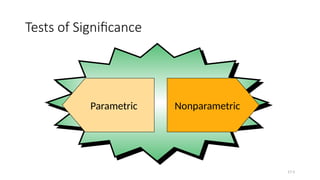
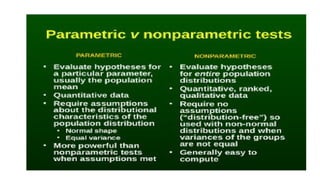
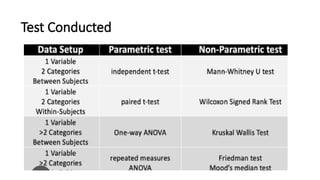
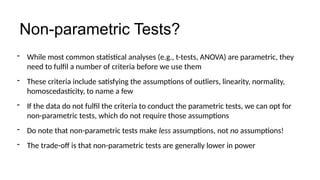
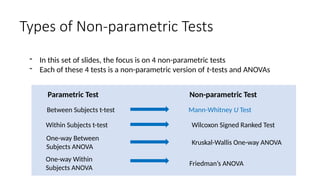
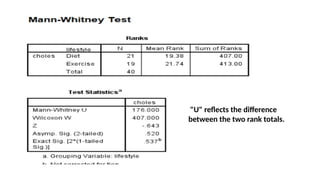
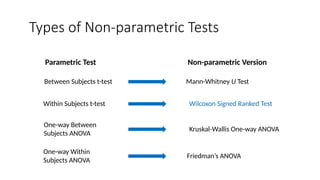
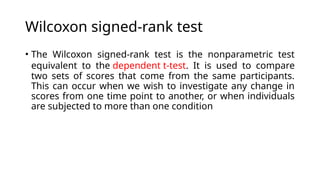
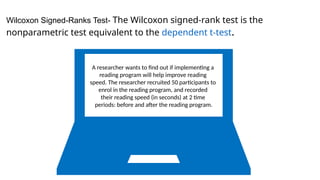
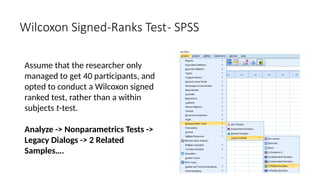
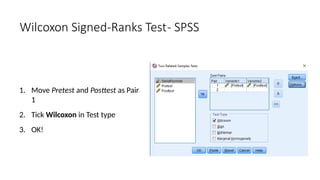
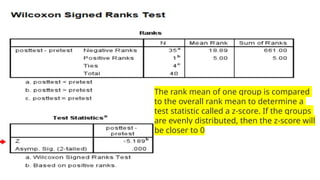
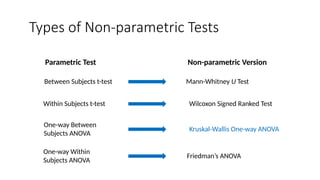
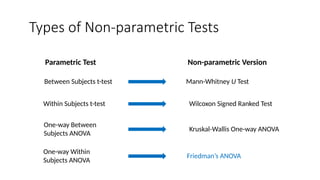
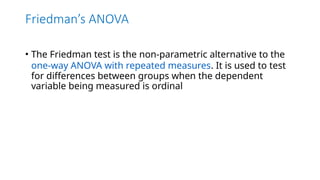
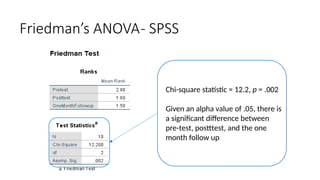
Hypothesis
Testing
Learning Objectives
Understand . . .
• The differences between parametric and nonparametric tests and
when to use each.
• The factors that influence the selection of an appropriate test of
statistical significance.
• How to interpret the various test statistics
17-2
When Data Present a Clear Picture
17-3
Researchers use hypothesis
testing to hunt for truth. As
Abacus states in this ad,
when researchers ‘sift
through the chaos’ and ‘find
what matters’ they
experience the “ah ha!”
moment.
Statistical Testing Procedures
17-4
Obtain critical
test value
Interpret the
test
Stages
Choose
statistical test
State null
hypothesis
Select level of
significance
Compute
difference value
Tests of Significance
17-5
Nonparametric
Parametric
Test Conducted
- While most common statistical analyses (e.g., t-tests, ANOVA) are parametric, they
need to fulfil a number of criteria before we use them
- These criteria include satisfying the assumptions of outliers, linearity, normality,
homoscedasticity, to name a few
- If the data do not fulfil the criteria to conduct the parametric tests, we can opt for
non-parametric tests, which do not require those assumptions
- Do note that non-parametric tests make less assumptions, not no assumptions!
- The trade-off is that non-parametric tests are generally lower in power
Non-parametric Tests?
Types of Non-parametric Tests
Between Subjects t-test Mann-Whitney U Test
Parametric Test Non-parametric Test
Within Subjects t-test Wilcoxon Signed Ranked Test
One-way Between
Subjects ANOVA
Kruskal-Wallis One-way ANOVA
One-way Within
Subjects ANOVA
Friedman’s ANOVA
- In this set of slides, the focus is on 4 non-parametric tests
- Each of these 4 tests is a non-parametric version of t-tests and ANOVAs
The Mann-Whitney U test
• The Mann-Whitney U test is used to compare differences between two
independent groups when the dependent variable is either ordinal or continuous,
but not normally distributed. For example, you could use the Mann-Whitney U
test to understand whether attitudes towards pay discrimination, where attitudes
are measured on an ordinal scale, differ based on gender (i.e., your dependent
variable would be "attitudes towards pay discrimination" and your independent
variable would be "gender", which has two groups: "male" and "female").
• Alternately, you could use the Mann-Whitney U test to understand whether
salaries, measured on a continuous scale, differed based on educational level (i.e.,
your dependent variable would be "salary" and your independent variable would
be "educational level", which has two groups: "high school" and "university"). The
Mann-Whitney U test is often considered the nonparametric alternative to the
independent t-test although this is not always the case.
“A researcher is interested in finding out if there are
differences in cholesterol concentration for two
independent groups
Group 1 follows a strict diet and Group 2 does
exercise
Mann-Whitney U Test
Assume that the data has multiple
outliers, which is why the researcher
opted to conduct a Mann-Whitney U test,
rather than a t-test.
Analyze -> Nonparametrics Tests ->
Legacy Dialogs -> 2 Independent
Samples…
Mann-Whitney U Test- SPSS
1. Move choles to the right under Test
Variable List
2. Move groups as our Grouping Variable
3. Then define groups by clicking on Define
Groups
4. Input ‘1’ and ‘2’ as groups 1 and 2
respectively
5. Continue and OK!
Mann-Whitney U Test- SPSS
"U" reflects the difference
between the two rank totals.
Types of Non-parametric Tests
Between Subjects t-test Mann-Whitney U Test
Parametric Test Non-parametric Version
Within Subjects t-test Wilcoxon Signed Ranked Test
One-way Between
Subjects ANOVA
Kruskal-Wallis One-way ANOVA
One-way Within
Subjects ANOVA
Friedman’s ANOVA
Wilcoxon signed-rank test
• The Wilcoxon signed-rank test is the nonparametric test
equivalent to the dependent t-test. It is used to compare
two sets of scores that come from the same participants.
This can occur when we wish to investigate any change in
scores from one time point to another, or when individuals
are subjected to more than one condition
A researcher wants to find out if implementing a
reading program will help improve reading
speed. The researcher recruited 50 participants to
enrol in the reading program, and recorded
their reading speed (in seconds) at 2 time
periods: before and after the reading program.
Wilcoxon Signed-Ranks Test- The Wilcoxon signed-rank test is the
nonparametric test equivalent to the dependent t-test.
Assume that the researcher only
managed to get 40 participants, and
opted to conduct a Wilcoxon signed
ranked test, rather than a within
subjects t-test.
Analyze -> Nonparametrics Tests ->
Legacy Dialogs -> 2 Related
Samples….
Wilcoxon Signed-Ranks Test- SPSS
1. Move Pretest and Posttest as Pair
1
2. Tick Wilcoxon in Test type
3. OK!
Wilcoxon Signed-Ranks Test- SPSS
The rank mean of one group is compared
to the overall rank mean to determine a
test statistic called a z-score. If the groups
are evenly distributed, then the z-score will
be closer to 0
Types of Non-parametric Tests
Between Subjects t-test Mann-Whitney U Test
Parametric Test Non-parametric Version
Within Subjects t-test Wilcoxon Signed Ranked Test
One-way Between
Subjects ANOVA
Kruskal-Wallis One-way ANOVA
One-way Within
Subjects ANOVA
Friedman’s ANOVA
Kruskal-Wallis One-Way ANOVA
• The Kruskal-Wallis H test (sometimes also called the "one-
way ANOVA on ranks") is a rank-based nonparametric test
that can be used to determine if there are statistically
significant differences between two or more groups of an
independent variable on a continuous or ordinal dependent
variable. It is considered the nonparametric alternative to
the one-way ANOVA, and an extension of the
Mann-Whitney U test to allow the comparison of more than
two independent groups.
Kruskal-Wallis One-Way ANOVA
A researcher is interested in finding out if
there is a difference in physical
well-being (rated 1-100) among
teenagers, young adults, and
seniors. He recruited 10 teenagers, 10
adults, and 10 seniors for the
experiment.
In this case, the IV is age group,
and DV is physical well-being
Assume that the data did not meet the
criteria of parametric tests, thus the
researcher opted to conduct a Kruskal-
Wallis test.
Analyze -> Nonparametrics Tests ->
Legacy Dialogs -> K Independent
Samples….
Kruskal-Wallis One-Way ANOVA
1. Move PhysicalWellBeing into the test
variable list box, and AgeGroup into
the grouping variable box
2. Tick Kruskal-Wallis H under Test type
3. Then define the grouping variable
(Define Range)
4. Go to Options and select Descriptives
Kruskal-Wallis One-Way ANOVA
To define groups:
5. In our dataset, Teenagers were
coded as ‘1’, Adults as ‘2’, and
Seniors as ‘3’
6. Hence, the range for our grouping
variable is 1-3; with a minimum of 1
and maximum of 3
7. Click Continue, and OK
Kruskal-Wallis One-Way ANOVA
Kruskal-Wallis H score =
7.50, p = .024
Given an alpha value
of .05, there is a
significant difference
between teenagers’,
adults’, and seniors’ self
reported physical
wellbeing
Similar to Mann-Whitney
U tests, SPSS ranks the
data.
The value here displays
the average of the
rankings
Kruskal-Wallis One-Way ANOVA
• Although we now know that there is a significant difference between the
3 groups, we do not know exactly where the difference(s) lie
• It could lie between teenagers and adults, adults and seniors, teenagers
and seniors, or even all of the above
However
Types of Non-parametric Tests
Between Subjects t-test Mann-Whitney U Test
Parametric Test Non-parametric Version
Within Subjects t-test Wilcoxon Signed Ranked Test
One-way Between
Subjects ANOVA
Kruskal-Wallis One-way ANOVA
One-way Within
Subjects ANOVA
Friedman’s ANOVA
Friedman’s ANOVA
• The Friedman test is the non-parametric alternative to the
one-way ANOVA with repeated measures. It is used to test
for differences between groups when the dependent
variable being measured is ordinal
A researcher wants to find out if implementing a
reading program will help improve reading
speed. The researcher recruited 50 participants to
enrol in the reading program, and recorded
their reading speed (in seconds) at 3 time
periods: before and after the reading program,
and at one month follow-up.
Friedman’s ANOVA
Assume that the data did not meet the
criteria of parametric tests, thus the
researcher opted to conduct a
Friedman’s ANOVA.
Analyze -> Nonparametrics Tests ->
Legacy Dialogs -> K Related Samples….
Friedman’s ANOVA- SPSS
1. Move Pretest, Posttest, and
OneMonthFollowup inot the test
variables box
2. Tick Friedman in Test type
3. Go to Statistics and select
Descriptives
4. OK!
Friedman’s ANOVA- SPSS
Chi-square statistic = 12.2, p = .002
Given an alpha value of .05, there is
a significant difference between
pre-test, postttest, and the one
month follow up
Friedman’s ANOVA- SPSS
• Just like the Kruskal-Wallis test, although we now know that there is a
significant difference between the three groups, we do not know exactly
where the difference(s) lie
• Simply by eyeballing the mean ranks, we can probably guess that the
difference comes from the improvement from pre-test to post-test (2.9 vs
1.6), but not so much from the post-test to one month follow-up (1.6 vs
1.5)
However
Thank you

Non-parametric-tests.pptx,nzjinijcsbuhvbvbvusbvibisib

  • 1.
  • 2.
    Learning Objectives Understand .. . • The differences between parametric and nonparametric tests and when to use each. • The factors that influence the selection of an appropriate test of statistical significance. • How to interpret the various test statistics 17-2
  • 3.
    When Data Presenta Clear Picture 17-3 Researchers use hypothesis testing to hunt for truth. As Abacus states in this ad, when researchers ‘sift through the chaos’ and ‘find what matters’ they experience the “ah ha!” moment.
  • 4.
    Statistical Testing Procedures 17-4 Obtaincritical test value Interpret the test Stages Choose statistical test State null hypothesis Select level of significance Compute difference value
  • 5.
  • 7.
  • 8.
    - While mostcommon statistical analyses (e.g., t-tests, ANOVA) are parametric, they need to fulfil a number of criteria before we use them - These criteria include satisfying the assumptions of outliers, linearity, normality, homoscedasticity, to name a few - If the data do not fulfil the criteria to conduct the parametric tests, we can opt for non-parametric tests, which do not require those assumptions - Do note that non-parametric tests make less assumptions, not no assumptions! - The trade-off is that non-parametric tests are generally lower in power Non-parametric Tests?
  • 9.
    Types of Non-parametricTests Between Subjects t-test Mann-Whitney U Test Parametric Test Non-parametric Test Within Subjects t-test Wilcoxon Signed Ranked Test One-way Between Subjects ANOVA Kruskal-Wallis One-way ANOVA One-way Within Subjects ANOVA Friedman’s ANOVA - In this set of slides, the focus is on 4 non-parametric tests - Each of these 4 tests is a non-parametric version of t-tests and ANOVAs
  • 10.
    The Mann-Whitney Utest • The Mann-Whitney U test is used to compare differences between two independent groups when the dependent variable is either ordinal or continuous, but not normally distributed. For example, you could use the Mann-Whitney U test to understand whether attitudes towards pay discrimination, where attitudes are measured on an ordinal scale, differ based on gender (i.e., your dependent variable would be "attitudes towards pay discrimination" and your independent variable would be "gender", which has two groups: "male" and "female"). • Alternately, you could use the Mann-Whitney U test to understand whether salaries, measured on a continuous scale, differed based on educational level (i.e., your dependent variable would be "salary" and your independent variable would be "educational level", which has two groups: "high school" and "university"). The Mann-Whitney U test is often considered the nonparametric alternative to the independent t-test although this is not always the case.
  • 11.
    “A researcher isinterested in finding out if there are differences in cholesterol concentration for two independent groups Group 1 follows a strict diet and Group 2 does exercise Mann-Whitney U Test
  • 12.
    Assume that thedata has multiple outliers, which is why the researcher opted to conduct a Mann-Whitney U test, rather than a t-test. Analyze -> Nonparametrics Tests -> Legacy Dialogs -> 2 Independent Samples… Mann-Whitney U Test- SPSS
  • 13.
    1. Move cholesto the right under Test Variable List 2. Move groups as our Grouping Variable 3. Then define groups by clicking on Define Groups 4. Input ‘1’ and ‘2’ as groups 1 and 2 respectively 5. Continue and OK! Mann-Whitney U Test- SPSS
  • 14.
    "U" reflects thedifference between the two rank totals.
  • 15.
    Types of Non-parametricTests Between Subjects t-test Mann-Whitney U Test Parametric Test Non-parametric Version Within Subjects t-test Wilcoxon Signed Ranked Test One-way Between Subjects ANOVA Kruskal-Wallis One-way ANOVA One-way Within Subjects ANOVA Friedman’s ANOVA
  • 16.
    Wilcoxon signed-rank test •The Wilcoxon signed-rank test is the nonparametric test equivalent to the dependent t-test. It is used to compare two sets of scores that come from the same participants. This can occur when we wish to investigate any change in scores from one time point to another, or when individuals are subjected to more than one condition
  • 17.
    A researcher wantsto find out if implementing a reading program will help improve reading speed. The researcher recruited 50 participants to enrol in the reading program, and recorded their reading speed (in seconds) at 2 time periods: before and after the reading program. Wilcoxon Signed-Ranks Test- The Wilcoxon signed-rank test is the nonparametric test equivalent to the dependent t-test.
  • 18.
    Assume that theresearcher only managed to get 40 participants, and opted to conduct a Wilcoxon signed ranked test, rather than a within subjects t-test. Analyze -> Nonparametrics Tests -> Legacy Dialogs -> 2 Related Samples…. Wilcoxon Signed-Ranks Test- SPSS
  • 19.
    1. Move Pretestand Posttest as Pair 1 2. Tick Wilcoxon in Test type 3. OK! Wilcoxon Signed-Ranks Test- SPSS
  • 20.
    The rank meanof one group is compared to the overall rank mean to determine a test statistic called a z-score. If the groups are evenly distributed, then the z-score will be closer to 0
  • 21.
    Types of Non-parametricTests Between Subjects t-test Mann-Whitney U Test Parametric Test Non-parametric Version Within Subjects t-test Wilcoxon Signed Ranked Test One-way Between Subjects ANOVA Kruskal-Wallis One-way ANOVA One-way Within Subjects ANOVA Friedman’s ANOVA
  • 22.
    Kruskal-Wallis One-Way ANOVA •The Kruskal-Wallis H test (sometimes also called the "one- way ANOVA on ranks") is a rank-based nonparametric test that can be used to determine if there are statistically significant differences between two or more groups of an independent variable on a continuous or ordinal dependent variable. It is considered the nonparametric alternative to the one-way ANOVA, and an extension of the Mann-Whitney U test to allow the comparison of more than two independent groups.
  • 23.
    Kruskal-Wallis One-Way ANOVA Aresearcher is interested in finding out if there is a difference in physical well-being (rated 1-100) among teenagers, young adults, and seniors. He recruited 10 teenagers, 10 adults, and 10 seniors for the experiment. In this case, the IV is age group, and DV is physical well-being
  • 24.
    Assume that thedata did not meet the criteria of parametric tests, thus the researcher opted to conduct a Kruskal- Wallis test. Analyze -> Nonparametrics Tests -> Legacy Dialogs -> K Independent Samples…. Kruskal-Wallis One-Way ANOVA
  • 25.
    1. Move PhysicalWellBeinginto the test variable list box, and AgeGroup into the grouping variable box 2. Tick Kruskal-Wallis H under Test type 3. Then define the grouping variable (Define Range) 4. Go to Options and select Descriptives Kruskal-Wallis One-Way ANOVA
  • 26.
    To define groups: 5.In our dataset, Teenagers were coded as ‘1’, Adults as ‘2’, and Seniors as ‘3’ 6. Hence, the range for our grouping variable is 1-3; with a minimum of 1 and maximum of 3 7. Click Continue, and OK Kruskal-Wallis One-Way ANOVA
  • 27.
    Kruskal-Wallis H score= 7.50, p = .024 Given an alpha value of .05, there is a significant difference between teenagers’, adults’, and seniors’ self reported physical wellbeing Similar to Mann-Whitney U tests, SPSS ranks the data. The value here displays the average of the rankings Kruskal-Wallis One-Way ANOVA
  • 28.
    • Although wenow know that there is a significant difference between the 3 groups, we do not know exactly where the difference(s) lie • It could lie between teenagers and adults, adults and seniors, teenagers and seniors, or even all of the above However
  • 29.
    Types of Non-parametricTests Between Subjects t-test Mann-Whitney U Test Parametric Test Non-parametric Version Within Subjects t-test Wilcoxon Signed Ranked Test One-way Between Subjects ANOVA Kruskal-Wallis One-way ANOVA One-way Within Subjects ANOVA Friedman’s ANOVA
  • 30.
    Friedman’s ANOVA • TheFriedman test is the non-parametric alternative to the one-way ANOVA with repeated measures. It is used to test for differences between groups when the dependent variable being measured is ordinal
  • 31.
    A researcher wantsto find out if implementing a reading program will help improve reading speed. The researcher recruited 50 participants to enrol in the reading program, and recorded their reading speed (in seconds) at 3 time periods: before and after the reading program, and at one month follow-up. Friedman’s ANOVA
  • 32.
    Assume that thedata did not meet the criteria of parametric tests, thus the researcher opted to conduct a Friedman’s ANOVA. Analyze -> Nonparametrics Tests -> Legacy Dialogs -> K Related Samples…. Friedman’s ANOVA- SPSS
  • 33.
    1. Move Pretest,Posttest, and OneMonthFollowup inot the test variables box 2. Tick Friedman in Test type 3. Go to Statistics and select Descriptives 4. OK! Friedman’s ANOVA- SPSS
  • 34.
    Chi-square statistic =12.2, p = .002 Given an alpha value of .05, there is a significant difference between pre-test, postttest, and the one month follow up Friedman’s ANOVA- SPSS
  • 35.
    • Just likethe Kruskal-Wallis test, although we now know that there is a significant difference between the three groups, we do not know exactly where the difference(s) lie • Simply by eyeballing the mean ranks, we can probably guess that the difference comes from the improvement from pre-test to post-test (2.9 vs 1.6), but not so much from the post-test to one month follow-up (1.6 vs 1.5) However
  • 36.

Editor's Notes

  • #4 Testing for statistical significance follows a relatively well-defined pattern. State the null hypothesis. While the researcher is usually interesting in testing a hypothesis of change or differences, the null hypothesis is always used for statistical testing purposes. Choose the statistical test. To test a hypothesis, one must choose an appropriate statistical test. There are many tests from which to choose. Test selection is covered more later in this chapter. Select the desired level of significance. The choice of the level of significance should be made before data collection. The most common level is .05. Other levels used include .01, .10, .025, and .001. The exact level is largely determined by how much risk one is willing to accept and the effect this choice has on Type II risk. The larger the Type I risk, the lower the Type II risk. Compute the calculated difference value. After data collection, use the formula for the appropriate statistical test to obtain the calculated value. This can be done by hand or with a software program. Obtain the critical test value. Look up the critical value in the appropriate table for that distribution. Interpret the test. For most tests, if the calculated value is larger than the critical value, reject the null hypothesis. If the critical value is larger, fail to reject the null.
  • #5 Parametric tests are significance tests for data from interval or ratio scales. They are more powerful than nonparametric tests. Nonparametric tests are used to test hypotheses with nominal and ordinal data. Parametric tests should be used if their assumptions are met.