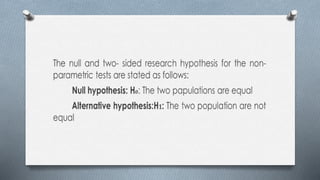
SANT GAJANAN MAHARAJ COLLAGE OF
PHARMACY ,MAHAGAON
Accredited by NAAC with B++ Grade and ISO 9001:2015 Certified Institute
UNIT III : Non parametric tests ,Introduction to research ,Graphs ,Designing the methodology
INTRODUCTION OF
O NON-PARAMETRIC tests are mathematical methods used in
statically hypothesis testing.
O These tests serve as an alternative to parametric tests that can be
employed only if the under laying data satisfies certain criteria
and assumptions.
O Non –Parametric is also known as distribution-free statistic.
NON-PARAMETRIC TEST
O It is a statically procedure were the does not match a normal
distribution.
O These test can be referred to be a function on a sample that has no
dependency on a parameter.
O The characteristics and number of parameters are pretty , flexible
and not predetermined.
O The main reasons to apply the non –Parametric tests are the
under laying data do not meet the assumptions about the
population sample, population sample size is too small or
the analysed data is ordinal or nominal.
ADVANTAGES
O Non-parametric tests deliver accurate results even when the sample
size is small.
O This tests are suitable for all types all data such as nominal, ordinal,
interval or the data which has outliers.
O This tests are more powerful than parametric tests when the
assumptions of normality have been violated.
O These tests are easily understandable and have short calculations.
LIMITATIONS
O Less efficient as compared to parametric test, hence parametric tests are
always first choice.
O The results may or may not provide an accurate answer because they are
distribution free.
O The critical value tables for non-parametric tests are not included in many
computer software, hence these tests require more manual calculations.
SOME IMPORTANTS OF NON-
PARAMETRIC TESTS
O WILCOXON SIGNED RANK TEST:- Compare a continuous out
come in too matched or paired samples(rank data).
O WILCOXON SIGNED SUM TEST:- Test for difference between to
independent groups.
O KRUSHAL-WALLIS TEST:- Compare a continuous out come in
more than two independent samples or groups by making use of
medians.
O FRIEDMAN TEST:- Apply to ranked or interval /ratio type
data when more than two treatment groups are included.
WILCOXON RANK SUM TEST
O This test is also called as Wilcoxon’s two sample test or WILCOXON
Man Whitney (WMW).
O Test or Mann-Whitney-Wilcoxon (MWW) test and it is used for the
comparison of two groups of non parametric data or two independent
samples.
O It compares the null hypothesis to the two sided research hypothesis for
differences or similarities.
O It is used for equal sample sizes and is used test median of two
population.
O Man Whitney U test is also used to compare two population
means that come for the same population.
O It is similar to the t-test for continuous variable but can be used
for ordinal data.
ASSUMPTION
O The dependent variable should be measured on a continuous
scale or an ordinal scale.
O The independent variable should be two independent
categorical groups.
O Observations should follow the same as bell shaped and
skewed left and they are not normally distributed.
Where,
R1 = Sum of the ranks for group 1 and
R2 = Sum of the ranks for group 2
n1 = Size of group 1
n2 = Size of group 2
When,
there is clearly no difference between populations, then U = 10.
Thus, small values of U support the research hypothesis and lager values of U
support the null hypothesis.
In Every test, U1+ U2 is always equal to n1+ n2.
KRUSKAL-WALLIS TEST
o The Kruskal-Wallis 'H' test is a rank-based non-parametric test
used to outcomes among more than two independent groups.
o This test is also called as ANOVA on ranks".
o The parametric equivalent of the Kruskal-Wallis test is the one-
way analysis of variance (ANOVA).
o This test ranks of the data values are used in place of the actual
data points .It is used for comparing two or more independent
samples of equal or different sample sizes.
O The test determines whether the medians of two or more groups are
defferent ,Kruskal-Wallis test is an alternative to one way ANOVA when
the data violates the assumption of normal distribution and when the
sample size is too small.
O It can be used for both continuous and ordinal dependent variables. It
extends the Mann-Whitney 'U test which is used for comparison of two
groups.
O The p-value for both the Kruskal Wallis and the Mann-Whitney test are
equal.
Assumption
O The assumptions of Kruskal Wallis test are as follows:
• There should not be any relationship between the members in
each group or between groups (independent).
• Variables should contain one independent variable with two or
more levels (independent groups)
• Dependent variables must be measured at the ordinal scale, ratio
scale or interna scale.
• All groups should have the same shape distributions
O The test statistic used in Kruskal-Wallis test is called 'H' statistic.
O The hypothesis for the test are
O Null hypothesis: Ho : Population medians are equal.
O Alternative hypothesis: H1: Population medians are not equal.
O The test statistic for the Kruskal-Wallis test is approximately distributed as Chi-
square with K- 1 degrees of freedom.
In H-test, the degree of freedom is determined by following
formula:
df= K-1
where,
df= Degrees of freedom
K =Number of groups or samples
O In Kruskal-Wallis H-test, the first step is to combine all the samples and
perform a rank ordering on all the values. The Kruskal-Wallis H-test value is
calculated by using formula
Where, N=Total no. of observations in all grouped samples
K=No. of comparison groups
Ri =Sum of ranks in first group
ni =Sample size in first group
O If p-value is less than 5% or greater than 10%, then reject null hypothesis and if p-value is
between 5% and 10% then accept the null hypothesis
For example,
o patients suffering from dengue are divided into three groups and three different types of
treatment are given to them. The platelet count of all patients are measured after 3-day course
of treatment and results are as follows:
• Treatment 1:49,000 41,000 45,000 58,000 65,000
• Treatment 2: 58,000 62,000 78,000
• Treatment 3: 62,000, 75,000, 79,000, 84,000
• The sample size is different for the three treatments.
• Treatment 1: n1 = 5
• Treatment 2: n₂ = 3
• Treatment 3: n3= 4
• Total sample size (N) = n₁ + n₂ + n3 = 5+3+4=12
• Order these samples from smallest to largest and then assign
ranks to the clubbed sample.
Sum of ranks =
𝑁 𝑁+1
2
=
12×13
2
= 78
Here sum of ranks=78
1 2 3 Treatment1 Treatment 2 Treatment 3
41,000
45,000
49,000
58,000
65,000
58,000
62,000
78,000
62,000
75,000
79,000
84,000
1
2
3
4.5
8
4.5
6.5
10
6.5
9
11
12
Treatments Ranks
Ri =18.5 Rii =21 Riii =38.5
O Here, we have to check that there is a difference between 3 population
medians so we have to summarise the sample information in test statistic (H)
on ranks.
In this example, Ri= 18.5, Rii= 21, Riii= 38.5 and N = 12.
=
12
12×13
18.52
5
+
212
3
+
38.52
4
− 3 13
=
1
13
(68.45+147+370.56) – 39
=
1
13
x 586.01 – 39
= 45.077-39
H = 6.077
Determine the critical value of H using the table of critical values and critical value is 5.656.
The criteria for rejection or acceptance of null hypothesis is as follows:
Reject H0 : H ≥ Critical value
Accept H0: H < Critical value
O Here, we reject the null hypothesis because H value is greater than critical
value and final conclusion is "there is no significant evidence to state that the
three population medians are same“.
FRIEDMAN TEST
O Friedman test is also called Friedman’s two way ANOVA
developed by an American economist Milton Friedman.
O It uses ranks of data rather than their raw data to compute the test
statistics.
O It is applied to data which is ranked and in form of two- way
ANOVA design(randomised blocks).
O If data is significantly different than normally distributed then
Friedman test is preferred over ANOVA.
O For e.g., detection of blood glucose level before treatment, after
one month treatment and after three months of treatment .
The assumptions of Friedman test are as
follows:
O The group is a random sample from population and one group
of test subjects that are measured on three or more different
occasions.
O There should not be any interaction between blocks (row) and
treatment levels (columns).
O The dependent variable is at least an ordinal or conditions.
O The samples need not be normally distributed.
O The hypothesis of Friedman test are set to be as follows:
O Null hypothesis : H0: No difference between three conditions
O Alternative hypothesis: H1: Differences between these three conditions
O The test statics of Friedman’s test (Fr) Calculated by following equation:
INTRODUCTION TO RESEARCH
O Research is logicalandsystematicsearch for newand useful
informationon a particular topic.
O Research investigationof findingsolutionsto scientificandsocial
problems,through systemic analysis The English word research is
derived from the French word ‘recherche’whichmeans to seek
again.
O Research is an artof scientificinvestigationor it includesany gathering
of data, informationandfactsfor theadvancementof knowledge.
O The information might be collectedfrom differentsources such as journals ,
periodicals, books, natureof experience,internetetc.
O It is careful investigation or enquiry through search for new facts in anybranch of
knowledge.
O It can lead to new contributions to the existing knowledge.
O Researchis done with the help of experimentalstudy,collection of
data,observation analysis,comparison etc.
O A good researchmust meetthe validity and reliabilitythat are most important
evaluting measurementtool of research.
O Validitymeans thatcorrect procedures havebeen appliedto findanswers to a
question.It refers to how willthedata collectionanddataanalysisoftheresearch
captures therealitybeing studied.
O Reliability refersto thequality ofameasurementprocedure that provides
repeatability and accuracy.It demonstrates operationof astudy,such as the data
collection procedures, practicalexperimental studies canberepeated withsame
outcomeofresults.
Each research study has its own specific purpose
.The main objectives of research as follows:
O To develop new scientific methods, concepts and theories to
solve the scientific and non-scientific problems.
O To analyse or study the process or phenomenon to identify the
cause ama relationship.
O To serve the society by solving social problems.
O To overcome or solve the problems occurring in our everyday
life.
O To get research degree for better employment or promotion .
To discover new things and test the existing facts.
Research process consists of series of actions or steps necessary to
effectively carry out research and the desired sequencing of these steps
.The research steps general represent the overall process, however, they
should be viewed as an ever-changing process rather than a fixed set of
steps .The major steps in conducting research are as follows:
O Formulating the research problem.
O Extensive literature survey.
O Formulation of hypothesis.
O .Research design.
O Data collection or actual investigation.
O Analysis and interpretation of results.
O Research report or presentation of results.
IMPORTANCE OF REASERCH
O Research provides basis for many government policies. e.g. preparation of
budget allocation of funds to different sections, solution for social problems,
etc.
O Research is an important tool in all pharmaceutical and
O other business industries for higher growth and to improve the quality of
products.
O Isolation, identification and characterization of new living
O organisms, materials, etc .Novel phenomena and processes such as Human
Genome Project, Gene Therapy. Superconductivity, PCR etc. have been
discovered only through research.
O Research is important for social researchers in studying social relationships
and finding answers to social problems.
O It is formulation of scientific knowledge and gives guidelines for solving
problems.
O Research leads to a new style of life and a ladder to climb up to new heights
in career
O It helps to study the applications of existing theories and concepts.
Some of the important problems are as
follows :
O There is lack of co-ordination among various agencies and
scientists conducting research.
O The lack of scientific training in the methodology of Research.
O There is insufficient interaction between university department
research institutions, Government bodies and industry.
O There is a need for developing better and many more
University - industry interaction programmes.
O Repetition of research studies and overlapping of research with
other researcher is quite frequently observed in Indian research
community.
O The findings are based on the ability of the respondents to
inquire researcher and if respondents are not given the
information of their research then it leads marginal errors.
O Code of conduct and ethics should be followed by all
researchers
O when doing a type of research. Inter-university, Inter-
departmental and personal, trivalries are a responsible for
stalled research projects.
O Library facilities and functioning is not satisfactory at many
places and scientists waste their valuable time and energy for
finding new journals, books, periodicia acts, reports etc. Most
,of published data from various government and other agencies
are not easily available for research.
Need for design of experiment
Design of experiment(DOE)
O The objective of DoE is a selection of the points where the response
should be evaluated. Generally, this mathematical models are polynomials with
an unknown structure, so the corresponding experiments are designed only for
every particular problem.
O The possible setting of each independent variable in n dimensional space
are called levels. Different methodologies is used such as full fractional design,
central composite design, D-optimal design. Here is list of some of more
common research designs, with a short explanation of characteristics of each
are described as under
 HISTORICAL
O It uses primary historical data, such as archaeological remains as
well as documentary sources of the past.
O It is usually necessary to carry out test in order to check the
authenticity of this sources.
O It stresses the importance of interactions and their effects.
 DESCRIPTIVE
O This design is used to examine relationship between two concepts.
O It attempts to examine situation in order to established what is the
norm.
O Observations can take many forms the scale of research is influenced
by two major factors: the level of complexity of survey and the scope
or extend of the survey.
 CORRELATION
O This design is used to examine relationship between two concepts.
O The correlation between two concepts can either be none(no
correlation), positive(where an increase in one result in the increasing
the other, or decrease result in decrease), or negative(where the
increasing in one result in the decrease in the other or vice versa).
O The degree of association is often measurable.
 COMPARITIVE
O This design is used to compare past and present or different parallel
situations, particularly when researcher has no control over events.
O It can look at situations at different scales, macro or micro.
 EXPERIMENTAL
O Experimental research attempts to isolates and control every relevant
condition which determines the events investigated and then observes the
effect when the conditions are manipulated.
O At its simplest, changes are made to an independent variables and the
effects are observed on dependent variables- i.e. cause and effect.
 SIMULATION
O Simulation involves devising a representation in a small and
simplified form(model) of a system, which can be manipulated to
gauge effects.
O Models can be mathematical or physical, working with 2 or 3
dimensional material.
 EVALUATION
O The descriptive type of research is specifically designed to deal with
complex social issues.
O A common purpose of evaluation research is to examine the working
of projects from the point of view of levels of awareness, cost and
benefits, cost-effectiveness and quality assurance.
Experimental Design techniques
MATRIX DESIGNS
O The conventional experiment design proceeds usually so that changes
are made one variable at time; i.e. first the first variable is changes
and its effect is measure and the same takes place for the second
variable and so on.
O This is an inefficient and time consuming approach.
O It cannot also find the probable interactions between the variables.
O Result analysis is straightforward, but care must be taken in
interpreting the results and multivariable modelling is impossible.
O Systematic design is usually based on so called matrix designs that
change several variables simultaneously according to the program
decided beforehand
FULL FACTORIAL DESIGNS
O These designs include all possible combinations of all factors
(variables) at all levels.
O There can be two or more levels, but the number of levels has
an influence on the number of experiments needed.
O For two factors at p levels, 2p experiments are needed for a full
factorial design.
FRACTIONAL FACTORIAL DESIGNS
O These are designs that include the most important combinations
of the variables.
O The significance of effects found by using these designs is
expressed using statistical methods
O This is necessary in order to avoid exponential explosion.
O Quite often, the experiment design problem is defined finding
the minimum number of experiments for the purpose.
ORTHOGONAL DESIGNS
OFull factorial designs are always orthogonal, from
Hadamard matrices at 1800's to Taguchi Designs later.
ON STATISTICAL TESTING
• In process analysis, we are often encountered with a situation where we
are studying, if two populations are similar or different with respect to
some variable
• e.g. if the yield in the previous example is different at two reaction
temperatures.
• In this comparison, there are two possibilities: the populations are either
similar or different (statistically).
• The comparison uses usually means or variances.
• We are testing, if the energy consumption of the new
process is smaller (in average) than of the existing one
or if the variation in some quality variable increases, if
we take a new raw material into use.
• In many cases it is advantageous to set formal
hypotheses and do some tests to show, which is the
actual situation.
TWO LEVEL HADAMARD MATRIX
DESIGNS
O This Section deals with Hadamard matrix for eight runs.
O It was developed by French mathematician Jacques Hadamard.
Plackettja Burman used it in experiment design 1945.
O There are different Hadamard matrices (8x8, 16x16, 32x32,
64x64 and 128x128) developed from initial vectors by
permutation.
O 8x8 matrix makes it possible to make 8 runs (T), for seven
factors (T 1) at two levels (+, ).
RESPONSE SURFACE METHODS
O Linear methods reveal main effects and interactions, but cannot find
quadratic (or cubic) effects.
O Therefore they have limitations in optimization; the optimum is found in
some edge point corresponding linear programming. They cannot model
nonlinear systems; e.g. quadratic phenomena.
O In an industrial process even third-order models are highly unusual.
Therefore, the focus will be on designs that are good for fitting quadratic
models.
O Following example shows a situation where we are dealing with a nonlinear
system and a two-level design does not provide us with the good solution.
The details about this experimental design technique will be discussed in
later chapter.
BOX WILSON CENTRAL COMPOSITE
DESIGNS
O Central Composite Design (CCD) has three different design
points: edge points as in two level designs (+1), star points at a:
la1121 that take care of quadratic effects and centre points.
O Three variants exist: circumscribed (CCC), inscribed (CCI)
and face centred. (CCF)
1) CCC design
O is the original central composite design and it does testing at
five levels. The edge points (factorial or fractional factorial
points) are at the design limits.
O The star points are at some distance from the centre depending
on the number of factors in the design.
O The star points extend the range outside the low and high
settings for all factors. The centre points complete the design.
• Completing an existing factorial or resolution V fractional factorial
design with star and centre points leads to this design.
• CCC designs provide high quality predictions over the entire
design space, but care must be taken when deciding on the factor
ranges.
• Especially, it must be sure that also the star points remain at
feasible (reasonable) levels.
2) CCI
O In CCI, the star points are set at the design limits (hard limits)
and the edge points are inside the range.
O In a ways, a CCI design is a scaled down CCC design.
O It also results in five levels for each factor.
O CCI designs use only points within the factor ranges
originally specified, so the prediction space is limited
compared to the CCC.
3)CCF
O In this design the star points are at the centre of each face of the
factorial space, so a= 1 and only three levels are used
O Complementing an existing factorial or resolution V design with
appropriate star points can also produce this design.
O CCF designs provide relatively high quality predictions over the
entire design range, but poor precision
O NON-PARAMETRIC TESTS for estimating pure quadratic
coefficients. They do not require using points outside the original
factor range.
BOX-BEHNKEN DESIGN
O This design is an independent quadratic design in that it does
not contain an embedded factorial or fractional factorial design.
O In this design the treatment combinations are at the mid points
of the edges of the process space at the centre.
O These designs are near rotatable and require three level of each
factor.
O The design have a limited capacity for orthogonal blocking
compared to central composite designs
D-OPTIMAL DESIGNS
O D optimal designs are one form of design provided by a
computer algorithm. These types of computer aided designs are
particularly useful when classical designs do not apply.
O Unlike standard classical designs such as factorials and
fractional factorials, D optimal design matrices are usually non
orthogonal and effect estimates are correlated.
O These types of designs are always an option regardless of the
type of the model the experimenter wishes to fit (for ,etc.) or
the objective first order, first order plus some interactions, full
quadratic, cubic, et example for the experiment (for example,
screening, response surface)
Plagiarism
O Plagiarism is the attempt to pass off other peoples' work (ideas,
words, phrases, or passages) as your owns.
Types of plagiarism
O Direct plagiarism: Verbatim lifting of passages without
enclosing the borrowed material in quotation marks and
crediting the original author.
O Mosaic: Borrowing the ideas and opinions from the original
source and a few verbatim words or phrases without crediting
the original author. In this case, the plagiarist intertwines his or
her own ideas and opinions with those of the original author,
creating a "confused, plagiarized mass".
O Paraphrase: Restating a phrase or passage, providing the same
meaning but in a different form without attribution to the
original author.
O Insufficient acknowledgement: Noting the original source of
only part of what is borrowed or failing to cite the source
material in such a way that a reder will know what is original
and what is borrowed."
Histogram and Pie-Chart
What is Histogram?
O In statistics, a histogram is a graphical representation of the
distribution of data.
O The histogram is represented by a set of rectangles, adjacent to
each other, where each bar represent a kind of data.
Parts Of Histogram
O Title
O Horizontal or X– Axis
O Bars
O Vertical or Y- Axis
O Legend
Applications
O Histogram is a popular graphing tool.
O It is used to summarize discrete or continuous data that are
measured on an interval scale.
O It is often used to illustrate the major features of the
distribution of the data in a convenient form.
O It is also useful when dealing with large data sets (greater than
100 observations).
O It can help detect any unusual observations (outliers) or any
gaps in the data.
Example
O Question:
The following table gives the lifetime
of 400 neon lamps. Draw the histogram
for the below data.
O Solution :
The histogram for the given
data is:
Lifetime (in
hours)
Number of lamps
300 – 400 14
400 – 500 56
500 – 600 60
600 – 700 86
700 – 800 74
800 – 900 62
900 – 1000 48
What is a Pie Chart?
O The “pie chart” is also known as a “circle chart”, dividing the
circular statistical graphic into sectors or sections to illustrate the
numerical problems. Each sector denotes a proportionate part of the
whole.
O To find out the composition of something, Pie-chart works the best
at that time. In most cases, pie charts replace other graphs like the
bar graph, histograms, etc.
Formula
O The pie chart is an important type of data representation. It
contains different segments and sectors in which each segment
and sector of a pie chart forms a specific portion of the
total(percentage). The sum of all the data is equal to 360°.
O The total value of the pie is always 100%.
O To work out with the percentage for a pie chart, follow the steps
given below:
1. Categorize the data
2. Calculate the total
O To work out with the percentage for a pie chart, follow the
steps given below:
1. Categorize the data
2. Calculate the total
3.Divide the categories
4.Convert into percentages
5.Finally, calculate the degrees
6.Therefore, the pie chart formula is given as
(Given Data/Total value of Data) × 360°
Example
CUBIC GRAPH
 A graph is said to be cubic, if every vertex has exactly three edges
emanating from it.
 Cubic graphs are also called trivalent graphs.
 How to sketch Cubic graph of a function :
O Find the x-intercepts for the function by setting the factors equal to zero
and solving those equations.
O Identify the multiplicity of each zero. Remember that the multiplicity
represents the number of times that zero appears. Decide if the curve
touches or crosses through each zero. If the multiplicity is even, then the
curve touches the x-axis at the zero without crossing. If the multiplicity is
odd, then the curve crosses through the x-axis at the intercept.
O Coefficient of x²: If the coefficient of x' is positive, then the right hand goes
up and the left follows. If the coefficient of x' is negative, then right hand
goes down and the left hand follows.
O Once the above information is known, mark out the x-intercepts on the
graph and start sketching from the LEFT side of the curve to the right. Make
sure to take into account the multiplicity information.
RESPONSE SURFACE PLOT
O Surface plots are diagrams of three-dimensional data. Rather than showing the individual
data points, surface plots show a functional relationship between a designated dependent
variable (Y), and two independent variables (X and Z).
O The plot is a companion plot to the contour plot.
O It is important to understand how these plots are constructed.
O A 2-D grid of X and z is constructed. The range is grid is equal to the range of the data. A 'Y'
value is calculated for each grid point. This Y value is a weighted average of all data that is
near this grid point.
O The 3-D surface is constructed using these averages values. Hence, the surface plot does not
show the variation at each grid point.
O Remember that multiple regression assumes that this surface is aperfectly flat surface.
Key Results: Surface Plot The response surface is curved because the model contains quadratic
terms that are statistically significant.
Counter Plot Graph
• Contour plots are a way to a show a three-dimensional
surface on a two dimentional plane.
• It graphs two predictor variable X Y on the y axis and a
response variable Z as contours.
• These contours are sometimes called z-slices or iso-
response value.
• They can used to show density, brightness or electric
potential.
• Contour plots are topographical maps drawn
from three-dimensional data.
• One variable is represented on the horizontal
axis and a second variable is represented on
vertical axis.
• The third variable is represented by acolor
gradiant and isolines.
• These plots are useful in data analysis ,
especially when you are searching for
minimum and maximum in a set of trivariate
data.
Sample size determination and power of
study
POWER AND SAMPLE SIZE ESTIMATION
O Power and sample size estimations are measures of how many patients are
needed in a study .
O Nearly all clinical studies entail studying a sample of patients with a
particular characteristic rather than the whole population.
O We then use this sample to draw inferences about the whole population.
WHAT IS POWER AND WHY DOES IT
MATTER
OPower and sample size estimations are used by
researchers to determine how many subjects are
needed to answer the research question (or null
hypothesis).
ATTRIBUTES OF A SAMPLE
O Every individual in the chosen population should have an
equal chance to be included in the sample.
O Ideally, choice of one participant should not affect the chance of another’s
selection (hence we try to select the sample randomly – thus, it is important to
note that random sampling does not describe the sample or its size as much as
it describes how the sample is chosen).
• The sample size, the topic of this article, is, simply put, the number
of participants in a sample.
• It is a basic statistical principle with which we define the sample
size before we start a clinical study so as to avoid bias in
interpreting results.
• If we include very few subjects in a study, the results cannot be
generalized to the population as this sample will not represent the
size of the target population.
Generally, the sample size for any study depends on the:
• Acceptable level of significance
• Power of the study
• Expected effect size
• Underlying event rate in the population
• Standard deviation in the population
EXPECTED EFFECT SIZE
O We can understand the concept of “effect size” from day-today
examples.
O If the average weight loss following one diet program is 20 kg
and following another is 10 kg, the absolute effect size would
be 10 kg.
O Similarly, one can claim that a specific teaching activity brings
about a 10% improvement in examination scores. Here 10 kg
and 10% are indicators of the claimed effect size.
UNDERLYING EVENT RATE IN THE
POPULATION
O The underlying event rate of the condition under study.
O (prevalence rate) in the population is extremely important while
calculating the sample size.
O This unlike the level of significance and power is not selected
by convention.
O Rather, it is estimated from previously reported studies.
O Sometimes it so happens that after a trial is initiated, the overall
event rate proves to be unexpectedly low and the sample size
may have to be adjusted, with all statistical precautions.
STANDARD DEVIATION (SD OR Σ)
O Standard deviation is the measure of dispersion or variability.
O in the data While calculating the sample size an investigator
needs to anticipate the variation in the measures that are being
studied.
O It is easy to understand why we would require a smaller
sample if the population is more homogenous and therefore has
a smaller variance or standard deviation.
SAMPLE SIZE CALCULATION
O There are several methods used to calculate the sample size
depending on the type of data or study design.
O The sample size is calculated using the following formula:
n = 2(Zα + Z1−β)2σ 2
Δ2
where,
n is the required sample size.
LIMITATIONS OF THE CALCULATED SAMPLE
SIZE
O The sample size calculated using the above formula is based on some
conventions (Type I and II errors) and few assumptions (effect size
and standard variation).
O The sample size has to be calculated before initiating a study and as
far as possible should not be changed during the study course.
O The sample size calculation is also then influenced by a few practical
issues, e.g., administrative issues and costs.
REPORT WRITING
Meaning
• It is a detailed presentation of research processes and
findings, and it usually includes tables and graphs.
• It is written in a formal language.
• A research report is usually written in the third person.
It is informative and based on first-hand verifiable
information.
Introduction to Protocol:-
O Oregon laws allow nurses to use Nursing Treatment Protocols.
O Oregon DOC Health Services has written Nursing Treatment
Protocols consistent with the guidelines set by the Oregon
Board of Nursing and the Oregon Board of Medical Examiners.
O To ensure that the use of Nursing Treatment Protocols
enhances medical care directed by a physician and does not
replace it.
O The protocols are designed to assist and educate nursing staff
in this triage process.
Cohorts Studies
O The word “cohort” means a group of people.
O Cohort studies are a type of longitudinal study—an approach
that follows research participants over a period of time (often
many years). Specifically, cohort studies recruit and follow
participants who share a common characteristic, such as a
particular occupation or demographic similarity.
O Cohort studies can be forward-looking of backward-looking.
O Cohorts Study types:-
O A forward-looking cohort study is also known as a prospective
cohort study. “Prospective” means that it relates to the future
O A backward-looking cohort study is also called a retrospective
cohort study. “Retrospective” means that it relates to the past.
Prospective Cohort Study
A type of cohort study, or group study, where participants are
enrolled into the study before they develop the disease or
outcome in question.
.
Retrospective Cohort study
O A study that compares two groups of people: those with the disease
or condition under study (cases) and a very similar group of people
who do not have the disease or condition (controls)
STUDY DESIGNS
INTRODUCTION
OA study design is a specific plan or protocol for
conducting the study, which allows the investigator to
translate the conceptual hypothesis into operational
one.
HIERARCHY OF STUDY DESIGN
O Case reports
O Generate hypotheses
O Case series
O Ecologic studies
O Cross-sectional studies
O Case-control studies
O Cohort studies
O Randomized controlled trials
Generate hypotheses
Establish causality
OBSERVATIONAL STUDY
O A type of study in which individuals are observed or certain
outcomes are measured. No attempt is made to affect the
outcome.
O The intent of observational studies is to investigate: the 'natural'
state of risk factors,- diseases or outcomes.
OBSERVATION METHOD
• Most direct method to study the response process.
• Commonly used by educational researchers, market
researchers, engineers, social scientists, natural
scientists, and computer scientists
OBSERVATIONAL RESEARCH
 CONDUCTED BY:
O Watching behavioural actions.
O Documenting observations as the ensue.
O Observation can be performed by either hidden or visible methods.
Types of Observational Studies
O Case reports and case series.
O Ecological studies.
O Cross-sectional studies.
O Case-control studies.
O Cohort studies.
Case Report or Case Series
O Serve a useful role in describing new or notable events in detail. These events
often warrant further formal investigation.
O Examples:
- Reports of unexpected benefits or adverse events, such as a case report
describing the use of high-dose quetiapine in treatment resistant schizophrenia
after intolerance to clozapine.
- A case report of a medication error involving lookalike packaging.
Ecological Studies
O Ecological studies are based on analysis of aggregated data at group
levels (for example populations), and do not involve data on
individuals.
O Typical examples include studies that examine patterns of drug use over
time. Comparison of the use of non-steroidal anti-inflammatory drugs
and COX-2 inhibitors in Australia and Canada.
O They describe associations between drugs and outcomes, such
as changes in the rates of upper gastrointestinal haemorrhage
after the introduction of COX-2 inhibitors.
O Demerit: Individual-level data are not presented.
Cross - Sectional Studies
O Cross-sectional studies collect data at a single point in time for each single
individual, but the actual data collection may take place over a period of time
or on more than one occasion.
O There is no longitudinal follow-up of individuals.
O Provide a profile of a population of interest, which may be broad.
Case-Control Studies
O Case-control studies focus on determining :
Risk factors for an outcome of interest (such as a disease or a drug's
adverse effect) that has already occurred.
Steps in Case-Control Studies
 First:
OTwo groups of participants are assembled:
Othose who already have the outcome (cases)
Othose who do not have the outcome (controls), who are
often matched to the cases to make them similar and
reduce bias
 Second:
O Data on previous exposure to selected risk factors are
collected.
O And compared to see if these risk factors are more (or less)
common among cases versus controls.
Case Control Studies
O Multiple risk factors can be studied, but each case control study
can involve only one outcome.
O Example: case-control study explored the risk factors for the
development of flucloxacillin -associated jaundice (outcome).
Advantages of Observational Studies
O Relatively quick In expensive
O Easy to undertake.
O Can be much larger than randomized controlled trials so they can
explore a rare outcome.
O Undertaken when a randomized controlled trial would be unethical.
O Only behavior and physical personal characteristics can usually be examine.
O The researcher does not learn about motives, attitudes, intentions or feelings.
O Observation research can be time consuming and costly if the observed
behavior occurs rather infrequently.
O Interpretation of data may be a problem.
O Possible invasion of privacy.
Disadvantages of Observational Studies
Experimental Study
(Also Known as Intervention Studies)
O Best study design to prove causation.
O Here, investigator decides who will get the exposure and who
will not. So under direct control of the investigator unlike other
type prospective study where exposure is not dictated by the
investigator.
O Epidemiologist takes some action, intervention or manipulation
in contrast to descriptive studies where no action is taken but
observation is done.
Aims of Experimental Studies
O To provide scientific proof of etiological factors.
O To provide a method of measuring the effectiveness and
efficiency of health services.
There are two important principle of experimental design which
given as under:
O Replication to provide an estimate of experimental error;
randomization, to ensure that this estimate is statistically valid; and
local control, to reduce experimental error by making the experiment
more efficient.
O Experimental Method: An experiment is an investigation in which a
hypothesis is scientifically tested. In an experiment, an independent
variable (the cause) manipulated and the dependent variable (the
effect) is measured; any extraneous variables are controlled. An
advantage is that experiments should be objective
Principle of Experimental Studies
Non-Randomized Trials
O Also known as Quasi-Experimental Designs.
O It is a type of research in which the investigator manipulates the
study factor but does not assign individual subjects randomly to
the exposed & non-exposed groups.
O It is always not possible for ethical, administrative and other
reasons to resort to a RCT.
O Some preventive measures apply only to groups or
community-wide basis.
O When disease RCT require follow-up of thousands of people
for a decade or more.
O As here randomization is not done. So, low comparability than
RCT and chances of spurious results are high than RCT.
 These studies may be of following types:
O Uncontrolled Trials
O Natural Experiments
O Before and after comparison studies.
 With control
 Without control
Uncontrolled Trials
 There is no comparison group.
 Initially may be helpful in:
O Evaluating whether a specific therapy appears to have any value
in a particular disease.
O To determine an appropriate dose.
O To investigate adverse reactions etc.
Natural Experiments
O When experimental studies are not possible in humans, Natural
circumstances that "mimic" an experiment are identified.
O Example: Group of smokers and non-smokers (naturally
separated).
O John Snow's discovery that cholera is a water borne disease
was an outcome of a natural experiment.
Before and after comparison studies
without control
O Experiment serve as its own control.. Incidence of disease
before and after introduction of intervention is measured here.
O Standard for comparison: events which took place prior to use
of new treatment of intervention.
O All group differences are virtually eliminated.
 Examples:
O Prevention of scurvy among sailors by James Lind (1750).
O Studies on transmission of cholera by John Snow (1854).
O Prevention of polio by Salk and Sabin.
O In absence of control group, results of comparison may be
misleading.
O Alternative is to utilize a "Natural control group" i.e., the one
provided by nature or natural circumstances.
 Example:
O Effect of seat belt legislation in one district on RTA related
mortality, compared with the another district with no seat belt
legislation.
Randomized Control Trial
(Abbreviated as RCT)
O An epidemiologic experiment in which subjects in a population
are randomly allocated in to groups, usually called study and
control groups to receive or not to receive an experimental,
preventive or therapeutic procedure, manoeuvre or intervention.
Goal of RCT
 Primary Goal:
O To test whether an intervention works by comparing it to a control
condition (usually either no intervention or an alternative
intervention).
 Secondary Goals:
O Identify factors that influence the effects of the intervention (i.e.,
moderators)
O Understand the processes through which an intervention influences
change (i.e. mediators or change mechanisms that bring about the
intervention effect)
Steps of RCT
 The basic steps include the following:
O Drawing up Protocol
O Selection of Reference and Experimental Population.
O Randomization.
O Manipulation or Intervention
O Follow-up.
O Assessment of outcome
The Protocol
 Should be strictly adhered to throughout the study.
 Aims at preventing bias and to reduce the source of error in
study.
 The Protocol specifies:
O Aims and Objectives of the study
O Questions to be answered.
O Selection criteria for Study and Control group.
O Sample size.
O Procedures for allocation of subjects into study & control
groups.
O Treatment or intervention to be applied.
O Standardization of working procedures and schedules.
O Responsibility of parties involved in trial.
Selecting Reference and Experimental
Population
Reference Population
O Also known as Target Population.
O It may be as broad as mankind or limited to specific groups.
O It is the population to which findings of the trial, if found
successful, are expected to be applicable.
O Thus, it may comprise of the population of whole city, or a
population of school children, industrial workers, obstetric
population and so on according to the nature of the study.
Experimental Population
O Also known as Study Population.
O Derived from the reference population.
O The actual population that participates in the study.
O Ideally, should be chosen randomly so as to have all the
characteristics of the reference population.
O Once defined, its members are invited to participate.
O Cooperation should be assured to avoid losses to follow up
O The participants must fulfil these three criteria:
1. They must give "informed consent.“
2. They should be representative of the population.
3. They should be qualified or eligible for the trial.
- Eg: For testing a new drug for the treatment of anaemia
participants should be anaemic.
-In the test of a new vaccine against whooping cough, participants
already immune to the disease in question, are not qualified.
O A participant of the study differs from those who do not participate in
ways that may affect outcome of the study.
Exclusion and Inclusion Criteria
O Inclusion Criteria:
O To specify who will be eligible to be included in the study, based on
demographic and clinical characteristics.
O Exclusion Criteria:
O To define who will not be eligible to be included in the study.
O More the exclusion criteria:
1. More precise findings, and lesser requirement of sample size.
2. More difficult to find subjects and generalizability will be restricted
Sample Size
O At a scientific meeting, an investigator presented the results of a
study.
O In a study he had conducted to evaluate a new drug in sheep, “after
taking the drug“, he reported, “one third of the sheep markedly
improved, one third of the sheep showed no change, and the other
one ran away.”
O The question which arises is ,"How many subjects do we have to
study?“
O And we need to answer this before the study is done..
O Appropriate relative sizes of the groups under study ensure improved
precision of the study.
Randomization
O It is the heart of a control trial.
O Randomization entails allocating the available participants to
one or another study group.
O One group generally receives intervention (study), other does
not or receives different intervention (control).
O It is different from Random sampling.
O Gives confidence of like being compared to like.
O Randomization aims at:
O Achieving Internal Validity.
O Eliminate bias (Selection bias).
O Allowing comparability.
Methods of Randomization
 Various methods are:
O Simple Random Allocation.
O Randomization in groups of Two.
A. Systematic Allocation
B. Stratified Allocation.
 All methods assume that an equal number of participants is
desired in both groups.
Designing of Clinical Trial and it’s Phases
Definition of clinical trial
O It is a systematic study of new drug(s) in human subjects to
generate data for discovering and verifying the clinical,
pharmacological, and adverse effects with the objective of
determining their safety and efficacy of the new drugs.
Phases of clinical trials
O Human pharmacology
O Therapeutic exploratory
O Therapeutic confirmatory
O Post-marketing studies
Phase-I
Human Pharmacology:
O To find a safe dose
O To decide how the new treatment should be given
O To see how the new treatment affects the human body
O No. of people taking part- 25 to 50
Phase-II
Therapeutic exploratory:
O Phase II clinical trials are done to study an intervention in a larger group of
people (several hundred)
O To determine efficacy (that is, whether it works as intended)and to further
evaluate its safety.
Phase-III
Therapeutic confirmatory :
O Phase Ill studies are done to study the efficacy of an intervention in large
groups of trial participants (from several hundred to several thousand)
by comparing the intervention to other standard or experimental
interventions (or to non-interventional standard care).
O Phase III studies are also used to monitor adverse effects and to collect
information that will allow the intervention to be used safely.
Phase-IV
Post-Marketing studies :
O Phase IV studies are done after an intervention has been marketed.
O These studies are designed to monitor the effectiveness of the approved
intervention in the general population and to collect information about any adverse
effects associated with widespread use over longer periods of time.
O They may also be used to investigate the potential use of the intervention in a
different condition ,or in combination with other therapies.
Clinical trial design
Definition
O Clinical trial design is an important aspect of interventional
trials that serves to optimize, ergonomise and economize the
clinical trial conduct.
O The purpose of the clinical trial is assessment of efficacy,
safety, or risk benefit ratio.
O Goal may be superiority, non-inferiority, or equivalence.
Clinical trial designs
O Parallel
O Cross over
O Factorial
O Randomized withdrawal approach
O Adaptive
O Superiority
O Non-inferiority
 Parallel
O Subjects are randomized to one of two or more arms
O Each arm being allocated a different treatment
O Most commonly used design
Cross Over
O Each patient gets both drugs.
O The order in which the patient gets each drug is randomized.
O Each patient serves as his own control.
O Avoids between participant variation in estimating intervention
effect.
O Requires a small sample size
O Assumptions:-
-The effects of intervention during first period does not carry over into second
period.
-Internal and external factors are constant over time
Factorial design
O Two or more interventions
O Allows study of interactive effects
Randomized withdrawal approach
O Third, the design is particularly useful in determining how long a
therapy should be continued (e.g., post-infarction treatments with a
beta-blocker
biostat__final_ppt_unit_3.pptx

biostat__final_ppt_unit_3.pptx

  • 1.
    SANT GAJANAN MAHARAJCOLLAGE OF PHARMACY ,MAHAGAON Accredited by NAAC with B++ Grade and ISO 9001:2015 Certified Institute UNIT III : Non parametric tests ,Introduction to research ,Graphs ,Designing the methodology
  • 2.
    INTRODUCTION OF O NON-PARAMETRICtests are mathematical methods used in statically hypothesis testing. O These tests serve as an alternative to parametric tests that can be employed only if the under laying data satisfies certain criteria and assumptions. O Non –Parametric is also known as distribution-free statistic. NON-PARAMETRIC TEST
  • 3.
    O It isa statically procedure were the does not match a normal distribution. O These test can be referred to be a function on a sample that has no dependency on a parameter. O The characteristics and number of parameters are pretty , flexible and not predetermined.
  • 4.
    O The mainreasons to apply the non –Parametric tests are the under laying data do not meet the assumptions about the population sample, population sample size is too small or the analysed data is ordinal or nominal.
  • 5.
    ADVANTAGES O Non-parametric testsdeliver accurate results even when the sample size is small. O This tests are suitable for all types all data such as nominal, ordinal, interval or the data which has outliers. O This tests are more powerful than parametric tests when the assumptions of normality have been violated. O These tests are easily understandable and have short calculations.
  • 6.
    LIMITATIONS O Less efficientas compared to parametric test, hence parametric tests are always first choice. O The results may or may not provide an accurate answer because they are distribution free. O The critical value tables for non-parametric tests are not included in many computer software, hence these tests require more manual calculations.
  • 7.
    SOME IMPORTANTS OFNON- PARAMETRIC TESTS O WILCOXON SIGNED RANK TEST:- Compare a continuous out come in too matched or paired samples(rank data). O WILCOXON SIGNED SUM TEST:- Test for difference between to independent groups. O KRUSHAL-WALLIS TEST:- Compare a continuous out come in more than two independent samples or groups by making use of medians. O FRIEDMAN TEST:- Apply to ranked or interval /ratio type data when more than two treatment groups are included.
  • 8.
    WILCOXON RANK SUMTEST O This test is also called as Wilcoxon’s two sample test or WILCOXON Man Whitney (WMW). O Test or Mann-Whitney-Wilcoxon (MWW) test and it is used for the comparison of two groups of non parametric data or two independent samples. O It compares the null hypothesis to the two sided research hypothesis for differences or similarities.
  • 9.
    O It isused for equal sample sizes and is used test median of two population. O Man Whitney U test is also used to compare two population means that come for the same population. O It is similar to the t-test for continuous variable but can be used for ordinal data.
  • 10.
    ASSUMPTION O The dependentvariable should be measured on a continuous scale or an ordinal scale. O The independent variable should be two independent categorical groups. O Observations should follow the same as bell shaped and skewed left and they are not normally distributed.
  • 12.
    Where, R1 = Sumof the ranks for group 1 and R2 = Sum of the ranks for group 2 n1 = Size of group 1 n2 = Size of group 2
  • 15.
    When, there is clearlyno difference between populations, then U = 10. Thus, small values of U support the research hypothesis and lager values of U support the null hypothesis. In Every test, U1+ U2 is always equal to n1+ n2.
  • 16.
    KRUSKAL-WALLIS TEST o TheKruskal-Wallis 'H' test is a rank-based non-parametric test used to outcomes among more than two independent groups. o This test is also called as ANOVA on ranks". o The parametric equivalent of the Kruskal-Wallis test is the one- way analysis of variance (ANOVA). o This test ranks of the data values are used in place of the actual data points .It is used for comparing two or more independent samples of equal or different sample sizes.
  • 17.
    O The testdetermines whether the medians of two or more groups are defferent ,Kruskal-Wallis test is an alternative to one way ANOVA when the data violates the assumption of normal distribution and when the sample size is too small. O It can be used for both continuous and ordinal dependent variables. It extends the Mann-Whitney 'U test which is used for comparison of two groups. O The p-value for both the Kruskal Wallis and the Mann-Whitney test are equal.
  • 18.
    Assumption O The assumptionsof Kruskal Wallis test are as follows: • There should not be any relationship between the members in each group or between groups (independent). • Variables should contain one independent variable with two or more levels (independent groups) • Dependent variables must be measured at the ordinal scale, ratio scale or interna scale. • All groups should have the same shape distributions
  • 19.
    O The teststatistic used in Kruskal-Wallis test is called 'H' statistic. O The hypothesis for the test are O Null hypothesis: Ho : Population medians are equal. O Alternative hypothesis: H1: Population medians are not equal. O The test statistic for the Kruskal-Wallis test is approximately distributed as Chi- square with K- 1 degrees of freedom.
  • 20.
    In H-test, thedegree of freedom is determined by following formula: df= K-1 where, df= Degrees of freedom K =Number of groups or samples
  • 21.
    O In Kruskal-WallisH-test, the first step is to combine all the samples and perform a rank ordering on all the values. The Kruskal-Wallis H-test value is calculated by using formula Where, N=Total no. of observations in all grouped samples K=No. of comparison groups Ri =Sum of ranks in first group ni =Sample size in first group
  • 22.
    O If p-valueis less than 5% or greater than 10%, then reject null hypothesis and if p-value is between 5% and 10% then accept the null hypothesis For example, o patients suffering from dengue are divided into three groups and three different types of treatment are given to them. The platelet count of all patients are measured after 3-day course of treatment and results are as follows: • Treatment 1:49,000 41,000 45,000 58,000 65,000 • Treatment 2: 58,000 62,000 78,000 • Treatment 3: 62,000, 75,000, 79,000, 84,000
  • 23.
    • The samplesize is different for the three treatments. • Treatment 1: n1 = 5 • Treatment 2: n₂ = 3 • Treatment 3: n3= 4 • Total sample size (N) = n₁ + n₂ + n3 = 5+3+4=12 • Order these samples from smallest to largest and then assign ranks to the clubbed sample.
  • 24.
    Sum of ranks= 𝑁 𝑁+1 2 = 12×13 2 = 78 Here sum of ranks=78 1 2 3 Treatment1 Treatment 2 Treatment 3 41,000 45,000 49,000 58,000 65,000 58,000 62,000 78,000 62,000 75,000 79,000 84,000 1 2 3 4.5 8 4.5 6.5 10 6.5 9 11 12 Treatments Ranks Ri =18.5 Rii =21 Riii =38.5
  • 25.
    O Here, wehave to check that there is a difference between 3 population medians so we have to summarise the sample information in test statistic (H) on ranks. In this example, Ri= 18.5, Rii= 21, Riii= 38.5 and N = 12. = 12 12×13 18.52 5 + 212 3 + 38.52 4 − 3 13 = 1 13 (68.45+147+370.56) – 39 = 1 13 x 586.01 – 39 = 45.077-39 H = 6.077 Determine the critical value of H using the table of critical values and critical value is 5.656.
  • 26.
    The criteria forrejection or acceptance of null hypothesis is as follows: Reject H0 : H ≥ Critical value Accept H0: H < Critical value O Here, we reject the null hypothesis because H value is greater than critical value and final conclusion is "there is no significant evidence to state that the three population medians are same“.
  • 27.
    FRIEDMAN TEST O Friedmantest is also called Friedman’s two way ANOVA developed by an American economist Milton Friedman. O It uses ranks of data rather than their raw data to compute the test statistics. O It is applied to data which is ranked and in form of two- way ANOVA design(randomised blocks). O If data is significantly different than normally distributed then Friedman test is preferred over ANOVA. O For e.g., detection of blood glucose level before treatment, after one month treatment and after three months of treatment .
  • 28.
    The assumptions ofFriedman test are as follows: O The group is a random sample from population and one group of test subjects that are measured on three or more different occasions. O There should not be any interaction between blocks (row) and treatment levels (columns). O The dependent variable is at least an ordinal or conditions. O The samples need not be normally distributed.
  • 29.
    O The hypothesisof Friedman test are set to be as follows: O Null hypothesis : H0: No difference between three conditions O Alternative hypothesis: H1: Differences between these three conditions O The test statics of Friedman’s test (Fr) Calculated by following equation:
  • 32.
    INTRODUCTION TO RESEARCH OResearch is logicalandsystematicsearch for newand useful informationon a particular topic. O Research investigationof findingsolutionsto scientificandsocial problems,through systemic analysis The English word research is derived from the French word ‘recherche’whichmeans to seek again. O Research is an artof scientificinvestigationor it includesany gathering of data, informationandfactsfor theadvancementof knowledge.
  • 33.
    O The informationmight be collectedfrom differentsources such as journals , periodicals, books, natureof experience,internetetc. O It is careful investigation or enquiry through search for new facts in anybranch of knowledge. O It can lead to new contributions to the existing knowledge. O Researchis done with the help of experimentalstudy,collection of data,observation analysis,comparison etc.
  • 34.
    O A goodresearchmust meetthe validity and reliabilitythat are most important evaluting measurementtool of research. O Validitymeans thatcorrect procedures havebeen appliedto findanswers to a question.It refers to how willthedata collectionanddataanalysisoftheresearch captures therealitybeing studied. O Reliability refersto thequality ofameasurementprocedure that provides repeatability and accuracy.It demonstrates operationof astudy,such as the data collection procedures, practicalexperimental studies canberepeated withsame outcomeofresults.
  • 35.
    Each research studyhas its own specific purpose .The main objectives of research as follows: O To develop new scientific methods, concepts and theories to solve the scientific and non-scientific problems. O To analyse or study the process or phenomenon to identify the cause ama relationship. O To serve the society by solving social problems. O To overcome or solve the problems occurring in our everyday life. O To get research degree for better employment or promotion . To discover new things and test the existing facts.
  • 36.
    Research process consistsof series of actions or steps necessary to effectively carry out research and the desired sequencing of these steps .The research steps general represent the overall process, however, they should be viewed as an ever-changing process rather than a fixed set of steps .The major steps in conducting research are as follows: O Formulating the research problem. O Extensive literature survey. O Formulation of hypothesis. O .Research design. O Data collection or actual investigation. O Analysis and interpretation of results. O Research report or presentation of results.
  • 37.
    IMPORTANCE OF REASERCH OResearch provides basis for many government policies. e.g. preparation of budget allocation of funds to different sections, solution for social problems, etc. O Research is an important tool in all pharmaceutical and O other business industries for higher growth and to improve the quality of products. O Isolation, identification and characterization of new living O organisms, materials, etc .Novel phenomena and processes such as Human Genome Project, Gene Therapy. Superconductivity, PCR etc. have been discovered only through research.
  • 38.
    O Research isimportant for social researchers in studying social relationships and finding answers to social problems. O It is formulation of scientific knowledge and gives guidelines for solving problems. O Research leads to a new style of life and a ladder to climb up to new heights in career O It helps to study the applications of existing theories and concepts.
  • 39.
    Some of theimportant problems are as follows : O There is lack of co-ordination among various agencies and scientists conducting research. O The lack of scientific training in the methodology of Research. O There is insufficient interaction between university department research institutions, Government bodies and industry.
  • 40.
    O There isa need for developing better and many more University - industry interaction programmes. O Repetition of research studies and overlapping of research with other researcher is quite frequently observed in Indian research community. O The findings are based on the ability of the respondents to inquire researcher and if respondents are not given the information of their research then it leads marginal errors.
  • 41.
    O Code ofconduct and ethics should be followed by all researchers O when doing a type of research. Inter-university, Inter- departmental and personal, trivalries are a responsible for stalled research projects. O Library facilities and functioning is not satisfactory at many places and scientists waste their valuable time and energy for finding new journals, books, periodicia acts, reports etc. Most ,of published data from various government and other agencies are not easily available for research.
  • 42.
    Need for designof experiment Design of experiment(DOE) O The objective of DoE is a selection of the points where the response should be evaluated. Generally, this mathematical models are polynomials with an unknown structure, so the corresponding experiments are designed only for every particular problem. O The possible setting of each independent variable in n dimensional space are called levels. Different methodologies is used such as full fractional design, central composite design, D-optimal design. Here is list of some of more common research designs, with a short explanation of characteristics of each are described as under
  • 43.
     HISTORICAL O Ituses primary historical data, such as archaeological remains as well as documentary sources of the past. O It is usually necessary to carry out test in order to check the authenticity of this sources. O It stresses the importance of interactions and their effects.  DESCRIPTIVE O This design is used to examine relationship between two concepts. O It attempts to examine situation in order to established what is the norm.
  • 44.
    O Observations cantake many forms the scale of research is influenced by two major factors: the level of complexity of survey and the scope or extend of the survey.  CORRELATION O This design is used to examine relationship between two concepts. O The correlation between two concepts can either be none(no correlation), positive(where an increase in one result in the increasing the other, or decrease result in decrease), or negative(where the increasing in one result in the decrease in the other or vice versa). O The degree of association is often measurable.
  • 45.
     COMPARITIVE O Thisdesign is used to compare past and present or different parallel situations, particularly when researcher has no control over events. O It can look at situations at different scales, macro or micro.  EXPERIMENTAL O Experimental research attempts to isolates and control every relevant condition which determines the events investigated and then observes the effect when the conditions are manipulated. O At its simplest, changes are made to an independent variables and the effects are observed on dependent variables- i.e. cause and effect.
  • 46.
     SIMULATION O Simulationinvolves devising a representation in a small and simplified form(model) of a system, which can be manipulated to gauge effects. O Models can be mathematical or physical, working with 2 or 3 dimensional material.  EVALUATION O The descriptive type of research is specifically designed to deal with complex social issues. O A common purpose of evaluation research is to examine the working of projects from the point of view of levels of awareness, cost and benefits, cost-effectiveness and quality assurance.
  • 47.
  • 48.
    MATRIX DESIGNS O Theconventional experiment design proceeds usually so that changes are made one variable at time; i.e. first the first variable is changes and its effect is measure and the same takes place for the second variable and so on. O This is an inefficient and time consuming approach. O It cannot also find the probable interactions between the variables. O Result analysis is straightforward, but care must be taken in interpreting the results and multivariable modelling is impossible. O Systematic design is usually based on so called matrix designs that change several variables simultaneously according to the program decided beforehand
  • 49.
    FULL FACTORIAL DESIGNS OThese designs include all possible combinations of all factors (variables) at all levels. O There can be two or more levels, but the number of levels has an influence on the number of experiments needed. O For two factors at p levels, 2p experiments are needed for a full factorial design.
  • 50.
    FRACTIONAL FACTORIAL DESIGNS OThese are designs that include the most important combinations of the variables. O The significance of effects found by using these designs is expressed using statistical methods O This is necessary in order to avoid exponential explosion. O Quite often, the experiment design problem is defined finding the minimum number of experiments for the purpose.
  • 51.
    ORTHOGONAL DESIGNS OFull factorialdesigns are always orthogonal, from Hadamard matrices at 1800's to Taguchi Designs later.
  • 52.
    ON STATISTICAL TESTING •In process analysis, we are often encountered with a situation where we are studying, if two populations are similar or different with respect to some variable • e.g. if the yield in the previous example is different at two reaction temperatures. • In this comparison, there are two possibilities: the populations are either similar or different (statistically). • The comparison uses usually means or variances.
  • 53.
    • We aretesting, if the energy consumption of the new process is smaller (in average) than of the existing one or if the variation in some quality variable increases, if we take a new raw material into use. • In many cases it is advantageous to set formal hypotheses and do some tests to show, which is the actual situation.
  • 54.
    TWO LEVEL HADAMARDMATRIX DESIGNS O This Section deals with Hadamard matrix for eight runs. O It was developed by French mathematician Jacques Hadamard. Plackettja Burman used it in experiment design 1945. O There are different Hadamard matrices (8x8, 16x16, 32x32, 64x64 and 128x128) developed from initial vectors by permutation. O 8x8 matrix makes it possible to make 8 runs (T), for seven factors (T 1) at two levels (+, ).
  • 55.
    RESPONSE SURFACE METHODS OLinear methods reveal main effects and interactions, but cannot find quadratic (or cubic) effects. O Therefore they have limitations in optimization; the optimum is found in some edge point corresponding linear programming. They cannot model nonlinear systems; e.g. quadratic phenomena. O In an industrial process even third-order models are highly unusual. Therefore, the focus will be on designs that are good for fitting quadratic models. O Following example shows a situation where we are dealing with a nonlinear system and a two-level design does not provide us with the good solution. The details about this experimental design technique will be discussed in later chapter.
  • 56.
    BOX WILSON CENTRALCOMPOSITE DESIGNS O Central Composite Design (CCD) has three different design points: edge points as in two level designs (+1), star points at a: la1121 that take care of quadratic effects and centre points. O Three variants exist: circumscribed (CCC), inscribed (CCI) and face centred. (CCF)
  • 57.
    1) CCC design Ois the original central composite design and it does testing at five levels. The edge points (factorial or fractional factorial points) are at the design limits. O The star points are at some distance from the centre depending on the number of factors in the design. O The star points extend the range outside the low and high settings for all factors. The centre points complete the design.
  • 58.
    • Completing anexisting factorial or resolution V fractional factorial design with star and centre points leads to this design. • CCC designs provide high quality predictions over the entire design space, but care must be taken when deciding on the factor ranges. • Especially, it must be sure that also the star points remain at feasible (reasonable) levels.
  • 59.
    2) CCI O InCCI, the star points are set at the design limits (hard limits) and the edge points are inside the range. O In a ways, a CCI design is a scaled down CCC design. O It also results in five levels for each factor. O CCI designs use only points within the factor ranges originally specified, so the prediction space is limited compared to the CCC.
  • 60.
    3)CCF O In thisdesign the star points are at the centre of each face of the factorial space, so a= 1 and only three levels are used O Complementing an existing factorial or resolution V design with appropriate star points can also produce this design. O CCF designs provide relatively high quality predictions over the entire design range, but poor precision O NON-PARAMETRIC TESTS for estimating pure quadratic coefficients. They do not require using points outside the original factor range.
  • 61.
    BOX-BEHNKEN DESIGN O Thisdesign is an independent quadratic design in that it does not contain an embedded factorial or fractional factorial design. O In this design the treatment combinations are at the mid points of the edges of the process space at the centre. O These designs are near rotatable and require three level of each factor. O The design have a limited capacity for orthogonal blocking compared to central composite designs
  • 62.
    D-OPTIMAL DESIGNS O Doptimal designs are one form of design provided by a computer algorithm. These types of computer aided designs are particularly useful when classical designs do not apply. O Unlike standard classical designs such as factorials and fractional factorials, D optimal design matrices are usually non orthogonal and effect estimates are correlated. O These types of designs are always an option regardless of the type of the model the experimenter wishes to fit (for ,etc.) or the objective first order, first order plus some interactions, full quadratic, cubic, et example for the experiment (for example, screening, response surface)
  • 63.
    Plagiarism O Plagiarism isthe attempt to pass off other peoples' work (ideas, words, phrases, or passages) as your owns.
  • 64.
    Types of plagiarism ODirect plagiarism: Verbatim lifting of passages without enclosing the borrowed material in quotation marks and crediting the original author. O Mosaic: Borrowing the ideas and opinions from the original source and a few verbatim words or phrases without crediting the original author. In this case, the plagiarist intertwines his or her own ideas and opinions with those of the original author, creating a "confused, plagiarized mass".
  • 65.
    O Paraphrase: Restatinga phrase or passage, providing the same meaning but in a different form without attribution to the original author. O Insufficient acknowledgement: Noting the original source of only part of what is borrowed or failing to cite the source material in such a way that a reder will know what is original and what is borrowed."
  • 66.
  • 67.
    What is Histogram? OIn statistics, a histogram is a graphical representation of the distribution of data. O The histogram is represented by a set of rectangles, adjacent to each other, where each bar represent a kind of data.
  • 68.
    Parts Of Histogram OTitle O Horizontal or X– Axis O Bars O Vertical or Y- Axis O Legend
  • 69.
    Applications O Histogram isa popular graphing tool. O It is used to summarize discrete or continuous data that are measured on an interval scale. O It is often used to illustrate the major features of the distribution of the data in a convenient form. O It is also useful when dealing with large data sets (greater than 100 observations). O It can help detect any unusual observations (outliers) or any gaps in the data.
  • 70.
    Example O Question: The followingtable gives the lifetime of 400 neon lamps. Draw the histogram for the below data. O Solution : The histogram for the given data is: Lifetime (in hours) Number of lamps 300 – 400 14 400 – 500 56 500 – 600 60 600 – 700 86 700 – 800 74 800 – 900 62 900 – 1000 48
  • 71.
    What is aPie Chart? O The “pie chart” is also known as a “circle chart”, dividing the circular statistical graphic into sectors or sections to illustrate the numerical problems. Each sector denotes a proportionate part of the whole. O To find out the composition of something, Pie-chart works the best at that time. In most cases, pie charts replace other graphs like the bar graph, histograms, etc.
  • 72.
    Formula O The piechart is an important type of data representation. It contains different segments and sectors in which each segment and sector of a pie chart forms a specific portion of the total(percentage). The sum of all the data is equal to 360°. O The total value of the pie is always 100%. O To work out with the percentage for a pie chart, follow the steps given below: 1. Categorize the data 2. Calculate the total
  • 73.
    O To workout with the percentage for a pie chart, follow the steps given below: 1. Categorize the data 2. Calculate the total 3.Divide the categories 4.Convert into percentages 5.Finally, calculate the degrees 6.Therefore, the pie chart formula is given as (Given Data/Total value of Data) × 360°
  • 74.
  • 76.
    CUBIC GRAPH  Agraph is said to be cubic, if every vertex has exactly three edges emanating from it.  Cubic graphs are also called trivalent graphs.
  • 77.
     How tosketch Cubic graph of a function : O Find the x-intercepts for the function by setting the factors equal to zero and solving those equations. O Identify the multiplicity of each zero. Remember that the multiplicity represents the number of times that zero appears. Decide if the curve touches or crosses through each zero. If the multiplicity is even, then the curve touches the x-axis at the zero without crossing. If the multiplicity is odd, then the curve crosses through the x-axis at the intercept.
  • 78.
    O Coefficient ofx²: If the coefficient of x' is positive, then the right hand goes up and the left follows. If the coefficient of x' is negative, then right hand goes down and the left hand follows. O Once the above information is known, mark out the x-intercepts on the graph and start sketching from the LEFT side of the curve to the right. Make sure to take into account the multiplicity information.
  • 79.
    RESPONSE SURFACE PLOT OSurface plots are diagrams of three-dimensional data. Rather than showing the individual data points, surface plots show a functional relationship between a designated dependent variable (Y), and two independent variables (X and Z). O The plot is a companion plot to the contour plot. O It is important to understand how these plots are constructed. O A 2-D grid of X and z is constructed. The range is grid is equal to the range of the data. A 'Y' value is calculated for each grid point. This Y value is a weighted average of all data that is near this grid point. O The 3-D surface is constructed using these averages values. Hence, the surface plot does not show the variation at each grid point. O Remember that multiple regression assumes that this surface is aperfectly flat surface.
  • 80.
    Key Results: SurfacePlot The response surface is curved because the model contains quadratic terms that are statistically significant.
  • 81.
  • 82.
    • Contour plotsare a way to a show a three-dimensional surface on a two dimentional plane. • It graphs two predictor variable X Y on the y axis and a response variable Z as contours. • These contours are sometimes called z-slices or iso- response value. • They can used to show density, brightness or electric potential.
  • 83.
    • Contour plotsare topographical maps drawn from three-dimensional data. • One variable is represented on the horizontal axis and a second variable is represented on vertical axis. • The third variable is represented by acolor gradiant and isolines. • These plots are useful in data analysis , especially when you are searching for minimum and maximum in a set of trivariate data.
  • 84.
    Sample size determinationand power of study
  • 85.
    POWER AND SAMPLESIZE ESTIMATION O Power and sample size estimations are measures of how many patients are needed in a study . O Nearly all clinical studies entail studying a sample of patients with a particular characteristic rather than the whole population. O We then use this sample to draw inferences about the whole population.
  • 86.
    WHAT IS POWERAND WHY DOES IT MATTER OPower and sample size estimations are used by researchers to determine how many subjects are needed to answer the research question (or null hypothesis).
  • 87.
    ATTRIBUTES OF ASAMPLE O Every individual in the chosen population should have an equal chance to be included in the sample. O Ideally, choice of one participant should not affect the chance of another’s selection (hence we try to select the sample randomly – thus, it is important to note that random sampling does not describe the sample or its size as much as it describes how the sample is chosen).
  • 88.
    • The samplesize, the topic of this article, is, simply put, the number of participants in a sample. • It is a basic statistical principle with which we define the sample size before we start a clinical study so as to avoid bias in interpreting results. • If we include very few subjects in a study, the results cannot be generalized to the population as this sample will not represent the size of the target population.
  • 89.
    Generally, the samplesize for any study depends on the: • Acceptable level of significance • Power of the study • Expected effect size • Underlying event rate in the population • Standard deviation in the population
  • 90.
    EXPECTED EFFECT SIZE OWe can understand the concept of “effect size” from day-today examples. O If the average weight loss following one diet program is 20 kg and following another is 10 kg, the absolute effect size would be 10 kg. O Similarly, one can claim that a specific teaching activity brings about a 10% improvement in examination scores. Here 10 kg and 10% are indicators of the claimed effect size.
  • 91.
    UNDERLYING EVENT RATEIN THE POPULATION O The underlying event rate of the condition under study. O (prevalence rate) in the population is extremely important while calculating the sample size. O This unlike the level of significance and power is not selected by convention. O Rather, it is estimated from previously reported studies. O Sometimes it so happens that after a trial is initiated, the overall event rate proves to be unexpectedly low and the sample size may have to be adjusted, with all statistical precautions.
  • 92.
    STANDARD DEVIATION (SDOR Σ) O Standard deviation is the measure of dispersion or variability. O in the data While calculating the sample size an investigator needs to anticipate the variation in the measures that are being studied. O It is easy to understand why we would require a smaller sample if the population is more homogenous and therefore has a smaller variance or standard deviation.
  • 93.
    SAMPLE SIZE CALCULATION OThere are several methods used to calculate the sample size depending on the type of data or study design. O The sample size is calculated using the following formula: n = 2(Zα + Z1−β)2σ 2 Δ2 where, n is the required sample size.
  • 94.
    LIMITATIONS OF THECALCULATED SAMPLE SIZE O The sample size calculated using the above formula is based on some conventions (Type I and II errors) and few assumptions (effect size and standard variation). O The sample size has to be calculated before initiating a study and as far as possible should not be changed during the study course. O The sample size calculation is also then influenced by a few practical issues, e.g., administrative issues and costs.
  • 95.
  • 96.
    Meaning • It isa detailed presentation of research processes and findings, and it usually includes tables and graphs. • It is written in a formal language. • A research report is usually written in the third person. It is informative and based on first-hand verifiable information.
  • 104.
    Introduction to Protocol:- OOregon laws allow nurses to use Nursing Treatment Protocols. O Oregon DOC Health Services has written Nursing Treatment Protocols consistent with the guidelines set by the Oregon Board of Nursing and the Oregon Board of Medical Examiners. O To ensure that the use of Nursing Treatment Protocols enhances medical care directed by a physician and does not replace it. O The protocols are designed to assist and educate nursing staff in this triage process.
  • 105.
    Cohorts Studies O Theword “cohort” means a group of people. O Cohort studies are a type of longitudinal study—an approach that follows research participants over a period of time (often many years). Specifically, cohort studies recruit and follow participants who share a common characteristic, such as a particular occupation or demographic similarity. O Cohort studies can be forward-looking of backward-looking.
  • 106.
    O Cohorts Studytypes:- O A forward-looking cohort study is also known as a prospective cohort study. “Prospective” means that it relates to the future O A backward-looking cohort study is also called a retrospective cohort study. “Retrospective” means that it relates to the past.
  • 107.
    Prospective Cohort Study Atype of cohort study, or group study, where participants are enrolled into the study before they develop the disease or outcome in question. .
  • 108.
    Retrospective Cohort study OA study that compares two groups of people: those with the disease or condition under study (cases) and a very similar group of people who do not have the disease or condition (controls)
  • 109.
  • 110.
    INTRODUCTION OA study designis a specific plan or protocol for conducting the study, which allows the investigator to translate the conceptual hypothesis into operational one.
  • 111.
    HIERARCHY OF STUDYDESIGN O Case reports O Generate hypotheses O Case series O Ecologic studies O Cross-sectional studies O Case-control studies O Cohort studies O Randomized controlled trials Generate hypotheses Establish causality
  • 113.
    OBSERVATIONAL STUDY O Atype of study in which individuals are observed or certain outcomes are measured. No attempt is made to affect the outcome. O The intent of observational studies is to investigate: the 'natural' state of risk factors,- diseases or outcomes.
  • 114.
    OBSERVATION METHOD • Mostdirect method to study the response process. • Commonly used by educational researchers, market researchers, engineers, social scientists, natural scientists, and computer scientists
  • 115.
    OBSERVATIONAL RESEARCH  CONDUCTEDBY: O Watching behavioural actions. O Documenting observations as the ensue. O Observation can be performed by either hidden or visible methods.
  • 116.
    Types of ObservationalStudies O Case reports and case series. O Ecological studies. O Cross-sectional studies. O Case-control studies. O Cohort studies.
  • 117.
    Case Report orCase Series O Serve a useful role in describing new or notable events in detail. These events often warrant further formal investigation. O Examples: - Reports of unexpected benefits or adverse events, such as a case report describing the use of high-dose quetiapine in treatment resistant schizophrenia after intolerance to clozapine. - A case report of a medication error involving lookalike packaging.
  • 118.
    Ecological Studies O Ecologicalstudies are based on analysis of aggregated data at group levels (for example populations), and do not involve data on individuals. O Typical examples include studies that examine patterns of drug use over time. Comparison of the use of non-steroidal anti-inflammatory drugs and COX-2 inhibitors in Australia and Canada.
  • 119.
    O They describeassociations between drugs and outcomes, such as changes in the rates of upper gastrointestinal haemorrhage after the introduction of COX-2 inhibitors. O Demerit: Individual-level data are not presented.
  • 120.
    Cross - SectionalStudies O Cross-sectional studies collect data at a single point in time for each single individual, but the actual data collection may take place over a period of time or on more than one occasion. O There is no longitudinal follow-up of individuals. O Provide a profile of a population of interest, which may be broad.
  • 121.
    Case-Control Studies O Case-controlstudies focus on determining : Risk factors for an outcome of interest (such as a disease or a drug's adverse effect) that has already occurred.
  • 122.
    Steps in Case-ControlStudies  First: OTwo groups of participants are assembled: Othose who already have the outcome (cases) Othose who do not have the outcome (controls), who are often matched to the cases to make them similar and reduce bias
  • 123.
     Second: O Dataon previous exposure to selected risk factors are collected. O And compared to see if these risk factors are more (or less) common among cases versus controls.
  • 124.
    Case Control Studies OMultiple risk factors can be studied, but each case control study can involve only one outcome. O Example: case-control study explored the risk factors for the development of flucloxacillin -associated jaundice (outcome).
  • 126.
    Advantages of ObservationalStudies O Relatively quick In expensive O Easy to undertake. O Can be much larger than randomized controlled trials so they can explore a rare outcome. O Undertaken when a randomized controlled trial would be unethical.
  • 127.
    O Only behaviorand physical personal characteristics can usually be examine. O The researcher does not learn about motives, attitudes, intentions or feelings. O Observation research can be time consuming and costly if the observed behavior occurs rather infrequently. O Interpretation of data may be a problem. O Possible invasion of privacy. Disadvantages of Observational Studies
  • 128.
    Experimental Study (Also Knownas Intervention Studies) O Best study design to prove causation. O Here, investigator decides who will get the exposure and who will not. So under direct control of the investigator unlike other type prospective study where exposure is not dictated by the investigator. O Epidemiologist takes some action, intervention or manipulation in contrast to descriptive studies where no action is taken but observation is done.
  • 129.
    Aims of ExperimentalStudies O To provide scientific proof of etiological factors. O To provide a method of measuring the effectiveness and efficiency of health services.
  • 130.
    There are twoimportant principle of experimental design which given as under: O Replication to provide an estimate of experimental error; randomization, to ensure that this estimate is statistically valid; and local control, to reduce experimental error by making the experiment more efficient. O Experimental Method: An experiment is an investigation in which a hypothesis is scientifically tested. In an experiment, an independent variable (the cause) manipulated and the dependent variable (the effect) is measured; any extraneous variables are controlled. An advantage is that experiments should be objective Principle of Experimental Studies
  • 132.
    Non-Randomized Trials O Alsoknown as Quasi-Experimental Designs. O It is a type of research in which the investigator manipulates the study factor but does not assign individual subjects randomly to the exposed & non-exposed groups. O It is always not possible for ethical, administrative and other reasons to resort to a RCT.
  • 133.
    O Some preventivemeasures apply only to groups or community-wide basis. O When disease RCT require follow-up of thousands of people for a decade or more. O As here randomization is not done. So, low comparability than RCT and chances of spurious results are high than RCT.
  • 134.
     These studiesmay be of following types: O Uncontrolled Trials O Natural Experiments O Before and after comparison studies.  With control  Without control
  • 135.
    Uncontrolled Trials  Thereis no comparison group.  Initially may be helpful in: O Evaluating whether a specific therapy appears to have any value in a particular disease. O To determine an appropriate dose. O To investigate adverse reactions etc.
  • 136.
    Natural Experiments O Whenexperimental studies are not possible in humans, Natural circumstances that "mimic" an experiment are identified. O Example: Group of smokers and non-smokers (naturally separated). O John Snow's discovery that cholera is a water borne disease was an outcome of a natural experiment.
  • 137.
    Before and aftercomparison studies without control O Experiment serve as its own control.. Incidence of disease before and after introduction of intervention is measured here. O Standard for comparison: events which took place prior to use of new treatment of intervention. O All group differences are virtually eliminated.
  • 138.
     Examples: O Preventionof scurvy among sailors by James Lind (1750). O Studies on transmission of cholera by John Snow (1854). O Prevention of polio by Salk and Sabin.
  • 139.
    O In absenceof control group, results of comparison may be misleading. O Alternative is to utilize a "Natural control group" i.e., the one provided by nature or natural circumstances.  Example: O Effect of seat belt legislation in one district on RTA related mortality, compared with the another district with no seat belt legislation.
  • 140.
    Randomized Control Trial (Abbreviatedas RCT) O An epidemiologic experiment in which subjects in a population are randomly allocated in to groups, usually called study and control groups to receive or not to receive an experimental, preventive or therapeutic procedure, manoeuvre or intervention.
  • 141.
    Goal of RCT Primary Goal: O To test whether an intervention works by comparing it to a control condition (usually either no intervention or an alternative intervention).  Secondary Goals: O Identify factors that influence the effects of the intervention (i.e., moderators) O Understand the processes through which an intervention influences change (i.e. mediators or change mechanisms that bring about the intervention effect)
  • 142.
    Steps of RCT The basic steps include the following: O Drawing up Protocol O Selection of Reference and Experimental Population. O Randomization. O Manipulation or Intervention O Follow-up. O Assessment of outcome
  • 144.
    The Protocol  Shouldbe strictly adhered to throughout the study.  Aims at preventing bias and to reduce the source of error in study.  The Protocol specifies: O Aims and Objectives of the study O Questions to be answered.
  • 145.
    O Selection criteriafor Study and Control group. O Sample size. O Procedures for allocation of subjects into study & control groups. O Treatment or intervention to be applied. O Standardization of working procedures and schedules. O Responsibility of parties involved in trial.
  • 146.
    Selecting Reference andExperimental Population
  • 147.
    Reference Population O Alsoknown as Target Population. O It may be as broad as mankind or limited to specific groups. O It is the population to which findings of the trial, if found successful, are expected to be applicable. O Thus, it may comprise of the population of whole city, or a population of school children, industrial workers, obstetric population and so on according to the nature of the study.
  • 148.
    Experimental Population O Alsoknown as Study Population. O Derived from the reference population. O The actual population that participates in the study. O Ideally, should be chosen randomly so as to have all the characteristics of the reference population. O Once defined, its members are invited to participate. O Cooperation should be assured to avoid losses to follow up
  • 149.
    O The participantsmust fulfil these three criteria: 1. They must give "informed consent.“ 2. They should be representative of the population. 3. They should be qualified or eligible for the trial. - Eg: For testing a new drug for the treatment of anaemia participants should be anaemic. -In the test of a new vaccine against whooping cough, participants already immune to the disease in question, are not qualified. O A participant of the study differs from those who do not participate in ways that may affect outcome of the study.
  • 150.
    Exclusion and InclusionCriteria O Inclusion Criteria: O To specify who will be eligible to be included in the study, based on demographic and clinical characteristics. O Exclusion Criteria: O To define who will not be eligible to be included in the study. O More the exclusion criteria: 1. More precise findings, and lesser requirement of sample size. 2. More difficult to find subjects and generalizability will be restricted
  • 151.
    Sample Size O Ata scientific meeting, an investigator presented the results of a study. O In a study he had conducted to evaluate a new drug in sheep, “after taking the drug“, he reported, “one third of the sheep markedly improved, one third of the sheep showed no change, and the other one ran away.” O The question which arises is ,"How many subjects do we have to study?“ O And we need to answer this before the study is done.. O Appropriate relative sizes of the groups under study ensure improved precision of the study.
  • 152.
    Randomization O It isthe heart of a control trial. O Randomization entails allocating the available participants to one or another study group. O One group generally receives intervention (study), other does not or receives different intervention (control). O It is different from Random sampling. O Gives confidence of like being compared to like.
  • 153.
    O Randomization aimsat: O Achieving Internal Validity. O Eliminate bias (Selection bias). O Allowing comparability.
  • 154.
    Methods of Randomization Various methods are: O Simple Random Allocation. O Randomization in groups of Two. A. Systematic Allocation B. Stratified Allocation.  All methods assume that an equal number of participants is desired in both groups.
  • 155.
    Designing of ClinicalTrial and it’s Phases
  • 156.
    Definition of clinicaltrial O It is a systematic study of new drug(s) in human subjects to generate data for discovering and verifying the clinical, pharmacological, and adverse effects with the objective of determining their safety and efficacy of the new drugs.
  • 157.
    Phases of clinicaltrials O Human pharmacology O Therapeutic exploratory O Therapeutic confirmatory O Post-marketing studies
  • 158.
    Phase-I Human Pharmacology: O Tofind a safe dose O To decide how the new treatment should be given O To see how the new treatment affects the human body O No. of people taking part- 25 to 50
  • 159.
    Phase-II Therapeutic exploratory: O PhaseII clinical trials are done to study an intervention in a larger group of people (several hundred) O To determine efficacy (that is, whether it works as intended)and to further evaluate its safety.
  • 160.
    Phase-III Therapeutic confirmatory : OPhase Ill studies are done to study the efficacy of an intervention in large groups of trial participants (from several hundred to several thousand) by comparing the intervention to other standard or experimental interventions (or to non-interventional standard care). O Phase III studies are also used to monitor adverse effects and to collect information that will allow the intervention to be used safely.
  • 161.
    Phase-IV Post-Marketing studies : OPhase IV studies are done after an intervention has been marketed. O These studies are designed to monitor the effectiveness of the approved intervention in the general population and to collect information about any adverse effects associated with widespread use over longer periods of time. O They may also be used to investigate the potential use of the intervention in a different condition ,or in combination with other therapies.
  • 162.
  • 163.
    Definition O Clinical trialdesign is an important aspect of interventional trials that serves to optimize, ergonomise and economize the clinical trial conduct. O The purpose of the clinical trial is assessment of efficacy, safety, or risk benefit ratio. O Goal may be superiority, non-inferiority, or equivalence.
  • 165.
    Clinical trial designs OParallel O Cross over O Factorial O Randomized withdrawal approach O Adaptive O Superiority O Non-inferiority
  • 166.
     Parallel O Subjectsare randomized to one of two or more arms O Each arm being allocated a different treatment O Most commonly used design
  • 168.
    Cross Over O Eachpatient gets both drugs. O The order in which the patient gets each drug is randomized. O Each patient serves as his own control. O Avoids between participant variation in estimating intervention effect. O Requires a small sample size O Assumptions:- -The effects of intervention during first period does not carry over into second period. -Internal and external factors are constant over time
  • 170.
    Factorial design O Twoor more interventions O Allows study of interactive effects
  • 171.
    Randomized withdrawal approach OThird, the design is particularly useful in determining how long a therapy should be continued (e.g., post-infarction treatments with a beta-blocker