
Download to read offline

![10
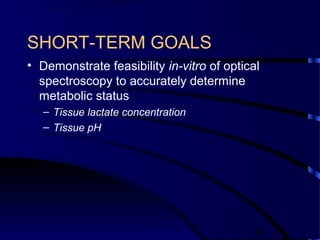
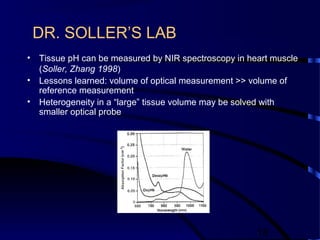
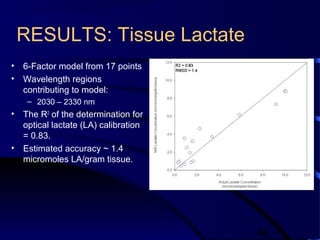
Specification Tissue pH Tissue Lactate
Concentration
[µmoles lactate /
gram tissue]
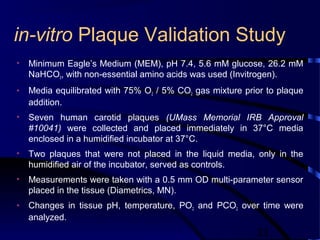
in-vitro
Temperature
(°C)
in-vitro Experimental
Stability
< 0.03
change/hr
- <0.4°C change/hr
Optical Calibration
Range
6.80 – 7.60 2 – 20 32.0 – 38.0
Optical Calibration
Accuracy/
Prediction Error
(R2
/ SECV)
≥0.75 / 0.08
pH units
≥0.75 / 1.0
umoles/ gram
tissue
-
Maximum # of Factors
in Optical Calibration
Model
5 to 6
independent
samples per
factor
5 to 6
independent
samples per
factor
-](https://image.slidesharecdn.com/ykjhmnbdrracashz8e4j-signature-32d797e46816d2f1ad04b19f9671fd9c01ddaa51c8250008594a8e918e443472-poli-160917224223/85/Nirs-10-320.jpg)
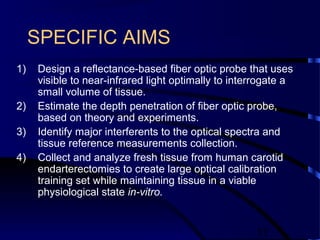

![23
0.00E+00
5.00E+01
1.00E+02
1.50E+02
2.00E+02
2.50E+02
3.00E+02
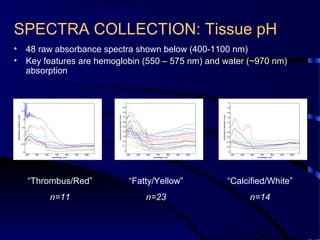
3.50E+02
0.000 0.005 0.010 0.015 0.020 0.025
radius (cm)
diffusereflectance[1/cm2]
514 nm 633 nm 1064 nm
0.00E+00
1.00E+02
2.00E+02
3.00E+02
4.00E+02
5.00E+02
6.00E+02
7.00E+02
0.000 0.005 0.010 0.015 0.020 0.025
radius (cm)
diffusereflectance(1/cm2)
470 nm 633 nm 514 nm 1050 nm 1064 nm
a) b)
normal atherosclerotic
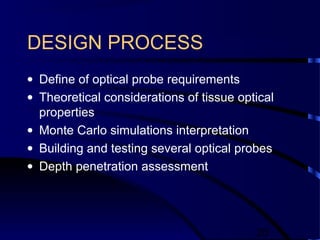
Diffuse Reflectance(radius)
Theoretical Depth Penetration
Wavelength
(nm)
Normal Aorta
(microns)
Atherosclerotic
Aorta (microns)
470 -- 417.5
514 1063 722
633 1338 1197
1050 1333 1187
1064 -- 927](https://image.slidesharecdn.com/ykjhmnbdrracashz8e4j-signature-32d797e46816d2f1ad04b19f9671fd9c01ddaa51c8250008594a8e918e443472-poli-160917224223/85/Nirs-23-320.jpg)
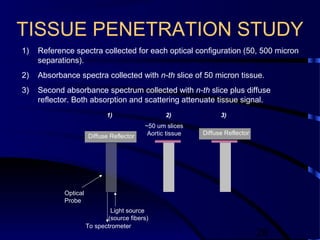
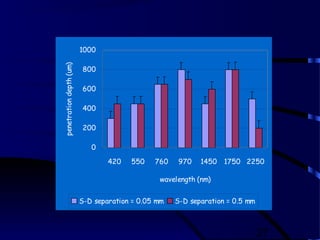
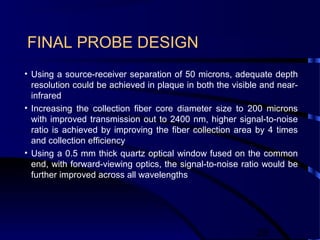

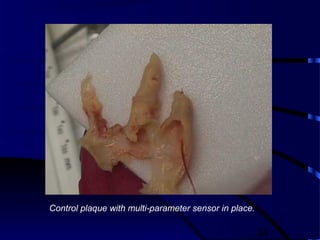
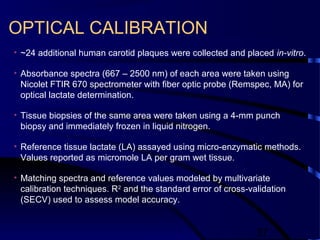
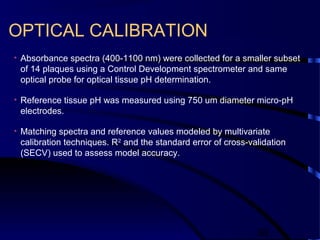

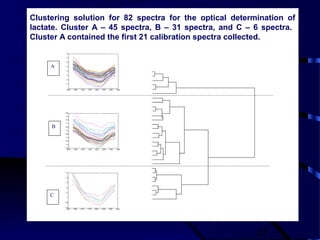
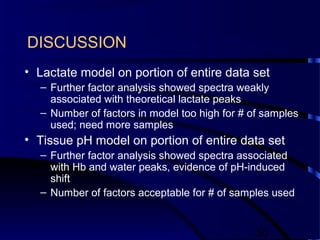
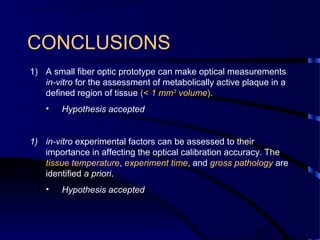

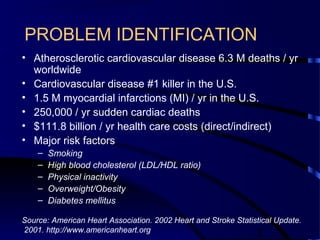
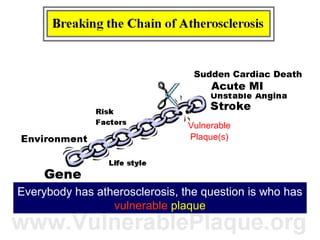
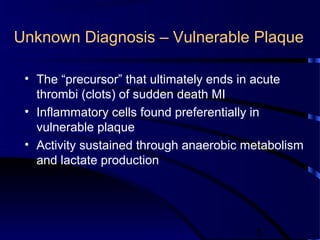
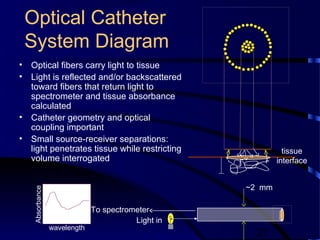
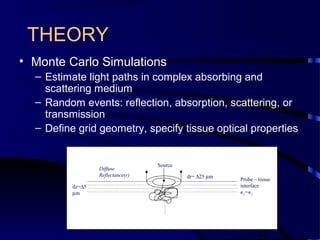
This document describes the design and testing of a fiber optic probe to measure metabolic properties of human carotid plaque. The probe was designed to interrogate a small tissue volume (<1 mm3) and determine pH and lactate concentration in vitro. Monte Carlo simulations were used to model light propagation in tissue and optimize probe geometry. Several probe designs were tested and a final probe with a 50 micron source-receiver separation was chosen. Human carotid plaques were studied in vitro to validate experimental stability over 4 hours. The probe and experimental methods achieved the stability criteria of less than 0.03 pH change and 0.4°C temperature change per hour, demonstrating feasibility for optical determination of metabolic status in vulnerable plaque.


