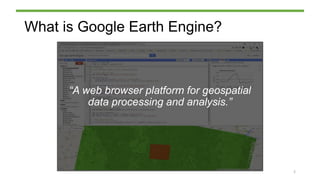
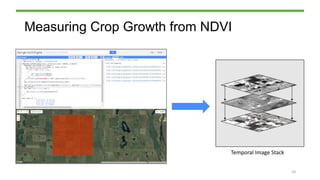
November 29, 2017
Google Earth Engine
Wes Porter | H. Momm
What is Google Earth Engine?
“A web browser platform for geospatial
data processing and analysis.”
2
3
Google Earth Google EngineVs.
Google Earth
Data Visualization
• Virtual Globe
• 3D Cities
• Street View
Google Engine
• Spectral Transformations
• Cumulative Cost Mapping
• Time lapses
• Edge Detection
Data Analysis
4
Timelapse
5
Advantages
• Track, measure, visualize changes over time
• Extensive open data catalogue
• Customizable
6
Your data lives here.
Not on your computer!
7https://www.google.com/about/datacenters/gallery/#/all/20
8
9
Measuring Crop Growth from NDVI
Temporal Image Stack
10
Crop Specific Growth Curves
16
End Product
17
2015 CDL – S.A.M.
Undetermined
Corn Soybeans
Wheat Study Fields
0 0.25 0.5 1 Mile
N
• Future Research / Next Steps
- Generate crop data layers for years in which USDA data is unavailable
• Why consider Google Earth Engine?
- It’s free
- It’s powerful
- Mountain of Earth observation data to play with
19
Closing Thoughts
Questions?
Gorelick, N., Hancher, M., Dixon, M., Ilyushchenko, S.,
Thau, D., & Moore, R. (2017). Google Earth Engine:
Planetary-scale geospatial analysis for everyone. Remote
Sensing of Environment.
Beis, Jeff. (2017). Earth Engine Demo: Trendy Lights.
github.com/google/earthengine-api/demos/trendy-lights
Satellite by Sergey Demushkin from the Noun Project
Images from earthobservatory.nasa.gov
Acknowledgements
This project was partially supported by funding from the
Space Grant Consortium and USDA – National Institute of
Food and Agriculture (2017-70001-25989) with an
appointment to a graduate research assistance ship
through the College of Graduate Studies at Middle
Tennessee State University.
Special thanks to Dr. Henrique Momm for his mentorship
and support.
Wes Porter
wsp2s@mtmail.mtsu.edu
@Wes_Port

Digital Projects Showcase: Google Earth Engine

  • 1.
    November 29, 2017 GoogleEarth Engine Wes Porter | H. Momm
  • 2.
    What is GoogleEarth Engine? “A web browser platform for geospatial data processing and analysis.” 2
  • 3.
  • 4.
    Google Earth Data Visualization •Virtual Globe • 3D Cities • Street View Google Engine • Spectral Transformations • Cumulative Cost Mapping • Time lapses • Edge Detection Data Analysis 4
  • 5.
  • 6.
    Advantages • Track, measure,visualize changes over time • Extensive open data catalogue • Customizable 6
  • 7.
    Your data liveshere. Not on your computer! 7https://www.google.com/about/datacenters/gallery/#/all/20
  • 8.
  • 9.
  • 10.
    Measuring Crop Growthfrom NDVI Temporal Image Stack 10
  • 11.
  • 12.
    End Product 17 2015 CDL– S.A.M. Undetermined Corn Soybeans Wheat Study Fields 0 0.25 0.5 1 Mile N
  • 13.
    • Future Research/ Next Steps - Generate crop data layers for years in which USDA data is unavailable • Why consider Google Earth Engine? - It’s free - It’s powerful - Mountain of Earth observation data to play with 19 Closing Thoughts
  • 14.
    Questions? Gorelick, N., Hancher,M., Dixon, M., Ilyushchenko, S., Thau, D., & Moore, R. (2017). Google Earth Engine: Planetary-scale geospatial analysis for everyone. Remote Sensing of Environment. Beis, Jeff. (2017). Earth Engine Demo: Trendy Lights. github.com/google/earthengine-api/demos/trendy-lights Satellite by Sergey Demushkin from the Noun Project Images from earthobservatory.nasa.gov Acknowledgements This project was partially supported by funding from the Space Grant Consortium and USDA – National Institute of Food and Agriculture (2017-70001-25989) with an appointment to a graduate research assistance ship through the College of Graduate Studies at Middle Tennessee State University. Special thanks to Dr. Henrique Momm for his mentorship and support. Wes Porter wsp2s@mtmail.mtsu.edu @Wes_Port

Editor's Notes

  • #2 Google Earth Engine – A geospatial dark horse: -Little known yet powerful capabilities -The best part - It’s free! - western australia salt ponds
  • #3 History: Passion project (20% time) of Rebecca Moore (Google Earth Director) Born out of desire to help poorer nations monitor deforestation Google worked w/ Geographic Information Science center at South Dakota State and Imazon Launched on Dec. 2, 2010 at the International Climate Change Center in Cancun Mexico 32 years of data 2,068,467 Landsat scenes 909 terabytes of data
  • #4 - Google Engine is a separate geospatial analysis product
  • #5 These are just a few of the available functions on GEE The strength of GEE is its FLEXIBILITY!
  • #6 Notice the housing boom in West Murfreesboro? Appearance of 840 Construction of the Avenue, Medical Center
  • #7 Tutorials available to learn how to use GEE Lots of examples and documentation Even remote sensing lab courses for those in Education
  • #8 Mayes County, Oklahoma
  • #9 - Custom application made with the Python API - Linear regression of brightness over time
  • #11 NDVI = Normalized Difference Vegetation Index i.e. how healthy is the crop? NDVI = (NIR – RED) / (NIR +RED) Each image is a snapshot in time
  • #12 We can use those snapshots to monitor the growth of specific crops over time Characteristic curves (phenology curves)
  • #13 - Integrate GEE with other workflow tools such as ENVI and ArcMap
  • #14 Refine workflow to better handle uncertainty Use CDL with watershed modeling tool AnnAGNPS or SWAT Steep learning curve however… True value lies in the ability to readily extract specific information from a mountain of disparate data sources.