Download to read offline

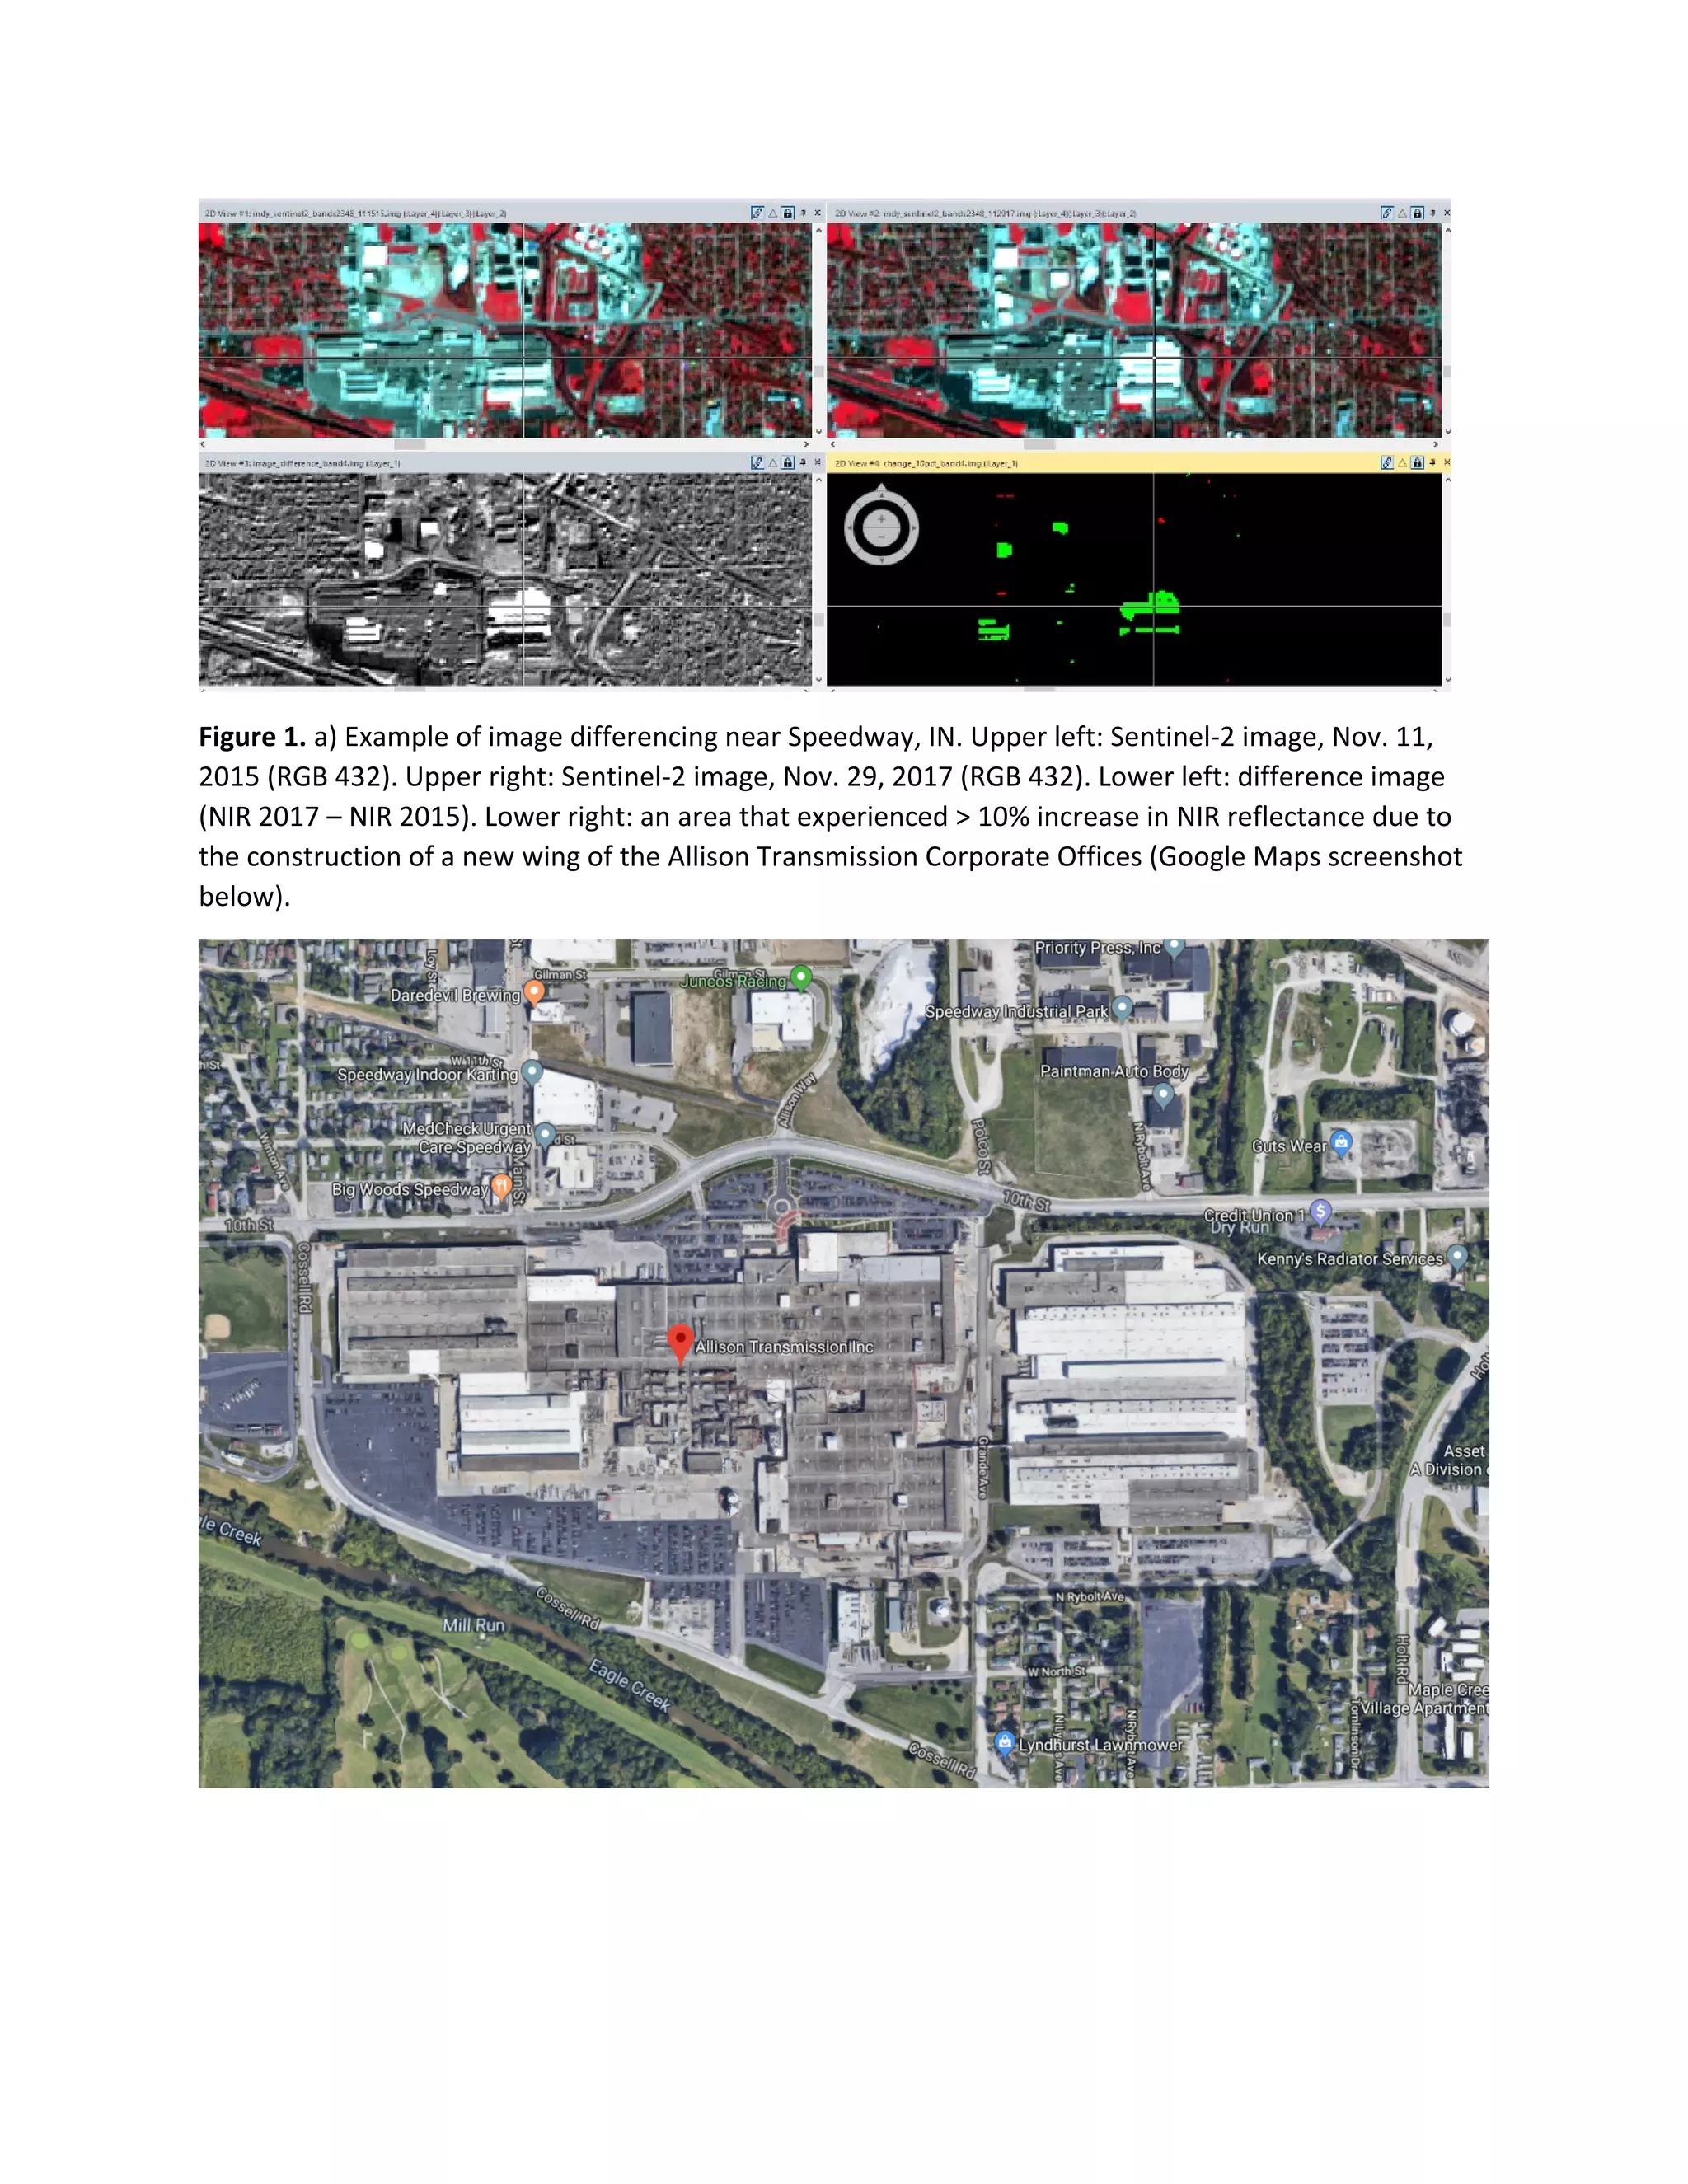
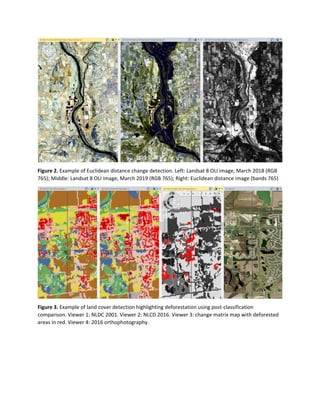
The document presents various examples of remote sensing image analysis techniques, including image differencing, Euclidean distance change detection, and post-classification comparisons. It illustrates the effects of urban development and deforestation through satellite imagery from Sentinel-2 and Landsat 8. Visual representations of these analyses are provided to highlight changes in land cover over specified time periods.


![PM [B06] Complex Polar Coordinates](https://cdn.slidesharecdn.com/ss_thumbnails/pmb06complexpolarcoordinate-151011170738-lva1-app6891-thumbnail.jpg?width=640&height=640&fit=bounds)