1. The Naive Bayes classifier is a simple probabilistic classifier based on Bayes' theorem that assumes independence between features.
2. It has various applications including email spam detection, language detection, and document categorization.
3. The Naive Bayes approach involves computing the class prior probabilities, feature likelihoods, and applying Bayes' theorem to calculate the posterior probabilities to classify new instances. Laplace smoothing is often used to handle cases with insufficient training data.
** Machine Learning Training with Python: https://www.edureka.co/python **
This Edureka tutorial will provide you with a detailed and comprehensive knowledge of the Naive Bayes Classifier Algorithm in python. At the end of the video, you will learn from a demo example on Naive Bayes. Below are the topics covered in this tutorial:
1. What is Naive Bayes?
2. Bayes Theorem and its use
3. Mathematical Working of Naive Bayes
4. Step by step Programming in Naive Bayes
5. Prediction Using Naive Bayes
Check out our playlist for more videos: http://bit.ly/2taym8X
Naive Bayes is a kind of classifier which uses the Bayes Theorem. It predicts membership probabilities for each class such as the probability that given record or data point belongs to a particular class.
This Naive Bayes Tutorial from Edureka will help you understand all the concepts of Naive Bayes classifier, use cases and how it can be used in the industry. This tutorial is ideal for both beginners as well as professionals who want to learn or brush up their concepts in Data Science and Machine Learning through Naive Bayes. Below are the topics covered in this tutorial:
1. What is Machine Learning?
2. Introduction to Classification
3. Classification Algorithms
4. What is Naive Bayes?
5. Use Cases of Naive Bayes
6. Demo – Employee Salary Prediction in R
Introduction to Bayesian classifier. It describes the basic algorithm and applications of Bayesian classification. Explained with the help of numerical problems.
In this presentation is given an introduction to Bayesian networks and basic probability theory. Graphical explanation of Bayes' theorem, random variable, conditional and joint probability. Spam classifier, medical diagnosis, fault prediction. The main software for Bayesian Networks are presented.
In this presentation, we approach a two-class classification problem. We try to find a plane that separates the class in the feature space, also called a hyperplane. If we can't find a hyperplane, then we can be creative in two ways: 1) We soften what we mean by separate, and 2) We enrich and enlarge the featured space so that separation is possible.
Slide explaining the distinction between bagging and boosting while understanding the bias variance trade-off. Followed by some lesser known scope of supervised learning. understanding the effect of tree split metric in deciding feature importance. Then understanding the effect of threshold on classification accuracy. Additionally, how to adjust model threshold for classification in supervised learning.
Note: Limitation of Accuracy metric (baseline accuracy), alternative metrics, their use case and their advantage and limitations were briefly discussed.
Logistic Regression in Python | Logistic Regression Example | Machine Learnin...Edureka!
** Python Data Science Training : https://www.edureka.co/python **
This Edureka Video on Logistic Regression in Python will give you basic understanding of Logistic Regression Machine Learning Algorithm with examples. In this video, you will also get to see demo on Logistic Regression using Python. Below are the topics covered in this tutorial:
1. What is Regression?
2. What is Logistic Regression?
3. Why use Logistic Regression?
4. Linear vs Logistic Regression
5. Logistic Regression Use Cases
6. Logistic Regression Example Demo in Python
Subscribe to our channel to get video updates. Hit the subscribe button above.
Machine Learning Tutorial Playlist: https://goo.gl/UxjTxm
Sentiment analysis using naive bayes classifier Dev Sahu
This ppt contains a small description of naive bayes classifier algorithm. It is a machine learning approach for detection of sentiment and text classification.
KLASIFIKASI BAWANG BERBASIS CITRA DIGITAL MENGGUNAKAN METODE NAIVE BAYES CLAS...Ika Nurrohmah
Kemajuan teknologi komputer saat ini sangatlah pesat. Teknologi komputer dikembangkan agar dapat melakukan proses pengenalan suatu pola, sebagaimana kemampuan yang dimiliki manusia. Sistem pengenalan pola banyak dimanfaatkan saat ini, contohnya seperti pengenalan sidik jari dan telapak tangan. Disini kami mencoba mengklasifikasikan jenis bawang dengan menggunakan metode naive bayes classifier. Bawang merupakan sesuatu yang selalu kita jumpai dalam kehidupan sehari-hari lebih tepatnya dalam dunia dapur atau untuk memasak. Metode teori keputusan naive bayes adalah metode pengklasifikasian paling sederhana dari model pengklasifikasian yang ada dengan menggunakan konsep peluang, dimana diasumsikan bahwa setiap atribut contoh (data sampel) bersifat saling lepas satu sama lain berdasarkan atribut kelas. Mengklasifikasikan jenis bawang dengan menggunakan metode naive bayes classifier ini diharapkan dapat menggantikan cara mendeteksi jenis bawang secara manual. Pengklasifikasian ini akan mengklasifikasikan jenis bawang berdasarkan fitur-fitur yang dimiliki oleh bawang tersebut. Dalam melakukan pengklasifikasian ini, ada lima fitur yang digunakan yaitu warna R (Red), G (Green), B (Blue), Diameter, dan Panjang dari bawang tersebut. Pengklasifikasian jenis bawang yang kami lakukan ini berbasis citra yang mempunyai dataset 100 dengan empat kelas yaitu kelas bawang merah, kelas bawang putih, kelas bawang bombay, dan kelas bawang prei. Selanjutnya data-data tersebut diolah dengan menggunakan metode Naive Bayes Classifier yaitu dengan menghitung Probabilitas Prior, Probabilitas Likelihood dan yang terakhir Probabilitas Posterior. Disini pengklasifikasian jenis bawang di bagi menjadi tiga skenario, skenario 1 yaitu perbandingannya 80 : 20, 80% data training dan 20% data testing, skenario 2 yaitu perbandingannya 70 : 30, 70% data training dan 30% data testing, dan skenario 3 yaitu perbandingannya 50 : 50, 50% data training dan 50% data testing. Data pengujian di bagi menjadi 2 yaitu secara urut dan random. Hasil akurasi skenario 1 secara urut adalah 95.0% dan secara random adalah 95% , hasil akurasi skenario 2 secara urut adalah 93,33% dan secara random adalah 96,67%, dan hasil akurasi skenario 3 secara urut adalah 90.0% dan secara random 92,0%. Hasil akurasi ini bisa berubah-ubah pada setiap percobaan,tetapi tidak begitu banyak perubahan yang terjadi.
A Semi-naive Bayes Classifier with Grouping of CasesNTNU
In this work, we present a semi-naive Bayes classifier that searches for dependent attributes using different filter approaches. In order to avoid that the number of cases of the compound attributes be too high, a grouping procedure is applied each time after two variables are merged. This method tries to group two or more cases of the new variable into an unique value. In an emperical study, we show as this approach outperforms the naive Bayes classifier in a very robust way and reaches the performance of the Pazzani’s semi-naive Bayes [1] without the high cost of a wrapper search.
Wikipedia, Dead Authors, Naive Bayes and Python Abhaya Agarwal
My slides from PyCon 2011. The talk is about identifying Indian authors whose works are now in Public Domain. We use Wikipedia for this purpose and pose it as a document classification problem. Naive Bayes is used for the task.
The Naive Baye's Classifier basically uses the Baye’s Theorem. According to the 'statistics and probability' and 'probability theory', the baye’s theorem is used to describe the probability for an event to occur based on the conditions related to the event that occurs. Copy the link given below and paste it in new browser window to get more information on Naive Bayes:- http://www.transtutors.com/homework-help/statistics/naive-bayes.aspx
Sentiment Analysis in Twitter with Lightweight Discourse AnalysisSubhabrata Mukherjee
Sentiment Analysis in Twitter with Lightweight Discourse Analysis, Subhabrata Mukherjee and Pushpak Bhattacharyya, In Proceedings of the 24th International Conference on Computational Linguistics (COLING 2012), IIT Bombay, Mumbai, Dec 8 - Dec 15, 2012 (http://www.cse.iitb.ac.in/~pb/papers/coling12-discourse-sa.pdf)
Naive Bayes is a kind of classifier which uses the Bayes Theorem. It predicts membership probabilities for each class such as the probability that given record or data point belongs to a particular class.
These slides cover machine learning models more specifically classification algorithms (Logistic Regression, Linear Discriminant Analysis (LDA),
K-Nearest Neighbors (KNN),
Trees, Random Forests, and Boosting
Support Vector Machines (SVM),
Neural Networks)
Logistic regression is used to obtain odds ratio in the presence of more than one explanatory variable. The procedure is quite similar to multiple linear regression, with the exception that the response variable is binomial. The result is the impact of each variable on the odds ratio of the observed event of interest.
Chatty Kathy - UNC Bootcamp Final Project Presentation - Final Version - 5.23...John Andrews
SlideShare Description for "Chatty Kathy - UNC Bootcamp Final Project Presentation"
Title: Chatty Kathy: Enhancing Physical Activity Among Older Adults
Description:
Discover how Chatty Kathy, an innovative project developed at the UNC Bootcamp, aims to tackle the challenge of low physical activity among older adults. Our AI-driven solution uses peer interaction to boost and sustain exercise levels, significantly improving health outcomes. This presentation covers our problem statement, the rationale behind Chatty Kathy, synthetic data and persona creation, model performance metrics, a visual demonstration of the project, and potential future developments. Join us for an insightful Q&A session to explore the potential of this groundbreaking project.
Project Team: Jay Requarth, Jana Avery, John Andrews, Dr. Dick Davis II, Nee Buntoum, Nam Yeongjin & Mat Nicholas
Explore our comprehensive data analysis project presentation on predicting product ad campaign performance. Learn how data-driven insights can optimize your marketing strategies and enhance campaign effectiveness. Perfect for professionals and students looking to understand the power of data analysis in advertising. for more details visit: https://bostoninstituteofanalytics.org/data-science-and-artificial-intelligence/
As Europe's leading economic powerhouse and the fourth-largest hashtag#economy globally, Germany stands at the forefront of innovation and industrial might. Renowned for its precision engineering and high-tech sectors, Germany's economic structure is heavily supported by a robust service industry, accounting for approximately 68% of its GDP. This economic clout and strategic geopolitical stance position Germany as a focal point in the global cyber threat landscape.
In the face of escalating global tensions, particularly those emanating from geopolitical disputes with nations like hashtag#Russia and hashtag#China, hashtag#Germany has witnessed a significant uptick in targeted cyber operations. Our analysis indicates a marked increase in hashtag#cyberattack sophistication aimed at critical infrastructure and key industrial sectors. These attacks range from ransomware campaigns to hashtag#AdvancedPersistentThreats (hashtag#APTs), threatening national security and business integrity.
🔑 Key findings include:
🔍 Increased frequency and complexity of cyber threats.
🔍 Escalation of state-sponsored and criminally motivated cyber operations.
🔍 Active dark web exchanges of malicious tools and tactics.
Our comprehensive report delves into these challenges, using a blend of open-source and proprietary data collection techniques. By monitoring activity on critical networks and analyzing attack patterns, our team provides a detailed overview of the threats facing German entities.
This report aims to equip stakeholders across public and private sectors with the knowledge to enhance their defensive strategies, reduce exposure to cyber risks, and reinforce Germany's resilience against cyber threats.
StarCompliance is a leading firm specializing in the recovery of stolen cryptocurrency. Our comprehensive services are designed to assist individuals and organizations in navigating the complex process of fraud reporting, investigation, and fund recovery. We combine cutting-edge technology with expert legal support to provide a robust solution for victims of crypto theft.
Our Services Include:
Reporting to Tracking Authorities:
We immediately notify all relevant centralized exchanges (CEX), decentralized exchanges (DEX), and wallet providers about the stolen cryptocurrency. This ensures that the stolen assets are flagged as scam transactions, making it impossible for the thief to use them.
Assistance with Filing Police Reports:
We guide you through the process of filing a valid police report. Our support team provides detailed instructions on which police department to contact and helps you complete the necessary paperwork within the critical 72-hour window.
Launching the Refund Process:
Our team of experienced lawyers can initiate lawsuits on your behalf and represent you in various jurisdictions around the world. They work diligently to recover your stolen funds and ensure that justice is served.
At StarCompliance, we understand the urgency and stress involved in dealing with cryptocurrency theft. Our dedicated team works quickly and efficiently to provide you with the support and expertise needed to recover your assets. Trust us to be your partner in navigating the complexities of the crypto world and safeguarding your investments.
Levelwise PageRank with Loop-Based Dead End Handling Strategy : SHORT REPORT ...Subhajit Sahu
Abstract — Levelwise PageRank is an alternative method of PageRank computation which decomposes the input graph into a directed acyclic block-graph of strongly connected components, and processes them in topological order, one level at a time. This enables calculation for ranks in a distributed fashion without per-iteration communication, unlike the standard method where all vertices are processed in each iteration. It however comes with a precondition of the absence of dead ends in the input graph. Here, the native non-distributed performance of Levelwise PageRank was compared against Monolithic PageRank on a CPU as well as a GPU. To ensure a fair comparison, Monolithic PageRank was also performed on a graph where vertices were split by components. Results indicate that Levelwise PageRank is about as fast as Monolithic PageRank on the CPU, but quite a bit slower on the GPU. Slowdown on the GPU is likely caused by a large submission of small workloads, and expected to be non-issue when the computation is performed on massive graphs.
Techniques to optimize the pagerank algorithm usually fall in two categories. One is to try reducing the work per iteration, and the other is to try reducing the number of iterations. These goals are often at odds with one another. Skipping computation on vertices which have already converged has the potential to save iteration time. Skipping in-identical vertices, with the same in-links, helps reduce duplicate computations and thus could help reduce iteration time. Road networks often have chains which can be short-circuited before pagerank computation to improve performance. Final ranks of chain nodes can be easily calculated. This could reduce both the iteration time, and the number of iterations. If a graph has no dangling nodes, pagerank of each strongly connected component can be computed in topological order. This could help reduce the iteration time, no. of iterations, and also enable multi-iteration concurrency in pagerank computation. The combination of all of the above methods is the STICD algorithm. [sticd] For dynamic graphs, unchanged components whose ranks are unaffected can be skipped altogether.
2. Naïve Bayes Classifier
• Only utilize the simple probability and Bayes’ theorem
• Computational efficiency
Definition
Potential Use Cases
In machine learning, Naive Bayes classifiers are a family of simple probabilistic classifiers based on
applying Bayes' theorem with strong (naive) independence assumptions between the features.
It is one of the most basic text classification techniques with various applications
• Email Spam Detection
• Language Detection
• Sentiment Detection
• Personal email sorting
• Document categorization
Advantages
3. Basic Probability Theory
• 2 events are disjoint (exclusive): if they can’t happen at the same time (a single coin flip cannot
yield a tail and a head at the same time). For Bayes classification, we are not concerned with
disjoint events.
• 2 events are independent: when they can happen at the same time, but the occurrence of one
event does not make the occurrence of another more or less probable. For example the second
coin-flip you make is not affected by the outcome of the first coin-flip.
• 2 events are dependent: if the outcome of one affects the other. In the example above, clearly it
cannot rain without a cloud formation. Also, in a horse race, some horses have better
performance on rainy days.
Events and Event Probability
Event Relationship
An “event” is a set of outcomes (a subset of all possible outcomes) with a probability attached. So
when flipping a coin, we can have one of these 2 events happening: tail or head. Each of them has a
probability of 50%. Using a Venn diagram, this would look like this:
events of flipping a coin events of rain and cloud formation
4. Conditional Probability and Independence
Two events are said to be independent if
the result of the second event is not
affected by the result of the first
event. The joint probability is the product
of the probabilities of the individual
events.
Two events are said to
be dependent if the result of the
second event is affected by the
result of the first event. The joint
probability is the product of the
probability of first event and
conditional probability of second
event on first event.
Chain Rule for Computing Joint Probability
)|()(),( ABPAPBAP ⋅=
For dependent events
For independent events
5. Conditional Probability and Bayes Theorem
• Posterior Probability (This is what we are trying to compute)
• probability of instance X being in class c
• Likelihood (Being in class c, causes you to have feature X with some probability)
• probability of generating instance X given class c
• Class Prior Probability (This is just how frequent the class c, is in our database)
• probability of occurrence of class c
• Predictor Prior Probability (Ignored because it is constant)
• probability of instance x occurring
)()|()()|(),( cPcXPXPXcPXcP ⋅=⋅=Conditional Probability:
)(
)()|(
)|(
XP
cPcXP
XcP
⋅
=
Likelihood Class Prior Probability
Posterior Probability
Predictor Prior Probability
Bayes Theorem:
6. Bayes Theorem Example
Let’s take one example. So we have the following stats:
• 30 emails out of a total of 74 are spam messages
• 51 emails out of those 74 contain the word “penis”
• 20 emails containing the word “penis” have been marked as spam
So the question is: what is the probability that the latest received email is a
spam message, given that it contains the word “penis”?
These 2 events are clearly dependent, which is why you must use the simple
form of the Bayes Theorem:
7. Naïve Bayes Approach
For single feature, applying Bayes theorem is simple. But it becomes more
complex when handling more features. For example
=),|( viagrapenisspamP
To simplify it, strong (naïve)
independence assumption between
features is applied
Let us complicate the problem above by adding to it:
• 25 emails out of the total contain the word “viagra”
• 24 emails out of those have been marked as spam
so what’s the probability that an email is spam, given that it contains both “viagra” and “penis”?
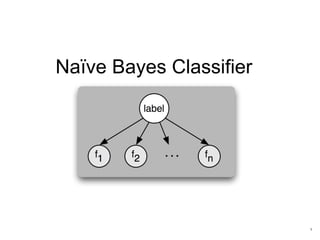
8. Naïve Bayes Classifier
Learning
1. Compute the class prior table which contains all P(c)
2. Compute the likelihood table which contains all P(xi|c) for all possible
combination of xi and c;
Scoring
1. Given a test instance X, compute the posterior probability of every class c;
2. Compare all P(c|X) and assign the instance x to the class c* which has the
maximum posterior probability
∏=
≈
K
i
i cPcXPXcP
1
)()|()|(
The constant term is ignored because it
won’t affect the comparison across different posterior
probabilities
∏=
=
N
i
iXPXP
1
)()(
∑=
+=
K
i
ic cXPcPc
1
*
))|(log())(log(maxarg
∑=
+≈
K
i
i cXPcPXcP
1
))|(log())(log()|(log
To avoid floating point underflow, we often need an optimization on the formula
9. Handling Insufficient Data
Problem
Both prior and conditional probabilities must be estimated from training data,
therefore subject to error. If we have only few training instances, then the
direct probability computation can give probabilities extreme values 0 or 1.
Example
Suppose we try to predict whether a patient has an allergy based on the
attribute whether he has cough. So we need to estimate P(allergy|cough). If
all patients in the training data have cough, then P(cough=true|allergy)=1 and
P(cough=false|allergy)=1-P(true|allergy)=0. Then we have
• What this mean is no not-coughing person can have an allergy, which is
not true.
• The error is caused by there is no observations in training data for non-
coughing patients
Solution
We need smooth the estimates of conditional probabilities to eliminate zeros.
0)()|()|( ==∝= allergyPallergyfalsecoughPfalsecoughallergyP
10. Laplace Smoothing
Assume binary attribute Xi, direct estimate:
Laplace estimate:
equivalent to prior observation of one example of class k where Xi=0 and one
where Xi=1
Generalized Laplace estimate:
• nc,i,v: number of examples in c where Xi=v
• nc: number of examples in c
• si: number of possible values for Xi
ic
vic
i
sn
n
cvXP
+
+
==
1
)|( ,,
2
1
)|0( 0,,
+
+
==
c
ic
i
n
n
cXP
2
1
)|1( 1,,
+
+
==
c
ic
i
n
n
cXP
c
ic
i
n
n
cXP 0,,
)|0( ==
c
ic
i
n
n
cXP 1,,
)|1( ==
11. Comments on Naïve Bayes Classifier
• It generally works well despite blanket independence assumption
• Experiments shows that it is quite competitive with other methods on
standard datasets
• Even when independence assumptions violated, and probability estimates
are inaccurate, the method may still find the maximum probability category
• Hypothesis constructed directly from parameter estimates derived from
training data, no search
• Hypothesis not guaranteed to fit the training data