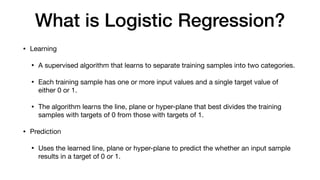
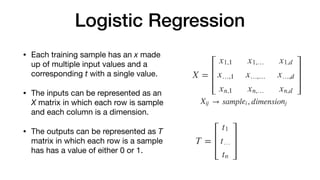
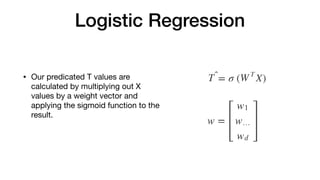
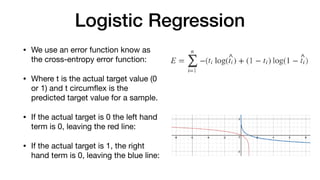
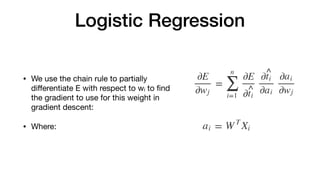
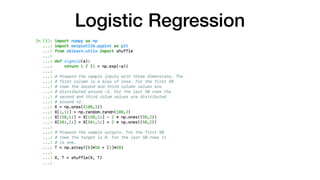
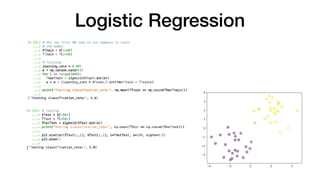
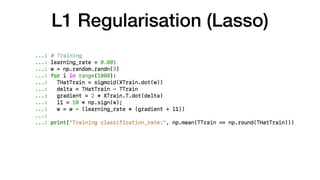
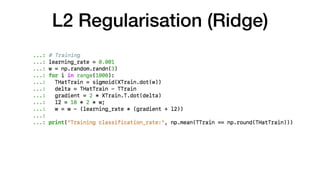
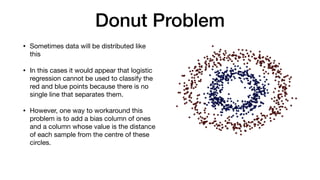
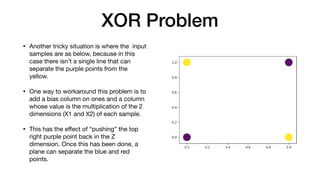
Machine Learning
Logistic Regression
Agenda
• Logistic Regression

• Generalisation, Over-fitting & Regularisation

• Donut Problem

• XOR Problem
What is Logistic Regression?
• Learning

• A supervised algorithm that learns to separate training samples into two categories.

• Each training sample has one or more input values and a single target value of
either 0 or 1.

• The algorithm learns the line, plane or hyper-plane that best divides the training
samples with targets of 0 from those with targets of 1.

• Prediction

• Uses the learned line, plane or hyper-plane to predict the whether an input sample
results in a target of 0 or 1.
Logistic Regression
Logistic Regression
• Each training sample has an x made
up of multiple input values and a
corresponding t with a single value. 

• The inputs can be represented as an
X matrix in which each row is sample
and each column is a dimension. 

• The outputs can be represented as T
matrix in which each row is a sample
has has a value of either 0 or 1.
Logistic Regression
• Our predicated T values are
calculated by multiplying out X
values by a weight vector and
applying the sigmoid function to the
result.
Logistic Regression
• The sigmoid function is:

• And has a graph like this:

• By applying this function we end up
with predictions that are between
zero and one
Logistic Regression
• We use an error function know as
the cross-entropy error function: 

• Where t is the actual target value (0
or 1) and t circumflex is the
predicted target value for a sample.

• If the actual target is 0 the left hand
term is 0, leaving the red line:

• If the actual target is 1, the right
hand term is 0, leaving the blue line:
Logistic Regression
• We use the chain rule to partially
differentiate E with respect to wi to find
the gradient to use for this weight in
gradient descent:

• Where:
Logistic Regression
• Taking the first term:

• Taking the third term:
Logistic Regression
• Taking the second term:
Logistic Regression
• Multiplying the three
derivatives and simplifying
ends up with:

• In matrix form, for all weights:

• In code we use this with
gradient descent to derive the
weights that minimise the
error.
Logistic Regression
Logistic Regression
Generalisation, Over-fitting &
Regularisation
Generalisation & Over-fitting
• As we train our model with more and more data the it may start to fit the training data more and
more accurately, but become worse at handling test data that we feed to it later. 

• This is know as “over-fitting” and results in an increased generalisation error.

• To minimise the generalisation error we should 

• Collect as much sample data as possible. 

• Use a random subset of our sample data for training.

• Use the remaining sample data to test how well our model copes with data it was not trained
with.

• Also, experiment with adding higher degrees of polynomials (X2, X3, etc) as this can reduce
overfitting.
L1 Regularisation (Lasso)
• In L1 regularisation we add a penalty to
the error function: 

• Expanding this we get: 

• Take the derivative with respect to w to
find our gradient:

• Where sign(w) is -1 if w < 0, 0 if w = 0
and +1 if w > 0

• Note that because sign(w) has no
inverse function we cannot solve for w
and so must use gradient descent.
L1 Regularisation (Lasso)
L2 Regularisation (Ridge)
• In L2 regularisation we the sum of
the squares of the weights to the
error function.

• Expanding this we get: 

• Take the derivative with respect to
w to find our gradient:
L2 Regularisation (Ridge)
Donut Problem
Donut Problem
• Sometimes data will be distributed like
this

• In this cases it would appear that logistic
regression cannot be used to classify the
red and blue points because there is no
single line that separates them.

• However, one way to workaround this
problem is to add a bias column of ones
and a column whose value is the distance
of each sample from the centre of these
circles.
XOR Problem
XOR Problem
• Another tricky situation is where the  input
samples are as below, because in this
case there isn’t a single line that can
separate the purple points from the
yellow.

• One way to workaround this problem is to
add a bias column on ones and a column
whose value is the multiplication of the 2
dimensions (X1 and X2) of each sample. 

• This has the effect of “pushing” the top
right purple point back in the Z
dimension. Once this has been done, a
plane can separate the blue and red
points.
Summary
• Logistic Regression

• Generalisation, Over-fitting & Regularisation

• Donut Problem

• XOR Problem

Logistic regression

  • 1.
  • 2.
    Agenda • Logistic Regression •Generalisation, Over-fitting & Regularisation • Donut Problem • XOR Problem
  • 3.
    What is LogisticRegression? • Learning • A supervised algorithm that learns to separate training samples into two categories. • Each training sample has one or more input values and a single target value of either 0 or 1. • The algorithm learns the line, plane or hyper-plane that best divides the training samples with targets of 0 from those with targets of 1. • Prediction • Uses the learned line, plane or hyper-plane to predict the whether an input sample results in a target of 0 or 1.
  • 4.
  • 5.
    Logistic Regression • Eachtraining sample has an x made up of multiple input values and a corresponding t with a single value. • The inputs can be represented as an X matrix in which each row is sample and each column is a dimension. • The outputs can be represented as T matrix in which each row is a sample has has a value of either 0 or 1.
  • 6.
    Logistic Regression • Ourpredicated T values are calculated by multiplying out X values by a weight vector and applying the sigmoid function to the result.
  • 7.
    Logistic Regression • Thesigmoid function is: • And has a graph like this: • By applying this function we end up with predictions that are between zero and one
  • 8.
    Logistic Regression • Weuse an error function know as the cross-entropy error function: • Where t is the actual target value (0 or 1) and t circumflex is the predicted target value for a sample. • If the actual target is 0 the left hand term is 0, leaving the red line: • If the actual target is 1, the right hand term is 0, leaving the blue line:
  • 9.
    Logistic Regression • Weuse the chain rule to partially differentiate E with respect to wi to find the gradient to use for this weight in gradient descent: • Where:
  • 10.
    Logistic Regression • Takingthe first term: • Taking the third term:
  • 11.
  • 12.
    Logistic Regression • Multiplyingthe three derivatives and simplifying ends up with: • In matrix form, for all weights: • In code we use this with gradient descent to derive the weights that minimise the error.
  • 13.
  • 14.
  • 15.
  • 16.
    Generalisation & Over-fitting •As we train our model with more and more data the it may start to fit the training data more and more accurately, but become worse at handling test data that we feed to it later. • This is know as “over-fitting” and results in an increased generalisation error. • To minimise the generalisation error we should • Collect as much sample data as possible. • Use a random subset of our sample data for training. • Use the remaining sample data to test how well our model copes with data it was not trained with. • Also, experiment with adding higher degrees of polynomials (X2, X3, etc) as this can reduce overfitting.
  • 17.
    L1 Regularisation (Lasso) •In L1 regularisation we add a penalty to the error function: • Expanding this we get: • Take the derivative with respect to w to find our gradient: • Where sign(w) is -1 if w < 0, 0 if w = 0 and +1 if w > 0 • Note that because sign(w) has no inverse function we cannot solve for w and so must use gradient descent.
  • 18.
  • 19.
    L2 Regularisation (Ridge) •In L2 regularisation we the sum of the squares of the weights to the error function. • Expanding this we get: • Take the derivative with respect to w to find our gradient:
  • 20.
  • 21.
  • 22.
    Donut Problem • Sometimesdata will be distributed like this • In this cases it would appear that logistic regression cannot be used to classify the red and blue points because there is no single line that separates them. • However, one way to workaround this problem is to add a bias column of ones and a column whose value is the distance of each sample from the centre of these circles.
  • 23.
  • 24.
    XOR Problem • Anothertricky situation is where the  input samples are as below, because in this case there isn’t a single line that can separate the purple points from the yellow. • One way to workaround this problem is to add a bias column on ones and a column whose value is the multiplication of the 2 dimensions (X1 and X2) of each sample. • This has the effect of “pushing” the top right purple point back in the Z dimension. Once this has been done, a plane can separate the blue and red points.
  • 25.
    Summary • Logistic Regression •Generalisation, Over-fitting & Regularisation • Donut Problem • XOR Problem