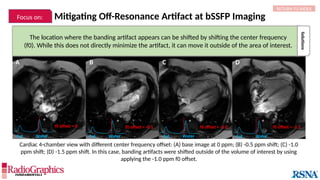
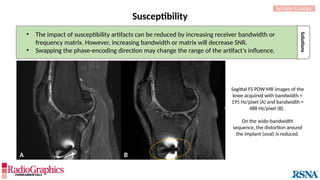
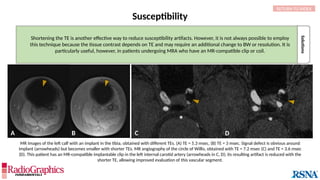
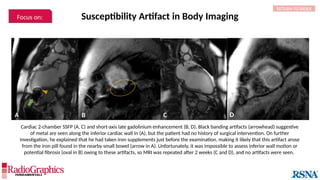
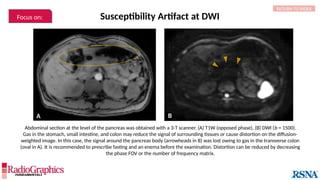
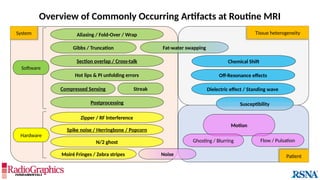
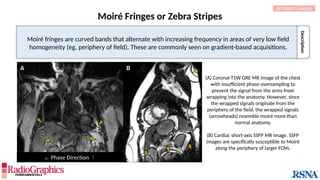
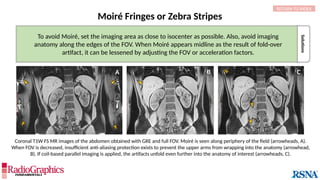
The document provides a comprehensive overview of various MRI artifacts, their causes, and strategies to mitigate them for improved clinical imaging. It emphasizes the importance of understanding these artifacts for both MRI technologists and radiologists to enhance the quality of MRI examinations. Key topics include common artifacts like aliasing, Gibbs ringing, and motion artifacts, along with practical solutions and trade-offs for addressing these issues.


![Description
Causes
Gibbs or Truncation
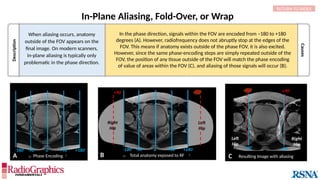
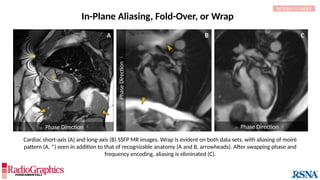
A
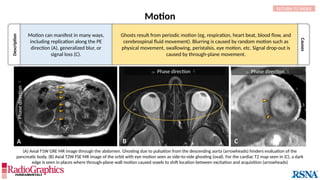
Phase Direction
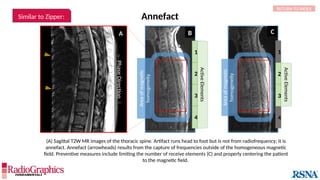
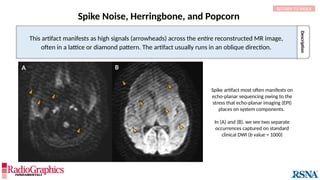
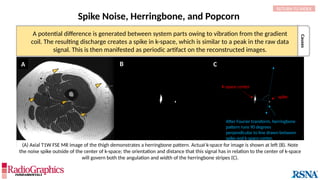
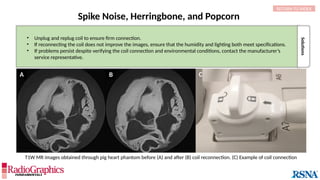
RETURN TO INDEX
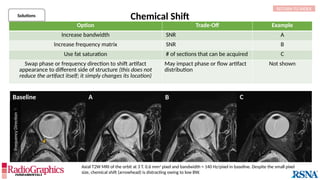
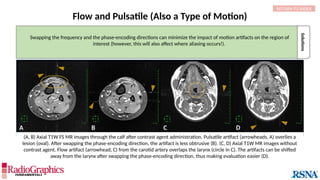
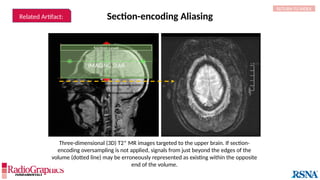
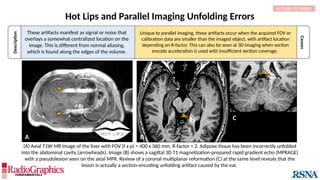
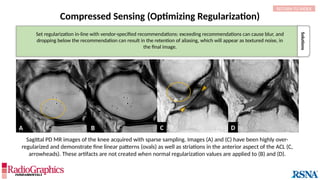
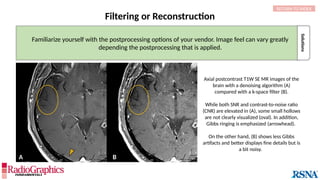
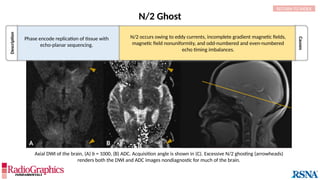
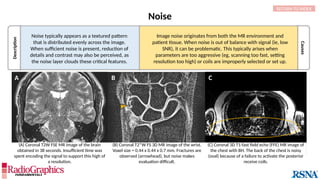
(A) Sagittal T2W cervical MR image with FOV = 240 mm, matrix (frequency-encoding direction [f] ×
phase-encoding direction [p]) = 272 × 256. Gibbs (arrowheads) is common in the spine and may
interfere with the depiction of spinal cord contusions or mimic a syrinx. Out-of-phase (B) and in-phase
(C) axial T1W abdominal GRE MR images with truncation artifacts (arrowheads) along the margins of
organs. Small lesions along the lateral liver and spleen can be overlooked because of this artifact.
• Gibbs results from the Fourier transform process used to
reconstruct the MR signal into images.
• When strong signals change suddenly in a stepwise manner,
they can be truncated by the Fourier process and thus
inaccurately approximated in the final image.
Alternating stripes at high-contrast boundaries. Gibbs
can occur in any direction, but it is most common
along the phase-encoding direction since this
direction typically employs a lower matrix in the
interest of time savings.
B
Phase
Direction
C](https://image.slidesharecdn.com/42-240919231123-756fe390/85/A-primer-on-magnetic-resonance-imaging-artifacts-12-320.jpg)
![A B C
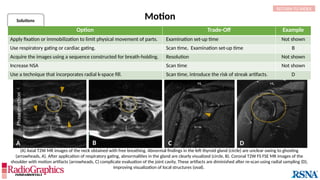
Gibbs or Truncation
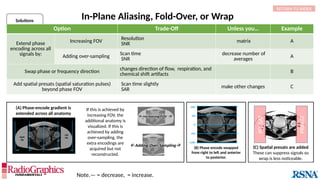
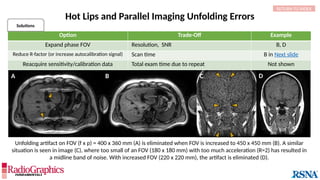
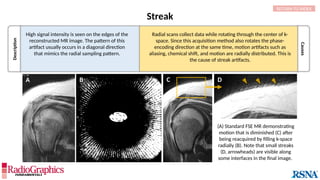
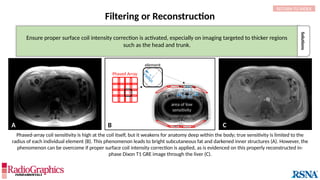
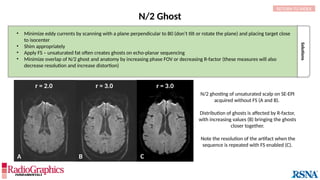
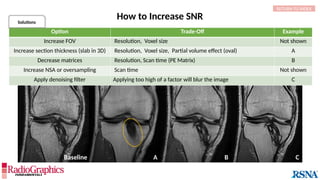
Option Trade-Off Example
Decrease pixel size by:
Decreasing field of view SNR Not shown
Increasing matrix Scan time (phase-encoding [PE] matrix); SNR A
Apply raw data filter Image blur B
Decrease echo train length Scan time C
Decrease bandwidth Chemical shift; Sensitivity to motion Not shown
Solutions
RETURN TO INDEX
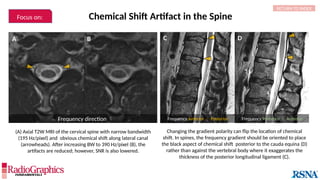
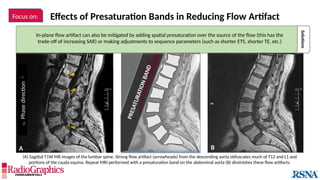
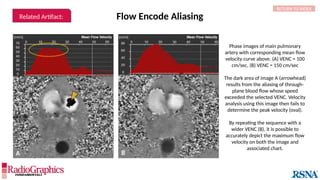
Baseline
Axial fluid-attenuated inversion-recovery (FLAIR) MR images of the brain. FOV = 220 mm and matrix (f × p) = 256 × 128 in
baseline. In this situation, Gibbs (arrowheads) may complicate the assessment of subtle cortical abnormalities, such as
focal cortical hypoplasia.](https://image.slidesharecdn.com/42-240919231123-756fe390/85/A-primer-on-magnetic-resonance-imaging-artifacts-13-320.jpg)

![Free-Induction Decay
*
RETURN TO INDEX
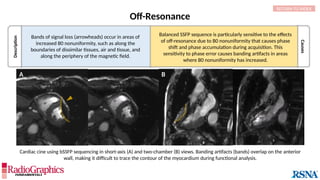
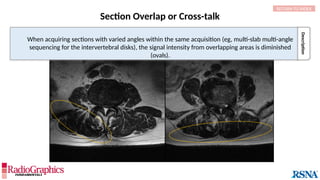
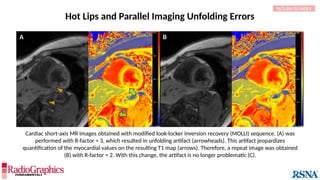
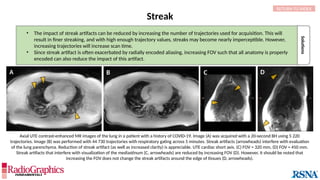
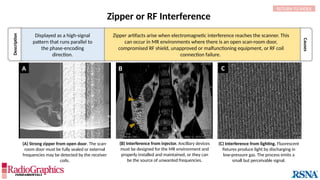
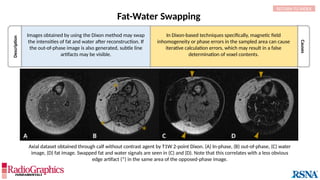
Similar to herringbone:
(A) Coronal short inversion-time
inversion-recovery (STIR) MRI of
the pelvis, (B) sagittal T2 FS MRI
of the brain utilizing 3D FSE with
VFA. Although similar to
herringbone, FID artifacts can be
differentiated because the lines
are often wavy (arrows),
whereas herringbone is straight.
Also, FID artifacts stop abruptly
in some places (*), whereas
herringbone will carry across the
entire image.
Causes
Solutions
A B
FID can sometimes be resolved by applying
full 90° or 180° RF pulses and increasing
echo time (TE) or echo spacing.
Additionally, use of ≥2 averages will almost
always eliminate the artifact.
In theory, spin-echoes utilize a 90° or 180° pulse to excite and refocus
spins. In practice, however, if some spins are not fully exposed to both
pulses, errant signal results and manifests as a free-induction decay
(FID) artifact. This is most common when modified refocusing pulse
schemes (eg, variable flip angle [VFA]) are used and in areas where
there is localized tissue inhomogeneity.](https://image.slidesharecdn.com/42-240919231123-756fe390/85/A-primer-on-magnetic-resonance-imaging-artifacts-33-320.jpg)
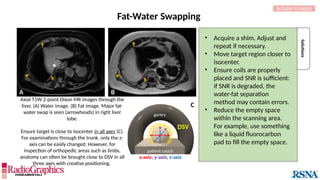
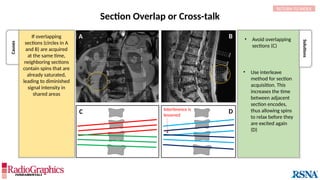
![ Frequency Direction
B C
A
Frequency Direction
Description
Causes
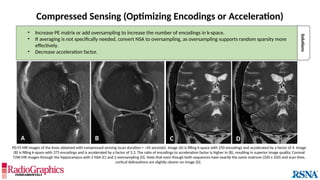
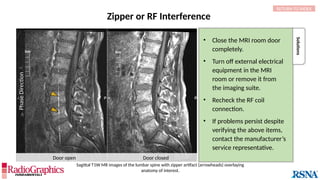
Chemical Shift
In areas where tissue containing fat borders a source
of water signal (eg, aqueous humor, cerebrospinal
fluid [CSF], etc.), an image shift occurs along the
frequency-encoding direction, and white or black
borders are observed at the tissue interfaces.
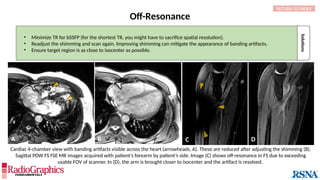
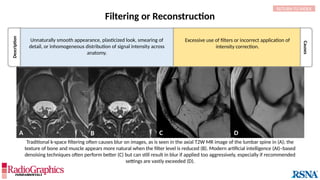
(A) Axial T2W MRI of the kidney with chemical shift artifact seen on either side of renal cortex. Sagittal T2W cervical in-phase (B) and water (C)
MR images from the Dixon dataset. Note that chemical shift (arrowheads) is completely removed when signals from fat are suppressed on (C).
RETURN TO INDEX
Protons of different molecules precess at different
frequencies; water protons rotate slightly faster (3.5 ppm)
than fat protons. Therefore, the fat and water components of
a voxel are encoded at different locations along the frequency
direction.](https://image.slidesharecdn.com/42-240919231123-756fe390/85/A-primer-on-magnetic-resonance-imaging-artifacts-42-320.jpg)