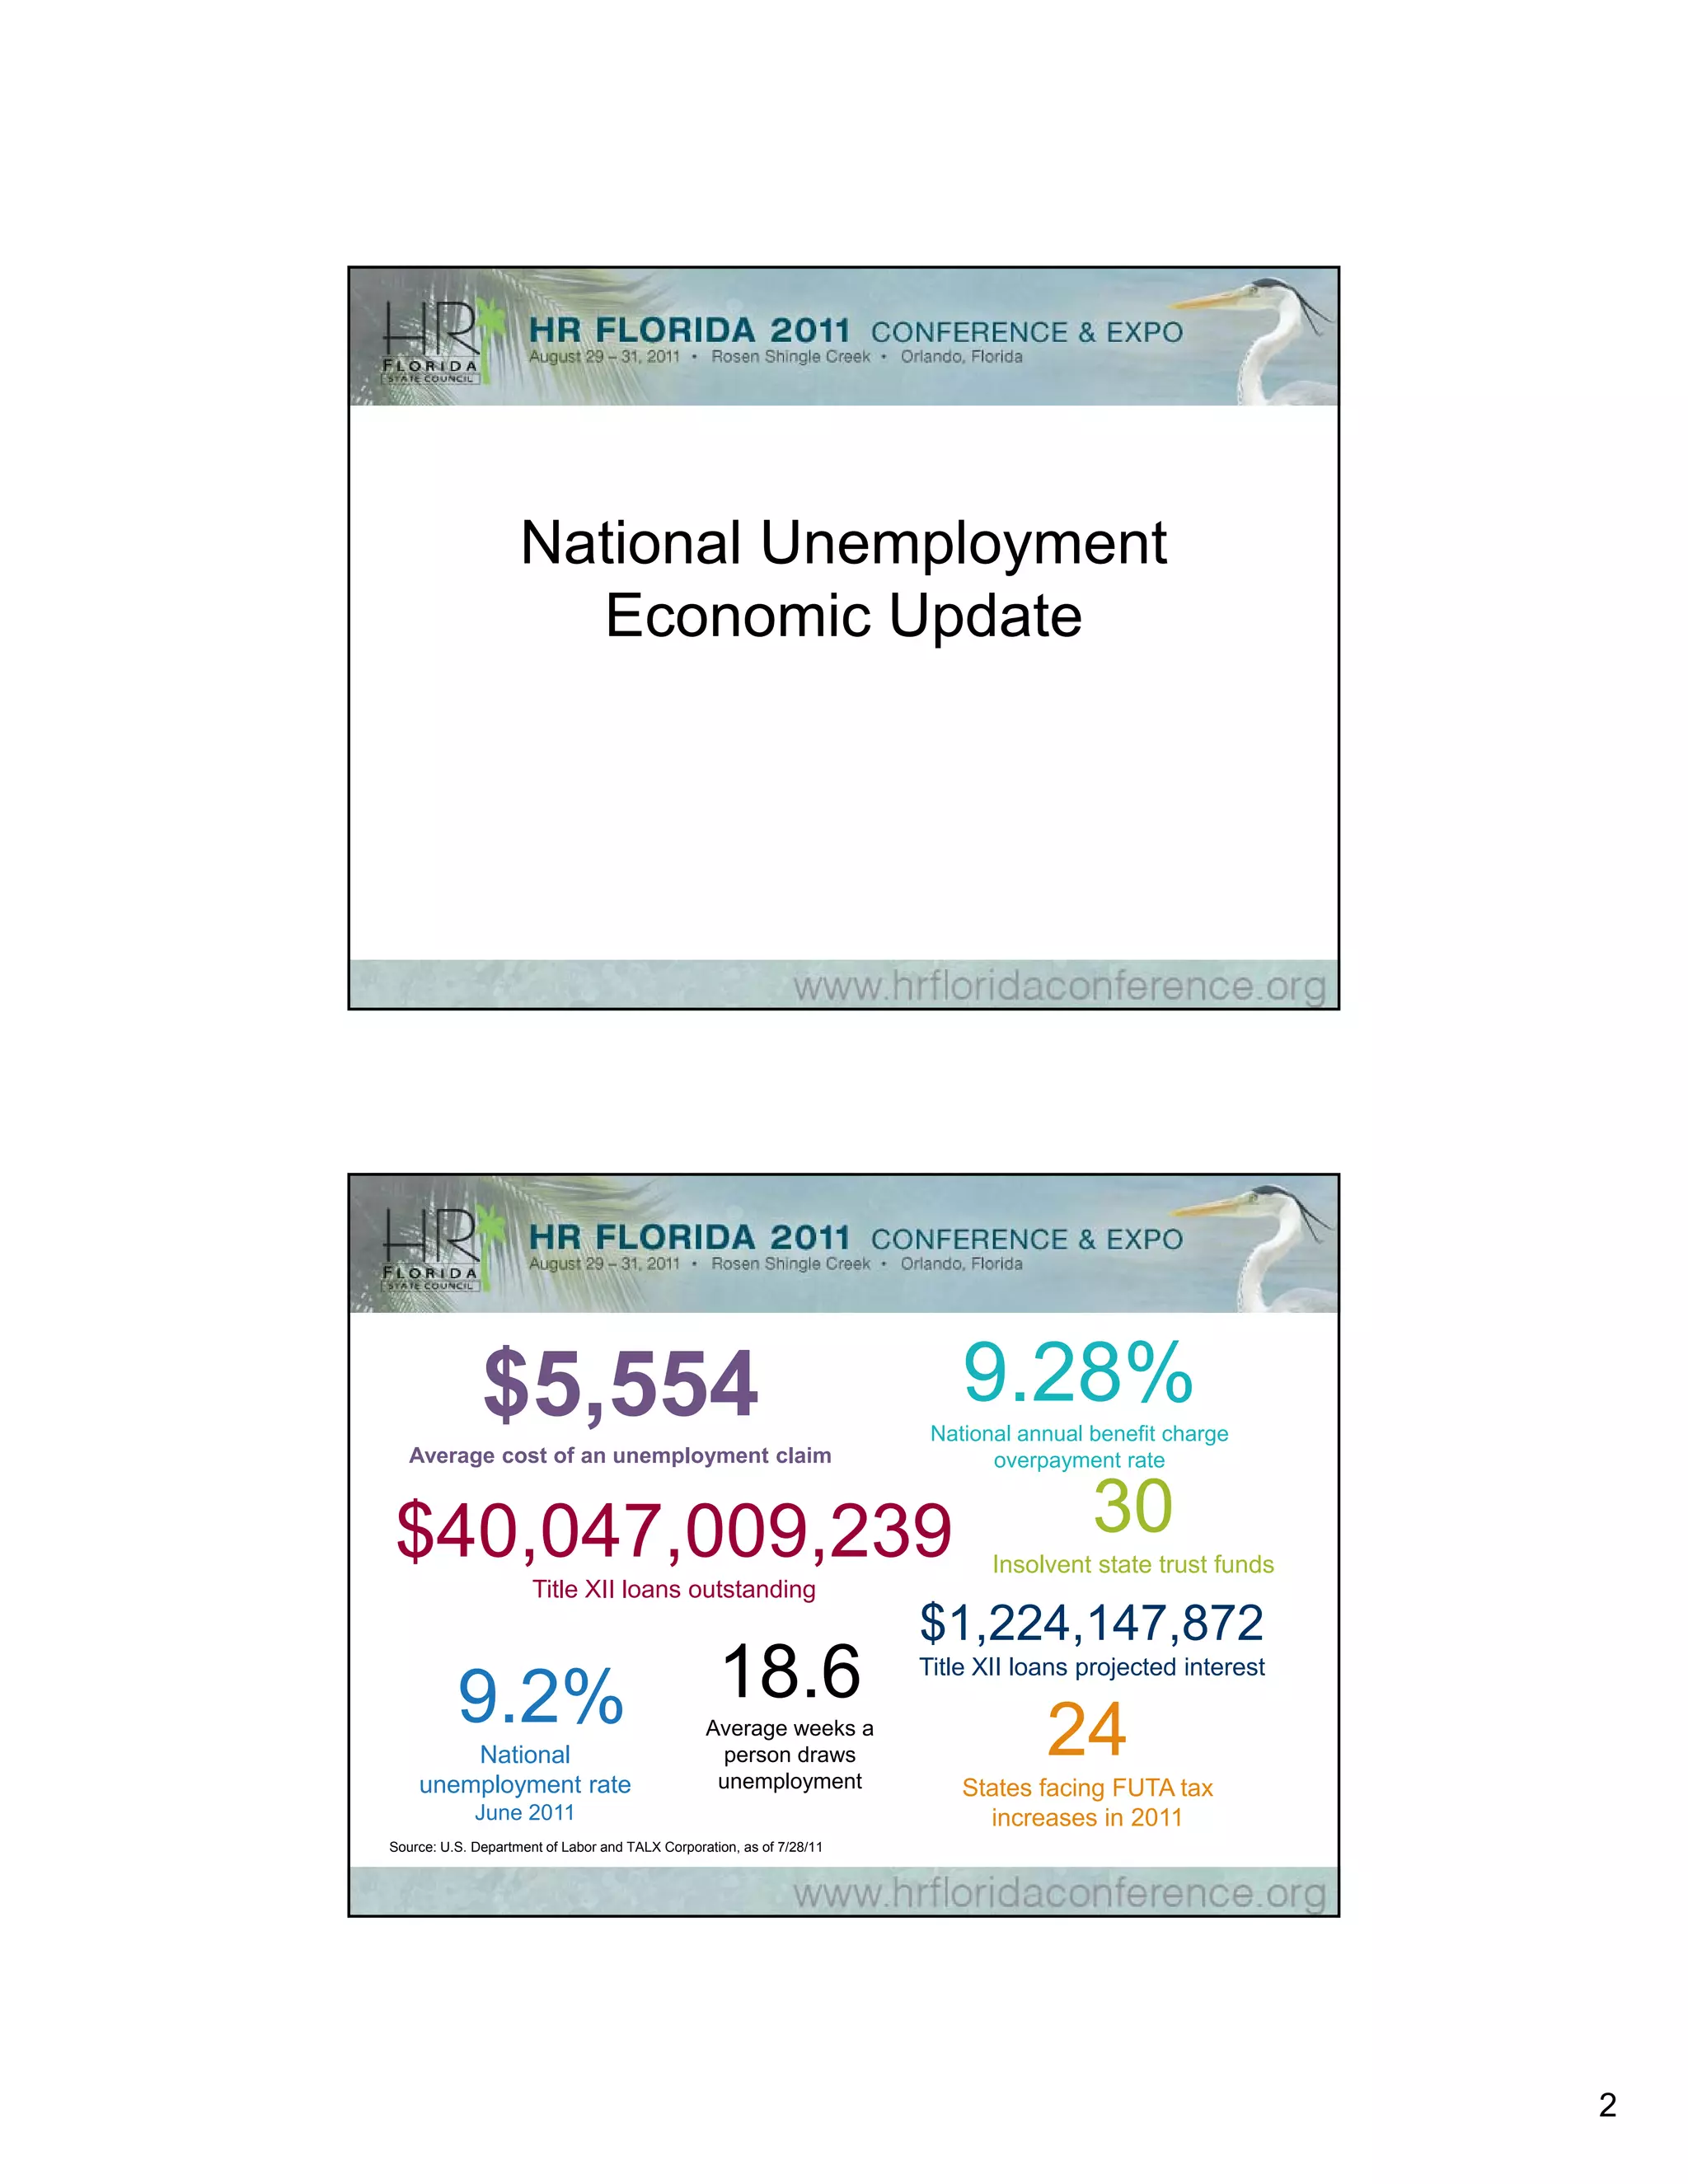
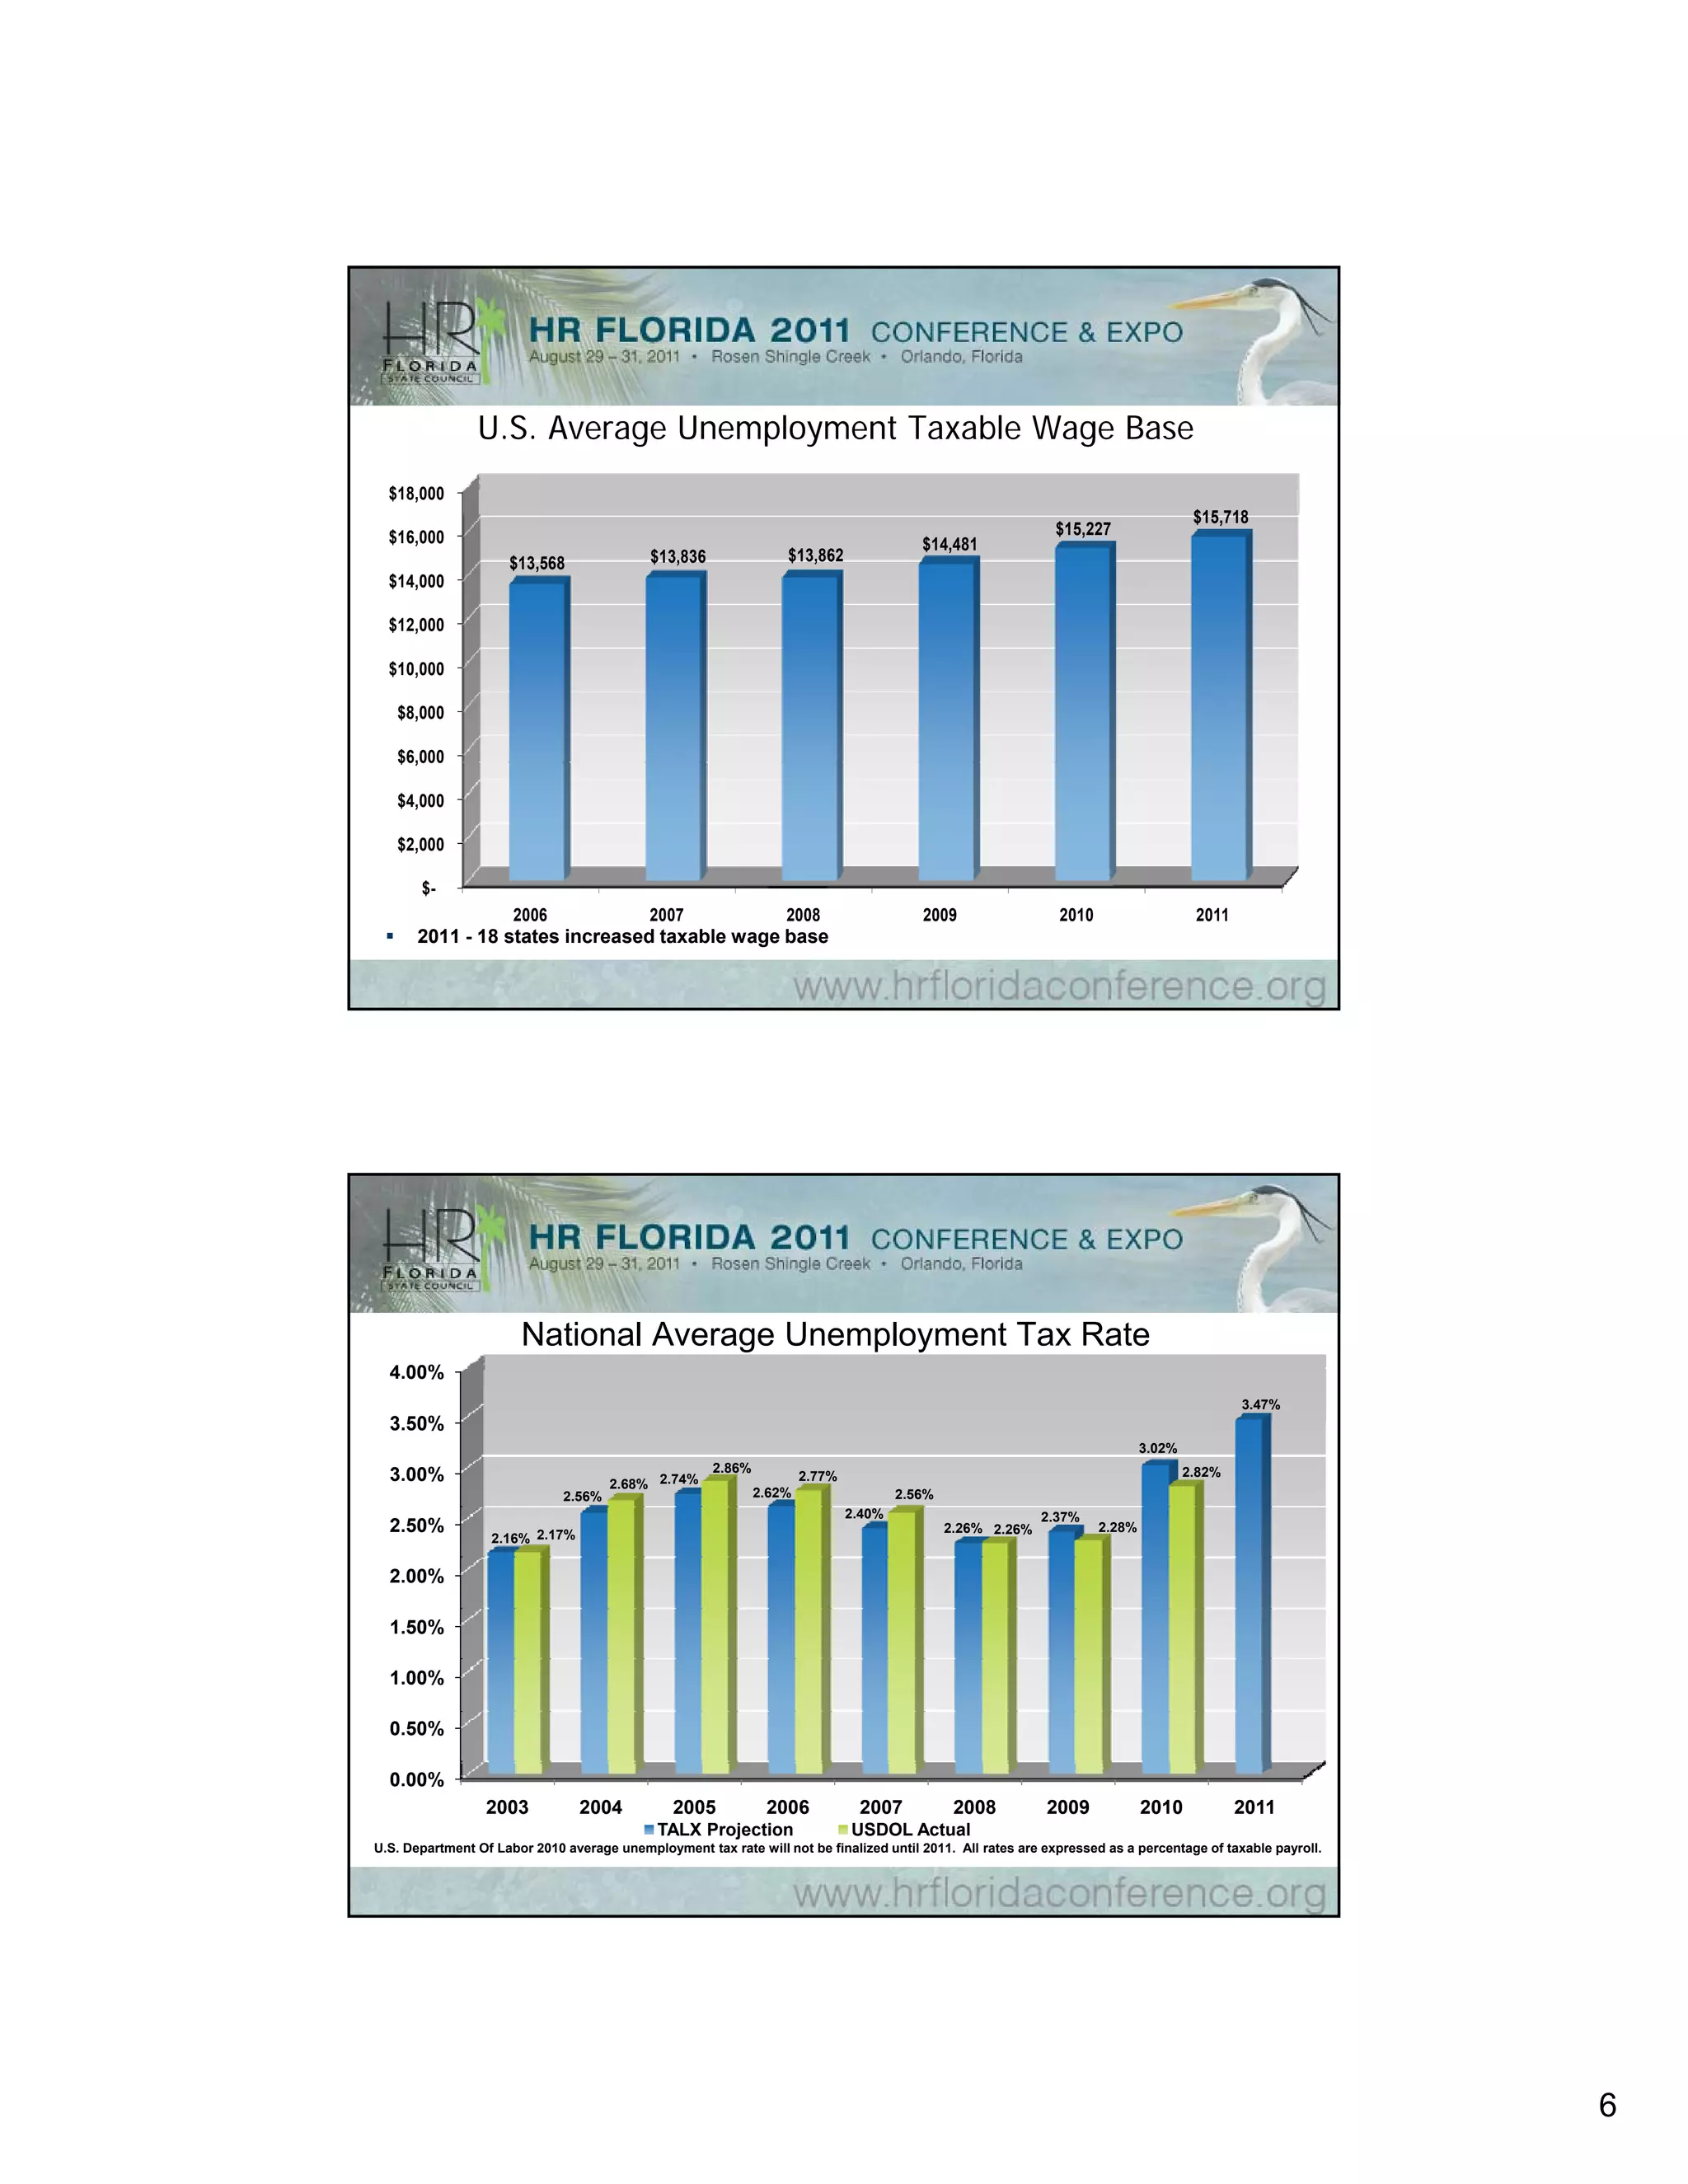
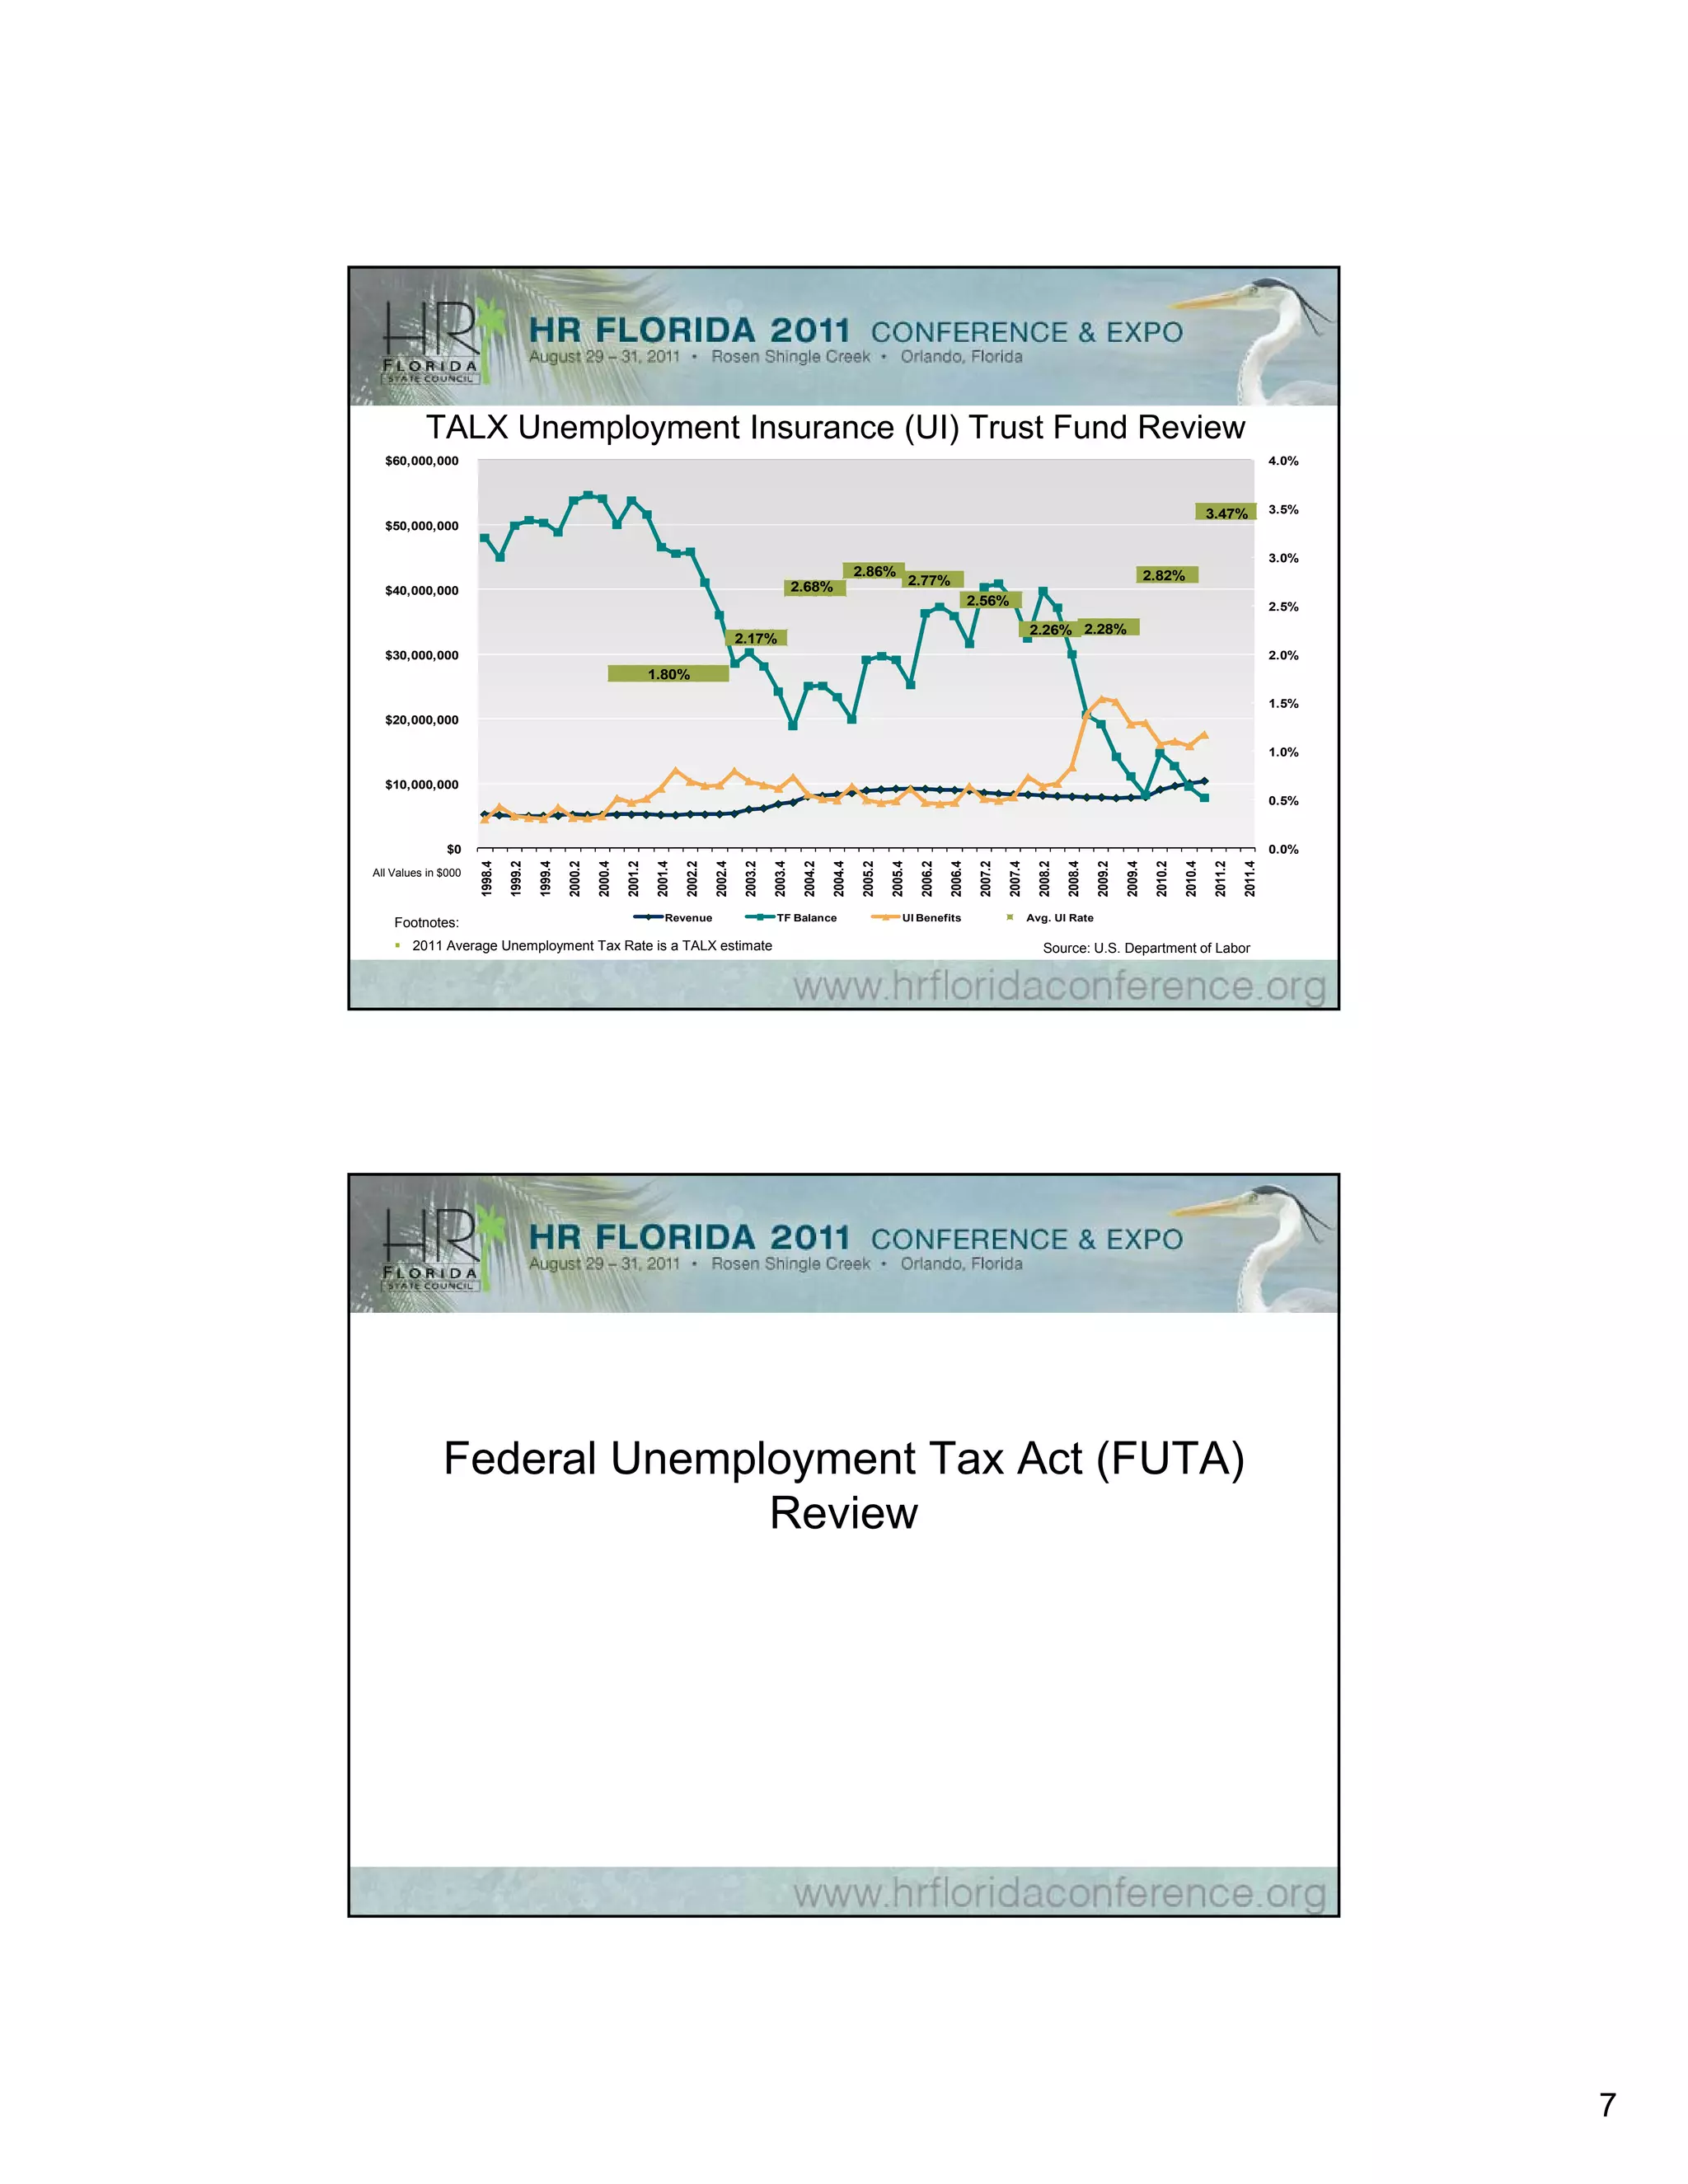
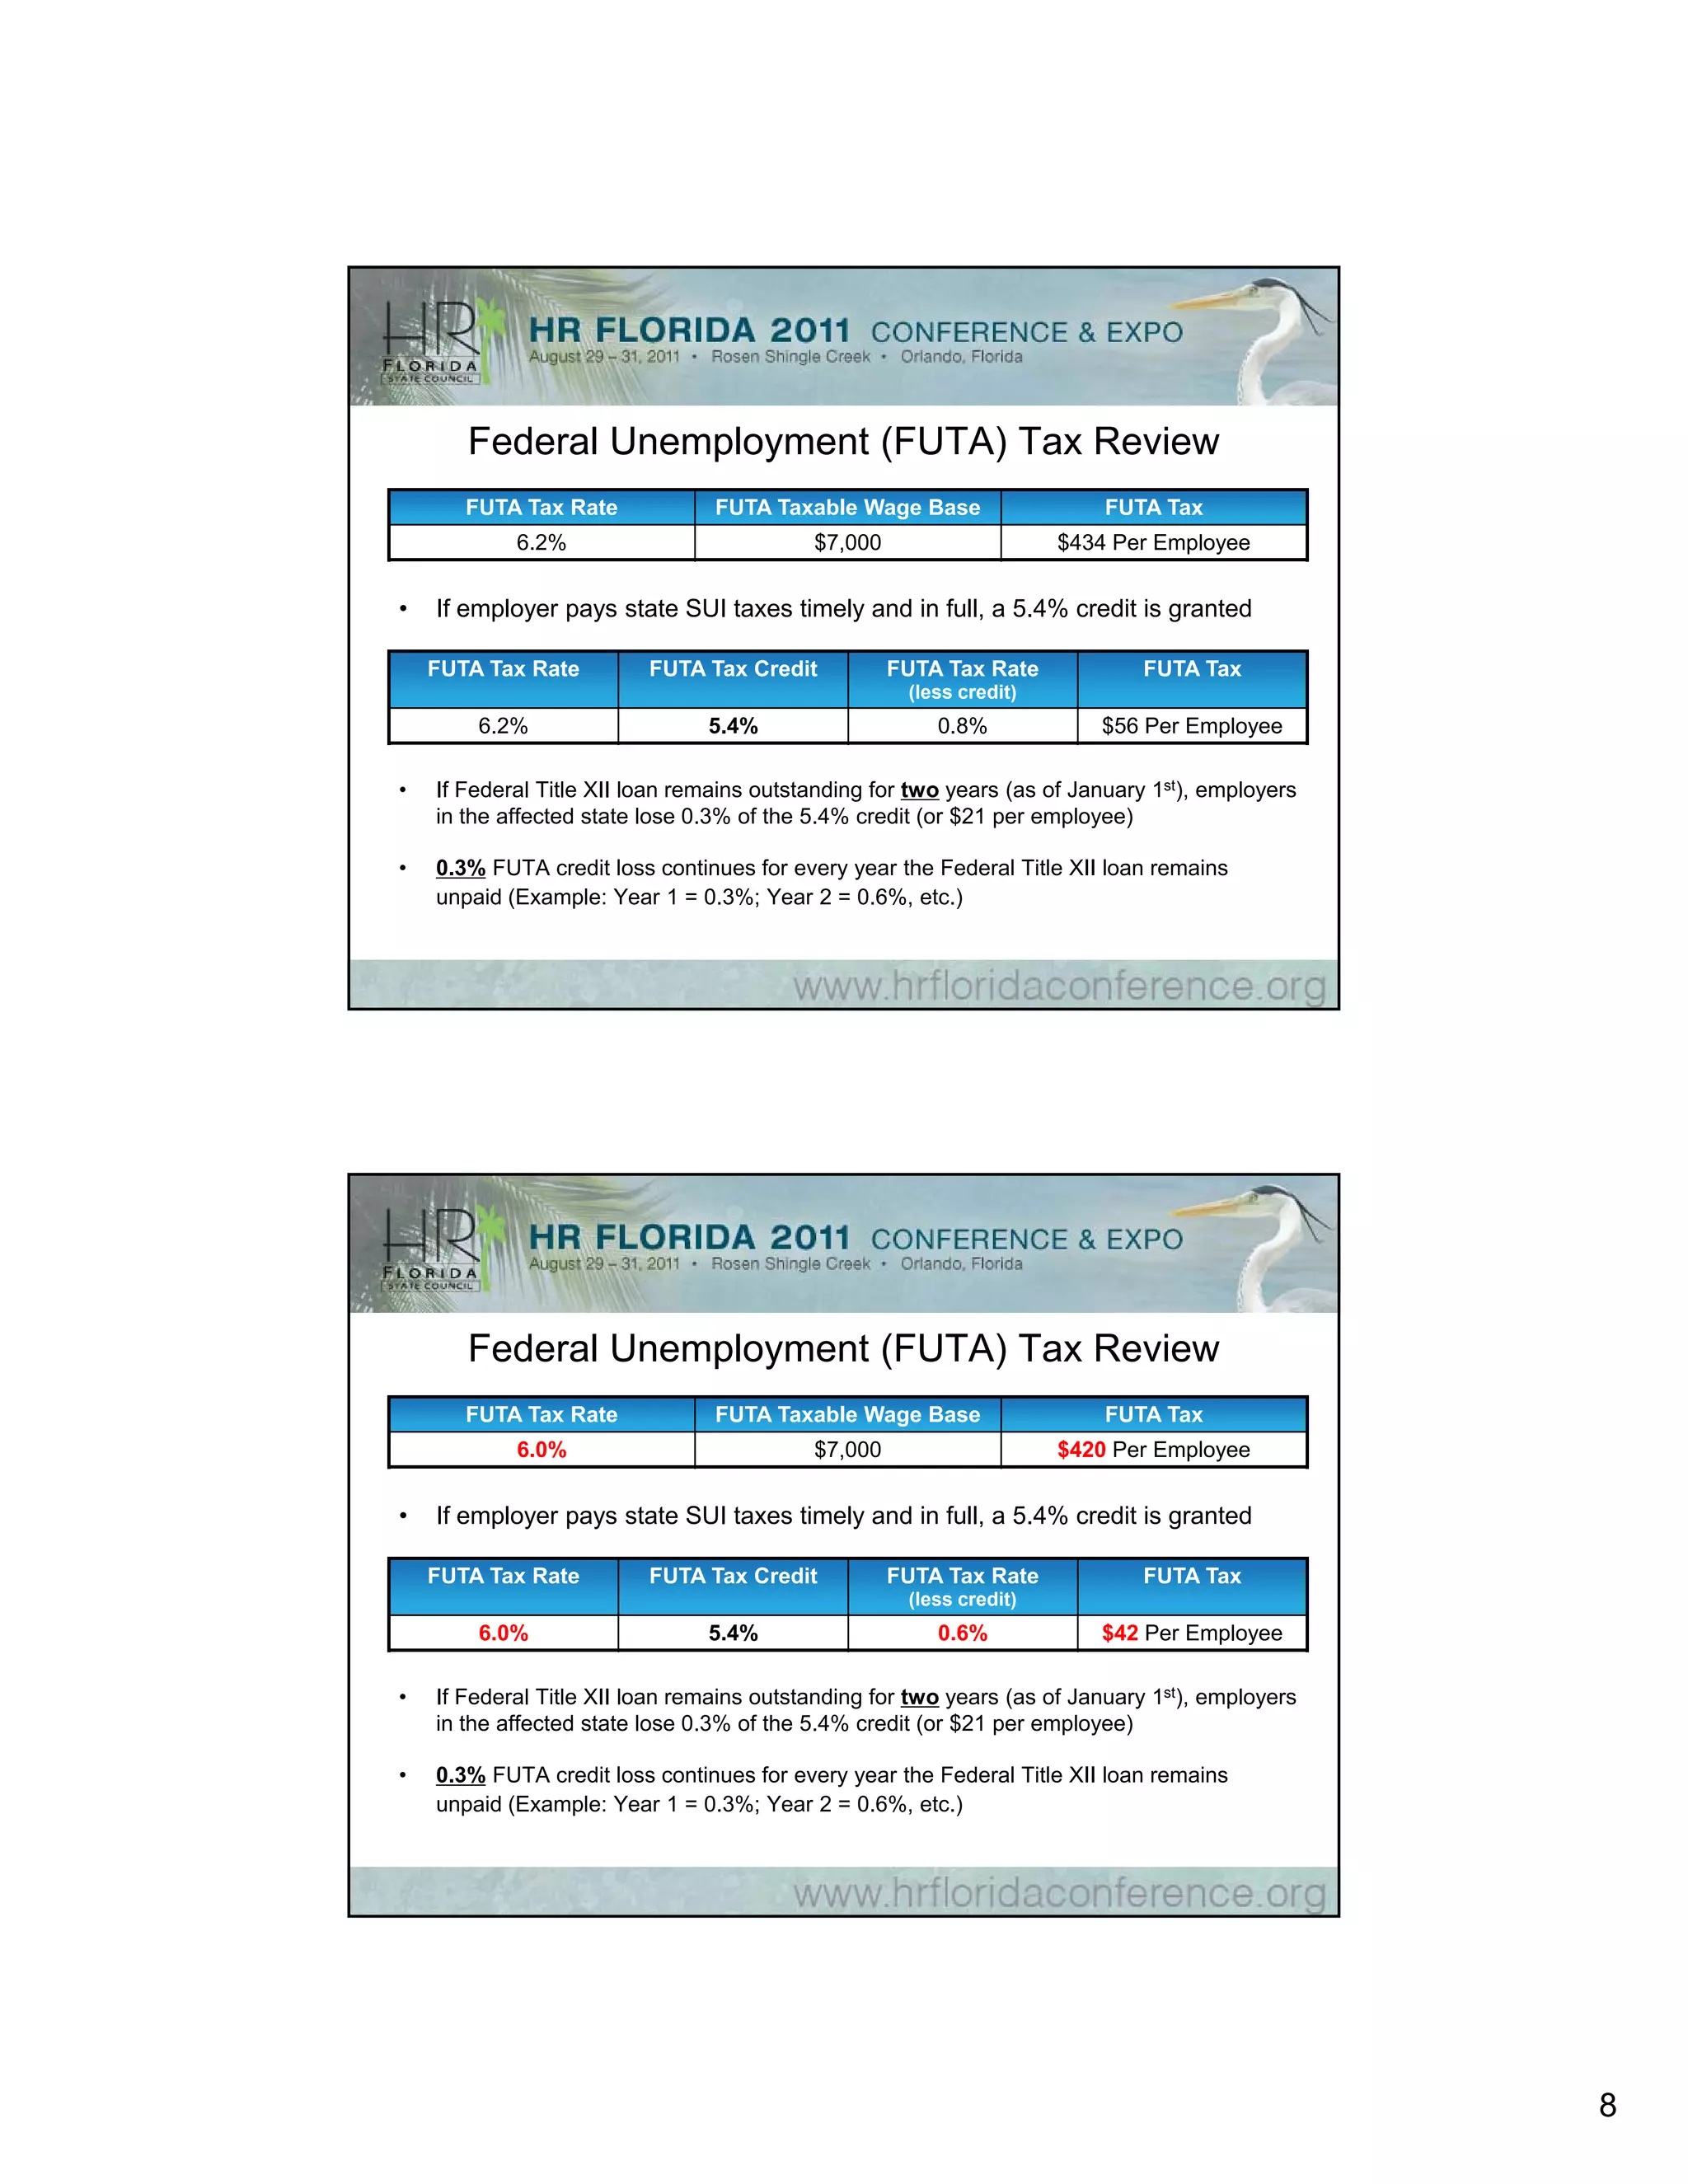
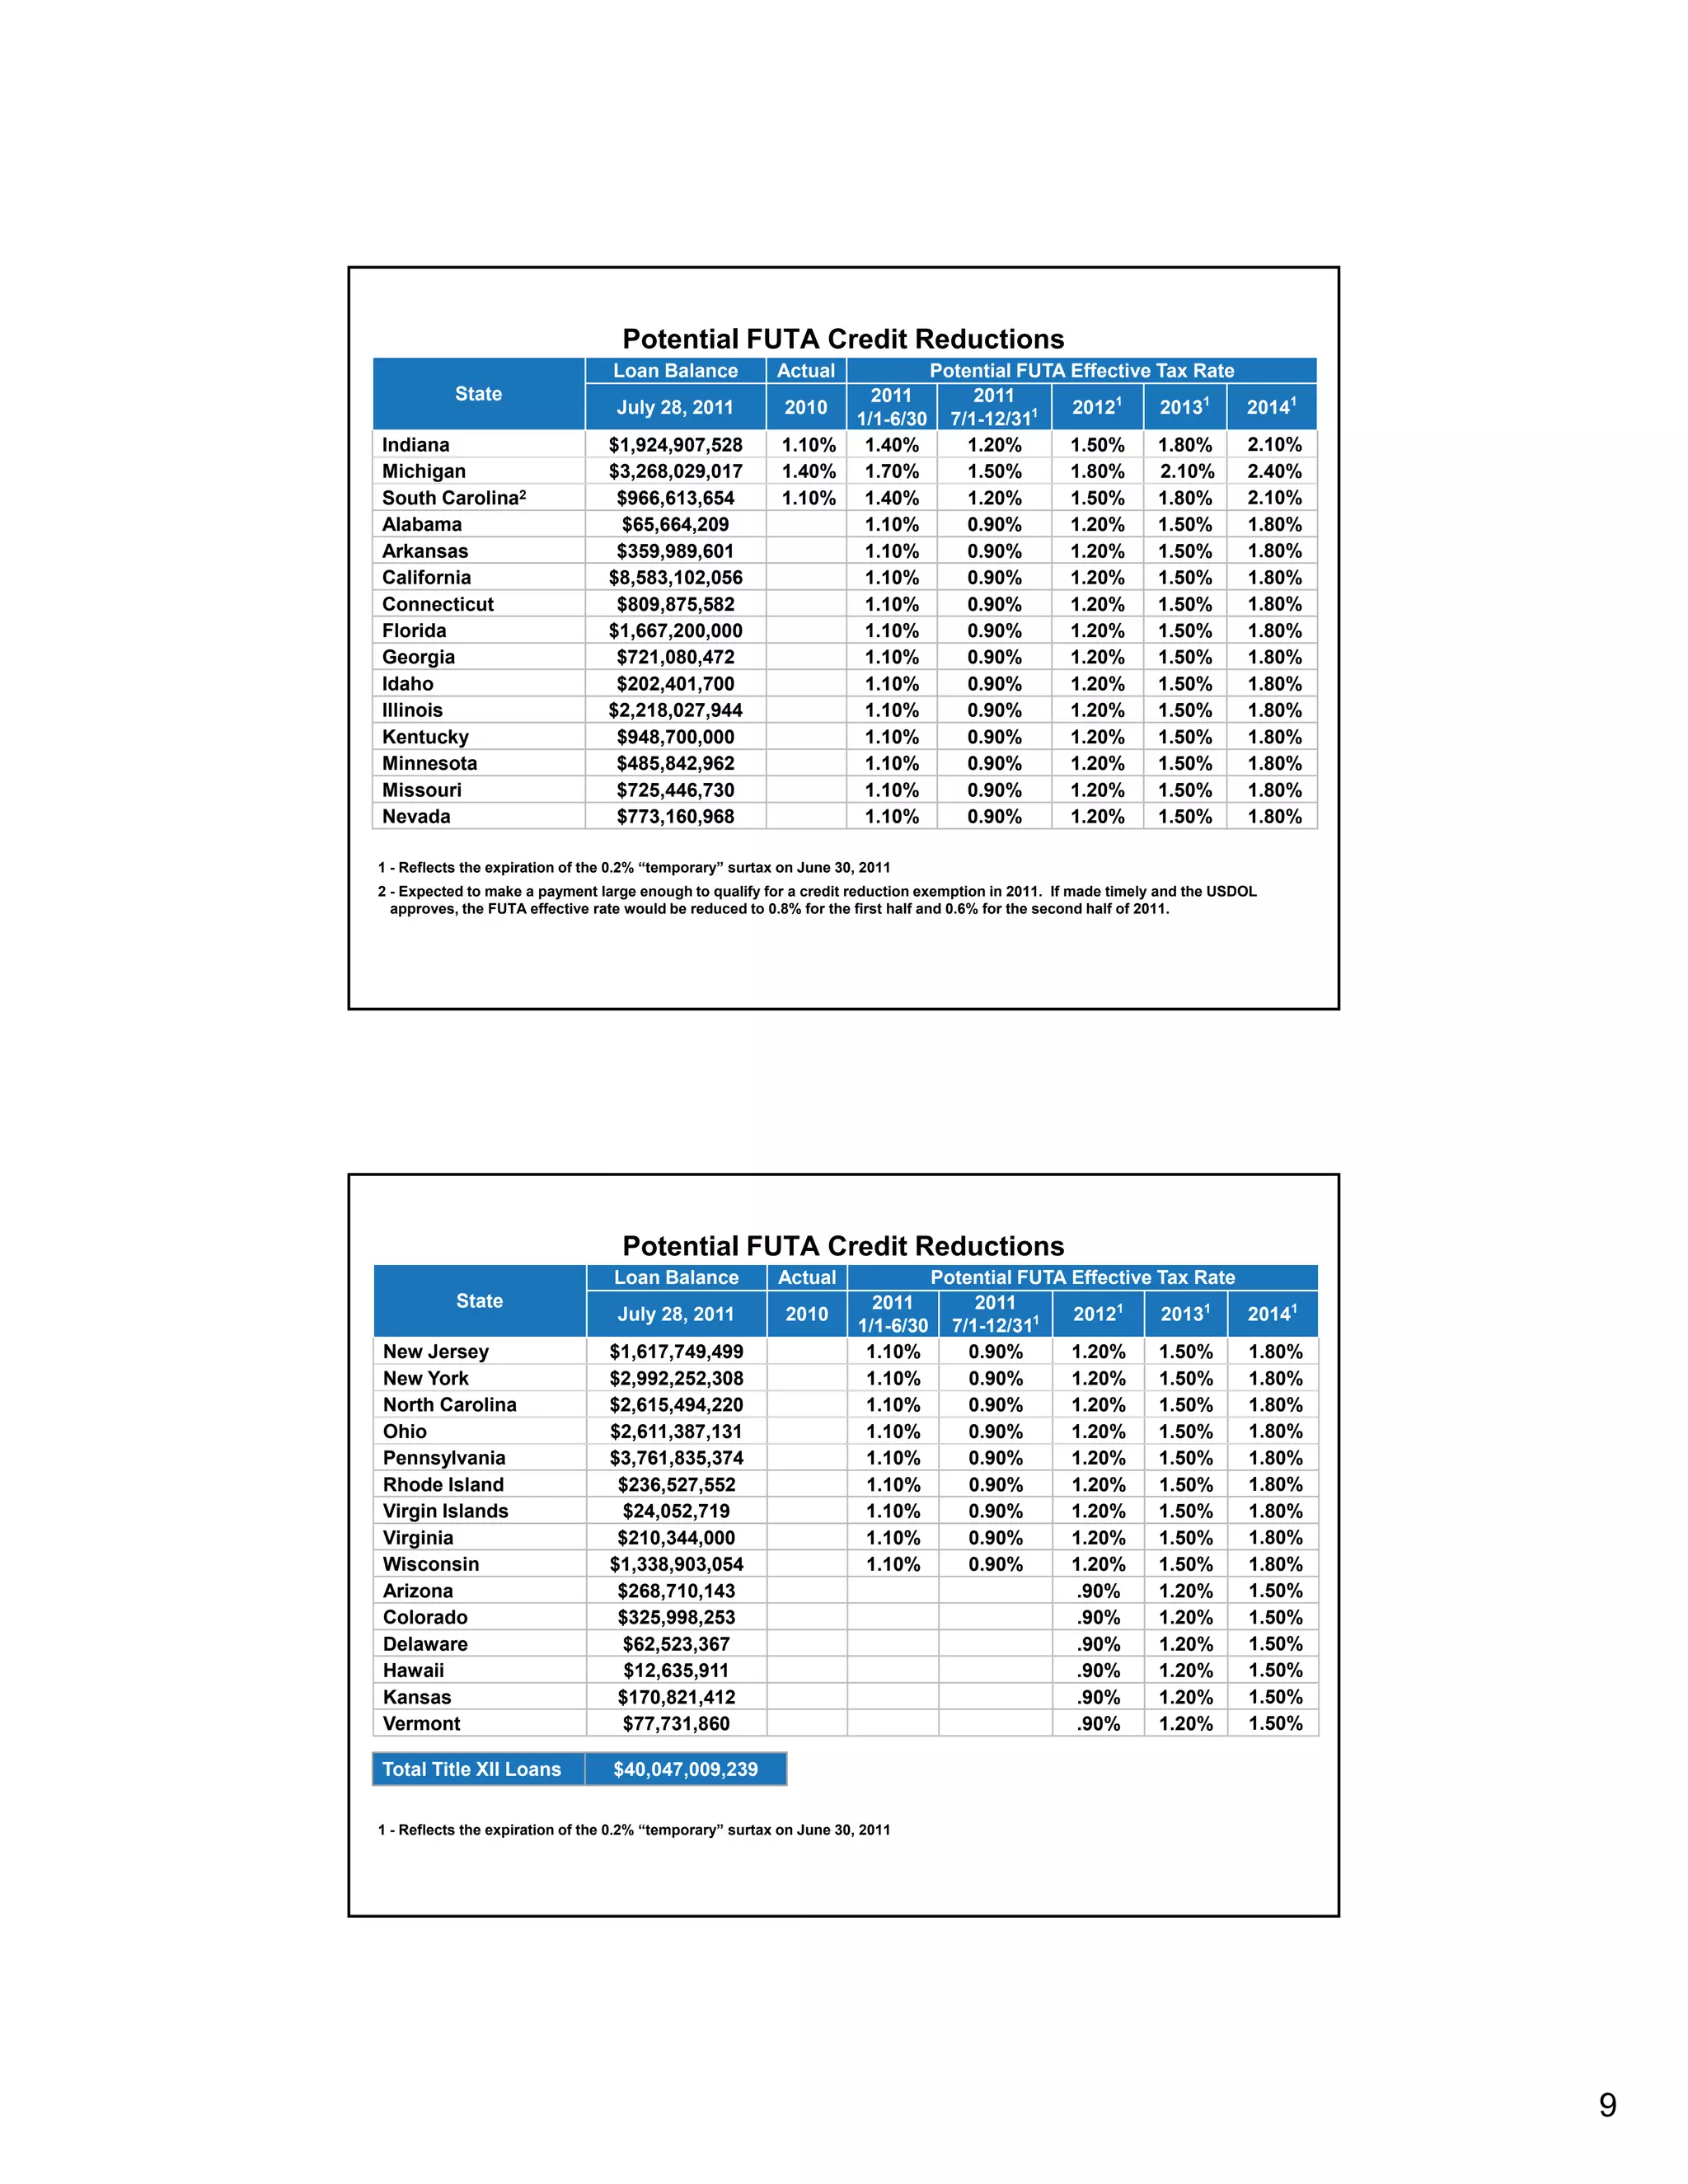
Minimizing Unemployment Costs
   in 2011 and Beyond
   Presented by Michael Mohr and Matthew White
   8/31/2011


                     Agenda
• National Unemployment Economic Update
• U.S. Unemployment System Solvency
• Federal Unemployment Tax Act (FUTA) Review
• President Obama’s Budget Proposal
• U
  Unemployment C t M
       l     t Cost Management
                             t
• Summary
• Questions and Answers


                                                 1
National Unemployment
                      Economic Update


              $ ,
              $5,554                                                       9.28%
                                                                        National annual benefit charge
   Average cost of an unemployment claim                                      overpayment rate


$40,047,009,239                                                                         30
                                                                              Insolvent state trust funds
                      Title XII loans outstanding
                                                                       $1,224,147,872
          9.2%
          9 2%                                     18.6
                                                   18 6                Title XII loans projected interest


        National
                                                 Average weeks a
                                                  person draws
                                                  unemployment
                                                                                   24
    unemployment rate                                                      States facing FUTA tax
             June 2011                                                       increases in 2011
Source: U.S. Department of Labor and TALX Corporation, as of 7/28/11


                                                                                                            2
National Unemployment Trend
    11.00%                                                                                               9.8% 9 6%                         10.0%
                                     9.7%
                                     9 7%                          9.5%
                                                                   9 5%                                       9.6%
                                                                           9.5%                                                                     9.4%
    10.00%                                                                        9.2%
                              8.5%           8.8%
      9.00%
                                                                                                                                     7.2%
      8.00%

      7.00%                                                                                     6.1%
                                                           5.5%
      6.00%            5.1%

      5.00%

      4.00%

      3.00%

      2.00%

      1.00%

      0.00%
                              March                                June                             September                            December

                                                                   2008           2009           2010           2011
   Source: U.S. Department of Labor


                              Four-week moving average of initial claims
    700,000
    650,000
    600,000
    550,000
    500,000
    450,000
    400,000
    350,000
    300,000
    250,000
    200,000
    150,000
       ,
    100,000
     50,000
             0


- - The four week moving average needs to drop below 450,000 and start moving towards 400,000 (or less) for the U.S. to start experiencing employment recovery
As of 7/23/11
Source: Based on data supplied by U.S. Department of Labor


                                                                                                                                                                 3
U.S. Unemployment
                                      System Solvency


                               Total Unemployment Rate
                               First Quarter 2011


                                                                   0.0% - 3.9% TUR (0 Jurisdictions)

                                                                   4.0% 5.9%
                                                                   4 0% - 5 9% TUR (4 Jurisdictions)

                                                                   6.0% - 7.0% TUR (6 Jurisdictions)

                                                                   7.1% - 9.9% TUR (28 Jurisdictions)

                                                                   10% > TUR (14 Jurisdictions)

                                                                   The Total Unemployment Rate (TUR)
              Source:                                              is the rate computed by dividing Total
              U.S. Department of Labor                             Unemployed by the Civilian Labor
              First Quarter 2011                                   Force (Bureau of Labor Statistics)


* Jurisdictions include 50 U.S. States, DC (Orange) and PR (Red)


                                                                                                            4
TALX Assessment – Revenue per $1 of Benefits Paid
$1.30
          $1.19    $1.20 $1.19 $1.19
$1.20
                                            $1.17
                                                    $1.10
                                                    $
$1.10                                                        $1.07
                                                                      $1.03
                                                                              $0.98
$1.00
                                                                                         $0.91
$0.90                                                                                            $0.84
$0.80                                                                                                    $0.74                                                                    $0.76
                                                                                                                                                                         $0.68
$0.70
                                                                                                                 $0.60                                          $0.61
$0.60
                                                                                                                                                        $0.52
$0.50
                                                                                                                         $0.47
                                                                                                                                 $0.41 $0.39 $0.41
$0.40
$0 40

$0.30

$0.20

$0.10

  $-
         Q106 Q206 Q306 Q406 Q107 Q207 Q307 Q407 Q108 Q208 Q308 Q408 Q109 Q209 Q309 Q409 Q110 Q210 Q310 Q410 Q111
Source: Compiled from U.S. Department of Labor UI Data Summary


                                      Unemployment Trust Fund Solvency
                                      TALX Assessment as of July 28, 2011


                                                                                                                                       Solvent Trust Funds (23 Jurisdictions)

                                                                                                                                       Insolvent Trust Funds (30 Jurisdictions)

                                                                                                                                       At Risk Trust Funds (0 Jurisdictions)


* Jurisdictions include 50 U.S. States, DC (Solvent), PR (Solvent), and VI (Insolvent)


                                                                                                                                                                                          5
U.S. Average
                           Unemployment Taxable Wage Base      Title
                U.S. Average Unemployment Taxable Wage Base
  $18,000
                                                                                                                                      $15,718
                                                                                                                                      $15 718
  $16,000                                                                                                     $15,227
                                                                                         $14,481
                     $13,568                $13,836               $13,862
  $14,000

  $12,000

  $10,000

     $8,000

     $6,000

     $4,000

     $2,000

        $-
                      2006                  2007                  2008                   2009                 2010                    2011
      2011 - 18 states increased taxable wage base


                           National Average
                                Title
                        Unemployment Tax Rate
                       National Average Unemployment Tax Rate
  4.00%
                                                                                                                                             3.47%
  3 50%
  3.50%
                                                                                                                             3.02%
                                                      2.86%                                                                          2.82%
  3.00%                               2.68% 2.74%
                                                                      2.77%
                              2.56%                           2.62%                   2.56%
                                                                              2.40%                         2.37%
  2.50%                                                                                       2.26% 2.26%            2.28%
                  2.16% 2.17%

  2.00%

  1.50%

  1.00%

  0.50%

  0.00%
                  2003           2004           2005           2006            2007            2008         2009             2010            2011
                                             TALX Projection                  USDOL Actual
U.S. Department Of Labor 2010 average unemployment tax rate will not be finalized until 2011. All rates are expressed as a percentage of taxable payroll.


                                                                                                                                                            6
TALX Unemployment Insurance (UI) Trust Fund Review
  $60,000,000                                                                                                                                                                                                                                                                     4.0%


                                                                                                                                                                                                                                                               3.47%
                                                                                                                                                                                                                                                               3 47%              3.5%
  $50,000,000

                                                                                                                                                                                                                                                                                  3.0%
                                                                                                                                             2.86%                                                                                          2.82%
                                                                                                                          2.68%                                 2.77%
  $40,000,000
                                                                                                                                                                                   2.56%                                                                                          2.5%
                                                                                                                                                                                                      2.26% 2.28%
                                                                                                       2.17%
  $30,000,000                                                                                                                                                                                                                                                                     2.0%
                                                                           1.80%

                                                                                                                                                                                                                                                                                  1.5%
  $20,000,000

                                                                                                                                                                                                                                                                                  1.0%

  $10,000,000
                                                                                                                                                                                                                                                                                  0.5%


               $0                                                                                                                                                                                                                                                                 0.0%
                     1998.4

                              1999.2

                                       1999.4

                                                2000.2

                                                         2000.4

                                                                  2001.2

                                                                            2001.4

                                                                                     2002.2

                                                                                              2002.4

                                                                                                        2003.2

                                                                                                                 2003.4

                                                                                                                           2004.2

                                                                                                                                    2004.4

                                                                                                                                              2005.2

                                                                                                                                                       2005.4

                                                                                                                                                                 2006.2

                                                                                                                                                                          2006.4

                                                                                                                                                                                    2007.2

                                                                                                                                                                                             2007.4

                                                                                                                                                                                                        2008.2

                                                                                                                                                                                                                 2008.4

                                                                                                                                                                                                                          2009.2

                                                                                                                                                                                                                                   2009.4

                                                                                                                                                                                                                                             2010.2

                                                                                                                                                                                                                                                      2010.4

                                                                                                                                                                                                                                                                2011.2

                                                                                                                                                                                                                                                                         2011.4
All Values in $000


                                                                               Revenue                           TF Balance                                UI Benefits                                Avg. UI Rate
    Footnotes:
     2011 Average Unemployment Tax Rate is a TALX estimate                                                                                                                                              Source: U.S. Department of Labor


              Federal Unemployment Tax Act (FUTA)
                            Review


                                                                                                                                                                                                                                                                                         7
Federal Unemployment (FUTA) Tax Review
       FUTA Tax Rate             FUTA Taxable Wage Base                  FUTA Tax
            6.2%                           $7,000                    $434 Per Employee


•   If employer pays state SUI taxes timely and in full, a 5.4% credit is granted

    FUTA Tax Rate         FUTA Tax Credit           FUTA Tax Rate            FUTA Tax
                                                     (less credit)
        6.2%                    5.4%                    0.8%             $56 Per Employee

•   If Federal Title XII loan remains outstanding for two years (as of January 1st), employers
    in the affected state lose 0.3% of the 5.4% credit (or $21 per employee)

•   0.3% FUTA credit loss continues for every year the Federal Title XII loan remains
    unpaid (Example: Year 1 = 0.3%; Year 2 = 0.6%, etc.)


       Federal Unemployment (FUTA) Tax Review
       FUTA Tax Rate             FUTA Taxable Wage Base                  FUTA Tax
            6.0%                           $7,000                    $420 Per Employee


•   If employer pays state SUI taxes timely and in full, a 5.4% credit is granted

    FUTA Tax Rate         FUTA Tax Credit           FUTA Tax Rate            FUTA Tax
                                                     (less credit)
        6.0%                    5.4%                    0.6%             $42 Per Employee

•   If Federal Title XII loan remains outstanding for two years (as of January 1st), employers
    in the affected state lose 0.3% of the 5.4% credit (or $21 per employee)

•   0.3% FUTA credit loss continues for every year the Federal Title XII loan remains
    unpaid (Example: Year 1 = 0.3%; Year 2 = 0.6%, etc.)


                                                                                                 8
Potential FUTA Credit Reductions
                                  Loan Balance            Actual                 Potential FUTA Effective Tax Rate
           State                                                       2011           2011
                                  July 28, 2011            2010                                 20121     20131            20141
                                                                     1/1-6/30      7/1-12/311
Indiana                          $1,924,907,528            1.10%      1.40%          1.20%      1.50%     1.80%            2.10%
Michigan                         $3,268,029,017            1.40%      1.70%          1.50%      1.80%     2.10%            2.40%
South Carolina2                   $966,613,654             1.10%      1.40%          1.20%      1.50%     1.80%            2.10%
Alabama                           $65,664,209                         1.10%          0.90%      1.20%     1.50%            1.80%
Arkansas                          $359,989,601                        1.10%          0.90%      1.20%     1.50%            1.80%
California                       $8,583,102,056                       1.10%          0.90%      1.20%     1.50%            1.80%
Connecticut                       $809,875,582                        1.10%          0.90%      1.20%     1.50%            1.80%
Florida                          $1,667,200,000                       1.10%          0.90%      1.20%     1.50%            1.80%
Georgia                           $721,080,472                        1.10%          0.90%      1.20%     1.50%            1.80%
Idaho                             $202,401,700                        1.10%          0.90%      1.20%     1.50%            1.80%
Illinois                         $2,218,027,944                       1.10%          0.90%      1.20%     1.50%            1.80%
Kentucky                          $948,700,000                        1.10%          0.90%      1.20%     1.50%            1.80%
Minnesota                         $485,842,962
                                  $485 842 962                        1.10%
                                                                      1 10%          0.90%
                                                                                     0 90%      1.20%
                                                                                                1 20%     1.50%
                                                                                                          1 50%            1.80%
                                                                                                                           1 80%
Missouri                          $725,446,730                        1.10%          0.90%      1.20%     1.50%            1.80%
Nevada                            $773,160,968                        1.10%          0.90%      1.20%     1.50%            1.80%

1 - Reflects the expiration of the 0.2% “temporary” surtax on June 30, 2011
2 - Expected to make a payment large enough to qualify for a credit reduction exemption in 2011. If made timely and the USDOL
  approves, the FUTA effective rate would be reduced to 0.8% for the first half and 0.6% for the second half of 2011.


                                   Potential FUTA Credit Reductions
                                  Loan Balance            Actual                 Potential FUTA Effective Tax Rate
           State                                                        2011          2011
                                   July 28, 2011           2010                                 20121     20131            20141
                                                                      1/1-6/30     7/1-12/311
New Jersey                       $1,617,749,499                        1.10%         0.90%      1.20%     1.50%            1.80%
New York                         $2,992,252,308                        1.10%         0.90%      1.20%     1.50%            1.80%
North Carolina                   $2,615,494,220                        1.10%         0.90%      1.20%     1.50%            1.80%
Ohio                             $2,611,387,131                        1.10%         0.90%      1.20%     1.50%            1.80%
Pennsylvania                     $3,761,835,374                        1.10%         0.90%      1.20%     1.50%            1.80%
Rhode Island                      $236,527,552                         1.10%         0.90%      1.20%     1.50%            1.80%
Virgin Islands                    $24,052,719                          1.10%         0.90%      1.20%     1.50%            1.80%
Virginia                          $210,344,000                         1.10%         0.90%      1.20%     1.50%            1.80%
Wisconsin                        $1,338,903,054                        1.10%         0.90%      1.20%     1.50%            1.80%
Arizona                           $268,710,143                                                  .90%      1.20%            1.50%
Colorado                          $325,998,253                                                   .90%     1.20%            1.50%
Delaware                          $62,523,367                                                    .90%     1.20%            1.50%
Hawaii                             $12,635,911
                                   $12 635 911                                                  .90%
                                                                                                  90%     1.20%
                                                                                                          1 20%            1.50%
                                                                                                                           1 50%
Kansas                            $170,821,412                                                   .90%     1.20%            1.50%
Vermont                           $77,731,860                                                   .90%      1.20%            1.50%

Total Title XII Loans             $40,047,009,239


1 - Reflects the expiration of the 0.2% “temporary” surtax on June 30, 2011


                                                                                                                                   9
Federal Title XII Interest Provisions


                                                                                           Special Assessment (8 Jurisdictions)

                                                                                           Surcharge, part of the rate (11 jurisdictions)

                                                                                           No additional tax to employers (9 jurisdictions)

                                                                                           No Provisions (5 jurisdictions)

                                                                                           Solvent Trust Fund (20 jurisdiction)


•Jurisdictions include 50 U.S. States, DC (Solvent), PR (Solvent), and VI (No Provision)


                                              President Obama’s
                                               Budget Proposal


                                                                                                                                              10
Title
                        Long-standing State Financing Policies
                          have increased Risk of Insolvency

           Long-standing State Financing Policies have
                  increased Risk of Insolvency


Source: U.S. Government Accountability Office (GAO), April 2010


                       Federal 2012-2013 Budget Proposal
  •     Title XII loan interest waiver for 2011 and 2012
          – 2011 estimated tax relief $1.22 billion (interest rate 4.0869%)
                                                    (                     )
          – 2012 estimated tax relief $1.79 billion
          – ARRA waived interest charges for 2009 and 2010
  •     FUTA Credit Reduction Suspension for 2011 and 2012
          – 2012 estimated tax relief $2.14 billion
          – 2013 estimated tax relief $4.54 billion
  •     FUTA wage base increase to $15,000 (from $7,000) in 2014
          – 34 states would be required to raise SUI wage bases
          – FUTA wage base also permanently indexed on yearly basis
          – In 2014, the FUTA rate would decrease to 0.38%
  •     Extension of 0.2% FUTA surtax for 2011, 2012, and 2013
Source: UWC – Strategic Services on Unemployment and Worker’s Compensation


                                                                              11
Federal Unemployment (FUTA) Taxable Wage Base
  $ 6,000
  $16,000                                                                                      $15,000

  $14,000

  $12,000

  $10,000

   $8,000                                                                       $7,000
                                                            $6,000
   $6,000
                                        $4,200
   $4,000           $3,000

   $2,000

      $-
                    1940                1972               1978                1983            2014*
  * Proposed change in FUTA wage base based on President Obama’s 2012-2013 budget proposal


                                     State          2011 Wage Bases              State       2011 Wage Bases
                                       AL                $8,000                    MI            $9,000
                                      AR                 $12,000                  MO             $13,000
What if
                                       AZ                $7,000                   MS             $14,000
State Unemployment Taxable
Wage Bases = $15,000?                 CA                 $7,000                   NE             $9,000
                                      CO                 $10,000                  NH             $12,000
                                      DC                 $9,000                   NY             $8,500
                                      DE                 $10,500                  OH             $9,000
                                       FL                $7,000                   PA             $8,000
                                      GA                 $8,500                   PR             $7,000
                                       IL                $12,740                  SC             $10,000
                                       IN                $9,500
                                                         $9 500                   SD             $11,000
                                                                                                 $11 000
                                      KS                 $8,000                   TN             $9,000
                                      KY                 $8,000                   TX             $9,000
                                       LA                $7,700                   VA             $8,000
                                      MA                 $14,000                  VT             $13,000
                                      MD                 $8,500                    WI            $13,000
                                      ME                 $12,000                  WV             $12,000


                                                                                                               12
JOBS Act of 2011
                                         Title
                                       HR 1745
                                        JOBS Act of 2011 - HR 1745
 Sponsored by Rep. Camp, R-MI
        Chair of House Ways & Means Subcommittee on Social Security

 States can elect to continue payment of Emergency Unemployment
  Compensation & Extended Benefits after 7/1/11 or spend funds on:
        Title XII loan balances
        Title XII interest payments
        FUTA credit reduction
        Jobs training programs

       Cost of EUC & EB already budgeted, no expansion of federal deficit

 Allows 0.2% “temporary” FUTA tax to expire 6/30/2011


                           TALX 2011
                             Title
                    Unemployment Tax Review
                              TALX 2011 Unemployment Tax Review


Source: NASWA State Unemployment Insurance Tax Survey, April 2011


                                                                            13
Expected Change in UI Tax Revenue
                           From 2010 to 2011            Title
            Expected Change in UI Tax Revenue - From 2010 to 2011
 140.0%                                                                                     135.0%

 130.0%
 130 0%

 120.0%

 110.0%
                                                                            98.0%
 100.0%

  90.0%

  80.0%

  70.0%

  60.0%    54.0%                            50.0%
  50.0%
                                 40.0%
                                 40 0%
  40.0%
                      29.0%                                                                                  32.0%
  30.0%
                                                                                    20.0%            22.0%
  20.0%
                                                                    10.0%
  10.0%                                                                                                              4.7%
                                                      2.0%
   0.0%
           CO          IL        IN         NV         NY           OH      OK      PA       SC      TX      VA      WA
Source: NASWA State Unemployment Insurance Tax Survey, April 2011


                            Unemployment Cost
                               Management


                                                                                                                            14
Unemployment Tax and Benefit Review


Unemployment Tax Cost – State Example

Florida 2011 Merit Rating


                              5.4% (2010: 5.4%)
    $7,000
    $378
                              Employer Rate


     $
     $72
                                       R


    $7,150


                            1.03% (2010: .36%)


                                                  15
Unemployment Cost Management


    Effective Unemployment Cost Management
    • Establish an organized process for initial claim responses
    • Evaluate each individual determination
    • Ensure timely appeals and proper hearing preparation
    • Audit benefit charge statements by individual claim and protest overpayments


                    Unemployment Claim Eligibility and Liability


    2Q           3Q           4Q            1Q            2Q           3Q
    2010         2010         2010          2011          2011         2011


Last Employer Claim – The claim notice sent to the most recent employer from which the employee has separated.
Base Period Claim – The claim notice sent to each employer for which the claimant worked during the base period. Base Period
earnings determine weekly benefit amounts and employers chargeable proportionate to wages paid.


                                                                                                                               16
Unemployment Claim Process

Separation                           Claim                       Response


     Ideal place to end process!
     •   Complete claim responses save time and money
     •   Reduce follow-up requests
     •   Claim Adjudicator can make fully informed decision
     •   Avoid unnecessary appeals
     •   Improve win % substantially


                         Types of Separations


     Voluntary Quit
     •   “I quit”
     •   No show/No Call for                 Lack of Work
         three or more days
                                             •   Completed Assignments
                                             •   Plant closing
                                             •   Position li i t d
                                                 P iti eliminated
             Discharge
             •      Misconduct
             •      Attendance
             •      Violation of Policy


                                                                            17
Voluntary Quit
The burden of proof is the responsibility of the former employee to
              p               p         y                 p y
show there was good cause to quit attributable to the employer.
                             Good Cause 
                                  A change in the condition of 
                                  employment or compelling reasons. 
                                  Continued employment must be 
                                  available.
                                  available
                                  Forced resignation = DISCHARGE


                              ALWAYS ask for a signed letter of resignation


                            Discharge
The burden of proof is the responsibility of the employer to prove that
the employee was discharged for misconduct.


                               Misconduct 
                                    A deliberate and willful disregard of 
                                    employer’s interest or repeated 
                                    violations of a known company policy


                                                                              18
Lack of Work
                                                                           • Not Disqualifying
                                                                                      – Intent of Unemployment

                                                                           • Job Eliminated
                                                                                      – No positions available

                                                                           • Reduced hours
                                                                                      – Full‐time to Part‐time

                                                                           • Job Offers and Refusals


             National Annual Benefit Charge Overpayment Rate
 12.00%


                                                                                   9.92%                      9.99%                 10.06%
 10.00%          9.20%                                                9.31%                    9.52%                                            9.28%
                                                          9.10%                                                          9.13%
                              8.54%
                                            8.19%

   8.00%


   6.00%


   4.00%


   2.00%
             0.87%       0.85%        0.86%
                                                    0.66%         0.63%       0.67%        0.66%        0.67%         0.65%      0.62%       0.63%

   0.00%
               1999         2000         2001          2002         2003       2004         2005            2006       2007       2008         2009

                                         % of Underpayments                                     % of Overpayments

             2009 Estimated Underpayments - $484.9 Million                                 2009 Estimated Overpayments - $7.124 Billion
             2008 Estimated Underpayments - $259.3 Million                                 2008 Estimated Overpayments - $4.192 Billion
Source: U.S. Department of Labor – Benefit Accuracy Measurement Report: 2009 (most recent data available)


                                                                                                                                                        19
Merger-Acquisition-Reorganization Planning


      Unemployment Cost Management


                                             20
Summary
• National Unemployment Tax Rate - Key metric for employers
               p y                   y              p y

• Total Unemployment Rate (TUR) - Impacts state trust funds

• Trust Fund Solvency - Impacts Title XII loan activity

• Title XII Loans - Impacts employer FUTA taxes

• Economic Conditions - Impacts employer unemployment costs

• Budget and Forecasting - Planning initiatives 2011 and 2012


         Questions and Answers
 For more information please contact:
                      p

 Michael Mohr
 Vice President
 TALX Corporation
 (314) 684-2299
 Cell: (314) 369-4143
 mmohr@talx.com
         @


                                                                21

Mohr and White - Minimizing unemployment costs

  • 1.
    Minimizing Unemployment Costs in 2011 and Beyond Presented by Michael Mohr and Matthew White 8/31/2011 Agenda • National Unemployment Economic Update • U.S. Unemployment System Solvency • Federal Unemployment Tax Act (FUTA) Review • President Obama’s Budget Proposal • U Unemployment C t M l t Cost Management t • Summary • Questions and Answers 1
  • 2.
    National Unemployment Economic Update $ , $5,554 9.28% National annual benefit charge Average cost of an unemployment claim overpayment rate $40,047,009,239 30 Insolvent state trust funds Title XII loans outstanding $1,224,147,872 9.2% 9 2% 18.6 18 6 Title XII loans projected interest National Average weeks a person draws unemployment 24 unemployment rate States facing FUTA tax June 2011 increases in 2011 Source: U.S. Department of Labor and TALX Corporation, as of 7/28/11 2
  • 3.
    National Unemployment Trend 11.00% 9.8% 9 6% 10.0% 9.7% 9 7% 9.5% 9 5% 9.6% 9.5% 9.4% 10.00% 9.2% 8.5% 8.8% 9.00% 7.2% 8.00% 7.00% 6.1% 5.5% 6.00% 5.1% 5.00% 4.00% 3.00% 2.00% 1.00% 0.00% March June September December 2008 2009 2010 2011 Source: U.S. Department of Labor Four-week moving average of initial claims 700,000 650,000 600,000 550,000 500,000 450,000 400,000 350,000 300,000 250,000 200,000 150,000 , 100,000 50,000 0 - - The four week moving average needs to drop below 450,000 and start moving towards 400,000 (or less) for the U.S. to start experiencing employment recovery As of 7/23/11 Source: Based on data supplied by U.S. Department of Labor 3
  • 4.
    U.S. Unemployment System Solvency Total Unemployment Rate First Quarter 2011 0.0% - 3.9% TUR (0 Jurisdictions) 4.0% 5.9% 4 0% - 5 9% TUR (4 Jurisdictions) 6.0% - 7.0% TUR (6 Jurisdictions) 7.1% - 9.9% TUR (28 Jurisdictions) 10% > TUR (14 Jurisdictions) The Total Unemployment Rate (TUR) Source: is the rate computed by dividing Total U.S. Department of Labor Unemployed by the Civilian Labor First Quarter 2011 Force (Bureau of Labor Statistics) * Jurisdictions include 50 U.S. States, DC (Orange) and PR (Red) 4
  • 5.
    TALX Assessment –Revenue per $1 of Benefits Paid $1.30 $1.19 $1.20 $1.19 $1.19 $1.20 $1.17 $1.10 $ $1.10 $1.07 $1.03 $0.98 $1.00 $0.91 $0.90 $0.84 $0.80 $0.74 $0.76 $0.68 $0.70 $0.60 $0.61 $0.60 $0.52 $0.50 $0.47 $0.41 $0.39 $0.41 $0.40 $0 40 $0.30 $0.20 $0.10 $- Q106 Q206 Q306 Q406 Q107 Q207 Q307 Q407 Q108 Q208 Q308 Q408 Q109 Q209 Q309 Q409 Q110 Q210 Q310 Q410 Q111 Source: Compiled from U.S. Department of Labor UI Data Summary Unemployment Trust Fund Solvency TALX Assessment as of July 28, 2011 Solvent Trust Funds (23 Jurisdictions) Insolvent Trust Funds (30 Jurisdictions) At Risk Trust Funds (0 Jurisdictions) * Jurisdictions include 50 U.S. States, DC (Solvent), PR (Solvent), and VI (Insolvent) 5
  • 6.
    U.S. Average Unemployment Taxable Wage Base Title U.S. Average Unemployment Taxable Wage Base $18,000 $15,718 $15 718 $16,000 $15,227 $14,481 $13,568 $13,836 $13,862 $14,000 $12,000 $10,000 $8,000 $6,000 $4,000 $2,000 $- 2006 2007 2008 2009 2010 2011  2011 - 18 states increased taxable wage base National Average Title Unemployment Tax Rate National Average Unemployment Tax Rate 4.00% 3.47% 3 50% 3.50% 3.02% 2.86% 2.82% 3.00% 2.68% 2.74% 2.77% 2.56% 2.62% 2.56% 2.40% 2.37% 2.50% 2.26% 2.26% 2.28% 2.16% 2.17% 2.00% 1.50% 1.00% 0.50% 0.00% 2003 2004 2005 2006 2007 2008 2009 2010 2011 TALX Projection USDOL Actual U.S. Department Of Labor 2010 average unemployment tax rate will not be finalized until 2011. All rates are expressed as a percentage of taxable payroll. 6
  • 7.
    TALX Unemployment Insurance(UI) Trust Fund Review $60,000,000 4.0% 3.47% 3 47% 3.5% $50,000,000 3.0% 2.86% 2.82% 2.68% 2.77% $40,000,000 2.56% 2.5% 2.26% 2.28% 2.17% $30,000,000 2.0% 1.80% 1.5% $20,000,000 1.0% $10,000,000 0.5% $0 0.0% 1998.4 1999.2 1999.4 2000.2 2000.4 2001.2 2001.4 2002.2 2002.4 2003.2 2003.4 2004.2 2004.4 2005.2 2005.4 2006.2 2006.4 2007.2 2007.4 2008.2 2008.4 2009.2 2009.4 2010.2 2010.4 2011.2 2011.4 All Values in $000 Revenue TF Balance UI Benefits Avg. UI Rate Footnotes:  2011 Average Unemployment Tax Rate is a TALX estimate Source: U.S. Department of Labor Federal Unemployment Tax Act (FUTA) Review 7
  • 8.
    Federal Unemployment (FUTA)Tax Review FUTA Tax Rate FUTA Taxable Wage Base FUTA Tax 6.2% $7,000 $434 Per Employee • If employer pays state SUI taxes timely and in full, a 5.4% credit is granted FUTA Tax Rate FUTA Tax Credit FUTA Tax Rate FUTA Tax (less credit) 6.2% 5.4% 0.8% $56 Per Employee • If Federal Title XII loan remains outstanding for two years (as of January 1st), employers in the affected state lose 0.3% of the 5.4% credit (or $21 per employee) • 0.3% FUTA credit loss continues for every year the Federal Title XII loan remains unpaid (Example: Year 1 = 0.3%; Year 2 = 0.6%, etc.) Federal Unemployment (FUTA) Tax Review FUTA Tax Rate FUTA Taxable Wage Base FUTA Tax 6.0% $7,000 $420 Per Employee • If employer pays state SUI taxes timely and in full, a 5.4% credit is granted FUTA Tax Rate FUTA Tax Credit FUTA Tax Rate FUTA Tax (less credit) 6.0% 5.4% 0.6% $42 Per Employee • If Federal Title XII loan remains outstanding for two years (as of January 1st), employers in the affected state lose 0.3% of the 5.4% credit (or $21 per employee) • 0.3% FUTA credit loss continues for every year the Federal Title XII loan remains unpaid (Example: Year 1 = 0.3%; Year 2 = 0.6%, etc.) 8
  • 9.
    Potential FUTA CreditReductions Loan Balance Actual Potential FUTA Effective Tax Rate State 2011 2011 July 28, 2011 2010 20121 20131 20141 1/1-6/30 7/1-12/311 Indiana $1,924,907,528 1.10% 1.40% 1.20% 1.50% 1.80% 2.10% Michigan $3,268,029,017 1.40% 1.70% 1.50% 1.80% 2.10% 2.40% South Carolina2 $966,613,654 1.10% 1.40% 1.20% 1.50% 1.80% 2.10% Alabama $65,664,209 1.10% 0.90% 1.20% 1.50% 1.80% Arkansas $359,989,601 1.10% 0.90% 1.20% 1.50% 1.80% California $8,583,102,056 1.10% 0.90% 1.20% 1.50% 1.80% Connecticut $809,875,582 1.10% 0.90% 1.20% 1.50% 1.80% Florida $1,667,200,000 1.10% 0.90% 1.20% 1.50% 1.80% Georgia $721,080,472 1.10% 0.90% 1.20% 1.50% 1.80% Idaho $202,401,700 1.10% 0.90% 1.20% 1.50% 1.80% Illinois $2,218,027,944 1.10% 0.90% 1.20% 1.50% 1.80% Kentucky $948,700,000 1.10% 0.90% 1.20% 1.50% 1.80% Minnesota $485,842,962 $485 842 962 1.10% 1 10% 0.90% 0 90% 1.20% 1 20% 1.50% 1 50% 1.80% 1 80% Missouri $725,446,730 1.10% 0.90% 1.20% 1.50% 1.80% Nevada $773,160,968 1.10% 0.90% 1.20% 1.50% 1.80% 1 - Reflects the expiration of the 0.2% “temporary” surtax on June 30, 2011 2 - Expected to make a payment large enough to qualify for a credit reduction exemption in 2011. If made timely and the USDOL approves, the FUTA effective rate would be reduced to 0.8% for the first half and 0.6% for the second half of 2011. Potential FUTA Credit Reductions Loan Balance Actual Potential FUTA Effective Tax Rate State 2011 2011 July 28, 2011 2010 20121 20131 20141 1/1-6/30 7/1-12/311 New Jersey $1,617,749,499 1.10% 0.90% 1.20% 1.50% 1.80% New York $2,992,252,308 1.10% 0.90% 1.20% 1.50% 1.80% North Carolina $2,615,494,220 1.10% 0.90% 1.20% 1.50% 1.80% Ohio $2,611,387,131 1.10% 0.90% 1.20% 1.50% 1.80% Pennsylvania $3,761,835,374 1.10% 0.90% 1.20% 1.50% 1.80% Rhode Island $236,527,552 1.10% 0.90% 1.20% 1.50% 1.80% Virgin Islands $24,052,719 1.10% 0.90% 1.20% 1.50% 1.80% Virginia $210,344,000 1.10% 0.90% 1.20% 1.50% 1.80% Wisconsin $1,338,903,054 1.10% 0.90% 1.20% 1.50% 1.80% Arizona $268,710,143 .90% 1.20% 1.50% Colorado $325,998,253 .90% 1.20% 1.50% Delaware $62,523,367 .90% 1.20% 1.50% Hawaii $12,635,911 $12 635 911 .90% 90% 1.20% 1 20% 1.50% 1 50% Kansas $170,821,412 .90% 1.20% 1.50% Vermont $77,731,860 .90% 1.20% 1.50% Total Title XII Loans $40,047,009,239 1 - Reflects the expiration of the 0.2% “temporary” surtax on June 30, 2011 9
  • 10.
    Federal Title XIIInterest Provisions Special Assessment (8 Jurisdictions) Surcharge, part of the rate (11 jurisdictions) No additional tax to employers (9 jurisdictions) No Provisions (5 jurisdictions) Solvent Trust Fund (20 jurisdiction) •Jurisdictions include 50 U.S. States, DC (Solvent), PR (Solvent), and VI (No Provision) President Obama’s Budget Proposal 10
  • 11.
    Title Long-standing State Financing Policies have increased Risk of Insolvency Long-standing State Financing Policies have increased Risk of Insolvency Source: U.S. Government Accountability Office (GAO), April 2010 Federal 2012-2013 Budget Proposal • Title XII loan interest waiver for 2011 and 2012 – 2011 estimated tax relief $1.22 billion (interest rate 4.0869%) ( ) – 2012 estimated tax relief $1.79 billion – ARRA waived interest charges for 2009 and 2010 • FUTA Credit Reduction Suspension for 2011 and 2012 – 2012 estimated tax relief $2.14 billion – 2013 estimated tax relief $4.54 billion • FUTA wage base increase to $15,000 (from $7,000) in 2014 – 34 states would be required to raise SUI wage bases – FUTA wage base also permanently indexed on yearly basis – In 2014, the FUTA rate would decrease to 0.38% • Extension of 0.2% FUTA surtax for 2011, 2012, and 2013 Source: UWC – Strategic Services on Unemployment and Worker’s Compensation 11
  • 12.
    Federal Unemployment (FUTA)Taxable Wage Base $ 6,000 $16,000 $15,000 $14,000 $12,000 $10,000 $8,000 $7,000 $6,000 $6,000 $4,200 $4,000 $3,000 $2,000 $- 1940 1972 1978 1983 2014* * Proposed change in FUTA wage base based on President Obama’s 2012-2013 budget proposal State 2011 Wage Bases State 2011 Wage Bases AL $8,000 MI $9,000 AR $12,000 MO $13,000 What if AZ $7,000 MS $14,000 State Unemployment Taxable Wage Bases = $15,000? CA $7,000 NE $9,000 CO $10,000 NH $12,000 DC $9,000 NY $8,500 DE $10,500 OH $9,000 FL $7,000 PA $8,000 GA $8,500 PR $7,000 IL $12,740 SC $10,000 IN $9,500 $9 500 SD $11,000 $11 000 KS $8,000 TN $9,000 KY $8,000 TX $9,000 LA $7,700 VA $8,000 MA $14,000 VT $13,000 MD $8,500 WI $13,000 ME $12,000 WV $12,000 12
  • 13.
    JOBS Act of2011 Title HR 1745 JOBS Act of 2011 - HR 1745  Sponsored by Rep. Camp, R-MI  Chair of House Ways & Means Subcommittee on Social Security  States can elect to continue payment of Emergency Unemployment Compensation & Extended Benefits after 7/1/11 or spend funds on:  Title XII loan balances  Title XII interest payments  FUTA credit reduction  Jobs training programs Cost of EUC & EB already budgeted, no expansion of federal deficit  Allows 0.2% “temporary” FUTA tax to expire 6/30/2011 TALX 2011 Title Unemployment Tax Review TALX 2011 Unemployment Tax Review Source: NASWA State Unemployment Insurance Tax Survey, April 2011 13
  • 14.
    Expected Change inUI Tax Revenue From 2010 to 2011 Title Expected Change in UI Tax Revenue - From 2010 to 2011 140.0% 135.0% 130.0% 130 0% 120.0% 110.0% 98.0% 100.0% 90.0% 80.0% 70.0% 60.0% 54.0% 50.0% 50.0% 40.0% 40 0% 40.0% 29.0% 32.0% 30.0% 20.0% 22.0% 20.0% 10.0% 10.0% 4.7% 2.0% 0.0% CO IL IN NV NY OH OK PA SC TX VA WA Source: NASWA State Unemployment Insurance Tax Survey, April 2011 Unemployment Cost Management 14
  • 15.
    Unemployment Tax andBenefit Review Unemployment Tax Cost – State Example Florida 2011 Merit Rating 5.4% (2010: 5.4%) $7,000 $378 Employer Rate $ $72 R $7,150 1.03% (2010: .36%) 15
  • 16.
    Unemployment Cost Management Effective Unemployment Cost Management • Establish an organized process for initial claim responses • Evaluate each individual determination • Ensure timely appeals and proper hearing preparation • Audit benefit charge statements by individual claim and protest overpayments Unemployment Claim Eligibility and Liability 2Q 3Q 4Q 1Q 2Q 3Q 2010 2010 2010 2011 2011 2011 Last Employer Claim – The claim notice sent to the most recent employer from which the employee has separated. Base Period Claim – The claim notice sent to each employer for which the claimant worked during the base period. Base Period earnings determine weekly benefit amounts and employers chargeable proportionate to wages paid. 16
  • 17.
    Unemployment Claim Process Separation Claim Response Ideal place to end process! • Complete claim responses save time and money • Reduce follow-up requests • Claim Adjudicator can make fully informed decision • Avoid unnecessary appeals • Improve win % substantially Types of Separations Voluntary Quit • “I quit” • No show/No Call for Lack of Work three or more days • Completed Assignments • Plant closing • Position li i t d P iti eliminated Discharge • Misconduct • Attendance • Violation of Policy 17
  • 18.
    Voluntary Quit The burdenof proof is the responsibility of the former employee to p p y p y show there was good cause to quit attributable to the employer. Good Cause  A change in the condition of  employment or compelling reasons.  Continued employment must be  available. available Forced resignation = DISCHARGE ALWAYS ask for a signed letter of resignation Discharge The burden of proof is the responsibility of the employer to prove that the employee was discharged for misconduct. Misconduct  A deliberate and willful disregard of  employer’s interest or repeated  violations of a known company policy 18
  • 19.
    Lack of Work • Not Disqualifying – Intent of Unemployment • Job Eliminated – No positions available • Reduced hours – Full‐time to Part‐time • Job Offers and Refusals National Annual Benefit Charge Overpayment Rate 12.00% 9.92% 9.99% 10.06% 10.00% 9.20% 9.31% 9.52% 9.28% 9.10% 9.13% 8.54% 8.19% 8.00% 6.00% 4.00% 2.00% 0.87% 0.85% 0.86% 0.66% 0.63% 0.67% 0.66% 0.67% 0.65% 0.62% 0.63% 0.00% 1999 2000 2001 2002 2003 2004 2005 2006 2007 2008 2009 % of Underpayments % of Overpayments 2009 Estimated Underpayments - $484.9 Million 2009 Estimated Overpayments - $7.124 Billion 2008 Estimated Underpayments - $259.3 Million 2008 Estimated Overpayments - $4.192 Billion Source: U.S. Department of Labor – Benefit Accuracy Measurement Report: 2009 (most recent data available) 19
  • 20.
    Merger-Acquisition-Reorganization Planning Unemployment Cost Management 20
  • 21.
    Summary • National UnemploymentTax Rate - Key metric for employers p y y p y • Total Unemployment Rate (TUR) - Impacts state trust funds • Trust Fund Solvency - Impacts Title XII loan activity • Title XII Loans - Impacts employer FUTA taxes • Economic Conditions - Impacts employer unemployment costs • Budget and Forecasting - Planning initiatives 2011 and 2012 Questions and Answers For more information please contact: p Michael Mohr Vice President TALX Corporation (314) 684-2299 Cell: (314) 369-4143 mmohr@talx.com @ 21