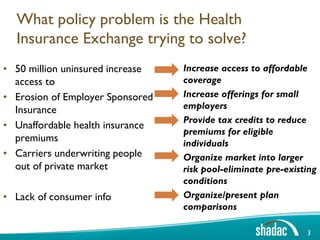
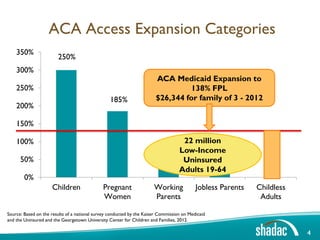
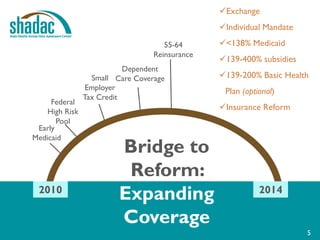
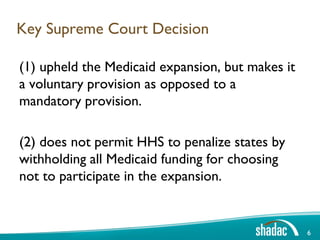
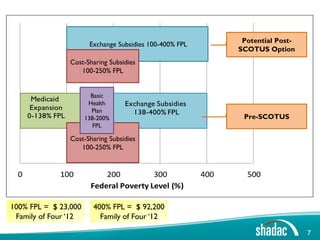
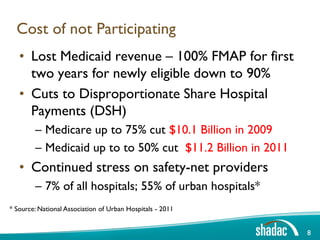
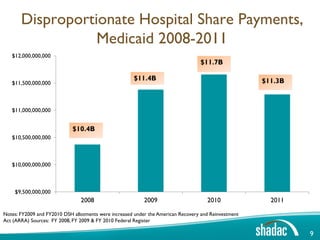
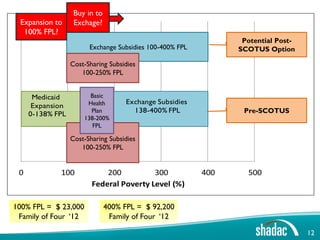
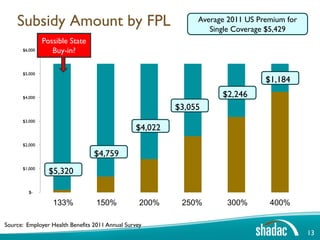
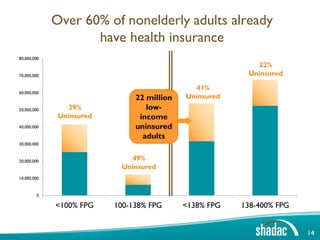
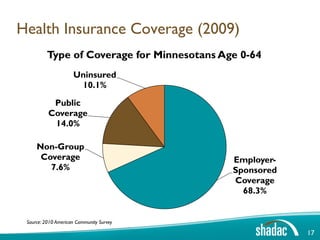
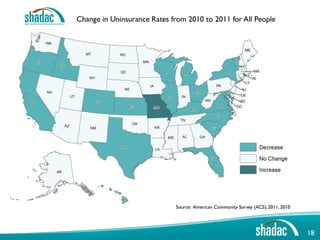
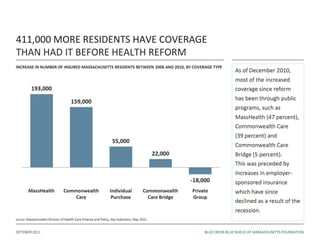
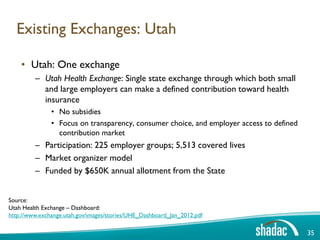
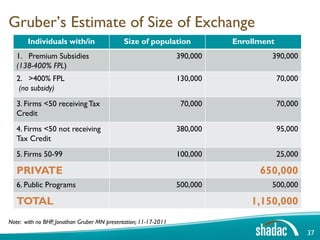
Health Insurance Exchange
Lynn A. Blewett, Ph.D.
Professor, Division of Health Policy and Management, University of Minnesota
School of Public Health
Director, State Health Access Data Assistance Center

Public Informational Forum on Options for Structure
of our Health Care System
Mankato State University
September 22, 2012


                      Funded by a grant from the Robert Wood Johnson Foundation
Overview
1.   Overview of Changes Post-SCOTUS
2.   Cost of doing nothing
3.   New state questions
4.   Estimates by new Income Categories
5.   Data Resources


                                          2
What policy problem is the Health
  Insurance Exchange trying to solve?
• 50 million uninsured increase   • Increase access to affordable
  access to                         coverage
• Erosion of Employer Sponsored   • Increase offerings for small
  Insurance                         employers
                                  • Provide tax credits to reduce
• Unaffordable health insurance
                                    premiums for eligible
  premiums                          individuals
• Carriers underwriting people    • Organize market into larger
  out of private market             risk pool-eliminate pre-existing
                                    conditions
• Lack of consumer info           • Organize/present plan
                                    comparisons

                                                                 3
ACA Access Expansion Categories
    350%
                        250%
    300%
                                                                        ACA Medicaid Expansion to
    250%                                                                          138% FPL
                                                 185%                   $26,344 for family of 3 - 2012
    200%

    150%

    100%                                                                       22 million
                                                                          63% Low-Income
      50%                                                                              37%
                                                                               Uninsured
                                                                              Adults 19-64                      0
        0%
                     Children                 Pregnant                 Working             Jobless Parents   Childless
                                              Women                    Parents                                Adults

Source: Based on the results of a national survey conducted by the Kaiser Commission on Medicaid
and the Uninsured and the Georgetown University Center for Children and Families, 2012.

                                                                                                                         4
Exchange
                                                Individual Mandate
                                     55-64      <138% Medicaid
                                  Reinsurance
                                                139-400% subsidies
                           Dependent
                  Small Care Coverage           139-200% Basic Health
                 Employer                        Plan (optional)
                Tax Credit
     Federal
    High Risk
                                                Insurance Reform
       Pool
 Early
Medicaid
                         Bridge to
                          Reform:
 2010
                         Expanding                         2014

                         Coverage
                                                                      5
Key Supreme Court Decision

(1) upheld the Medicaid expansion, but makes it
a voluntary provision as opposed to a
mandatory provision.

(2) does not permit HHS to penalize states by
withholding all Medicaid funding for choosing
not to participate in the expansion.


                                                  6
Potential Post-
                         Exchange Subsidies 100-400% FPL
                                                                 SCOTUS Option
                   Cost-Sharing Subsidies
                      100-250% FPL


                         Basic
       Medicaid
                        Health       Exchange Subsidies
       Expansion         Plan
      0-138% FPL                       138-400% FPL
                       138-200%                                   Pre-SCOTUS
                          FPL

                   Cost-Sharing Subsidies
                      100-250% FPL


  0           100            200          300              400     500
                         Federal Poverty Level (%)

100% FPL = $ 23,000       400% FPL = $ 92,200
 Family of Four ‘12         Family of Four ‘12

                                                                                    7
Cost of not Participating
   • Lost Medicaid revenue – 100% FMAP for first
     two years for newly eligible down to 90%
   • Cuts to Disproportionate Share Hospital
     Payments (DSH)
        – Medicare up to 75% cut $10.1 Billion in 2009
        – Medicaid up to to 50% cut $11.2 Billion in 2011
   • Continued stress on safety-net providers
        – 7% of all hospitals; 55% of urban hospitals*
* Source: National Association of Urban Hospitals - 2011


                                                            8
Disproportionate Hospital Share Payments,
                  Medicaid 2008-2011
   $12,000,000,000
                                                                                   $11.7B

                                                      $11.4B                                          $11.3B
   $11,500,000,000


   $11,000,000,000


                             $10.4B
   $10,500,000,000


   $10,000,000,000


    $9,500,000,000
                                2008                       2009                      2010               2011

Notes: FY2009 and FY2010 DSH allotments were increased under the American Recovery and Reinvestment
Act (ARRA) Sources: FY 2008, FY 2009 & FY 2010 Federal Register

                                                                                                               9
State DSH Payments 2011
Top         Total            Bottom   Total Allotment
Five     Allotment            Five          <1%
            45%
NY        $ 1,607,960,722     WY           $   226,570

CA        $ 1,097,417,551     DE            $ 9,062,839

TX        $    957,268,445    ND            $ 9,562,154

LA        $    731,960,000     HI          $10,000,000

NJ        $    644,435,620     SD          $11,056,409


MN            $74,768,422

                                                          10
Some New State Questions

• Can we expand only up to 100% FPL not the
  initial 138%?
• Can we pay premiums and buy-in those at
  100-138% into the exchange? Feds pay for tax
  credit and cost-sharing subsidies, limited liability
  for states
• Does it make sense to set up the exchange
  for those at 138-400 FPL but not do anything
  for the very poor (<100% FPL)?

                                                         11
Buy in to
 Expansion to      Exchage?
  100% FPL?
                                                                 Potential Post-
                        Exchange Subsidies 100-400% FPL         SCOTUS Option

                  Cost-Sharing Subsidies
                     100-250% FPL


      Medicaid          Basic
                       Health        Exchange Subsidies
      Expansion
     0-138% FPL         Plan           138-400% FPL              Pre-SCOTUS
                      138-200%
                         FPL

                  Cost-Sharing Subsidies
                     100-250% FPL


 0           100             200          300             400     500
                         Federal Poverty Level (%)

100% FPL = $ 23,000            400% FPL = $ 92,200
 Family of Four ‘12             Family of Four ‘12

                                                                                   12
Subsidy Amount by FPL                                     Average 2011 US Premium for
                                                                 Single Coverage $5,429
               Possible State
      $6,000      Buy-in?

      $5,000
                                                                                $1,184
      $4,000                                                        $2,246
                                                         $3,055
      $3,000
                                                $4,022
      $2,000

                                 $4,759
      $1,000
                 $5,320

         $-

                  133%            150%            200%    250%       300%        400%

Source: Employer Health Benefits 2011 Annual Survey
                                                                                            13
Over 60% of nonelderly adults already
                    have health insurance
80,000,000
                                                           22%
70,000,000                                               Uninsured

                                              41%
60,000,000
                               22 million   Uninsured
50,000,000      39%               low-
              Uninsured         income
40,000,000                     uninsured
                                 adults
30,000,000


20,000,000                   49%
                           Uninsured
10,000,000


        0

             <100% FPG    100-138% FPG      <138% FPG   138-400% FPG


                                                                       14
Individual Mandate - 2014

• Individuals are required to maintain minimum
  essential coverage for themselves and their
  dependents.
• Those who do not meet the mandate will be
  required to pay a penalty for each month of
  noncompliance:

         Average annual penalty will be $674 for
                   average US citizen

                                                   15
Exemptions to the Individual Mandate

• Financial hardship
• Religious objections
• American Indians and Alaska Natives
• Incarcerated individuals
• Those for whom the lowest cost plan option
  exceeds 8% of income, and
• Those whose income is below the tax filing threshold

               And the Undocumented

                                                         16
Health Insurance Coverage (2009)
          Type of Coverage for Minnesotans Age 0-64
                     Uninsured
                      10.1%
           Public
          Coverage
           14.0%

     Non-Group
      Coverage                               Employer-
        7.6%                                 Sponsored
                                             Coverage
                                               68.3%


 Source: 2010 American Community Survey

                                                         17
18
Offer Rate of Private Employer ESI by Firm
Size, 2009/10 Minnesota
                                          Offer
                                  (of establishments)
120%


100%


80%


60%


40%


20%


 0%
       <10                10-24                 25-99   100-999   1000+

       Source: 2009, 2010 MEPS-IC, Table IIA2
                                                                          19
Take-up Rate of Private Employer ESI by
  Firm Size, 2009/10 Minnesota
                                                       Take-up
                                           (of employees at establishments)
   100%
     90%
     80%
     70%
     60%
     50%
     40%
     30%
     20%
     10%
      0%
                      <10                   10-24          25-99         100-999   1000+

Source: 2009, 2010 MEPS-IC, Table IIB3B2
                                                                                           20
Percent with Employer Sponsored Insurance (Age
  19-64) 1999 to 2009 Minnesota
     100

      90
                               80.6%
      80
                                               70.7%
      70
                                                           69%
      60                                                   ‘09/10
      50

      40

      30

      20

      10

        0
                                  1999/2000    2008/2009

Source: 2000, 2001, 2009 CPS SHADAC-Enhanced

                                                                    21
Single and Family Premiums, Minnesota
    $14,000

                                                                               $11,905
    $12,000


    $10,000


     $8,000
                                                                $6,587
     $6,000
                                                  $4,516
     $4,000
                                $2,455
     $2,000


         $-
                             1999/2000            2008/2009   1999/2000
                                                                               2008/2009
                                         Single                           Family

Source: 1999/2000, 2008/2009 MEPS-IC
                                                                                           22
Exchange Basics

• What is an Exchange under the ACA?
  – A web-based marketplace that organizes information
    about all available health insurance coverage options in a
    standardized format that allows comparison across plans
    with respect to premiums, cost-sharing, coverage and
    quality ratings
  – Consumers can select and enroll in coverage through the
    Exchange
  – If a consumer is identified as Medicaid-eligible, he/she can
    enroll in Medicaid through the Exchange or potentially
    quality for premium subsidy through the form of a tax
    credit
                                                                   23
Essential Health Benefits (EHBs)
• Set of services that must be included in health plans offered both in and
  outside of the exchange.
• EHBs must include items and services in these 10 categories:
    –   Ambulatory patient services
    –   Emergency services
    –   Hospitalization
    –   Maternity and newborn care
    –   Mental health and substance use disorder services, including behavioral health
        treatment
    –   Prescription drugs
    –   Rehabilitative and habilitative services and devices
    –   Laboratory services
    –   Preventive and wellness services and chronic disease management, and
    –   Pediatric services, including oral and vision care
Other State Activity

• 32 states doing something
  – 10 States (plus DC) have Exchange Legislation
  – 2 Proceeding by executive order (MN)
  – 20 states pursuing/studying
• MA and Utah with Existing Exchanges
• 16 states not active


                                                    25
State Progress on Exchange Legislation


Source: National Conference of State Legislatures
http://www.ncsl.org/issues-research/health/state-actions-to-implement-the-
health-benefit-exch.aspx
                                                                             26
Existing Exchanges: Massachusetts

     • Massachusetts: Two exchanges under the umbrella “Health
       Connector” exchange
        – Commonwealth Care: Exchange for subsidy-eligible
          individuals (up to 300% FPL)
           • Participation:159,000 members
        – Commonwealth Choice: Combined exchange for small-
          group and unsubsidized non-group insurance
           • Participation: 41,000 members
        – Active purchaser model
        – State collects a portion of premiums for products sold
          through the Connector to fund its operation
Source: Massachusetts Health Care Reform - Facts and Figures: http://bit.ly/zjsbft

                                                                                     27
28
29
30
31
32
33
Existing Exchanges: Utah

    • Utah: One exchange
         – Utah Health Exchange: Single state exchange through which both small
           and large employers can make a defined contribution toward health
           insurance
               • No subsidies
               • Focus on transparency, consumer choice, and employer access to defined
                 contribution market
         – Participation: 225 employer groups; 5,513 covered lives
         – Market organizer model
         – Funded by $650K annual allotment from the State


Source:
Utah Health Exchange – Dashboard:
http://www.exchange.utah.gov/images/stories/UHE_Dashboard_Jan_2012.pdf

                                                                                          35
A few more things about Minnesota

• Jonathan Gruber modeling findings
• Exchange Advisory Board making progress
• MCHA


                                            36
Gruber’s Estimate of Size of Exchange
       Individuals with/in                   Size of population            Enrollment
   1. Premium Subsidies                                          390,000            390,000
   (138-400% FPL)
   2. >400% FPL                                                  130,000                70,000
    (no subsidy)
   3. Firms <50 receiving Tax                                     70,000                70,000
   Credit
   4. Firms <50 not receiving                                    380,000                95,000
   Tax Credit
   5. Firms 50-99                                                100,000                25,000

   PRIVATE                                                                       650,000
   6. Public Programs                                            500,000            500,000

   TOTAL                                                                       1,150,000
Note: with no BHP, Jonathan Gruber MN presentation; 11-17-2011
                                                                                                 37
Remember the problem and the target
population…
• Health Insurance Exchange is one part of
  health reform
• Focus in on individual and small employer
  market – target population
  – Creating options for affordable coverage
  – Providing conduit for premium subsidy
  – Organizing information for easy selection
• Access expansions include Medicaid
  expansion, 16-25 year olds, and exchange
                                                38
Recommended Reading
Sonier, Julie and Patrick Holland. November 2010. “Health Insurance Exchanges: How
   Economic and Financial Modeling can Support State Implementation.”
   AcademyHealth-State Coverage Initiatives/SHADAC Issue Brief.
   http://www.shadac.org/files/shadac/publications/Brief_ExchangeModels_Nov2010.pdf


State Health Access Data Assistance Center. October 2010. “Health Insurance
    Exchanges: Implementation and Data Considerations for States and Existing Models for
    Comparison.” Issue Brief.
    http://www.shadac.org/files/shadac/publications/IssueBrief23.pdf

State Health Reform Assistance Network. Risk Adjustment and Reinsurance:
    A Work Plan for State Officials Prepared by Wakely Consulting Group. December 2011
    http://www.rwjf.org/files/research/73728.wakely.reinsurance.12.12.11.pdf


                                                                                         39
Contact Information

          Lynn Blewett, blewe001@umn.edu
State Health Access Data Assistance Center (SHADAC)
                      612-624-4802


           Sign up to receive our newsletter and updates at
                          www.shadac.org
                                @shadac

Pres msu sept22_blewett

  • 1.
    Health Insurance Exchange LynnA. Blewett, Ph.D. Professor, Division of Health Policy and Management, University of Minnesota School of Public Health Director, State Health Access Data Assistance Center Public Informational Forum on Options for Structure of our Health Care System Mankato State University September 22, 2012 Funded by a grant from the Robert Wood Johnson Foundation
  • 2.
    Overview 1. Overview of Changes Post-SCOTUS 2. Cost of doing nothing 3. New state questions 4. Estimates by new Income Categories 5. Data Resources 2
  • 3.
    What policy problemis the Health Insurance Exchange trying to solve? • 50 million uninsured increase • Increase access to affordable access to coverage • Erosion of Employer Sponsored • Increase offerings for small Insurance employers • Provide tax credits to reduce • Unaffordable health insurance premiums for eligible premiums individuals • Carriers underwriting people • Organize market into larger out of private market risk pool-eliminate pre-existing conditions • Lack of consumer info • Organize/present plan comparisons 3
  • 4.
    ACA Access ExpansionCategories 350% 250% 300% ACA Medicaid Expansion to 250% 138% FPL 185% $26,344 for family of 3 - 2012 200% 150% 100% 22 million 63% Low-Income 50% 37% Uninsured Adults 19-64 0 0% Children Pregnant Working Jobless Parents Childless Women Parents Adults Source: Based on the results of a national survey conducted by the Kaiser Commission on Medicaid and the Uninsured and the Georgetown University Center for Children and Families, 2012. 4
  • 5.
    Exchange Individual Mandate 55-64 <138% Medicaid Reinsurance 139-400% subsidies Dependent Small Care Coverage 139-200% Basic Health Employer Plan (optional) Tax Credit Federal High Risk Insurance Reform Pool Early Medicaid Bridge to Reform: 2010 Expanding 2014 Coverage 5
  • 6.
    Key Supreme CourtDecision (1) upheld the Medicaid expansion, but makes it a voluntary provision as opposed to a mandatory provision. (2) does not permit HHS to penalize states by withholding all Medicaid funding for choosing not to participate in the expansion. 6
  • 7.
    Potential Post- Exchange Subsidies 100-400% FPL SCOTUS Option Cost-Sharing Subsidies 100-250% FPL Basic Medicaid Health Exchange Subsidies Expansion Plan 0-138% FPL 138-400% FPL 138-200% Pre-SCOTUS FPL Cost-Sharing Subsidies 100-250% FPL 0 100 200 300 400 500 Federal Poverty Level (%) 100% FPL = $ 23,000 400% FPL = $ 92,200 Family of Four ‘12 Family of Four ‘12 7
  • 8.
    Cost of notParticipating • Lost Medicaid revenue – 100% FMAP for first two years for newly eligible down to 90% • Cuts to Disproportionate Share Hospital Payments (DSH) – Medicare up to 75% cut $10.1 Billion in 2009 – Medicaid up to to 50% cut $11.2 Billion in 2011 • Continued stress on safety-net providers – 7% of all hospitals; 55% of urban hospitals* * Source: National Association of Urban Hospitals - 2011 8
  • 9.
    Disproportionate Hospital SharePayments, Medicaid 2008-2011 $12,000,000,000 $11.7B $11.4B $11.3B $11,500,000,000 $11,000,000,000 $10.4B $10,500,000,000 $10,000,000,000 $9,500,000,000 2008 2009 2010 2011 Notes: FY2009 and FY2010 DSH allotments were increased under the American Recovery and Reinvestment Act (ARRA) Sources: FY 2008, FY 2009 & FY 2010 Federal Register 9
  • 10.
    State DSH Payments2011 Top Total Bottom Total Allotment Five Allotment Five <1% 45% NY $ 1,607,960,722 WY $ 226,570 CA $ 1,097,417,551 DE $ 9,062,839 TX $ 957,268,445 ND $ 9,562,154 LA $ 731,960,000 HI $10,000,000 NJ $ 644,435,620 SD $11,056,409 MN $74,768,422 10
  • 11.
    Some New StateQuestions • Can we expand only up to 100% FPL not the initial 138%? • Can we pay premiums and buy-in those at 100-138% into the exchange? Feds pay for tax credit and cost-sharing subsidies, limited liability for states • Does it make sense to set up the exchange for those at 138-400 FPL but not do anything for the very poor (<100% FPL)? 11
  • 12.
    Buy in to Expansion to Exchage? 100% FPL? Potential Post- Exchange Subsidies 100-400% FPL SCOTUS Option Cost-Sharing Subsidies 100-250% FPL Medicaid Basic Health Exchange Subsidies Expansion 0-138% FPL Plan 138-400% FPL Pre-SCOTUS 138-200% FPL Cost-Sharing Subsidies 100-250% FPL 0 100 200 300 400 500 Federal Poverty Level (%) 100% FPL = $ 23,000 400% FPL = $ 92,200 Family of Four ‘12 Family of Four ‘12 12
  • 13.
    Subsidy Amount byFPL Average 2011 US Premium for Single Coverage $5,429 Possible State $6,000 Buy-in? $5,000 $1,184 $4,000 $2,246 $3,055 $3,000 $4,022 $2,000 $4,759 $1,000 $5,320 $- 133% 150% 200% 250% 300% 400% Source: Employer Health Benefits 2011 Annual Survey 13
  • 14.
    Over 60% ofnonelderly adults already have health insurance 80,000,000 22% 70,000,000 Uninsured 41% 60,000,000 22 million Uninsured 50,000,000 39% low- Uninsured income 40,000,000 uninsured adults 30,000,000 20,000,000 49% Uninsured 10,000,000 0 <100% FPG 100-138% FPG <138% FPG 138-400% FPG 14
  • 15.
    Individual Mandate -2014 • Individuals are required to maintain minimum essential coverage for themselves and their dependents. • Those who do not meet the mandate will be required to pay a penalty for each month of noncompliance: Average annual penalty will be $674 for average US citizen 15
  • 16.
    Exemptions to theIndividual Mandate • Financial hardship • Religious objections • American Indians and Alaska Natives • Incarcerated individuals • Those for whom the lowest cost plan option exceeds 8% of income, and • Those whose income is below the tax filing threshold And the Undocumented 16
  • 17.
    Health Insurance Coverage(2009) Type of Coverage for Minnesotans Age 0-64 Uninsured 10.1% Public Coverage 14.0% Non-Group Coverage Employer- 7.6% Sponsored Coverage 68.3% Source: 2010 American Community Survey 17
  • 18.
  • 19.
    Offer Rate ofPrivate Employer ESI by Firm Size, 2009/10 Minnesota Offer (of establishments) 120% 100% 80% 60% 40% 20% 0% <10 10-24 25-99 100-999 1000+ Source: 2009, 2010 MEPS-IC, Table IIA2 19
  • 20.
    Take-up Rate ofPrivate Employer ESI by Firm Size, 2009/10 Minnesota Take-up (of employees at establishments) 100% 90% 80% 70% 60% 50% 40% 30% 20% 10% 0% <10 10-24 25-99 100-999 1000+ Source: 2009, 2010 MEPS-IC, Table IIB3B2 20
  • 21.
    Percent with EmployerSponsored Insurance (Age 19-64) 1999 to 2009 Minnesota 100 90 80.6% 80 70.7% 70 69% 60 ‘09/10 50 40 30 20 10 0 1999/2000 2008/2009 Source: 2000, 2001, 2009 CPS SHADAC-Enhanced 21
  • 22.
    Single and FamilyPremiums, Minnesota $14,000 $11,905 $12,000 $10,000 $8,000 $6,587 $6,000 $4,516 $4,000 $2,455 $2,000 $- 1999/2000 2008/2009 1999/2000 2008/2009 Single Family Source: 1999/2000, 2008/2009 MEPS-IC 22
  • 23.
    Exchange Basics • Whatis an Exchange under the ACA? – A web-based marketplace that organizes information about all available health insurance coverage options in a standardized format that allows comparison across plans with respect to premiums, cost-sharing, coverage and quality ratings – Consumers can select and enroll in coverage through the Exchange – If a consumer is identified as Medicaid-eligible, he/she can enroll in Medicaid through the Exchange or potentially quality for premium subsidy through the form of a tax credit 23
  • 24.
    Essential Health Benefits(EHBs) • Set of services that must be included in health plans offered both in and outside of the exchange. • EHBs must include items and services in these 10 categories: – Ambulatory patient services – Emergency services – Hospitalization – Maternity and newborn care – Mental health and substance use disorder services, including behavioral health treatment – Prescription drugs – Rehabilitative and habilitative services and devices – Laboratory services – Preventive and wellness services and chronic disease management, and – Pediatric services, including oral and vision care
  • 25.
    Other State Activity •32 states doing something – 10 States (plus DC) have Exchange Legislation – 2 Proceeding by executive order (MN) – 20 states pursuing/studying • MA and Utah with Existing Exchanges • 16 states not active 25
  • 26.
    State Progress onExchange Legislation Source: National Conference of State Legislatures http://www.ncsl.org/issues-research/health/state-actions-to-implement-the- health-benefit-exch.aspx 26
  • 27.
    Existing Exchanges: Massachusetts • Massachusetts: Two exchanges under the umbrella “Health Connector” exchange – Commonwealth Care: Exchange for subsidy-eligible individuals (up to 300% FPL) • Participation:159,000 members – Commonwealth Choice: Combined exchange for small- group and unsubsidized non-group insurance • Participation: 41,000 members – Active purchaser model – State collects a portion of premiums for products sold through the Connector to fund its operation Source: Massachusetts Health Care Reform - Facts and Figures: http://bit.ly/zjsbft 27
  • 28.
  • 29.
  • 30.
  • 31.
  • 32.
  • 33.
  • 35.
    Existing Exchanges: Utah • Utah: One exchange – Utah Health Exchange: Single state exchange through which both small and large employers can make a defined contribution toward health insurance • No subsidies • Focus on transparency, consumer choice, and employer access to defined contribution market – Participation: 225 employer groups; 5,513 covered lives – Market organizer model – Funded by $650K annual allotment from the State Source: Utah Health Exchange – Dashboard: http://www.exchange.utah.gov/images/stories/UHE_Dashboard_Jan_2012.pdf 35
  • 36.
    A few morethings about Minnesota • Jonathan Gruber modeling findings • Exchange Advisory Board making progress • MCHA 36
  • 37.
    Gruber’s Estimate ofSize of Exchange Individuals with/in Size of population Enrollment 1. Premium Subsidies 390,000 390,000 (138-400% FPL) 2. >400% FPL 130,000 70,000 (no subsidy) 3. Firms <50 receiving Tax 70,000 70,000 Credit 4. Firms <50 not receiving 380,000 95,000 Tax Credit 5. Firms 50-99 100,000 25,000 PRIVATE 650,000 6. Public Programs 500,000 500,000 TOTAL 1,150,000 Note: with no BHP, Jonathan Gruber MN presentation; 11-17-2011 37
  • 38.
    Remember the problemand the target population… • Health Insurance Exchange is one part of health reform • Focus in on individual and small employer market – target population – Creating options for affordable coverage – Providing conduit for premium subsidy – Organizing information for easy selection • Access expansions include Medicaid expansion, 16-25 year olds, and exchange 38
  • 39.
    Recommended Reading Sonier, Julieand Patrick Holland. November 2010. “Health Insurance Exchanges: How Economic and Financial Modeling can Support State Implementation.” AcademyHealth-State Coverage Initiatives/SHADAC Issue Brief. http://www.shadac.org/files/shadac/publications/Brief_ExchangeModels_Nov2010.pdf State Health Access Data Assistance Center. October 2010. “Health Insurance Exchanges: Implementation and Data Considerations for States and Existing Models for Comparison.” Issue Brief. http://www.shadac.org/files/shadac/publications/IssueBrief23.pdf State Health Reform Assistance Network. Risk Adjustment and Reinsurance: A Work Plan for State Officials Prepared by Wakely Consulting Group. December 2011 http://www.rwjf.org/files/research/73728.wakely.reinsurance.12.12.11.pdf 39
  • 40.
    Contact Information Lynn Blewett, blewe001@umn.edu State Health Access Data Assistance Center (SHADAC) 612-624-4802 Sign up to receive our newsletter and updates at www.shadac.org @shadac