The document discusses different ways of measuring unemployment and types of unemployment. It provides statistics on unemployment in the UK compared to other countries. Key points include:
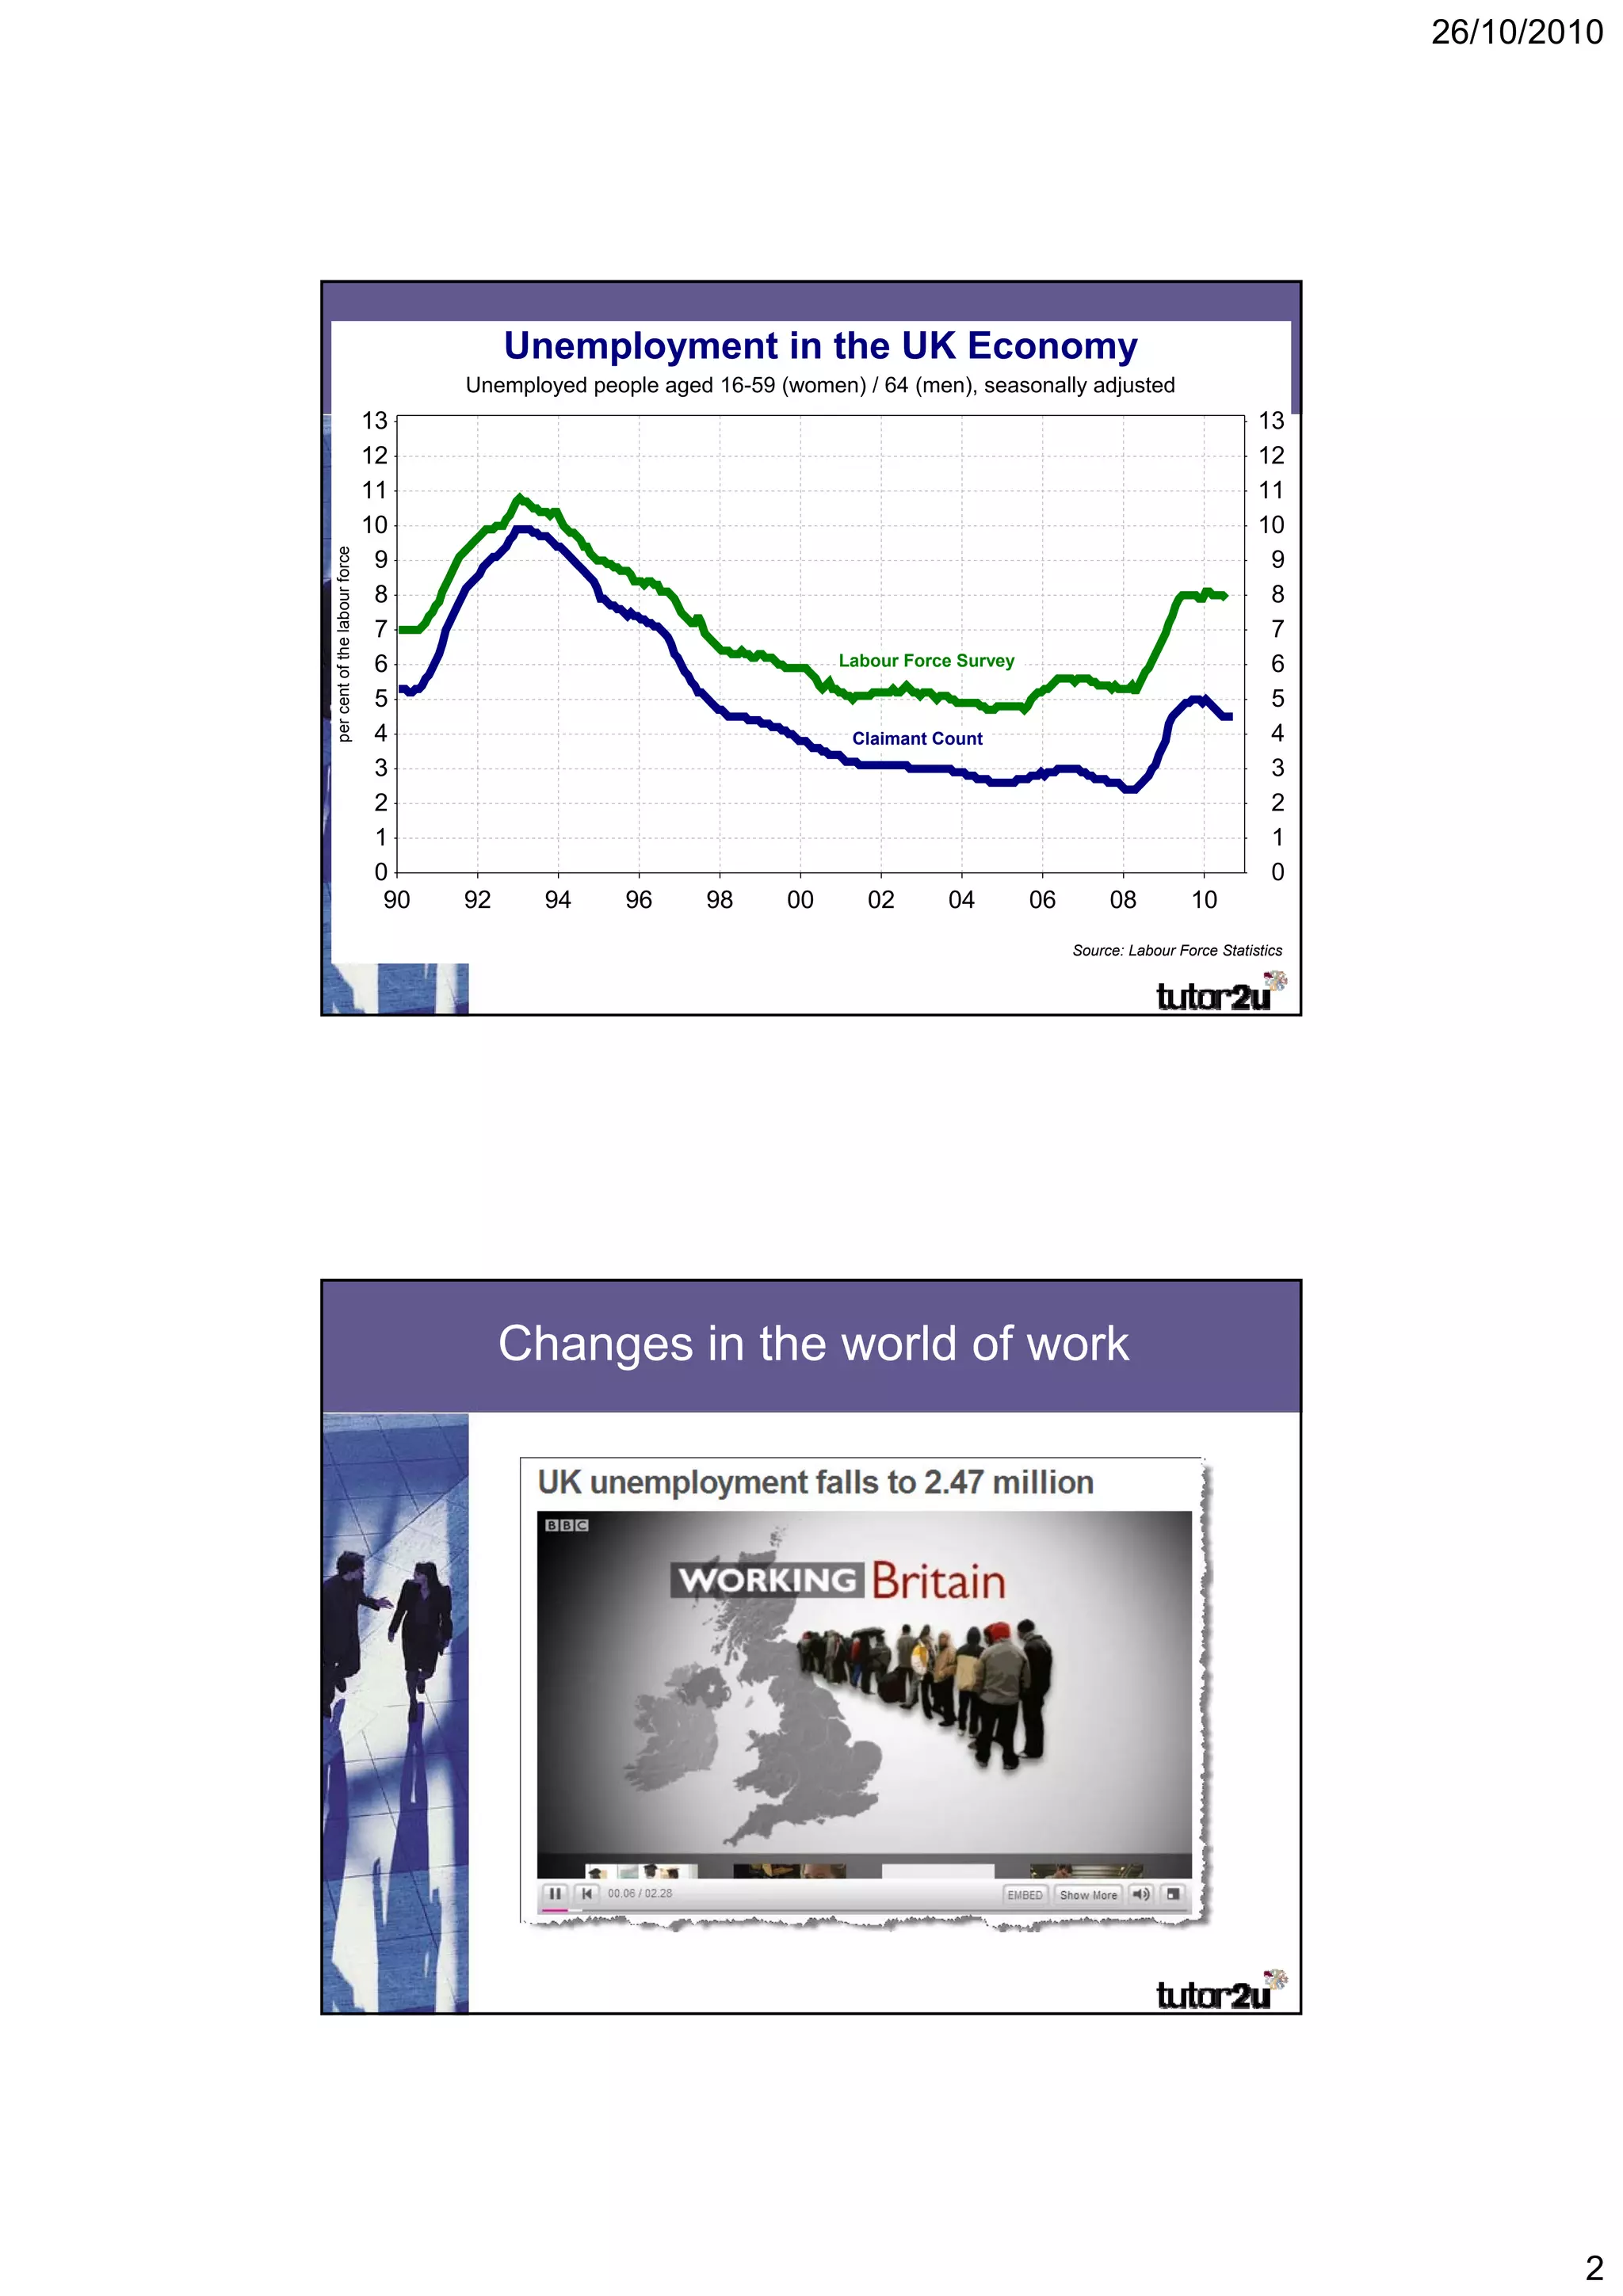
1) There are different ways to measure unemployment, including the claimant count and labour force survey.
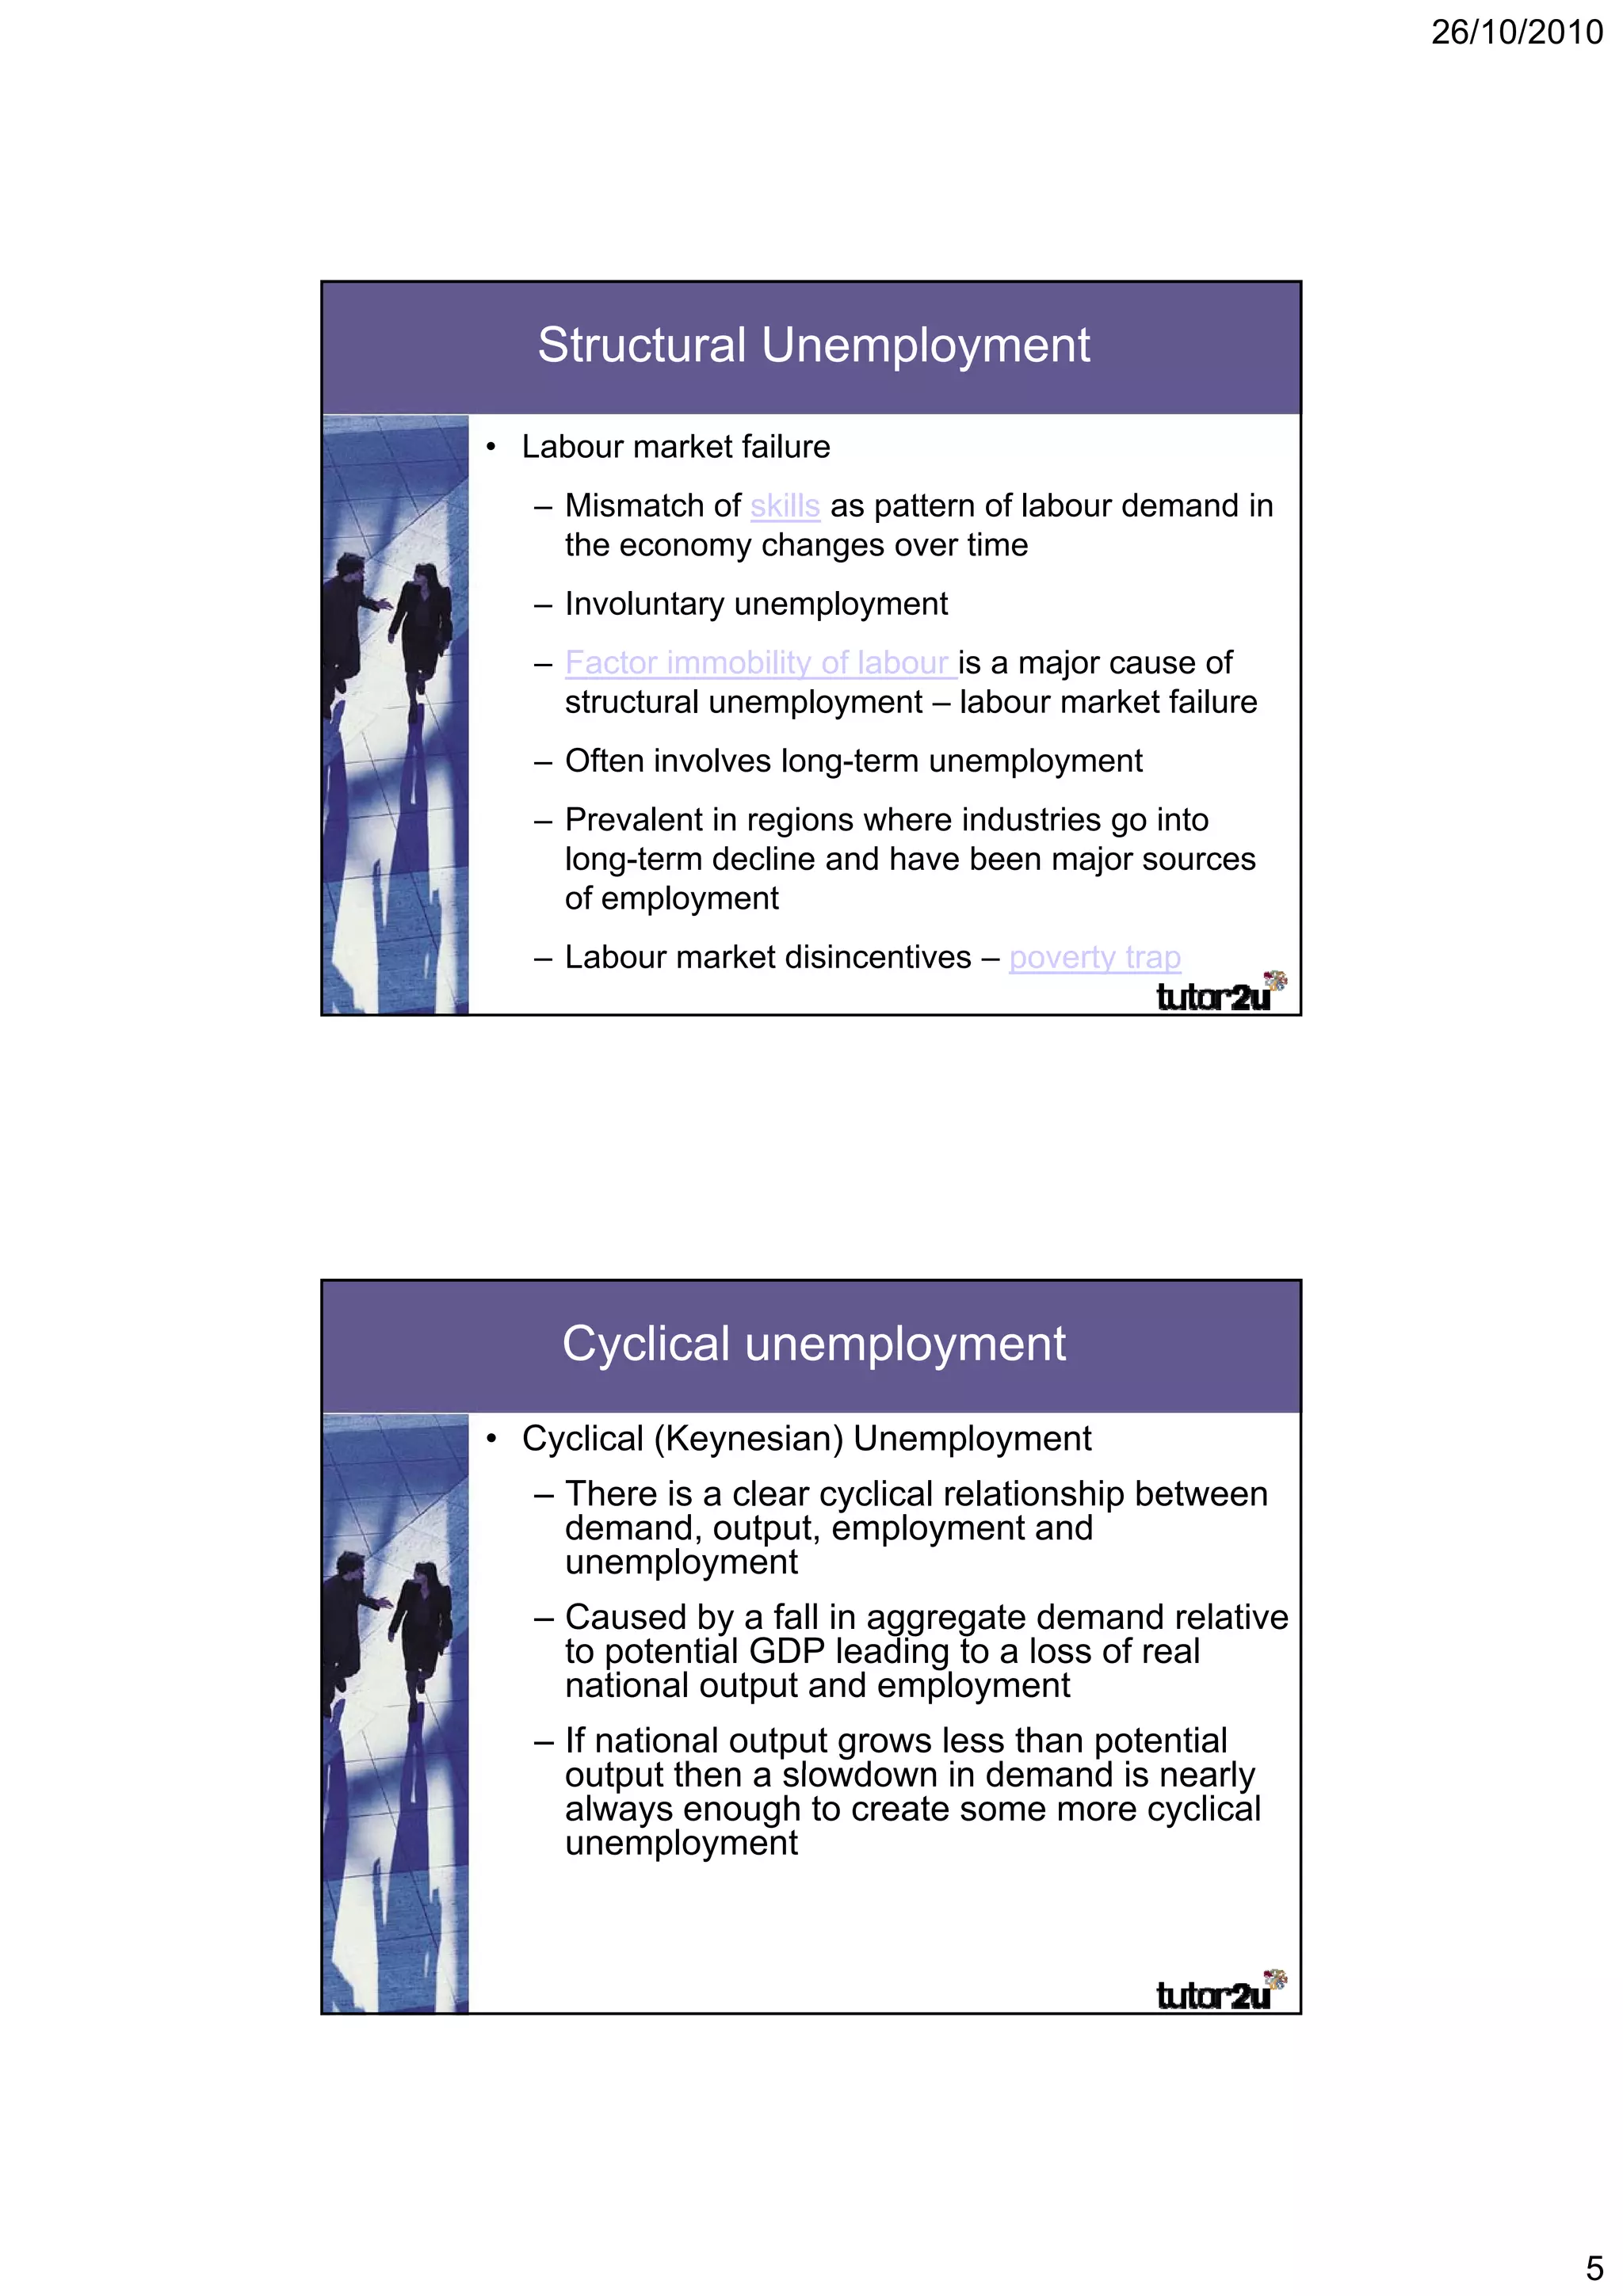
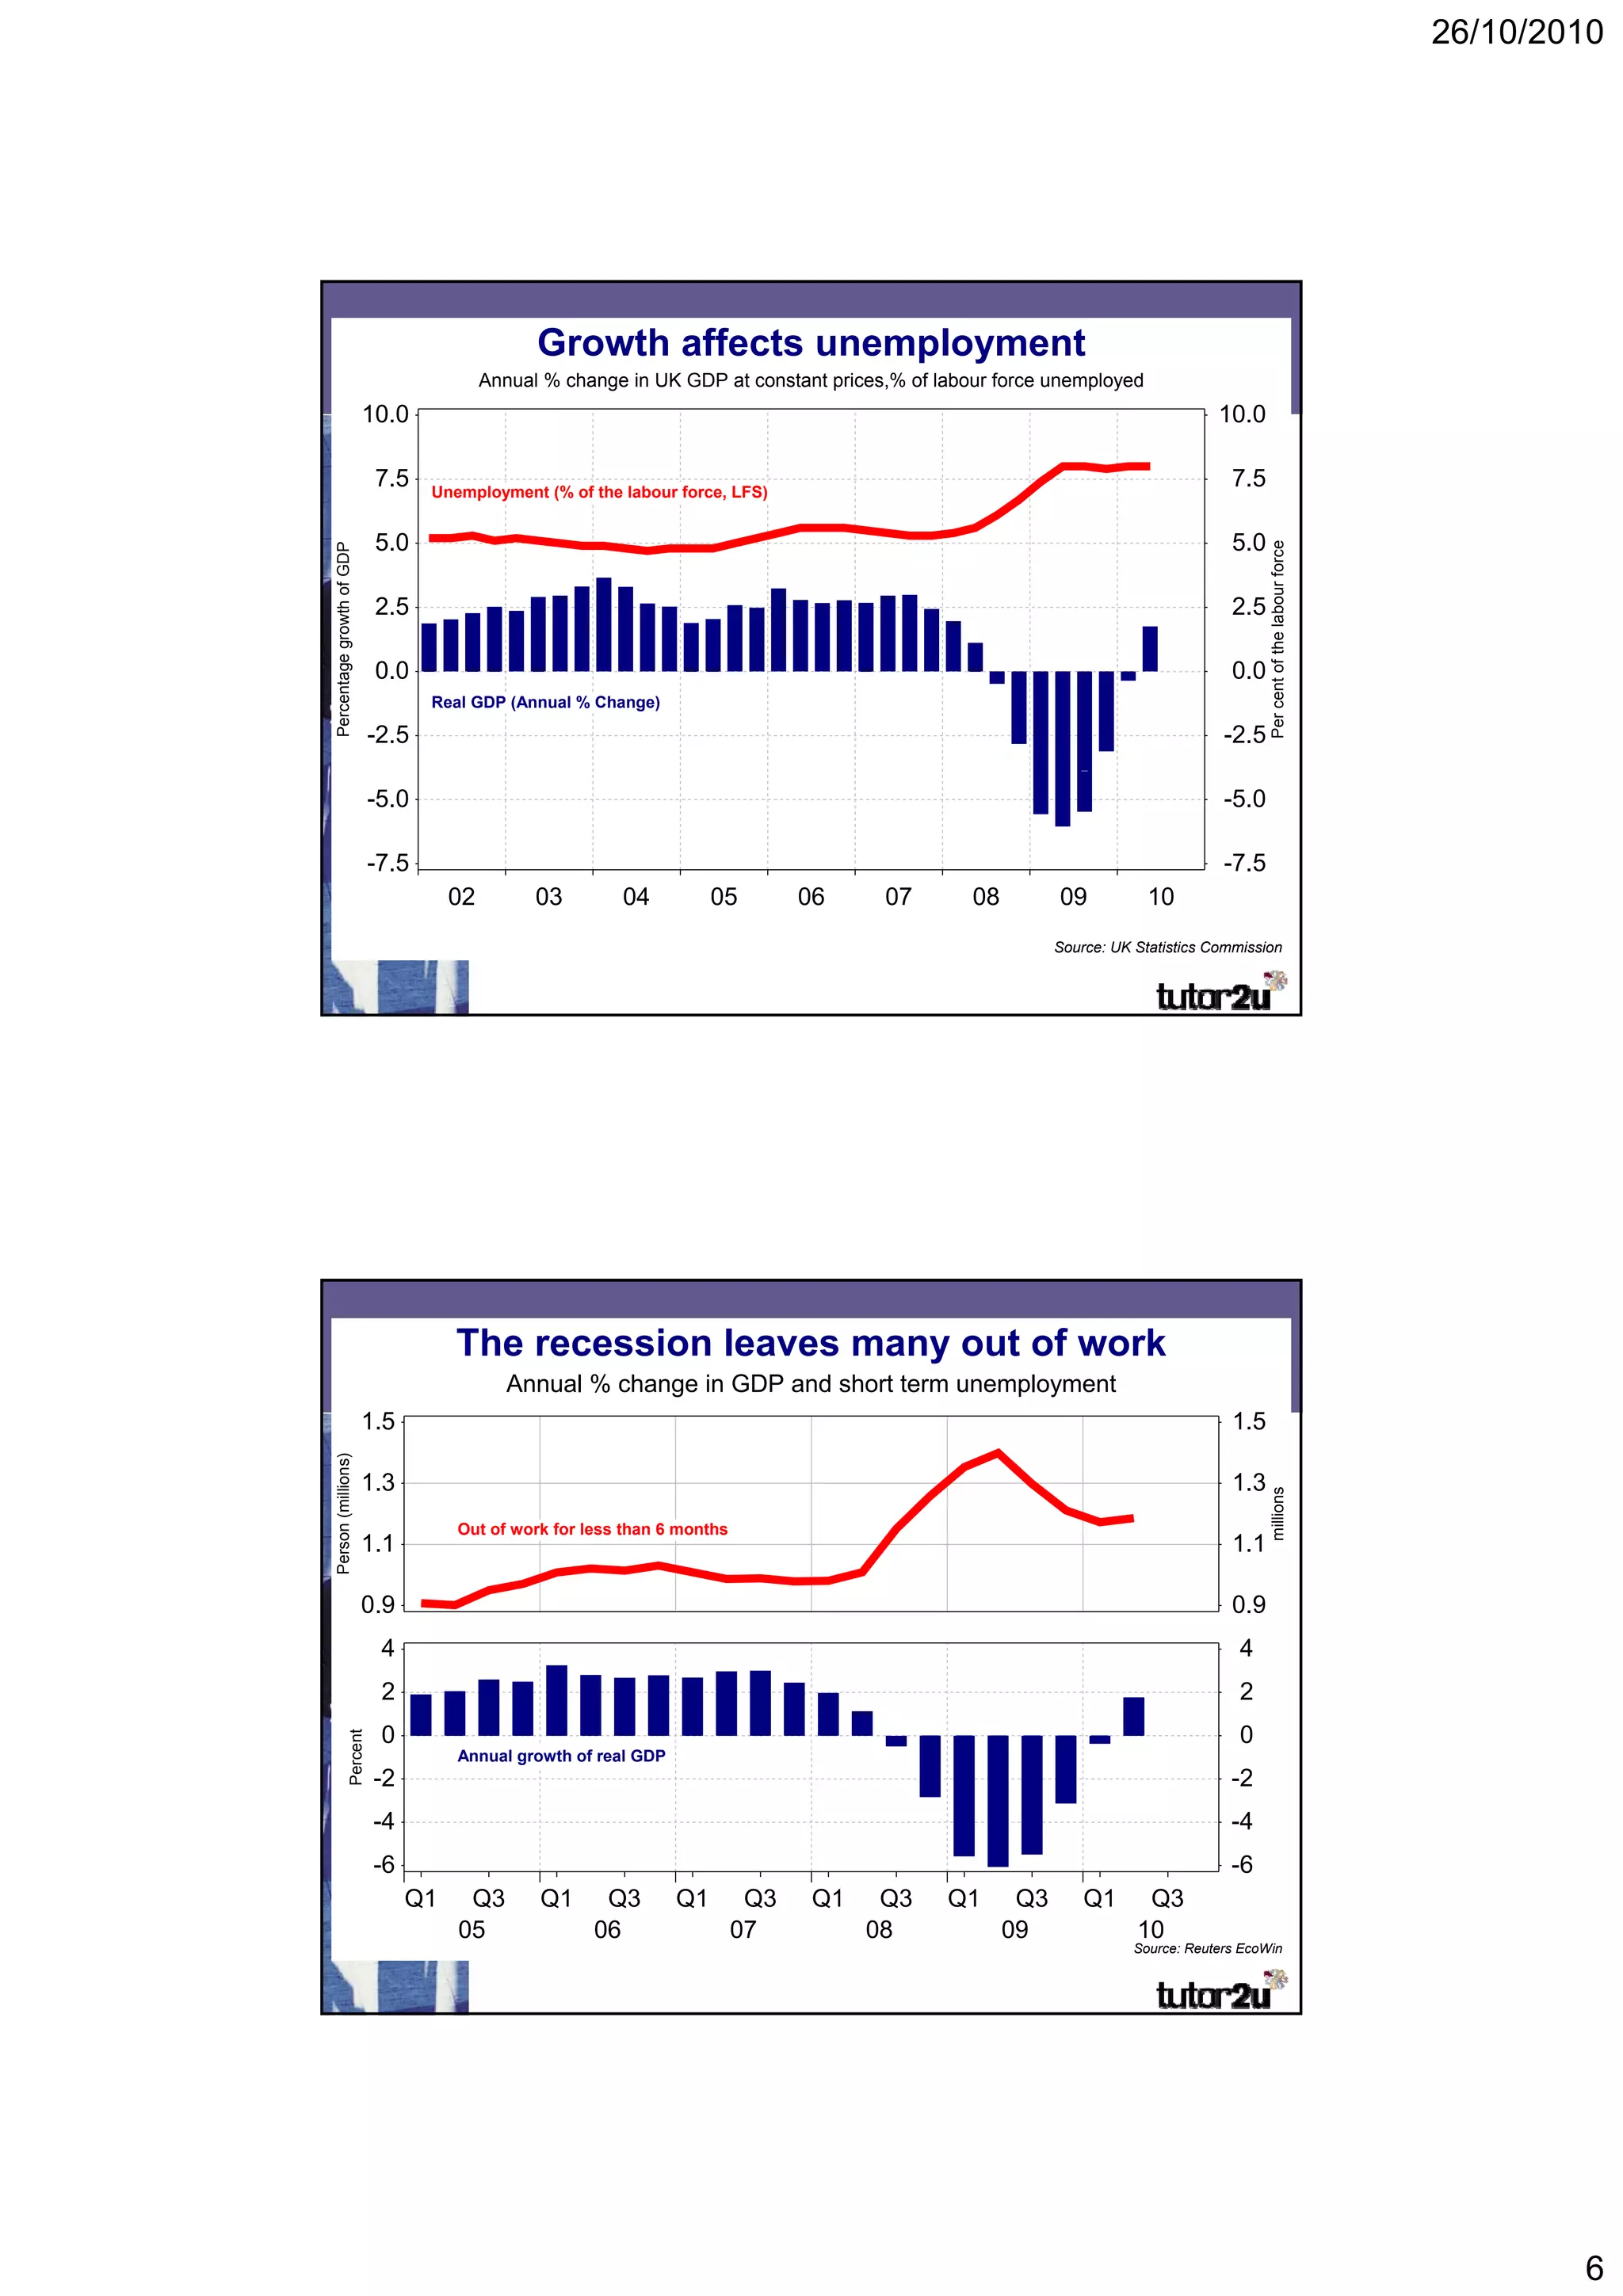
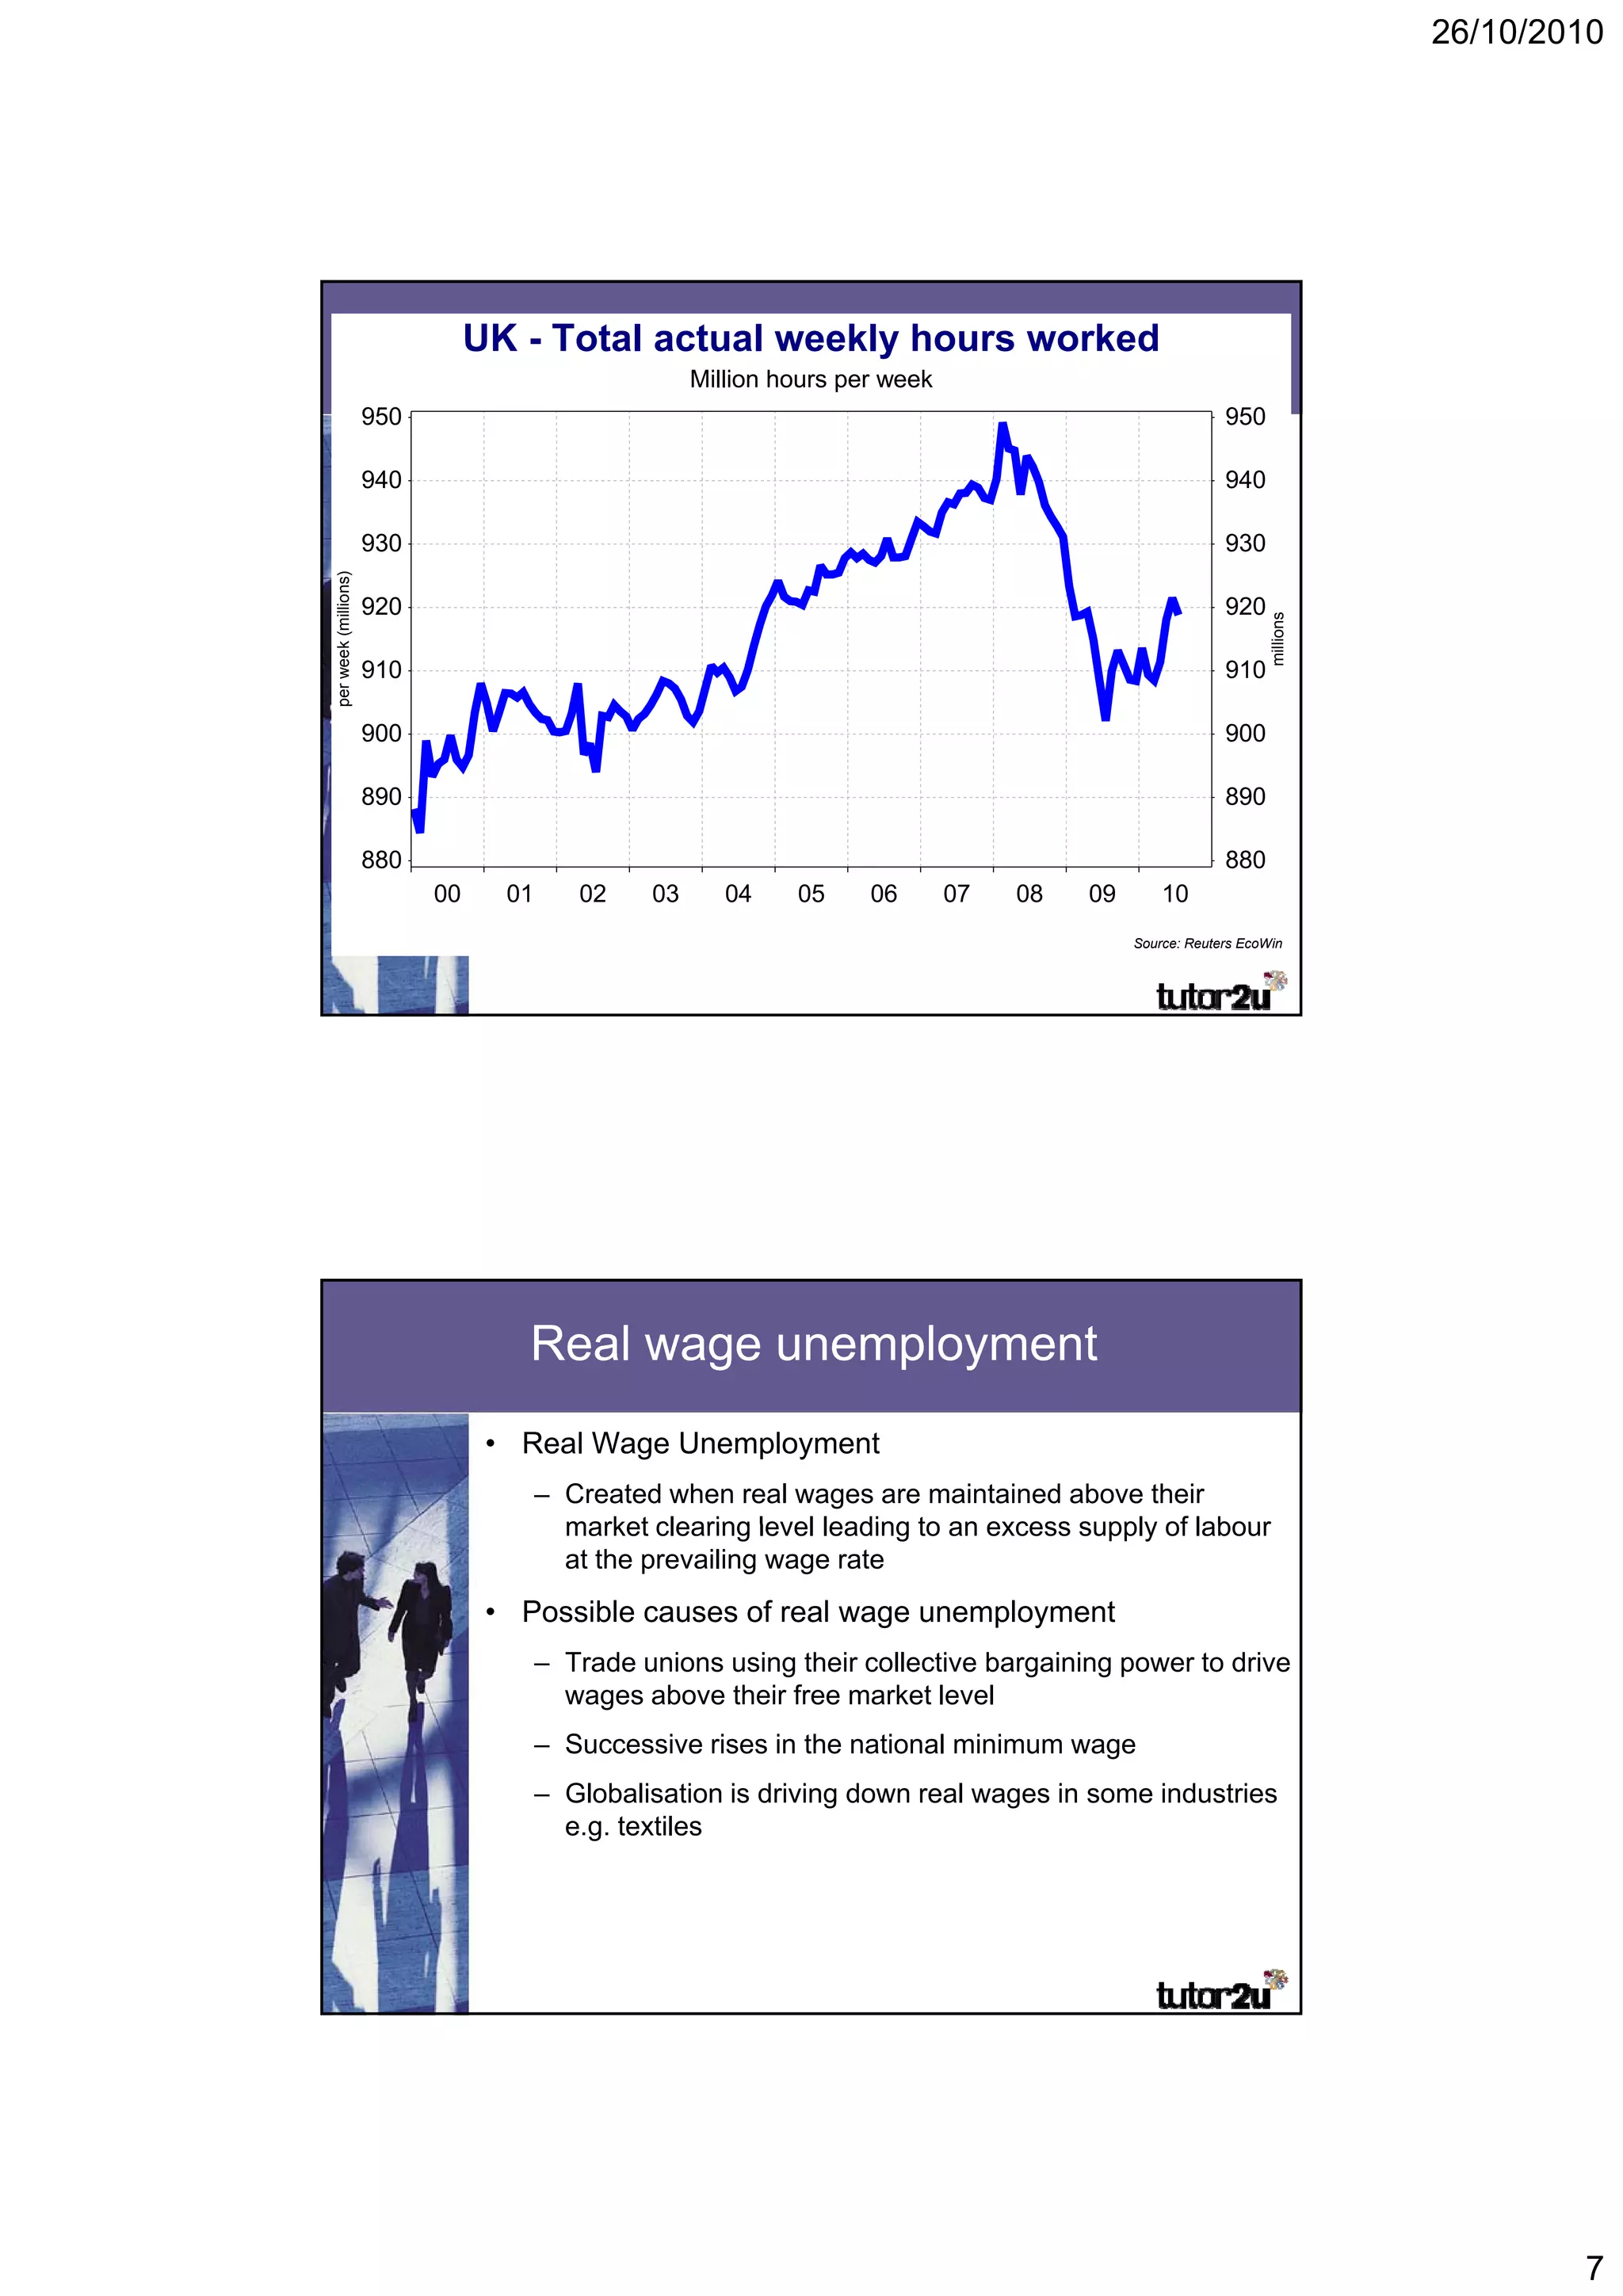
2) There are different types of unemployment, such as frictional, structural, cyclical, and real wage unemployment.
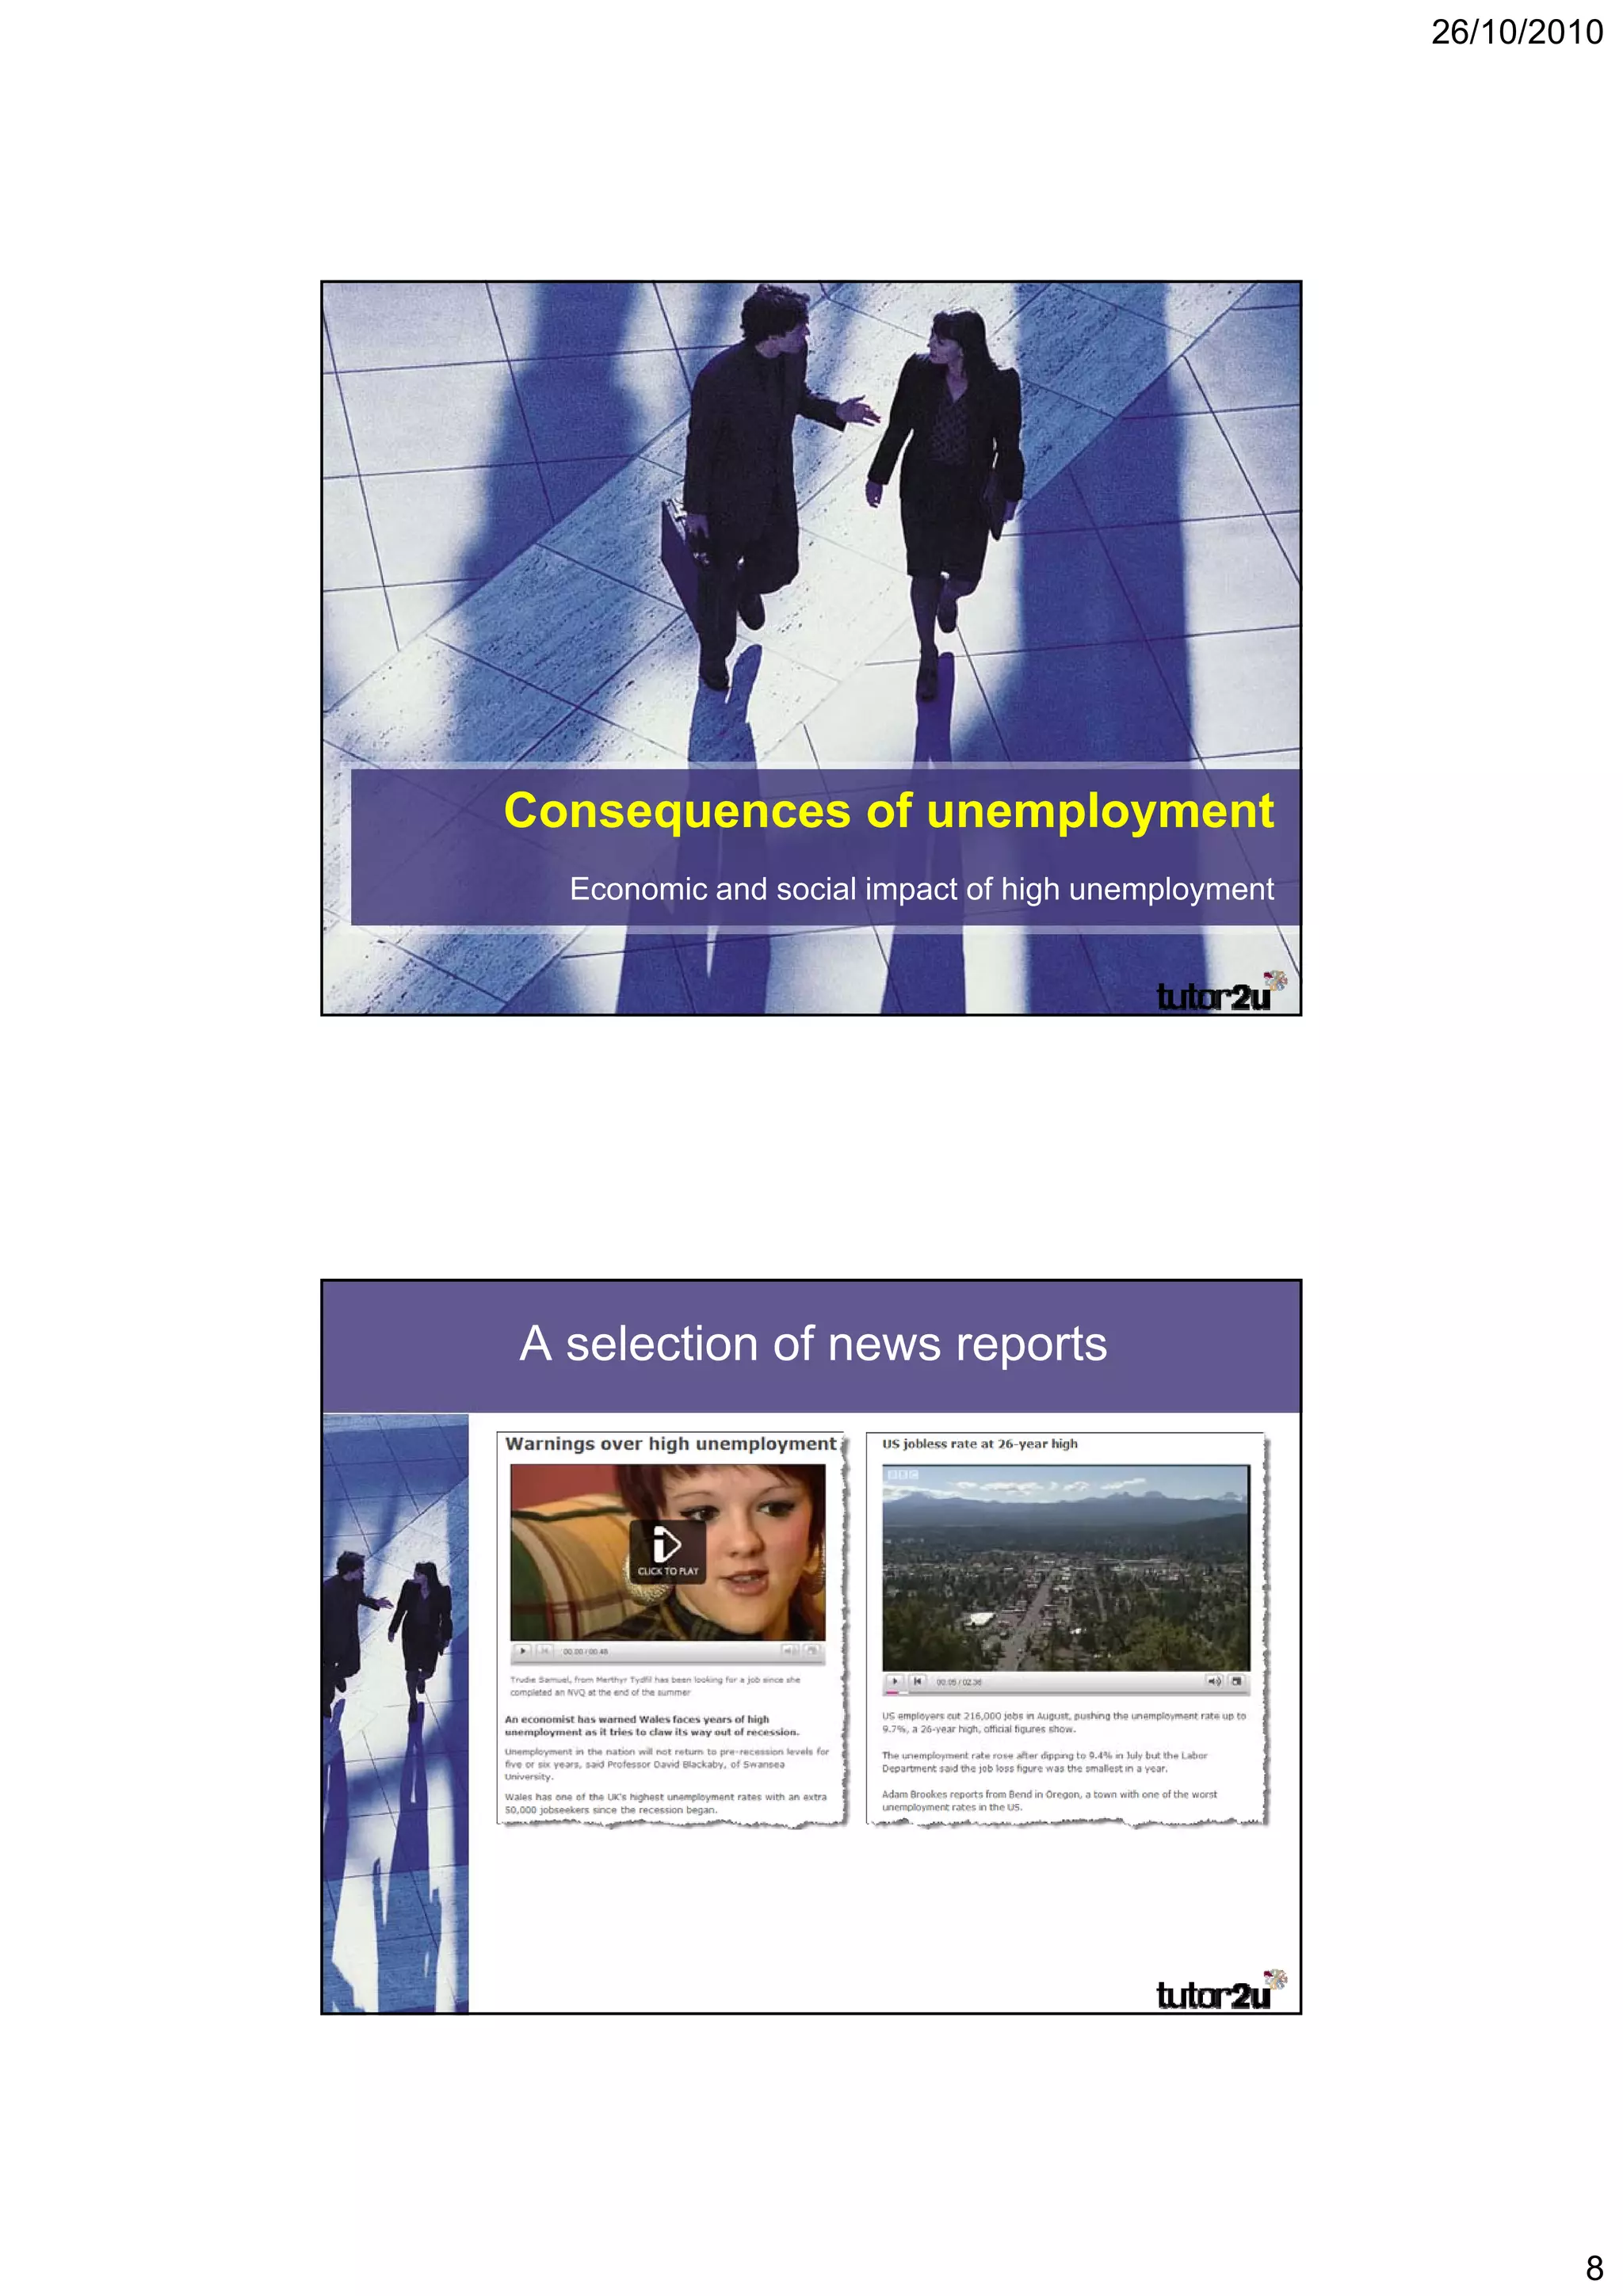
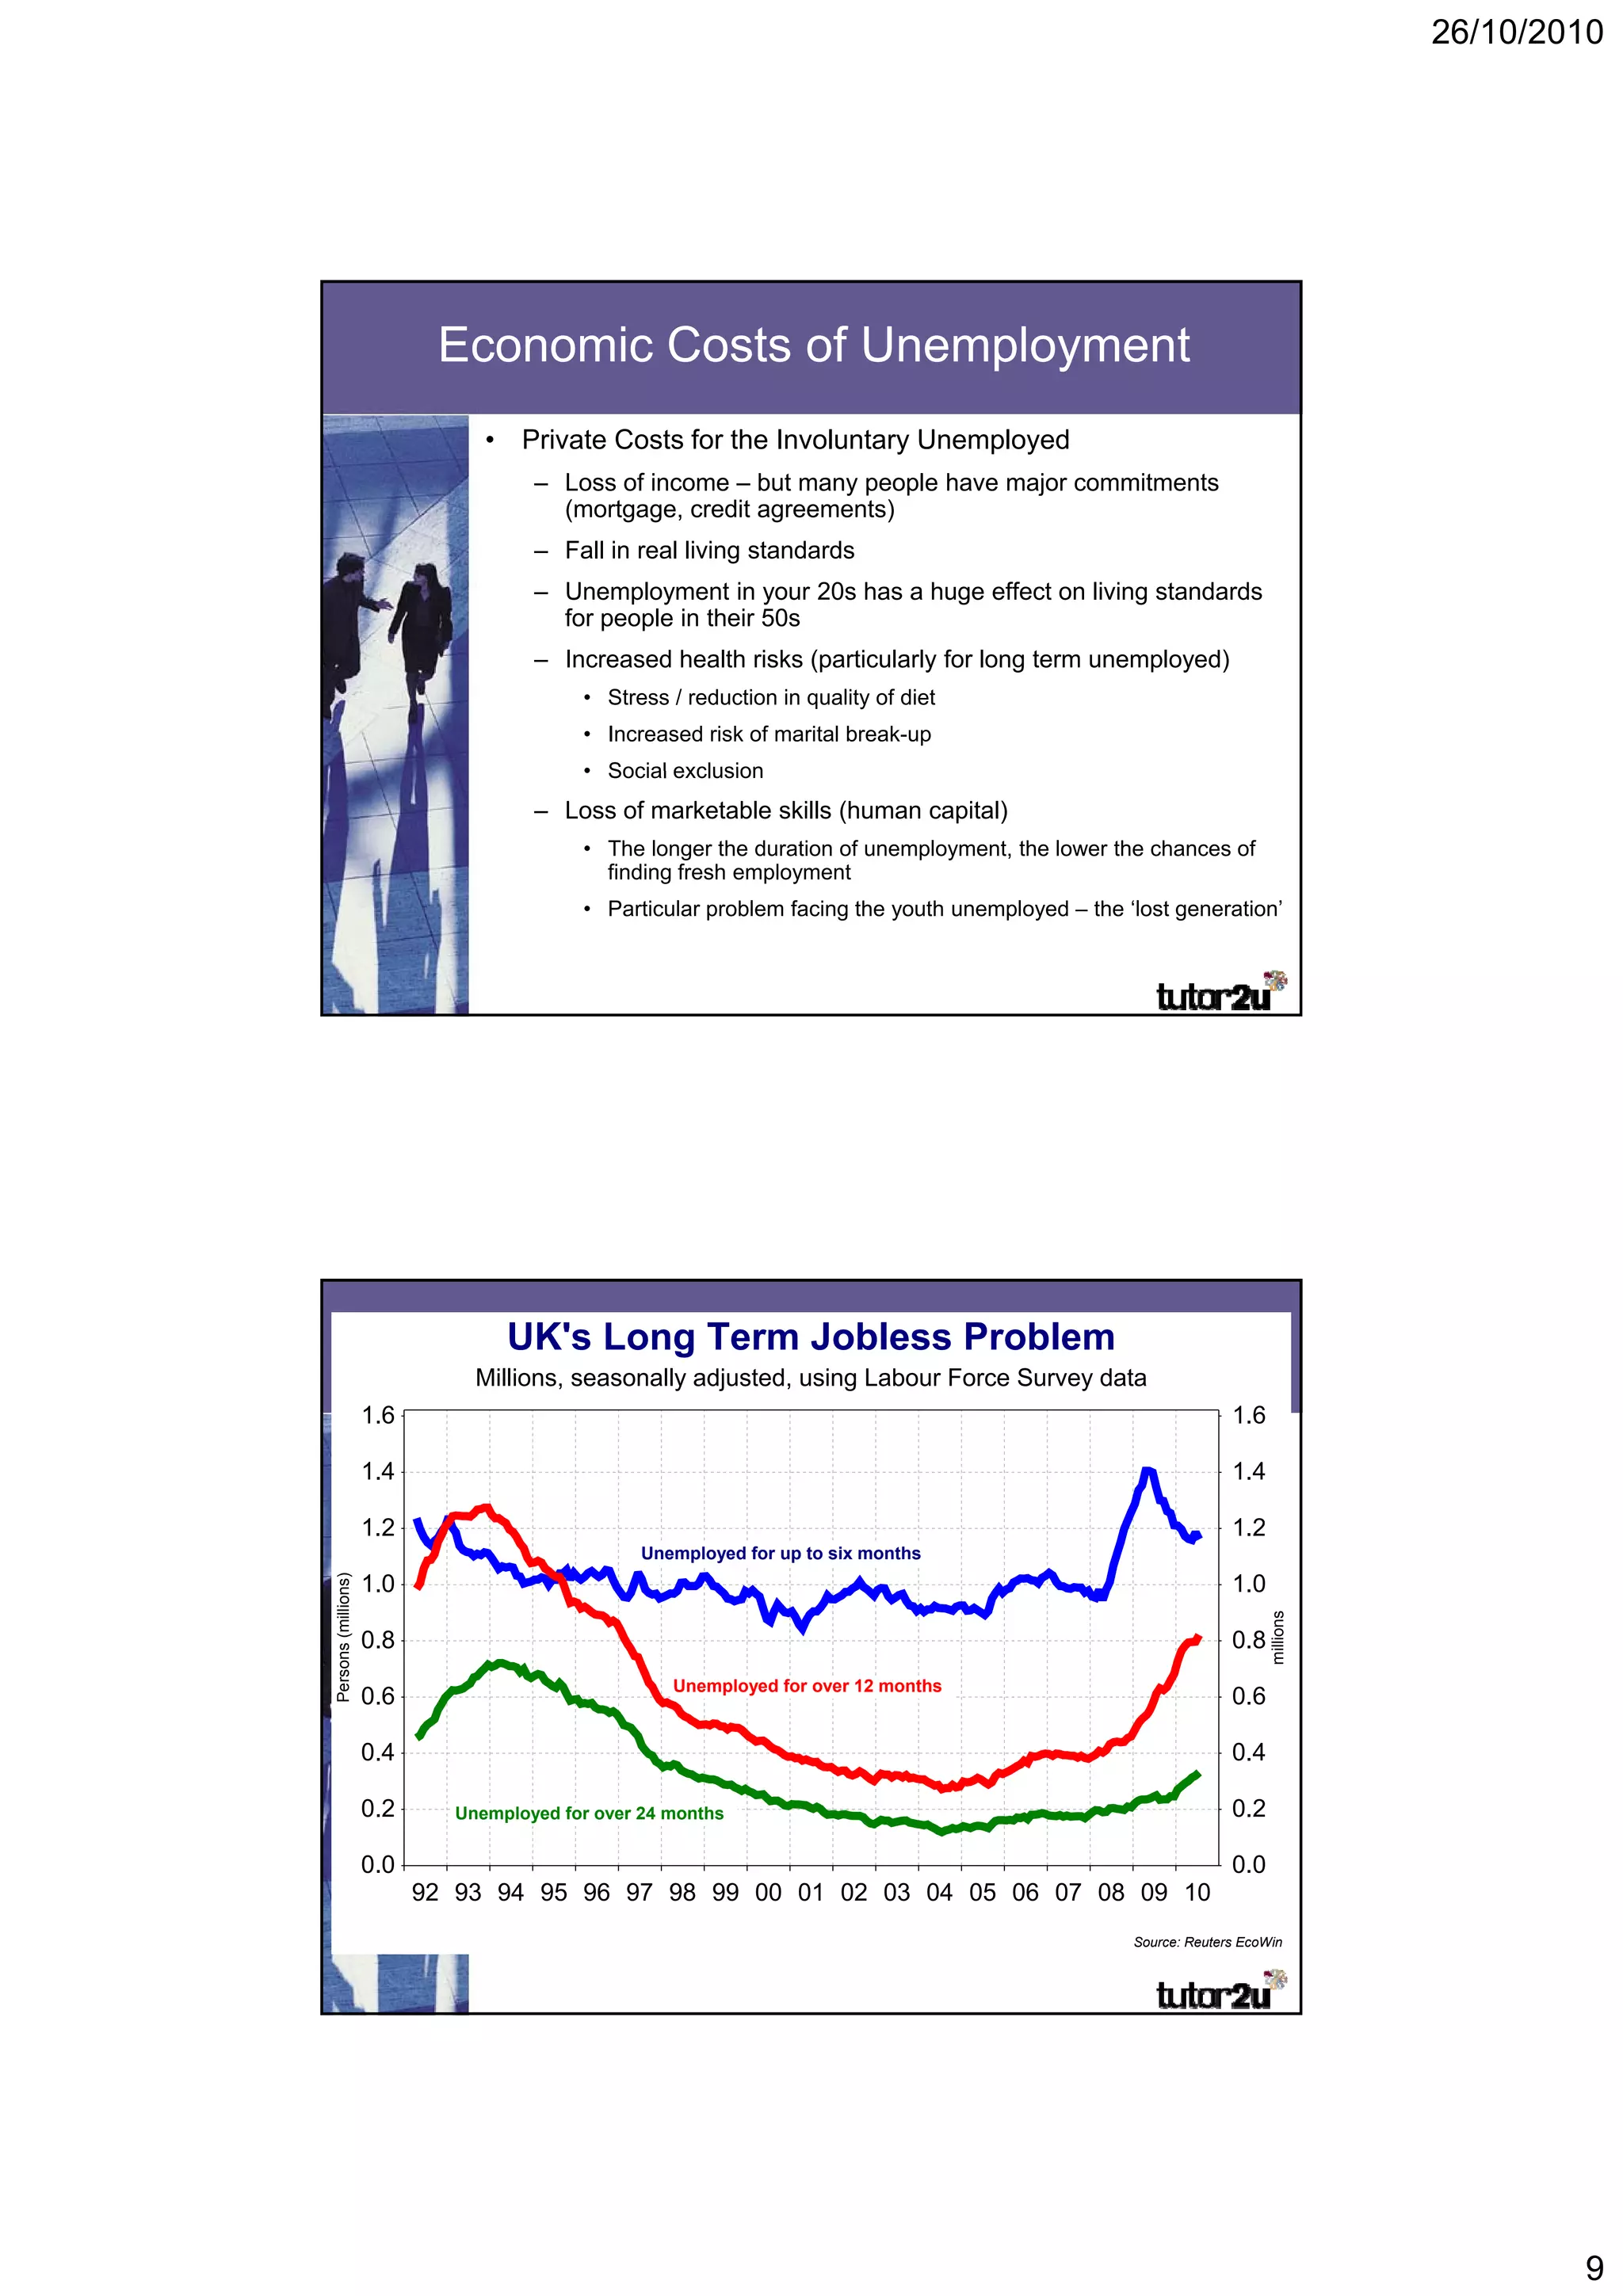
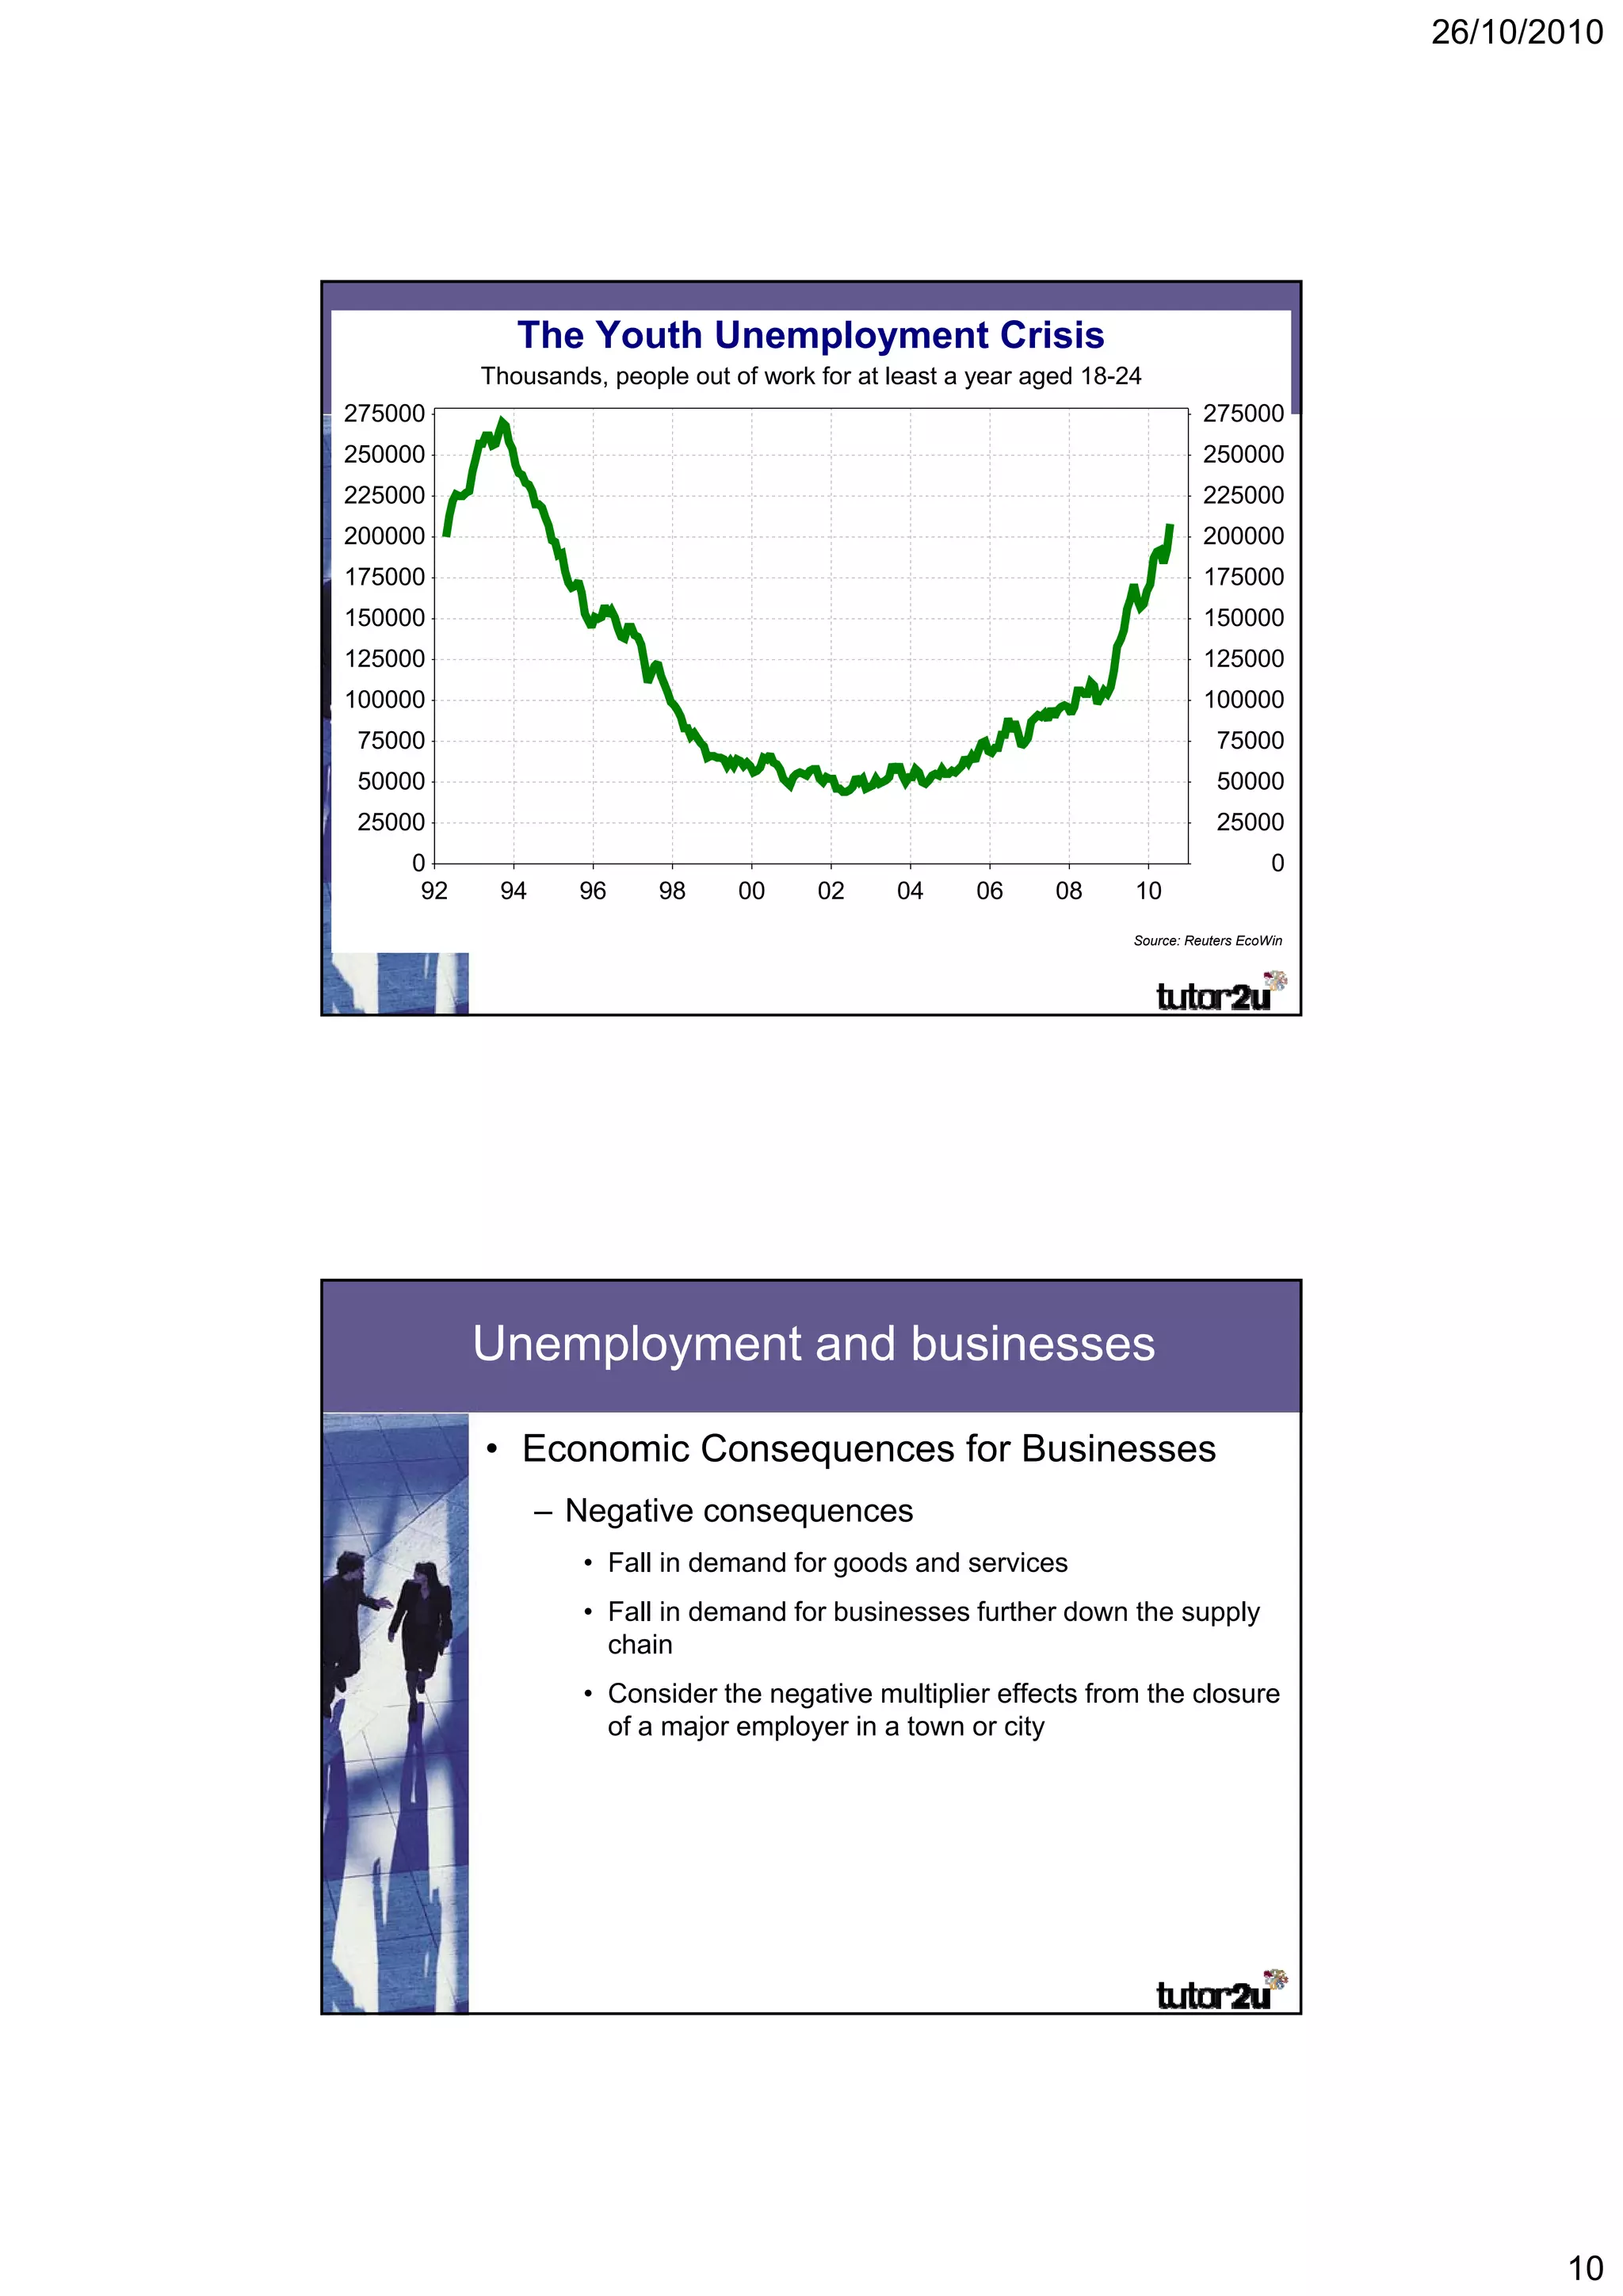
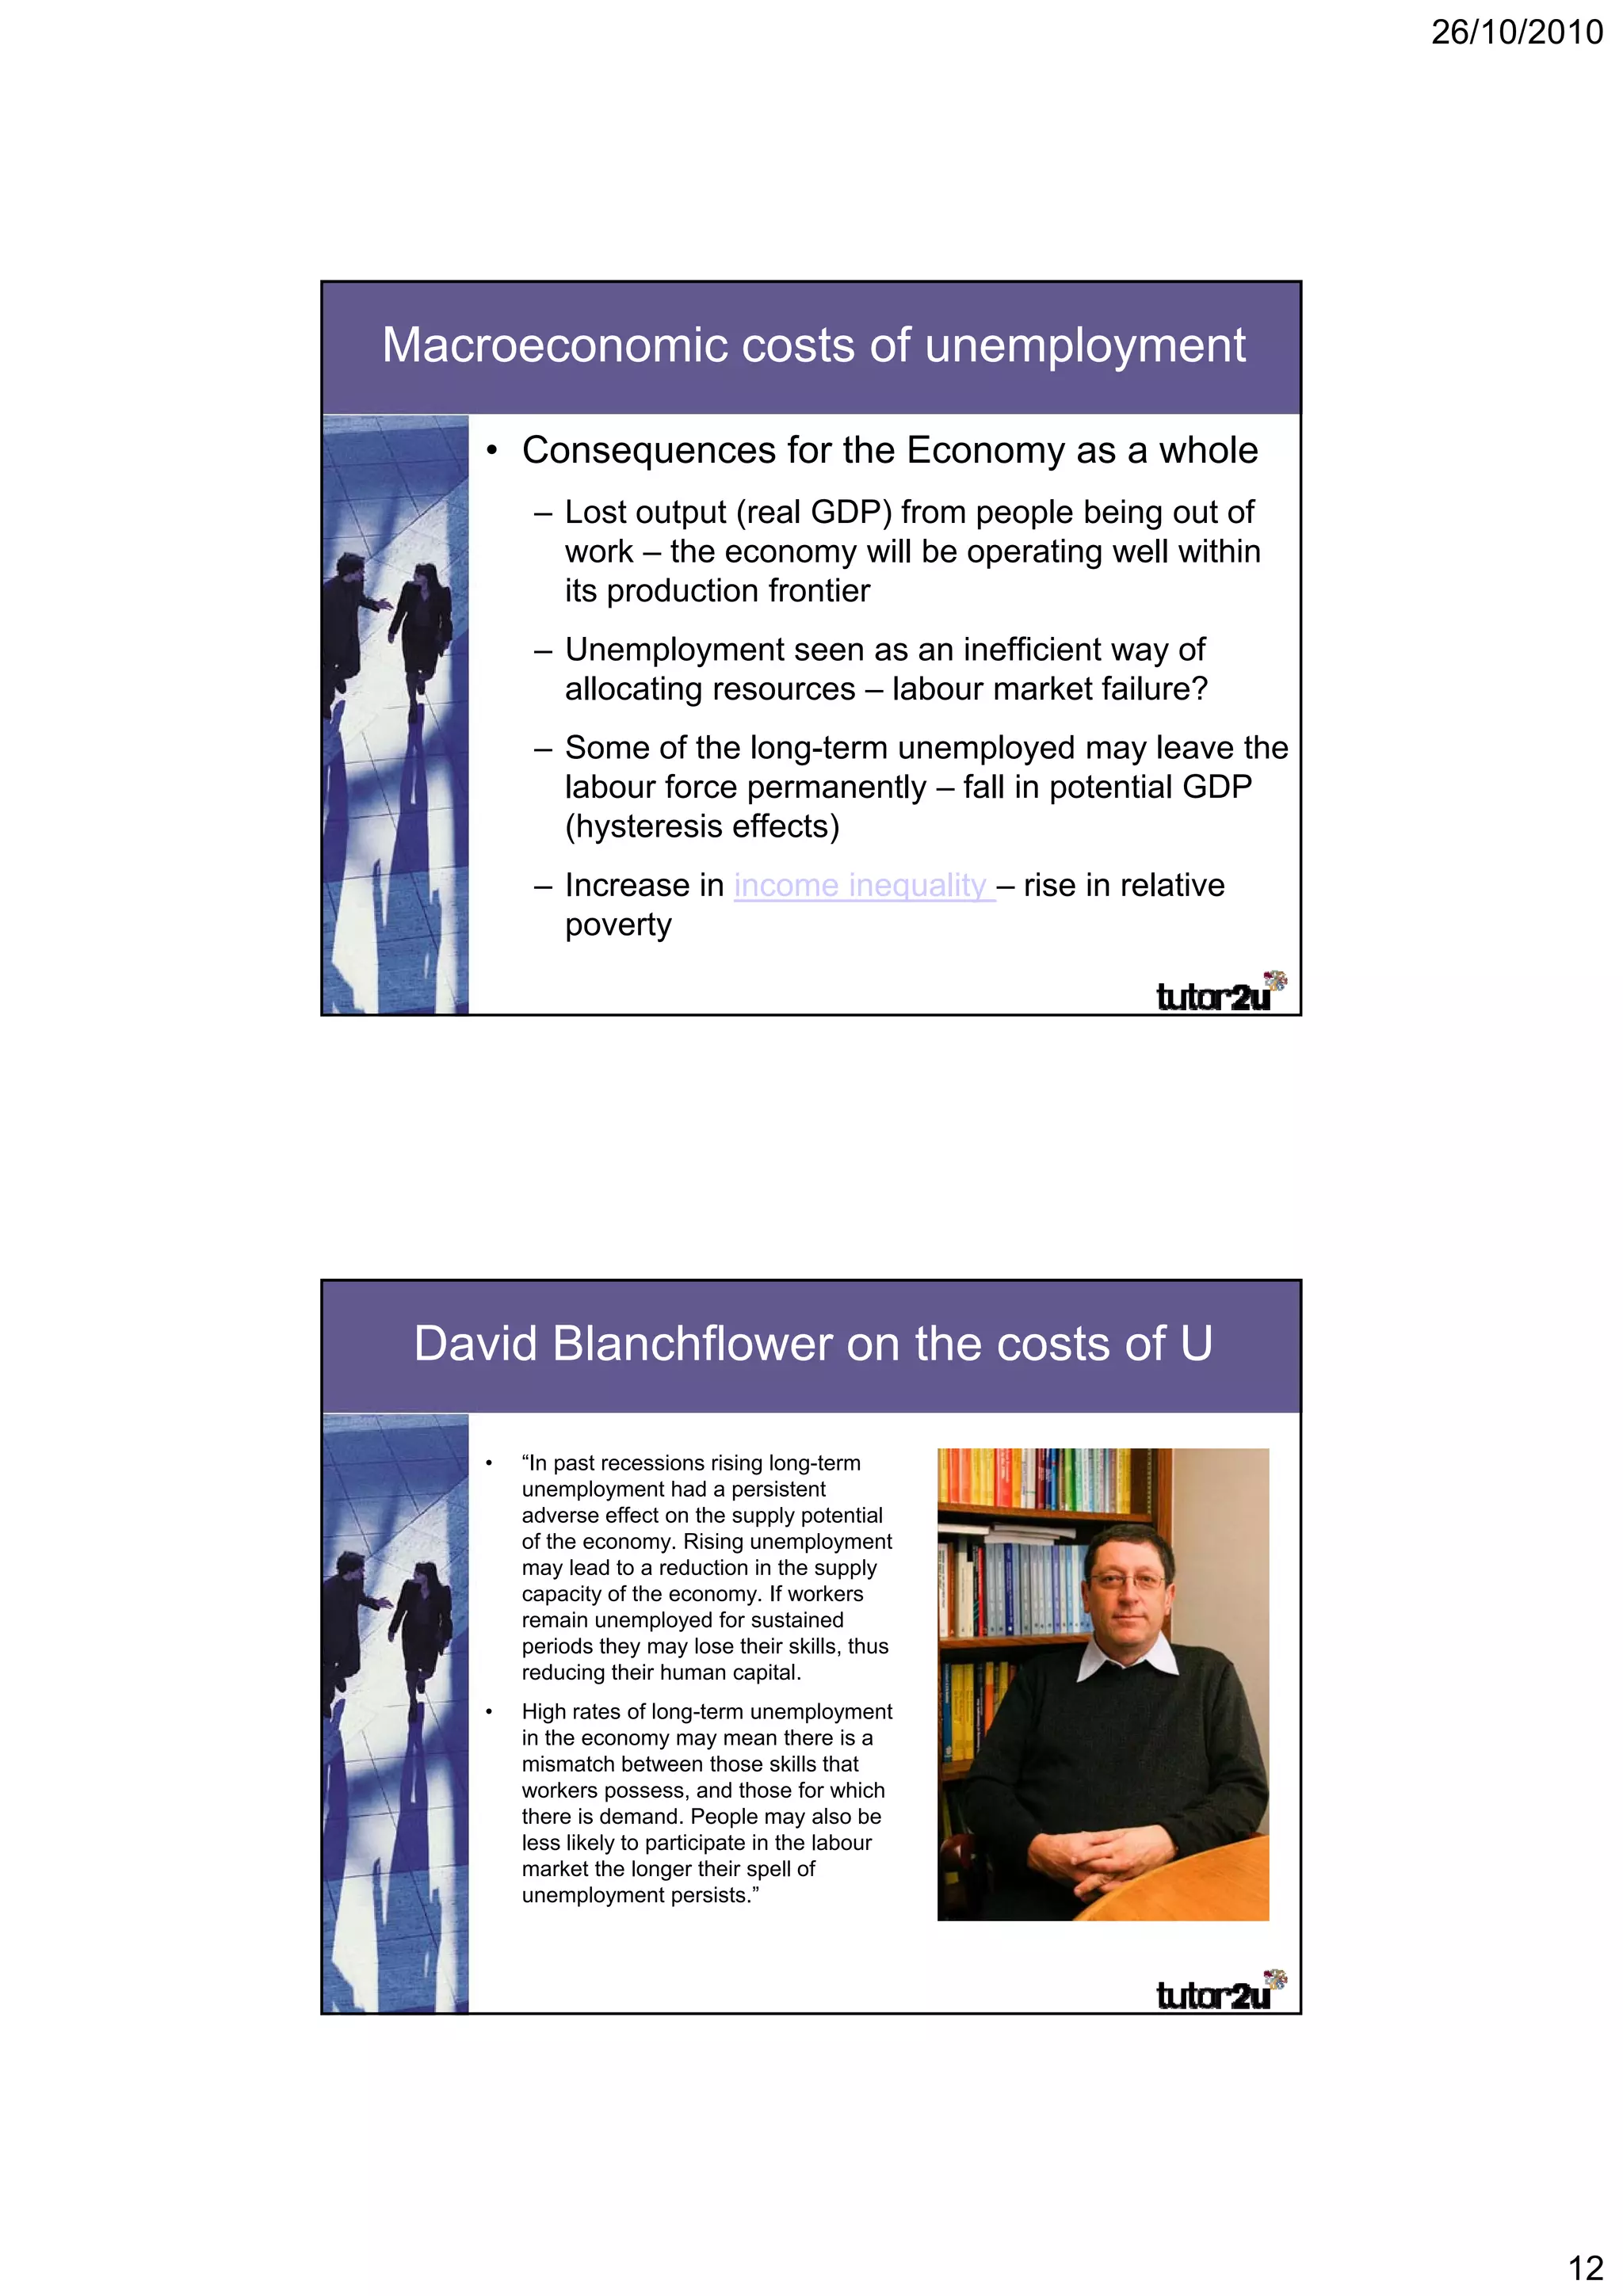
3) Unemployment imposes economic and social costs, including lost output and increased poverty and health issues. It also negatively impacts businesses and increases government spending.


![09 2 46 Lavoro%20 Part%20 Time[1]](https://cdn.slidesharecdn.com/ss_thumbnails/09246lavoro20part20time1-1232395718683832-2-thumbnail.jpg?width=640&height=640&fit=bounds)


