Download to read offline


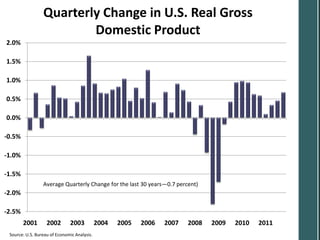


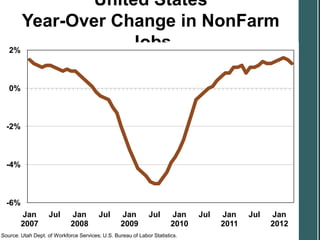


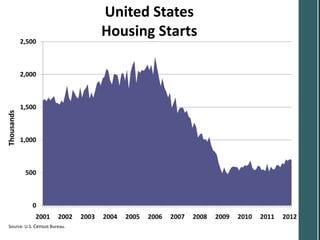


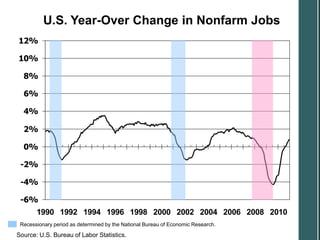


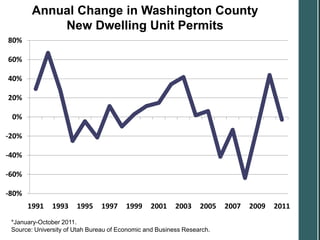

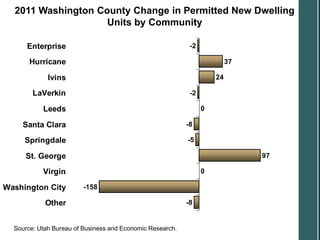


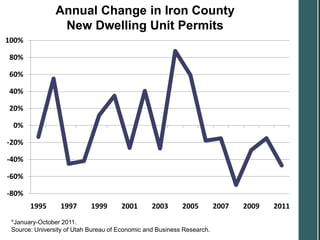
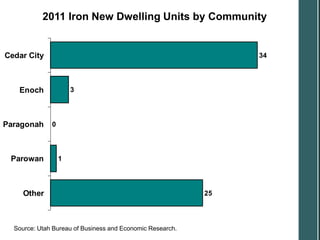


The document presents conflicting economic data from various sources on the state of the US economy. It shows data that indicates rising GDP, jobs, manufacturing and retail sales alongside data pointing to high unemployment, falling housing starts and declining economic indexes. The intent is to show that different economic indicators can suggest contradictory things, similar to blind men describing different parts of an elephant. It urges readers to consider long term trends rather than single monthly data points when evaluating the economy.


