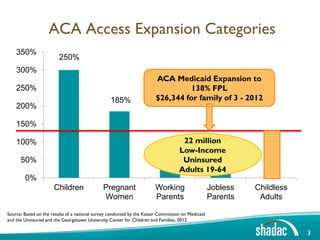
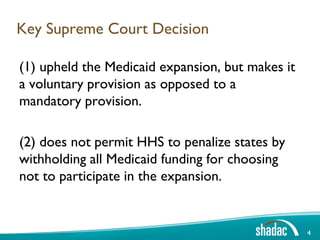
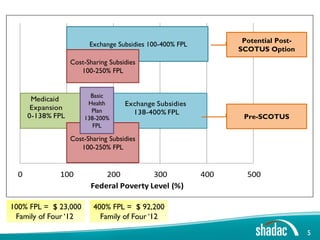
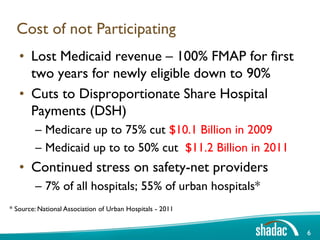
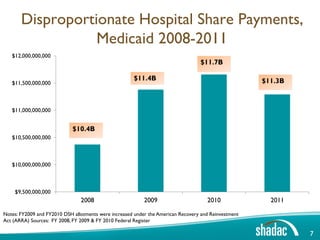
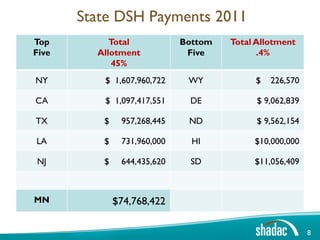
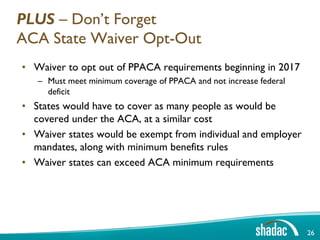
(1) The document discusses different scenarios states may face in their health insurance markets following the Supreme Court decision on the Affordable Care Act.
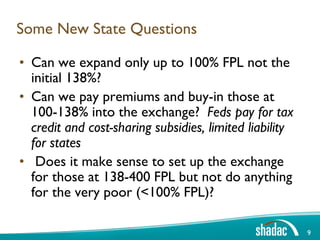
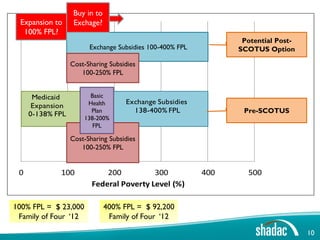
(2) It outlines options for states like expanding Medicaid only to 100% FPL instead of 138% or buying low-income residents into the insurance exchange.
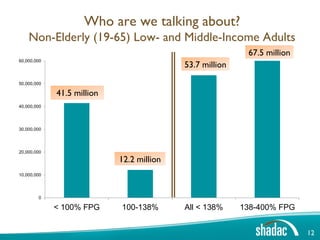
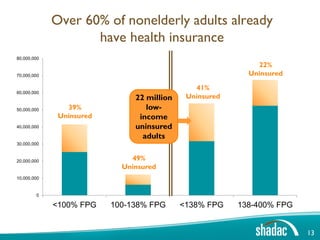
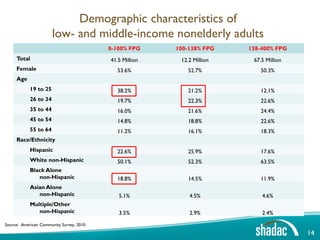
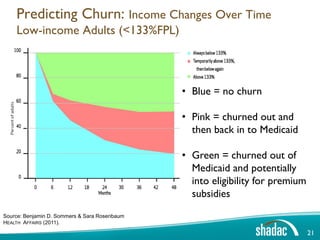
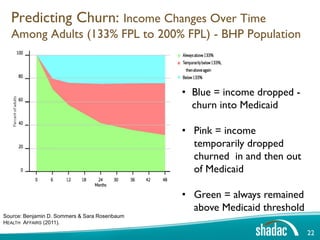
(3) The document provides data on who would be affected by different state choices, including demographic characteristics and estimates of churn between Medicaid and subsidized exchange plans.