Download as PDF, PPTX


![There is a growing need for machine
learning
Sources:
[1] “What is Big Data,” IBM,
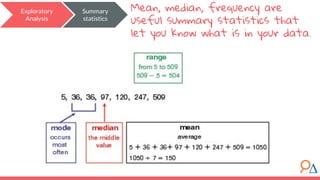
● There are huge amounts of data generated
every day.
● Previously impossible problems are now
solvable.
● Companies are increasingly demanding
quantitative solutions.
“Every day, we create 2.5 quintillion bytes of data
— so much that 90% of the data in the world today
has been created in the last two years alone.” [1]](https://image.slidesharecdn.com/module1introductiontomachinelearning4-190707185926/85/Module-1-introduction-to-machine-learning-10-320.jpg)


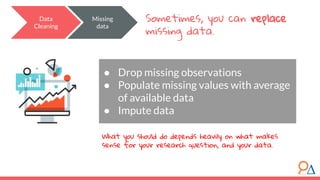
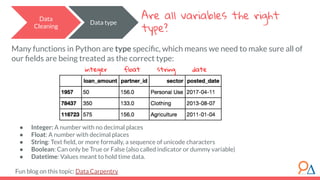

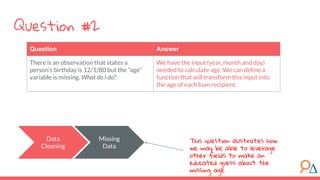


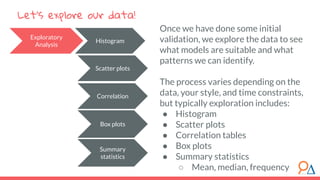

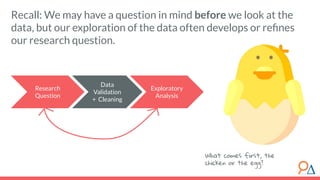
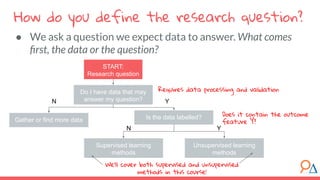


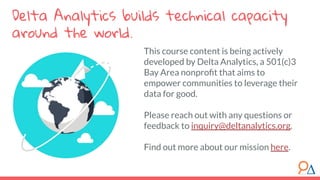
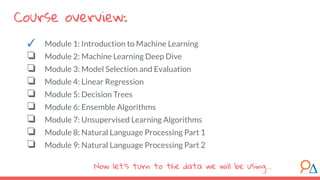
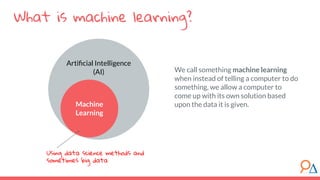
This document outlines a machine learning course developed by Delta Analytics, covering various modules such as model selection, evaluation, and algorithms. It emphasizes the importance of clearly defining research questions and conducting thorough data cleaning and exploratory analysis to prepare for machine learning tasks. The course aims to empower communities by enabling them to leverage data effectively for positive outcomes.


![Dimension reduction techniques[Feature Selection]](https://cdn.slidesharecdn.com/ss_thumbnails/dimensionreductiontechnibyaakankshajain-210625102243-thumbnail.jpg?width=640&height=640&fit=bounds)


![Big Data [sorry] & Data Science: What Does a Data Scientist Do?](https://cdn.slidesharecdn.com/ss_thumbnails/dslatcloudmsevent20130125-130126065651-phpapp01-thumbnail.jpg?width=640&height=640&fit=bounds)


![Getting Started with Apache Spark: Big Data Made Simple [Free Meetup]](https://cdn.slidesharecdn.com/ss_thumbnails/apachesparkgettingstarted-260203175547-8361bcc3-thumbnail.jpg?width=640&height=640&fit=bounds)


