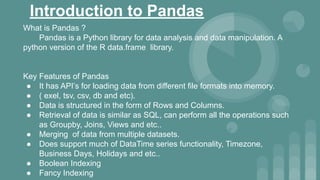
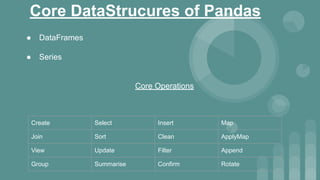
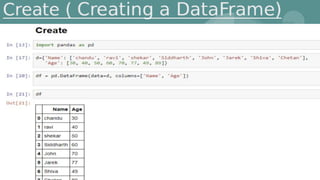
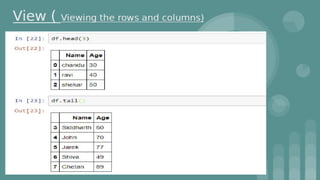
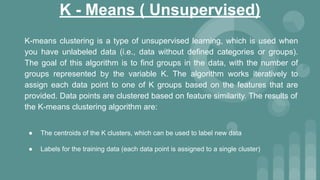
Download as PDF, PPTX
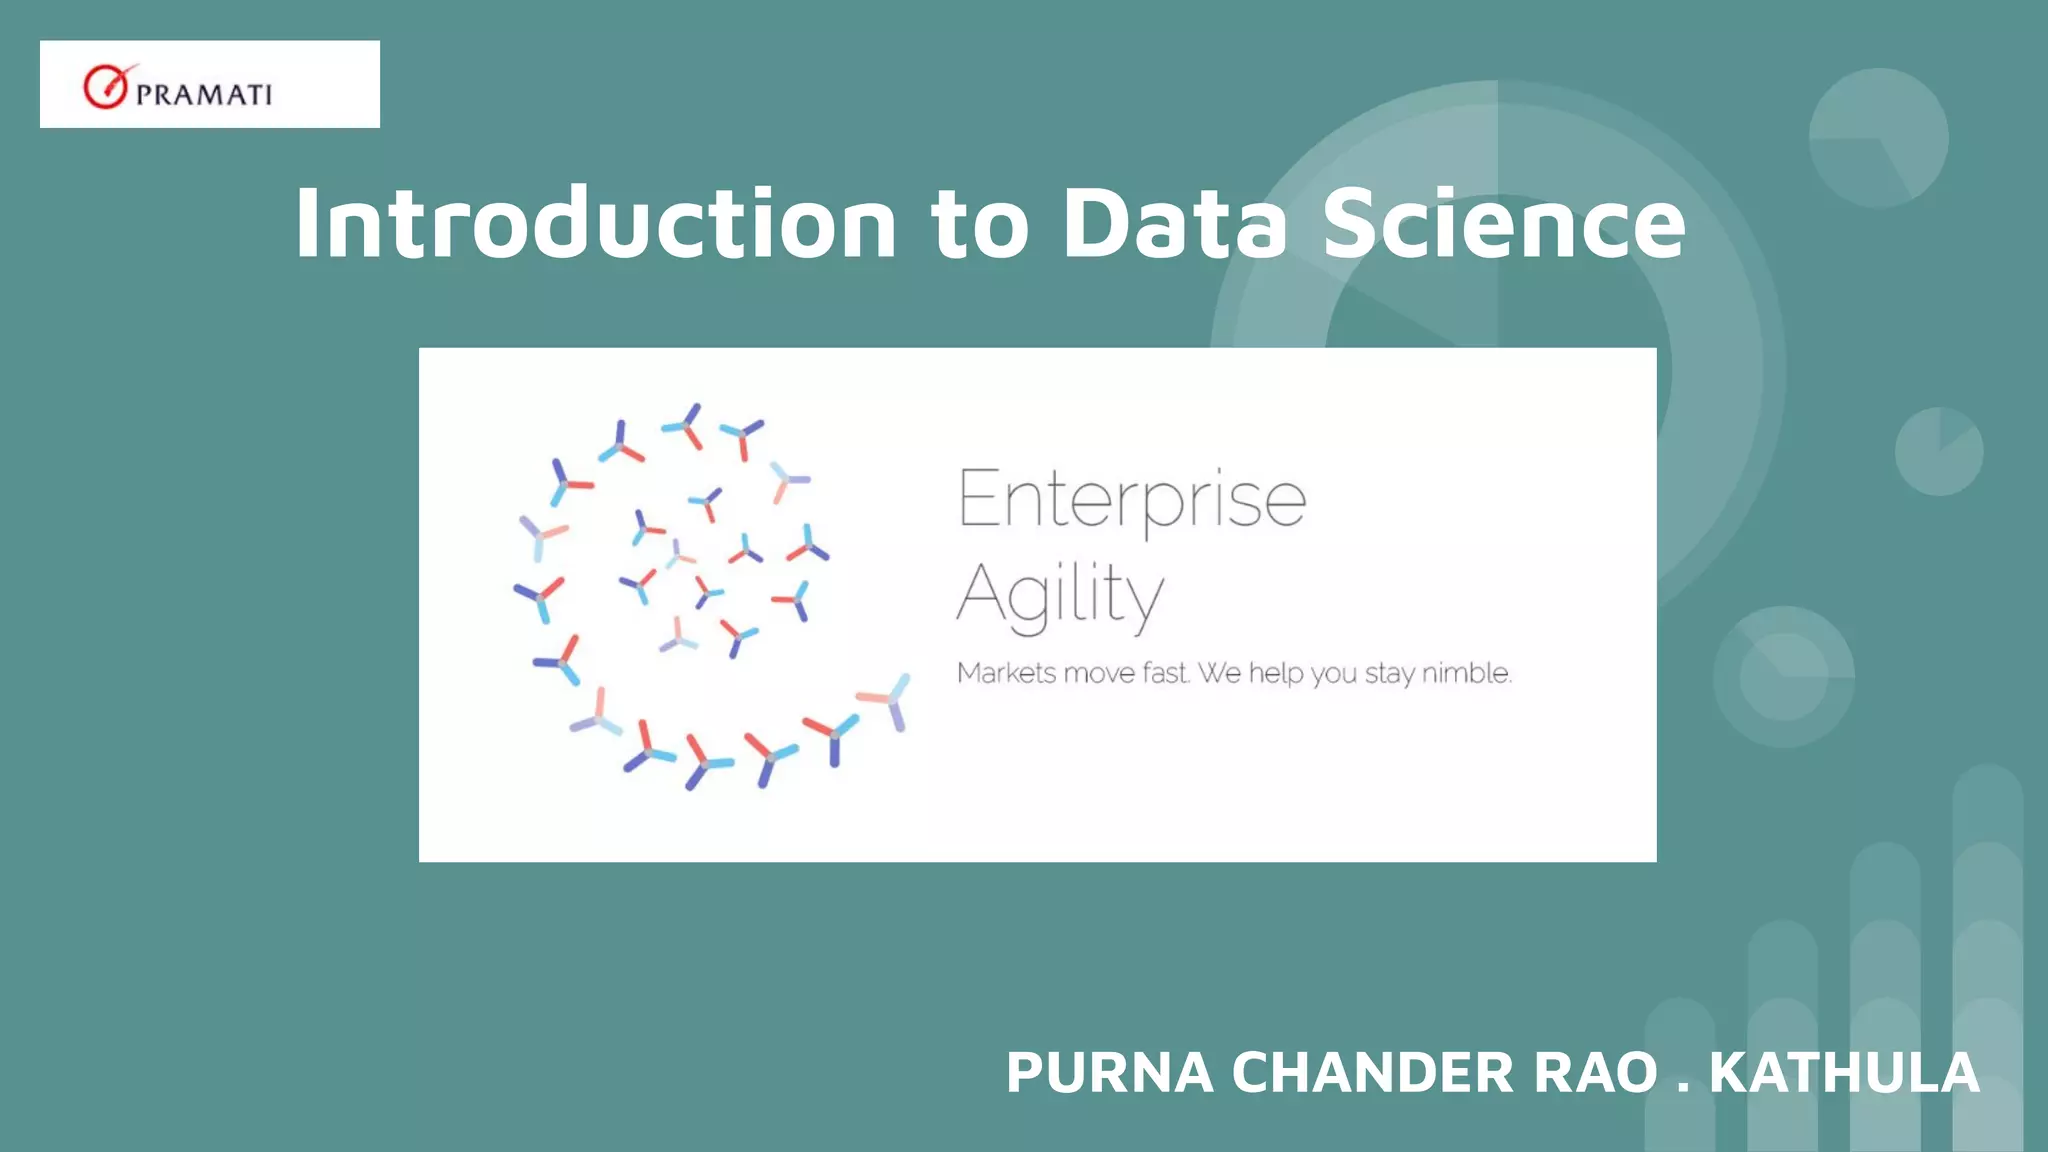
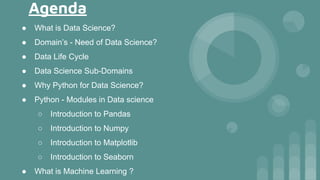
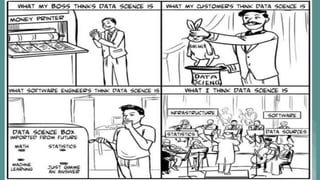
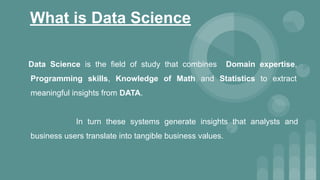
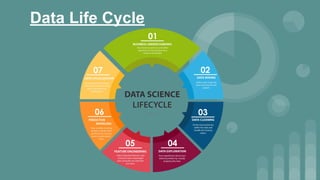
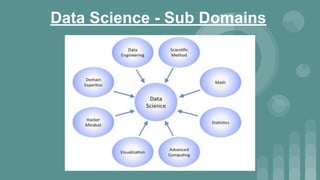

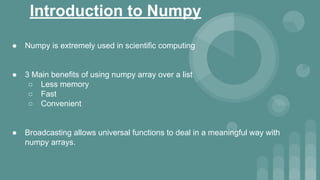
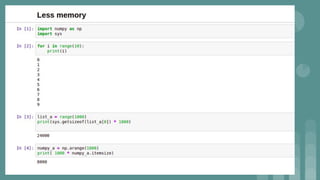
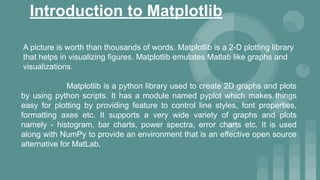
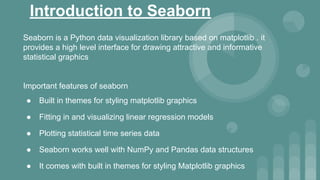

This document provides an introduction to data science. It discusses what data science is, the data life cycle, key domains that benefit from data science and why Python is well-suited for data science. It also summarizes several important Python libraries for data science - Pandas for data analysis, NumPy for scientific computing, Matplotlib and Seaborn for data visualization, and introduces machine learning concepts like supervised and unsupervised learning. Example algorithms like linear regression and K-means clustering are also covered.


![Big Data [sorry] & Data Science: What Does a Data Scientist Do?](https://cdn.slidesharecdn.com/ss_thumbnails/dslatcloudmsevent20130125-130126065651-phpapp01-thumbnail.jpg?width=640&height=640&fit=bounds)


![python libray for data analytics seaborn[1].pptx](https://cdn.slidesharecdn.com/ss_thumbnails/pythonseaborn1-241222125910-e118d8f2-thumbnail.jpg?width=640&height=640&fit=bounds)


![2Essential-Python-Libraries-for-Data-Analytics[1].pdf](https://cdn.slidesharecdn.com/ss_thumbnails/2essential-python-libraries-for-data-analytics1-250722104424-d73307c5-thumbnail.jpg?width=640&height=640&fit=bounds)