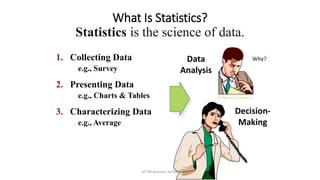
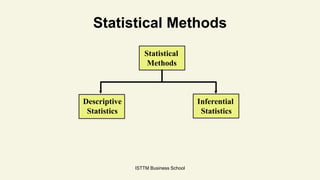
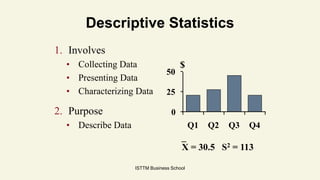
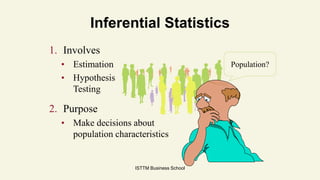
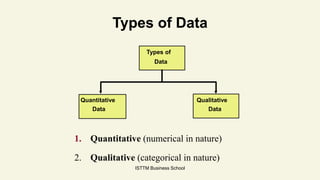
Role of statistics in data science
Group 5
Sec: B
ISTTM Business School
What Is Statistics?
Statistics is the science of data.
Why?1. Collecting Data
e.g., Survey
2. Presenting Data
e.g., Charts & Tables
3. Characterizing Data
e.g., Average
Data
Analysis
Decision-
Making
© 1984-1994 T/Maker Co.
Importance of statistics
• Statistics has important role in determining the existing position of
per capita income, unemployment, population growth rate, housing,
schooling medical facilities etc…in a country.
• Now statistics holds a central position in almost every field like
Industry, Commerce, Trade, Physics, Chemistry, Economics,
Mathematics, Biology, Botany, Psychology, Astronomy, Information
Technology etc…, so application of statistics is very wide.
ISTTM Business School
Statistical Methods
Statistical
Methods
Descriptive
Statistics
Inferential
Statistics
ISTTM Business School
Descriptive Statistics
1. Involves
• Collecting Data
• Presenting Data
• Characterizing Data
2. Purpose
• Describe Data
X = 30.5 S2 = 113
0
25
50
Q1 Q2 Q3 Q4
$
ISTTM Business School
1. Involves
• Estimation
• Hypothesis
Testing
2. Purpose
• Make decisions about
population characteristics
Inferential Statistics
Population?
ISTTM Business School
Four Elements of Descriptive
Statistical Problems
1. The population or sample of interest
2. One or more variables (characteristics of the
population or sample units) that are to be
investigated
3. Tables, graphs, or numerical summary tools
4. Identification of patterns in the data
ISTTM Business School
Five Elements of Inferential
Statistical Problems
1. The population of interest
2. One or more variables (characteristics of the
population units) that are to be investigated
3. The sample of population units
4. The inference about the population based on
information contained in the sample
5. A measure of reliability for the inference
ISTTM Business School
Types of Data
Types of
Data
Quantitative
Data
Qualitative
Data
1. Quantitative (numerical in nature)
2. Qualitative (categorical in nature)
ISTTM Business School
Quantitative Data
Measured on a numeric
scale.
• Number of defective
items in a lot.
• Salaries of CEOs of
oil companies.
• Ages of employees at
a company.
3
52
71
4
8
943
120 12
21
ISTTM Business School
Qualitative Data
Classified into categories.
• College major of each
student in a class.
• Gender of each employee
at a company.
• Method of payment
(cash, check, credit card).
$ Credit
Statistics also played a key role
helping to answer questions like:
• Does fertilizer increase crop yields?
• Does Streptomycin cure Tuberculosis?
• Does smoking cause lung-cancer?:
• Who will win the election?
ISTTM Business School
Supervised vs Unsupervised learning
• Supervised: Both inputs (features) and outputs (labels) in training set
• Unsupervised: No output values available, just inputs.
ISTTM Business School
Chaining Tools for Data Science
Data
Preparation
Exploratory
Analysis
Inference /
Prediction
Solution
Implementation
Results
Communication
ExcelHadoop
RDBMS
/ SQL
PythonExcel
R
Python
Custom
Code
R
• Use the right toolset in different stages

Statistics and data science

  • 1.
    Role of statisticsin data science Group 5 Sec: B ISTTM Business School
  • 2.
    ISTTM Business School WhatIs Statistics? Statistics is the science of data. Why?1. Collecting Data e.g., Survey 2. Presenting Data e.g., Charts & Tables 3. Characterizing Data e.g., Average Data Analysis Decision- Making © 1984-1994 T/Maker Co. © 1984-1994 T/Maker Co.
  • 3.
    Importance of statistics •Statistics has important role in determining the existing position of per capita income, unemployment, population growth rate, housing, schooling medical facilities etc…in a country. • Now statistics holds a central position in almost every field like Industry, Commerce, Trade, Physics, Chemistry, Economics, Mathematics, Biology, Botany, Psychology, Astronomy, Information Technology etc…, so application of statistics is very wide. ISTTM Business School
  • 4.
    ISTTM Business School StatisticalMethods Statistical Methods Descriptive Statistics Inferential Statistics
  • 5.
    ISTTM Business School DescriptiveStatistics 1. Involves • Collecting Data • Presenting Data • Characterizing Data 2. Purpose • Describe Data X = 30.5 S2 = 113 0 25 50 Q1 Q2 Q3 Q4 $
  • 6.
    ISTTM Business School 1.Involves • Estimation • Hypothesis Testing 2. Purpose • Make decisions about population characteristics Inferential Statistics Population?
  • 7.
    ISTTM Business School FourElements of Descriptive Statistical Problems 1. The population or sample of interest 2. One or more variables (characteristics of the population or sample units) that are to be investigated 3. Tables, graphs, or numerical summary tools 4. Identification of patterns in the data
  • 8.
    ISTTM Business School FiveElements of Inferential Statistical Problems 1. The population of interest 2. One or more variables (characteristics of the population units) that are to be investigated 3. The sample of population units 4. The inference about the population based on information contained in the sample 5. A measure of reliability for the inference
  • 9.
    ISTTM Business School Typesof Data Types of Data Quantitative Data Qualitative Data 1. Quantitative (numerical in nature) 2. Qualitative (categorical in nature)
  • 10.
    ISTTM Business School QuantitativeData Measured on a numeric scale. • Number of defective items in a lot. • Salaries of CEOs of oil companies. • Ages of employees at a company. 3 52 71 4 8 943 120 12 21
  • 11.
    ISTTM Business School QualitativeData Classified into categories. • College major of each student in a class. • Gender of each employee at a company. • Method of payment (cash, check, credit card). $ Credit
  • 12.
    Statistics also playeda key role helping to answer questions like: • Does fertilizer increase crop yields? • Does Streptomycin cure Tuberculosis? • Does smoking cause lung-cancer?: • Who will win the election? ISTTM Business School
  • 13.
    Supervised vs Unsupervisedlearning • Supervised: Both inputs (features) and outputs (labels) in training set • Unsupervised: No output values available, just inputs. ISTTM Business School
  • 14.
    Chaining Tools forData Science Data Preparation Exploratory Analysis Inference / Prediction Solution Implementation Results Communication ExcelHadoop RDBMS / SQL PythonExcel R Python Custom Code R • Use the right toolset in different stages