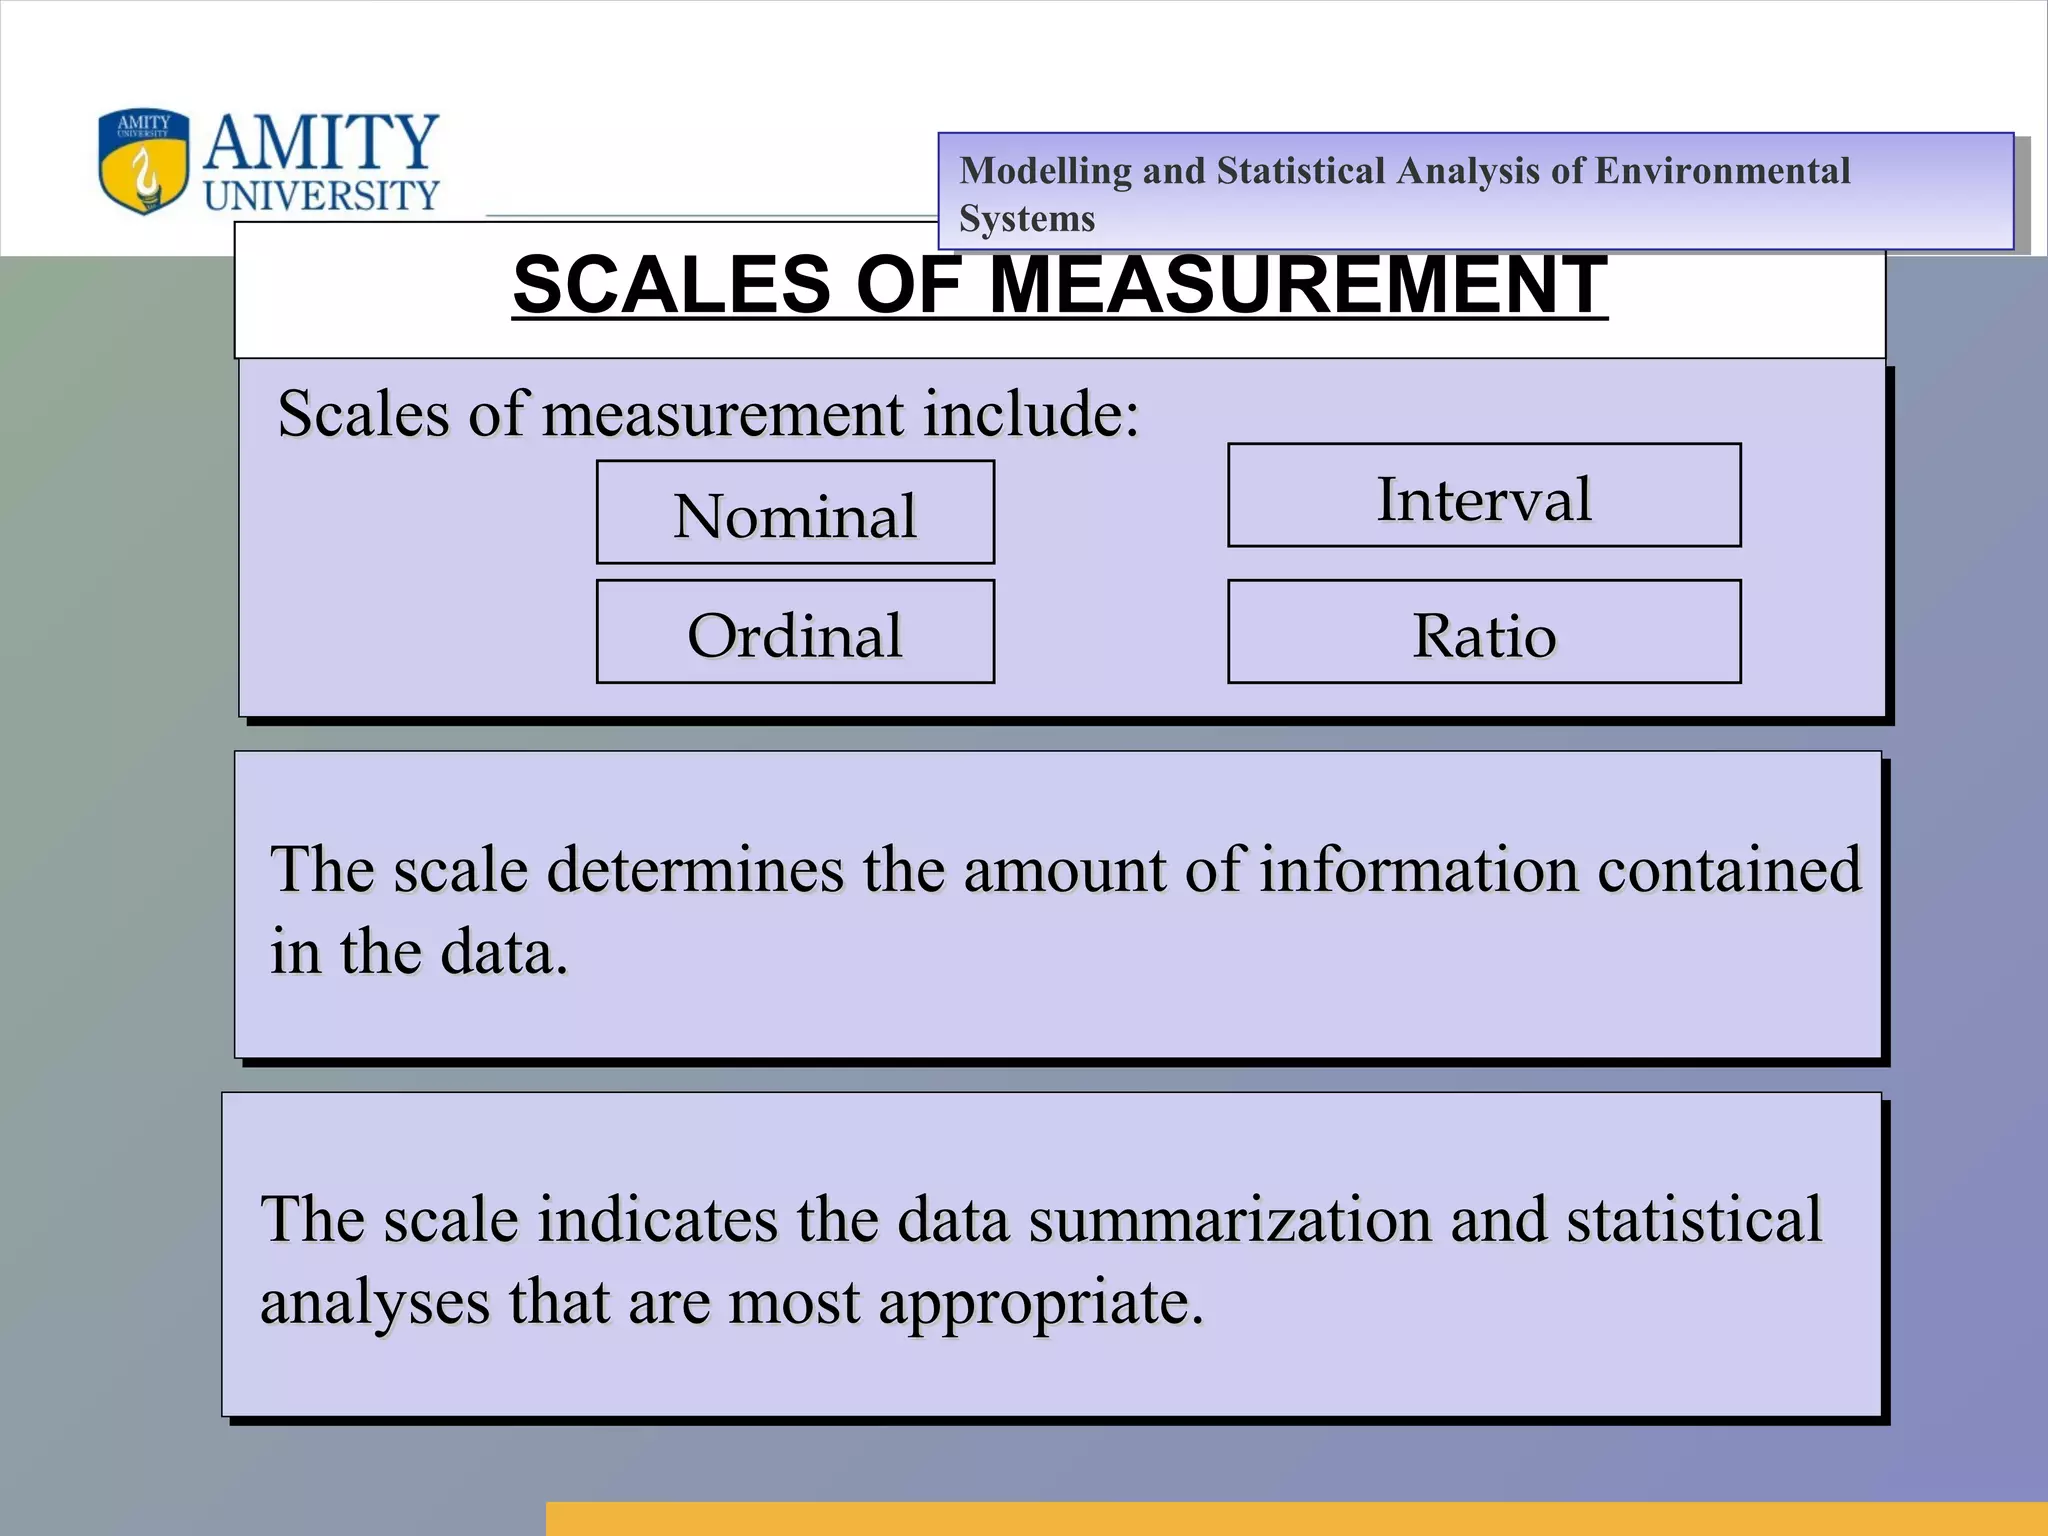
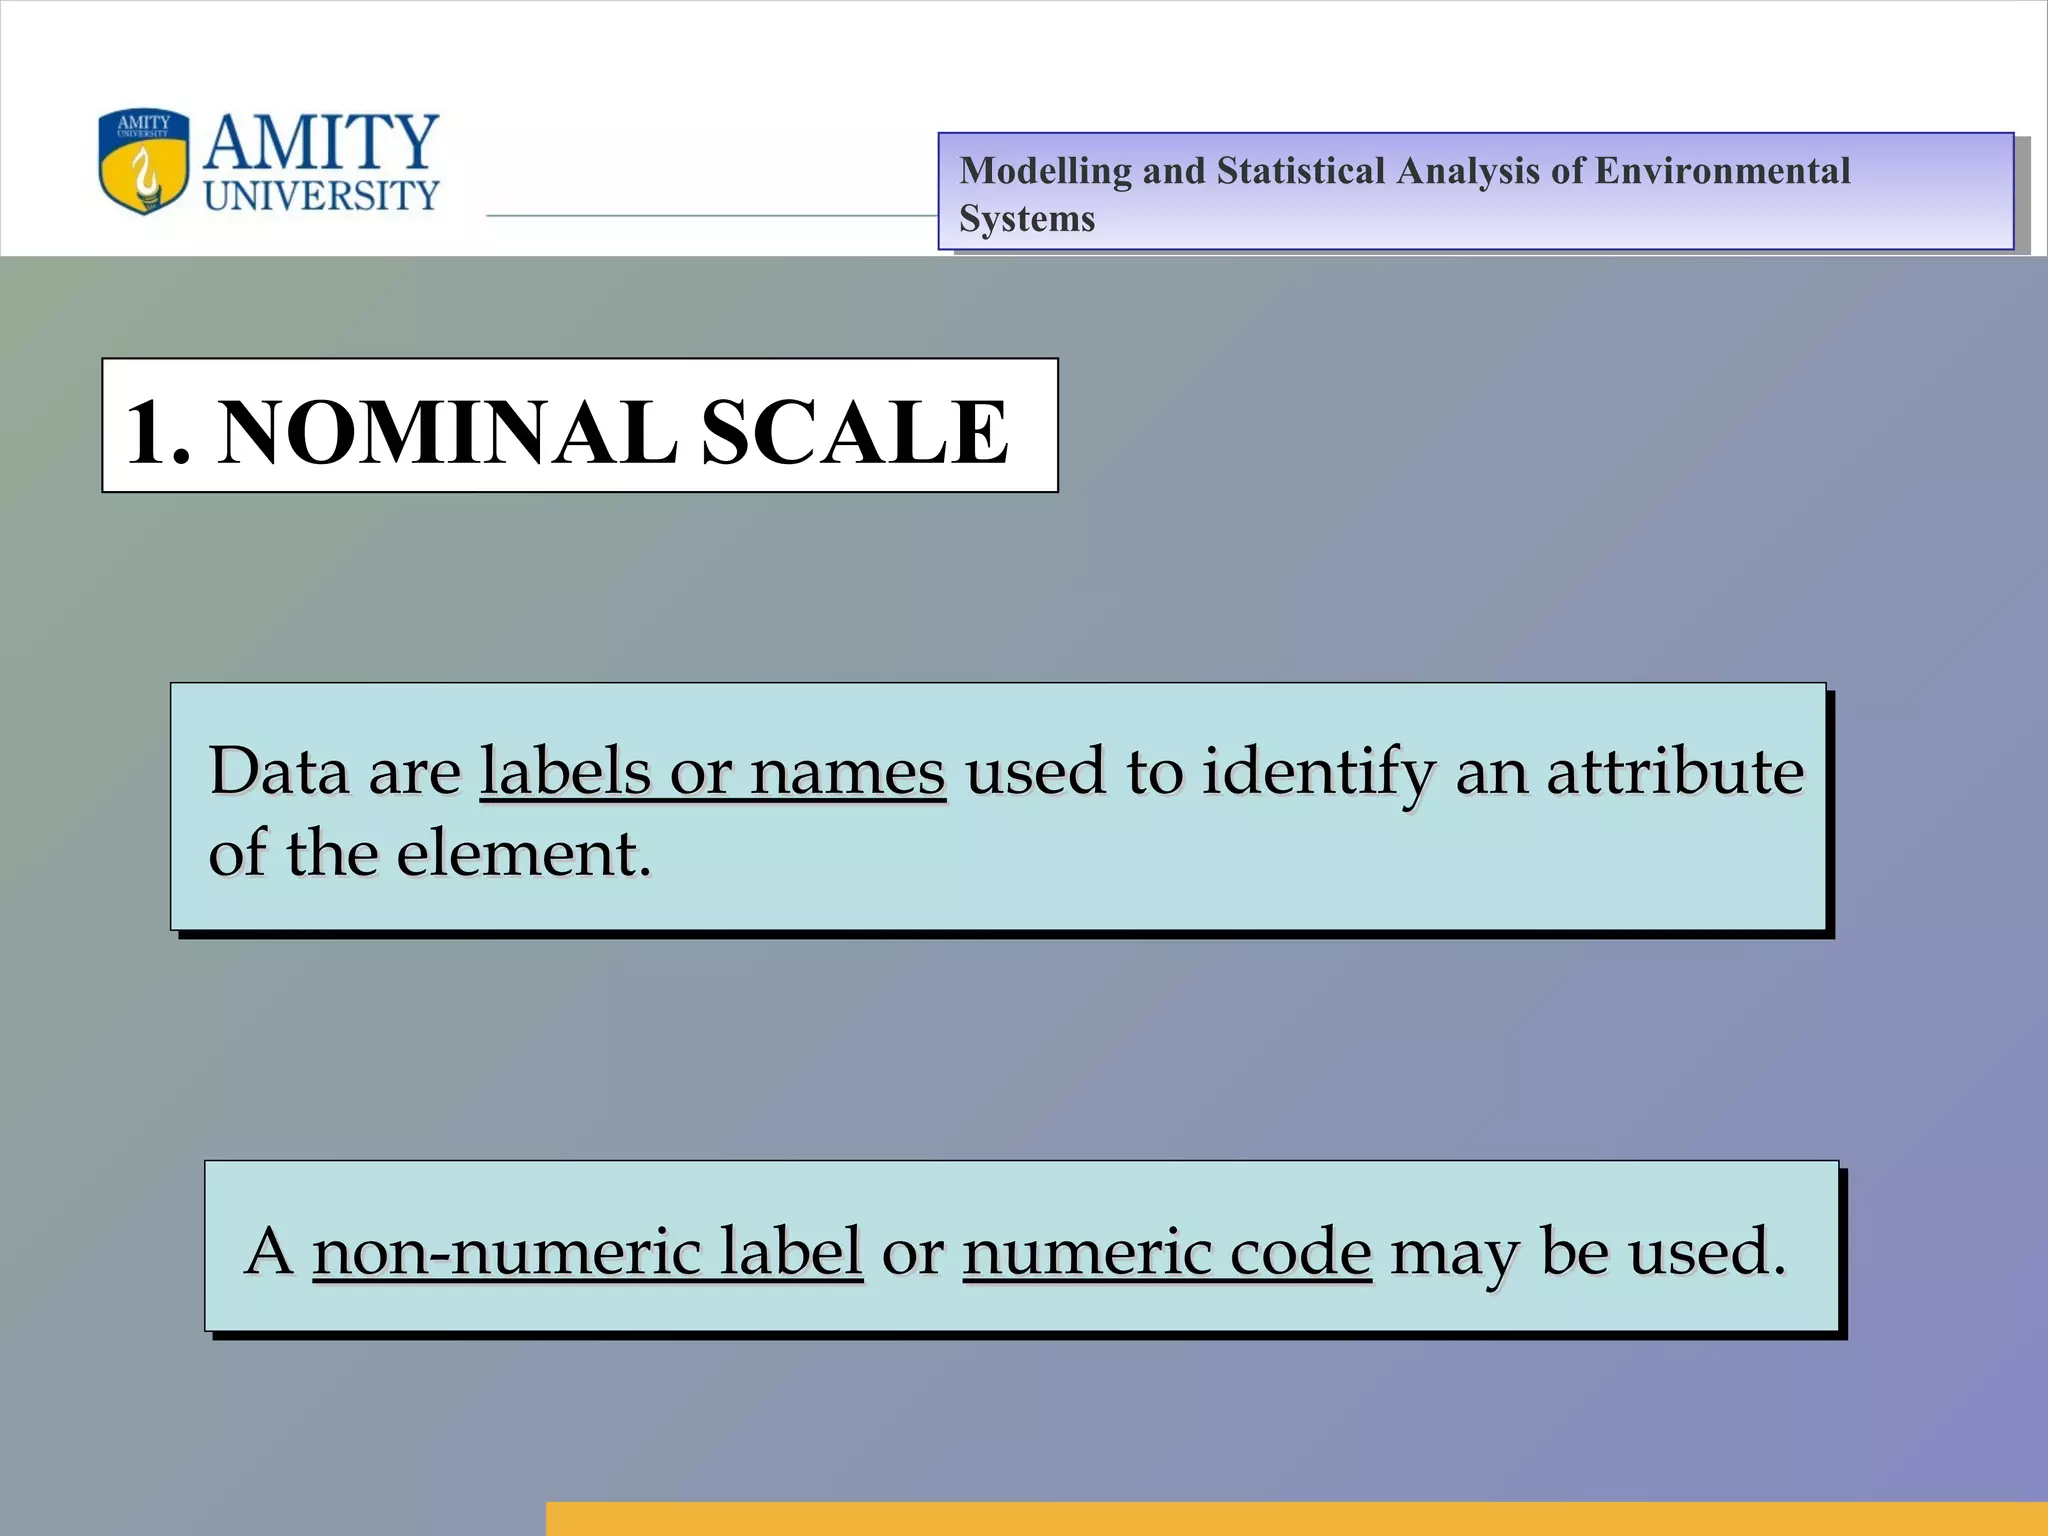
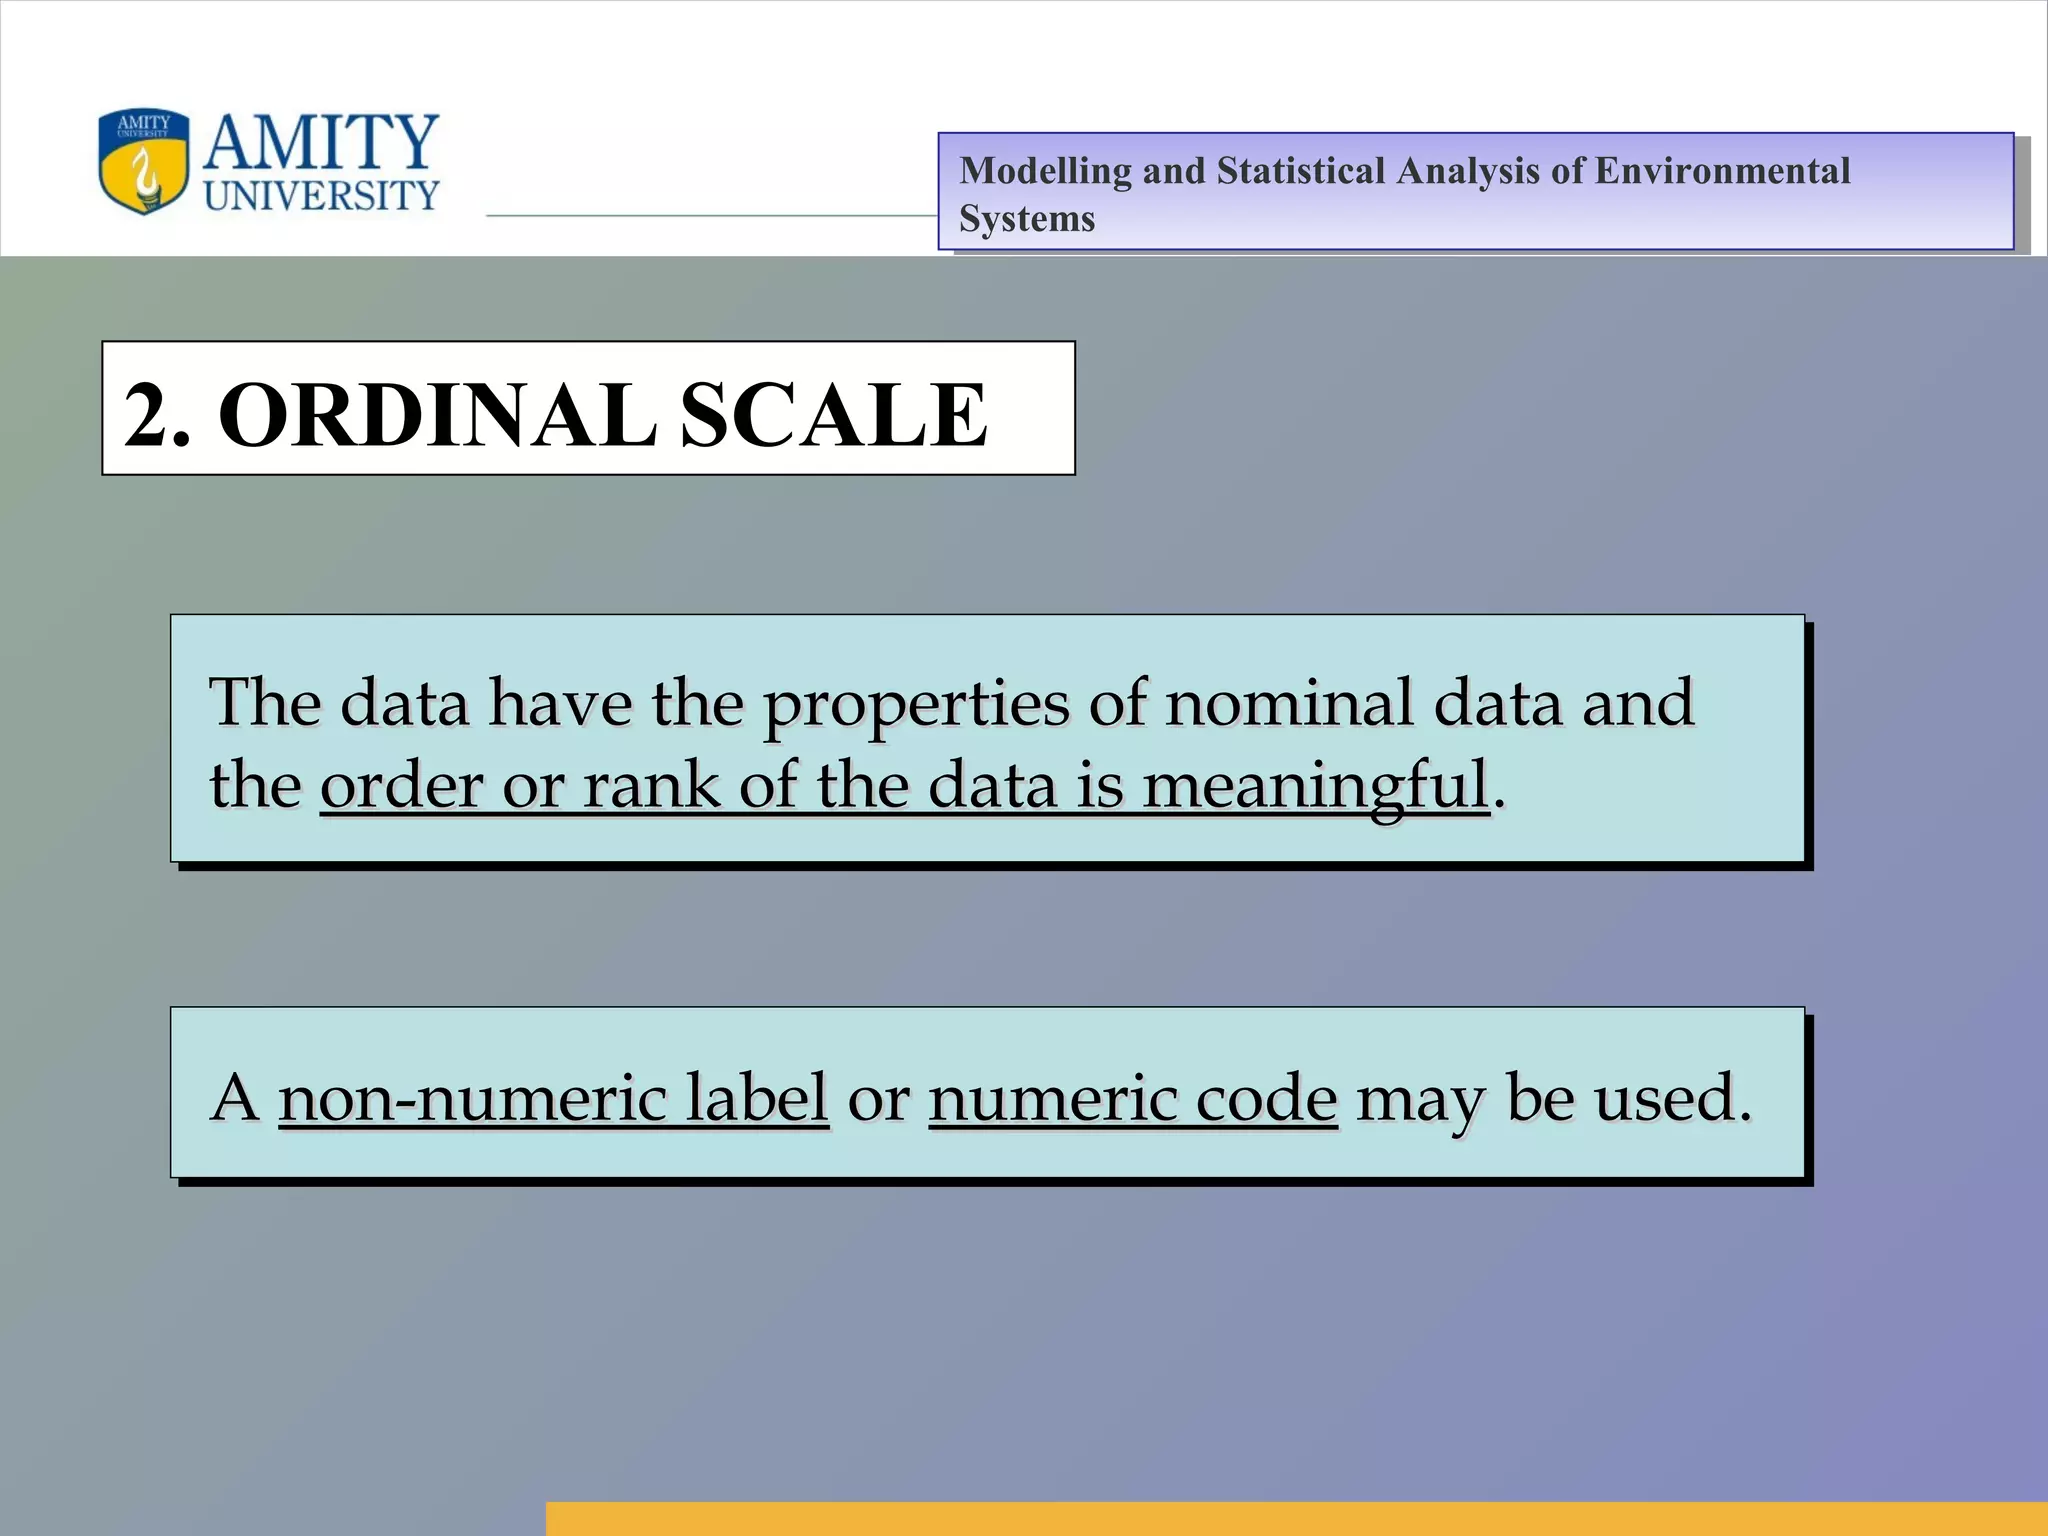
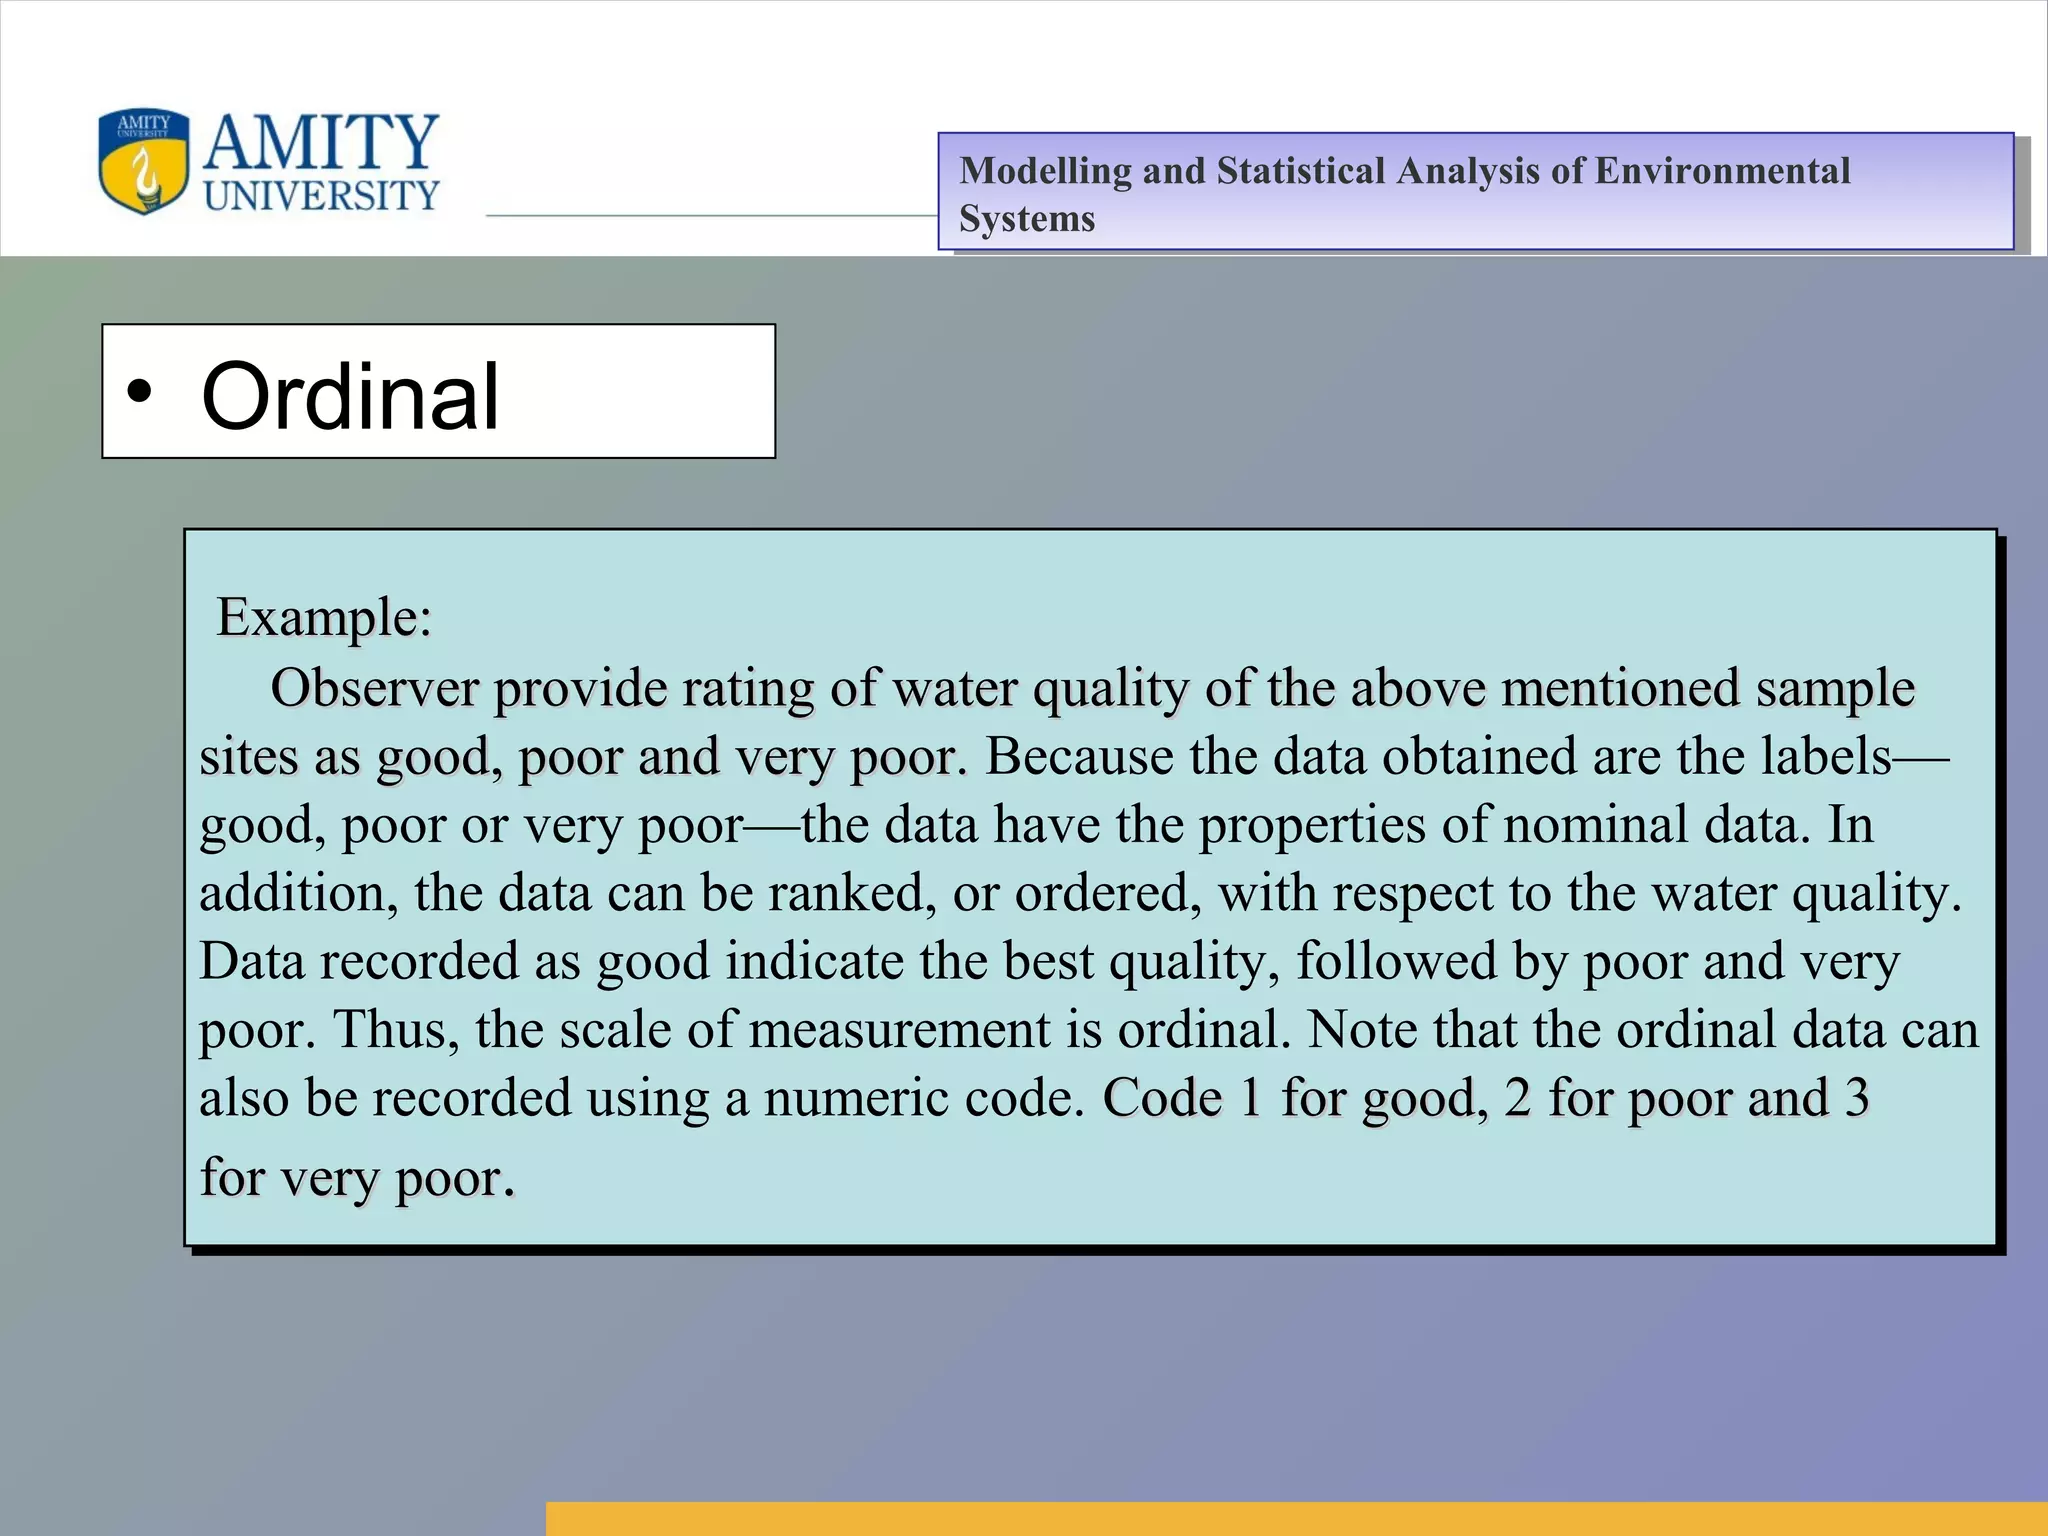
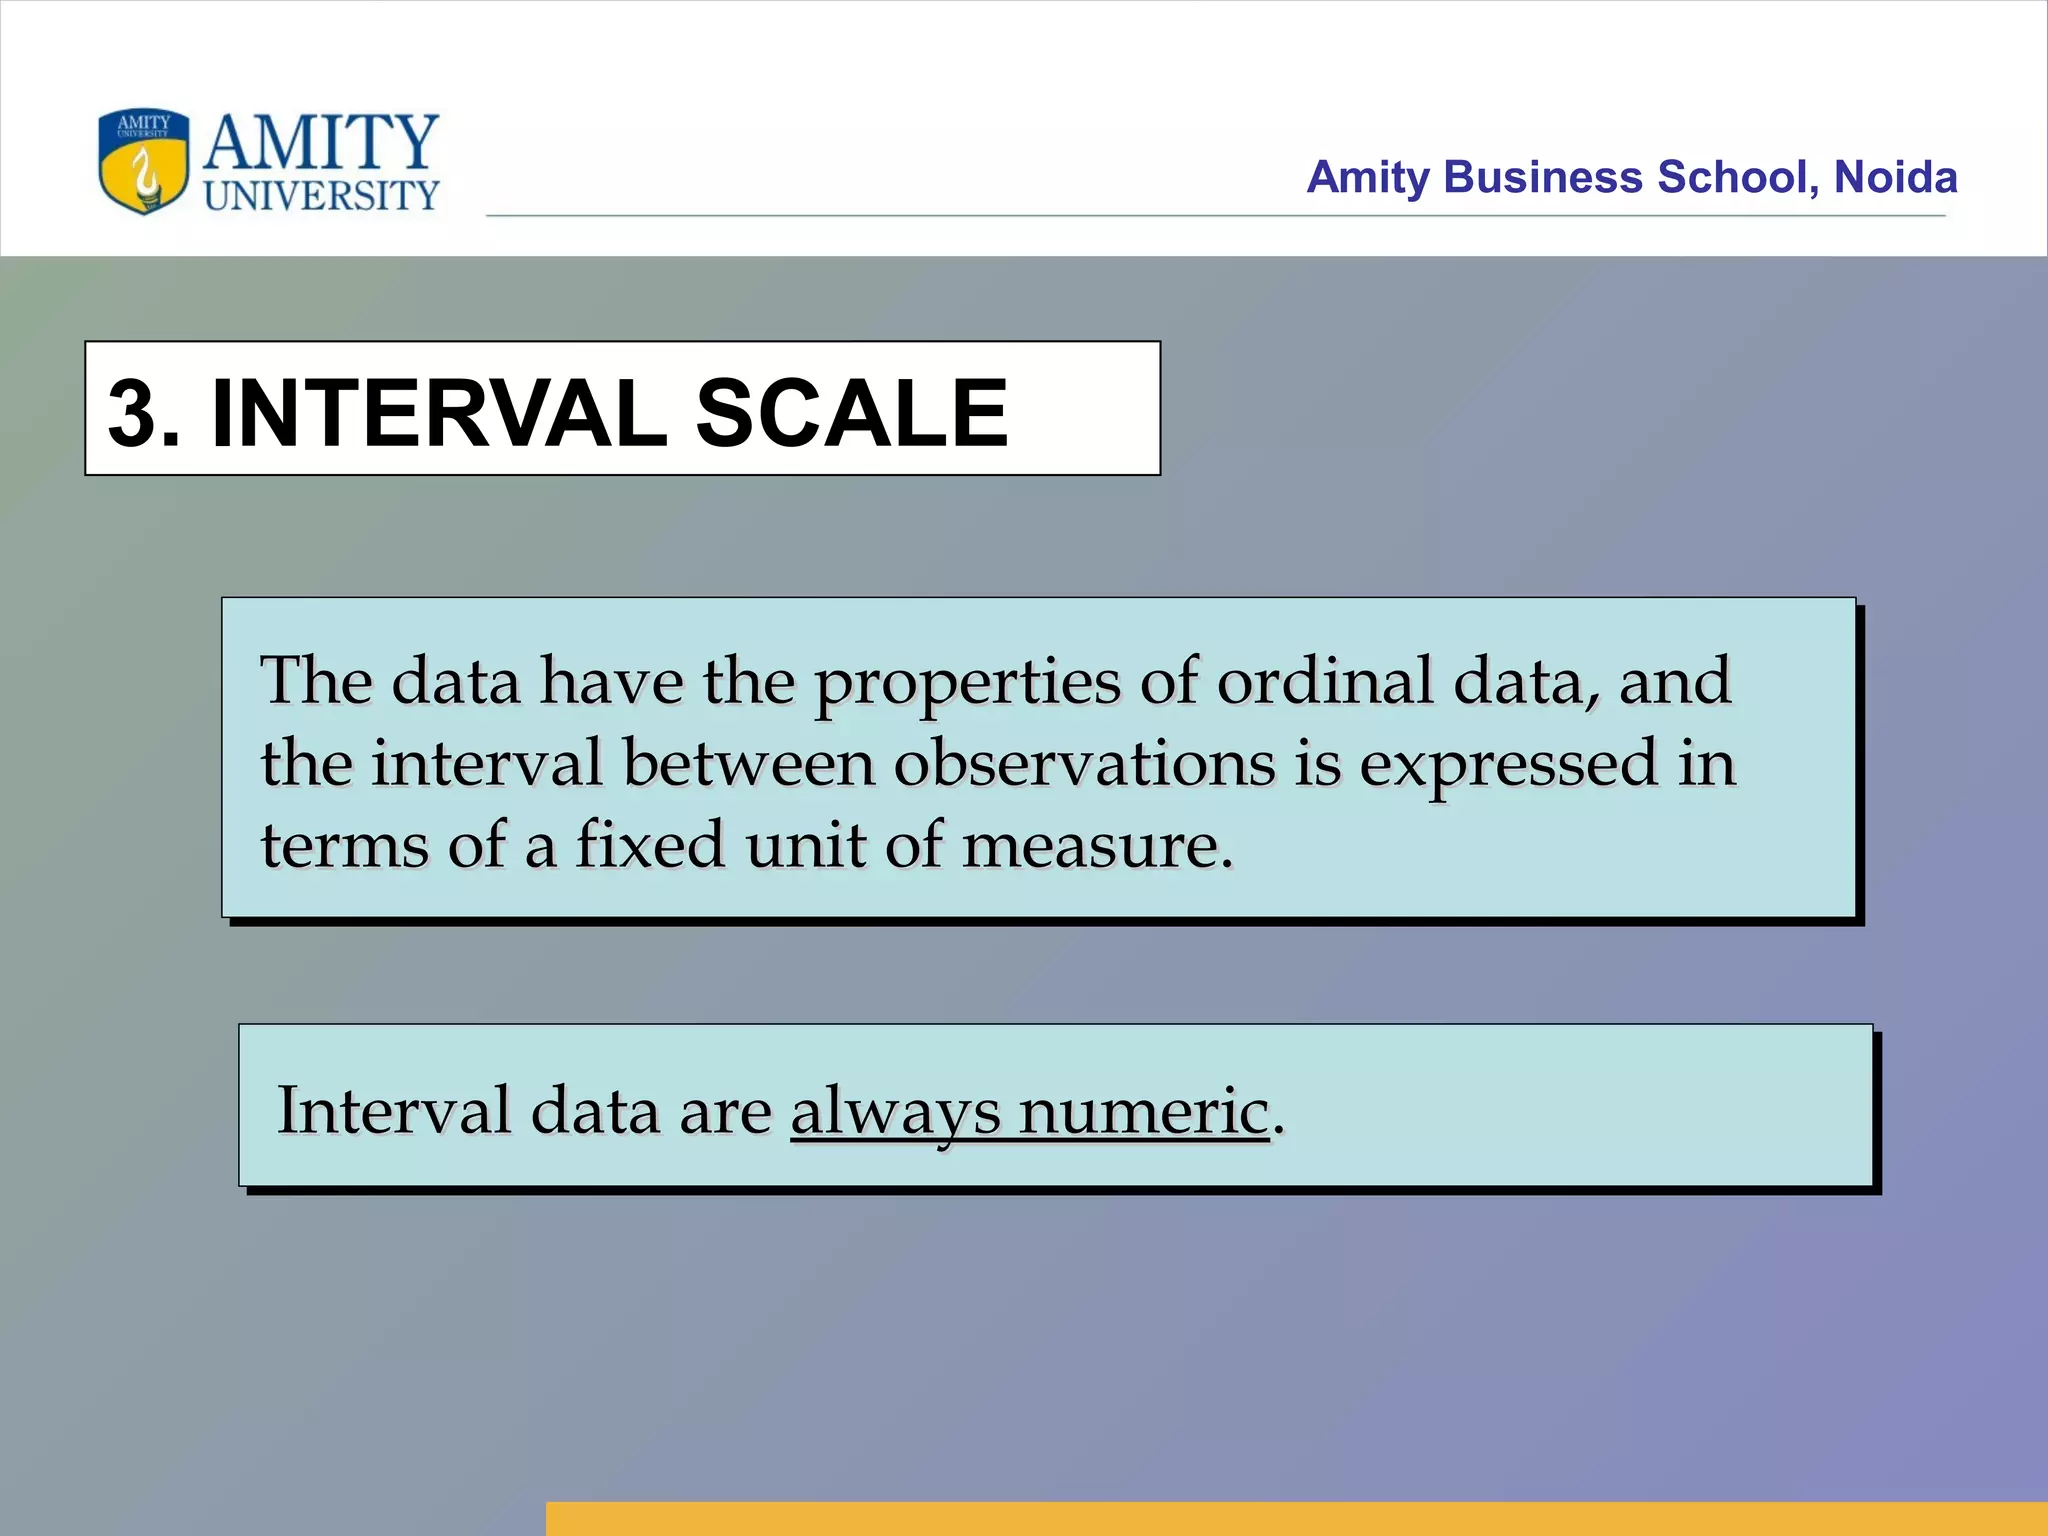
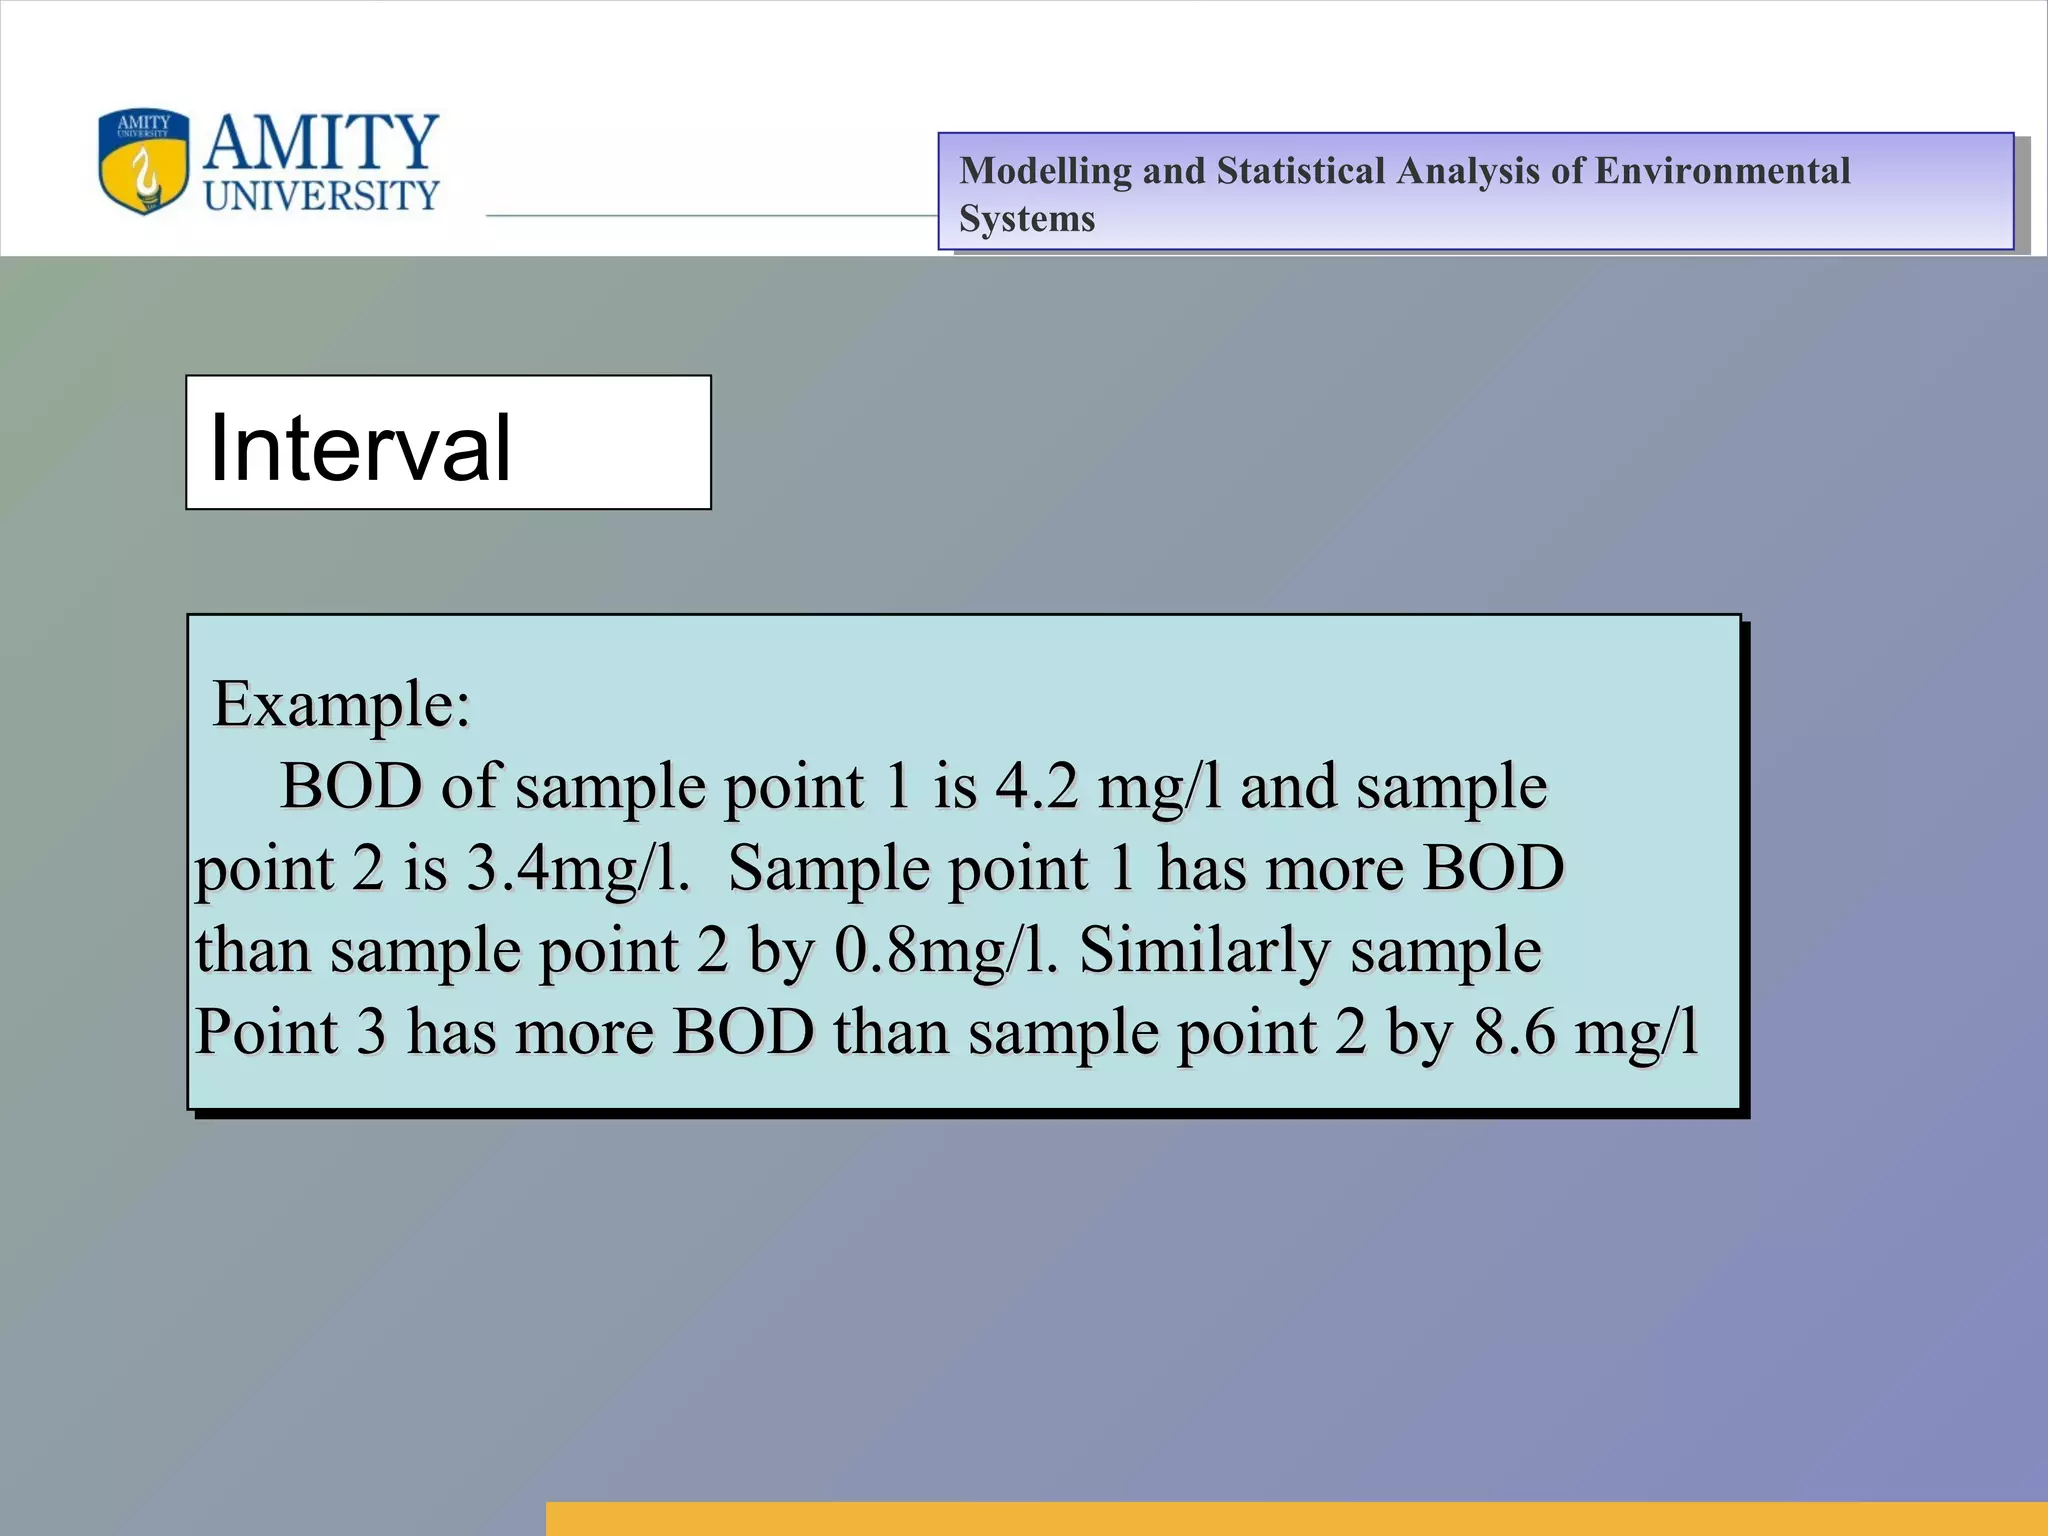
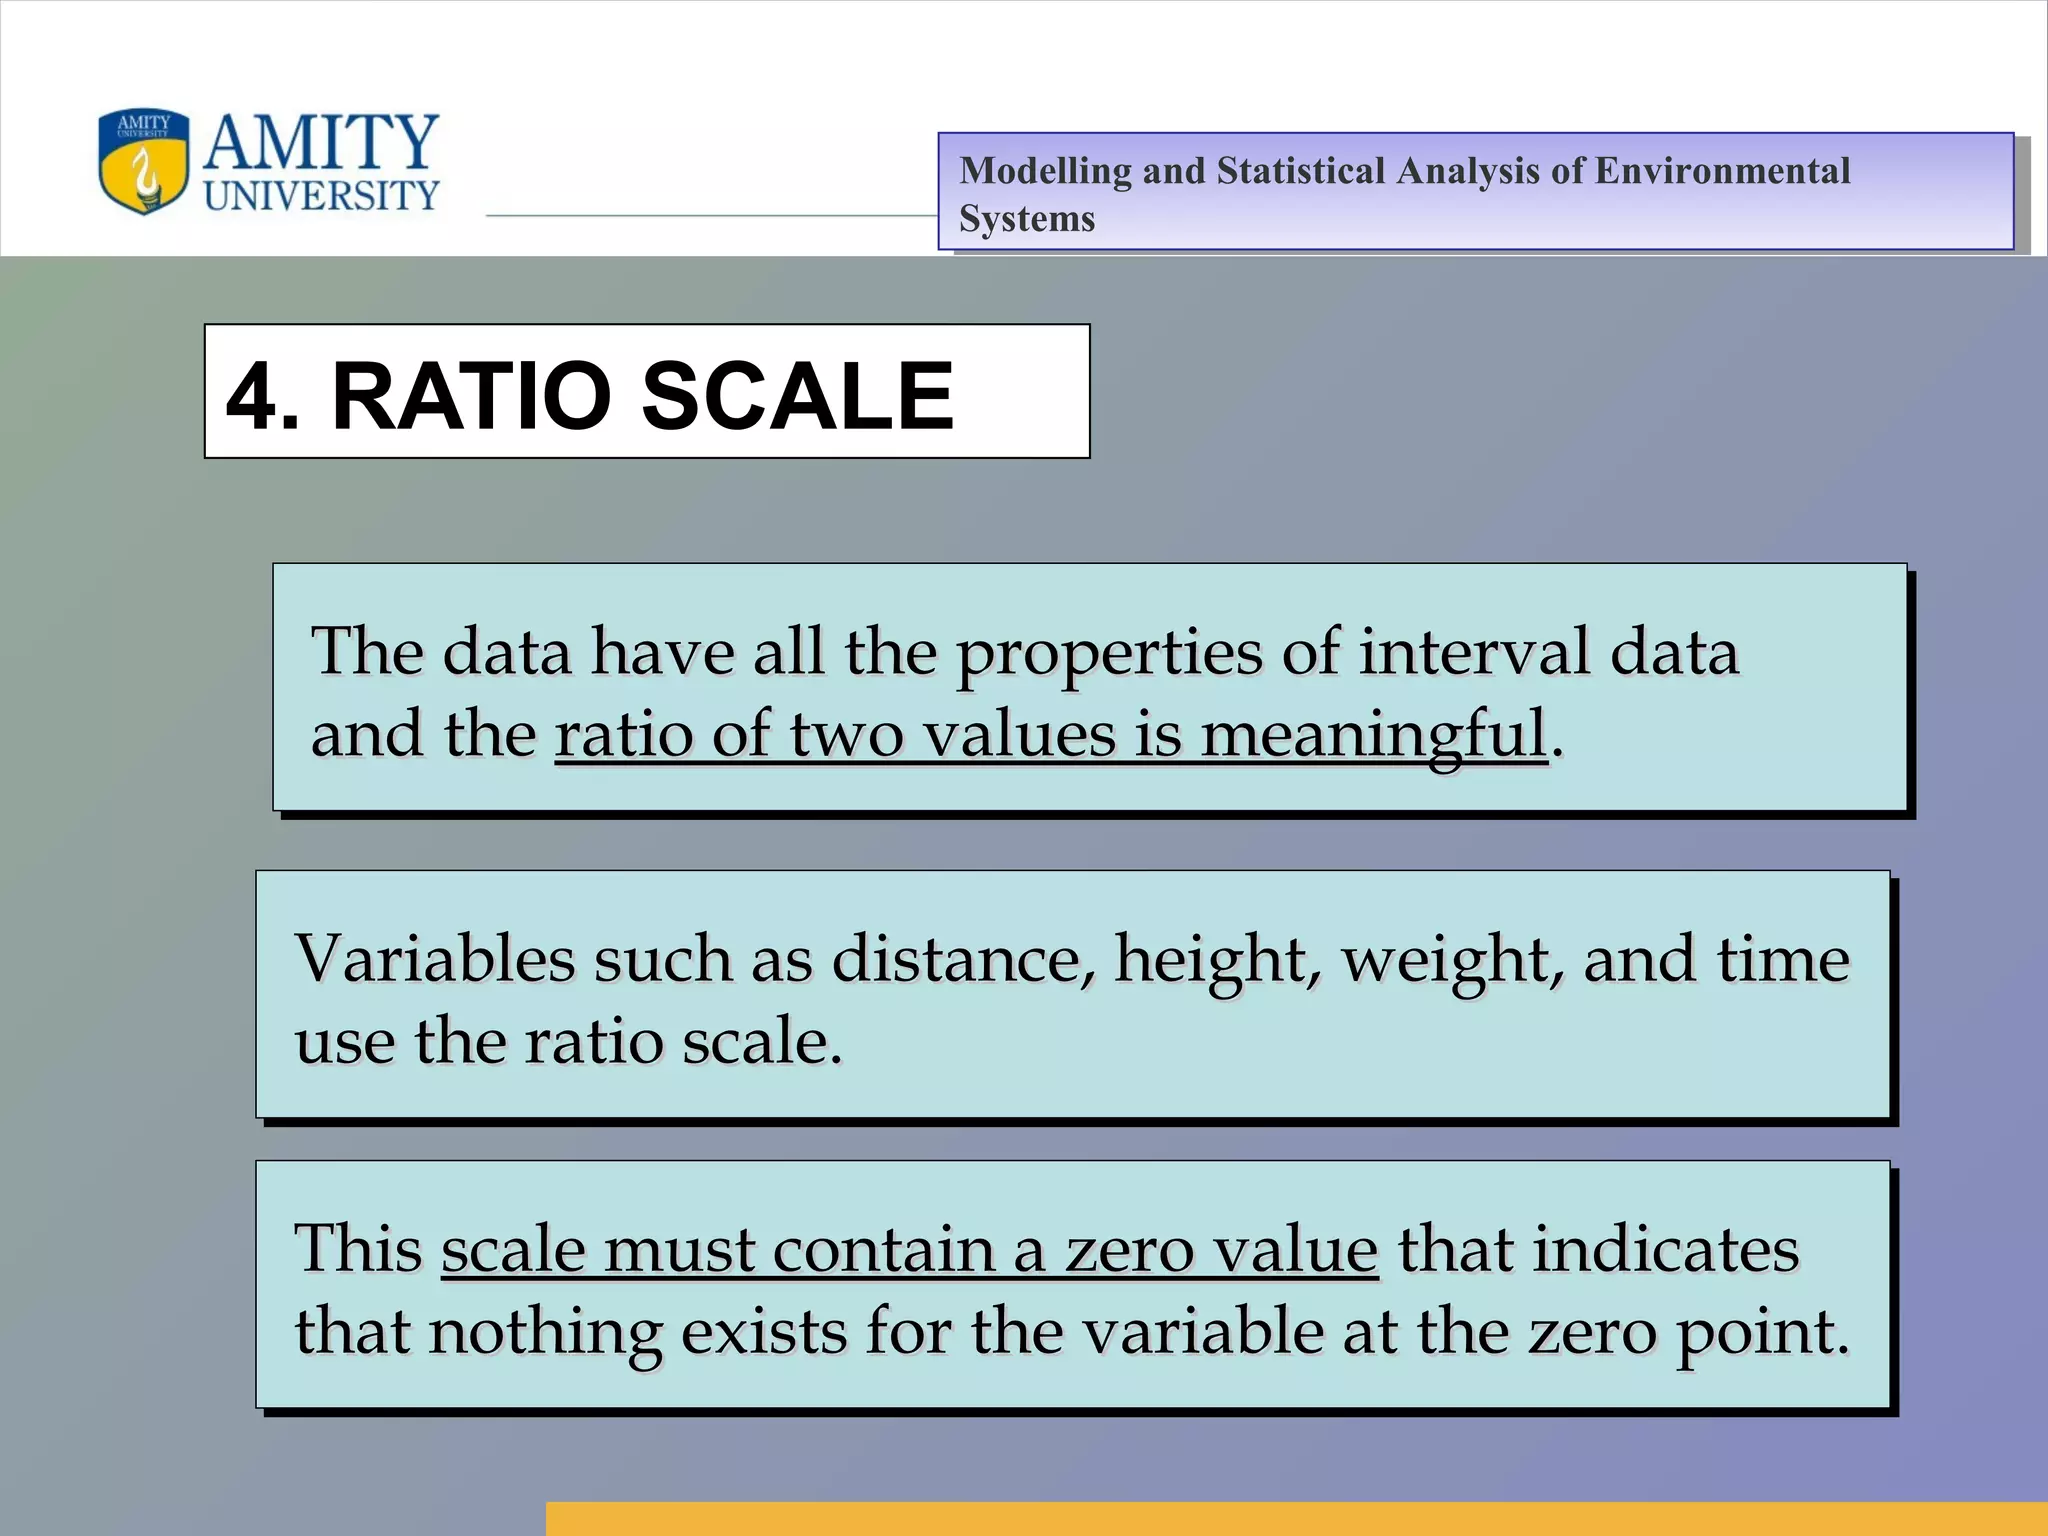
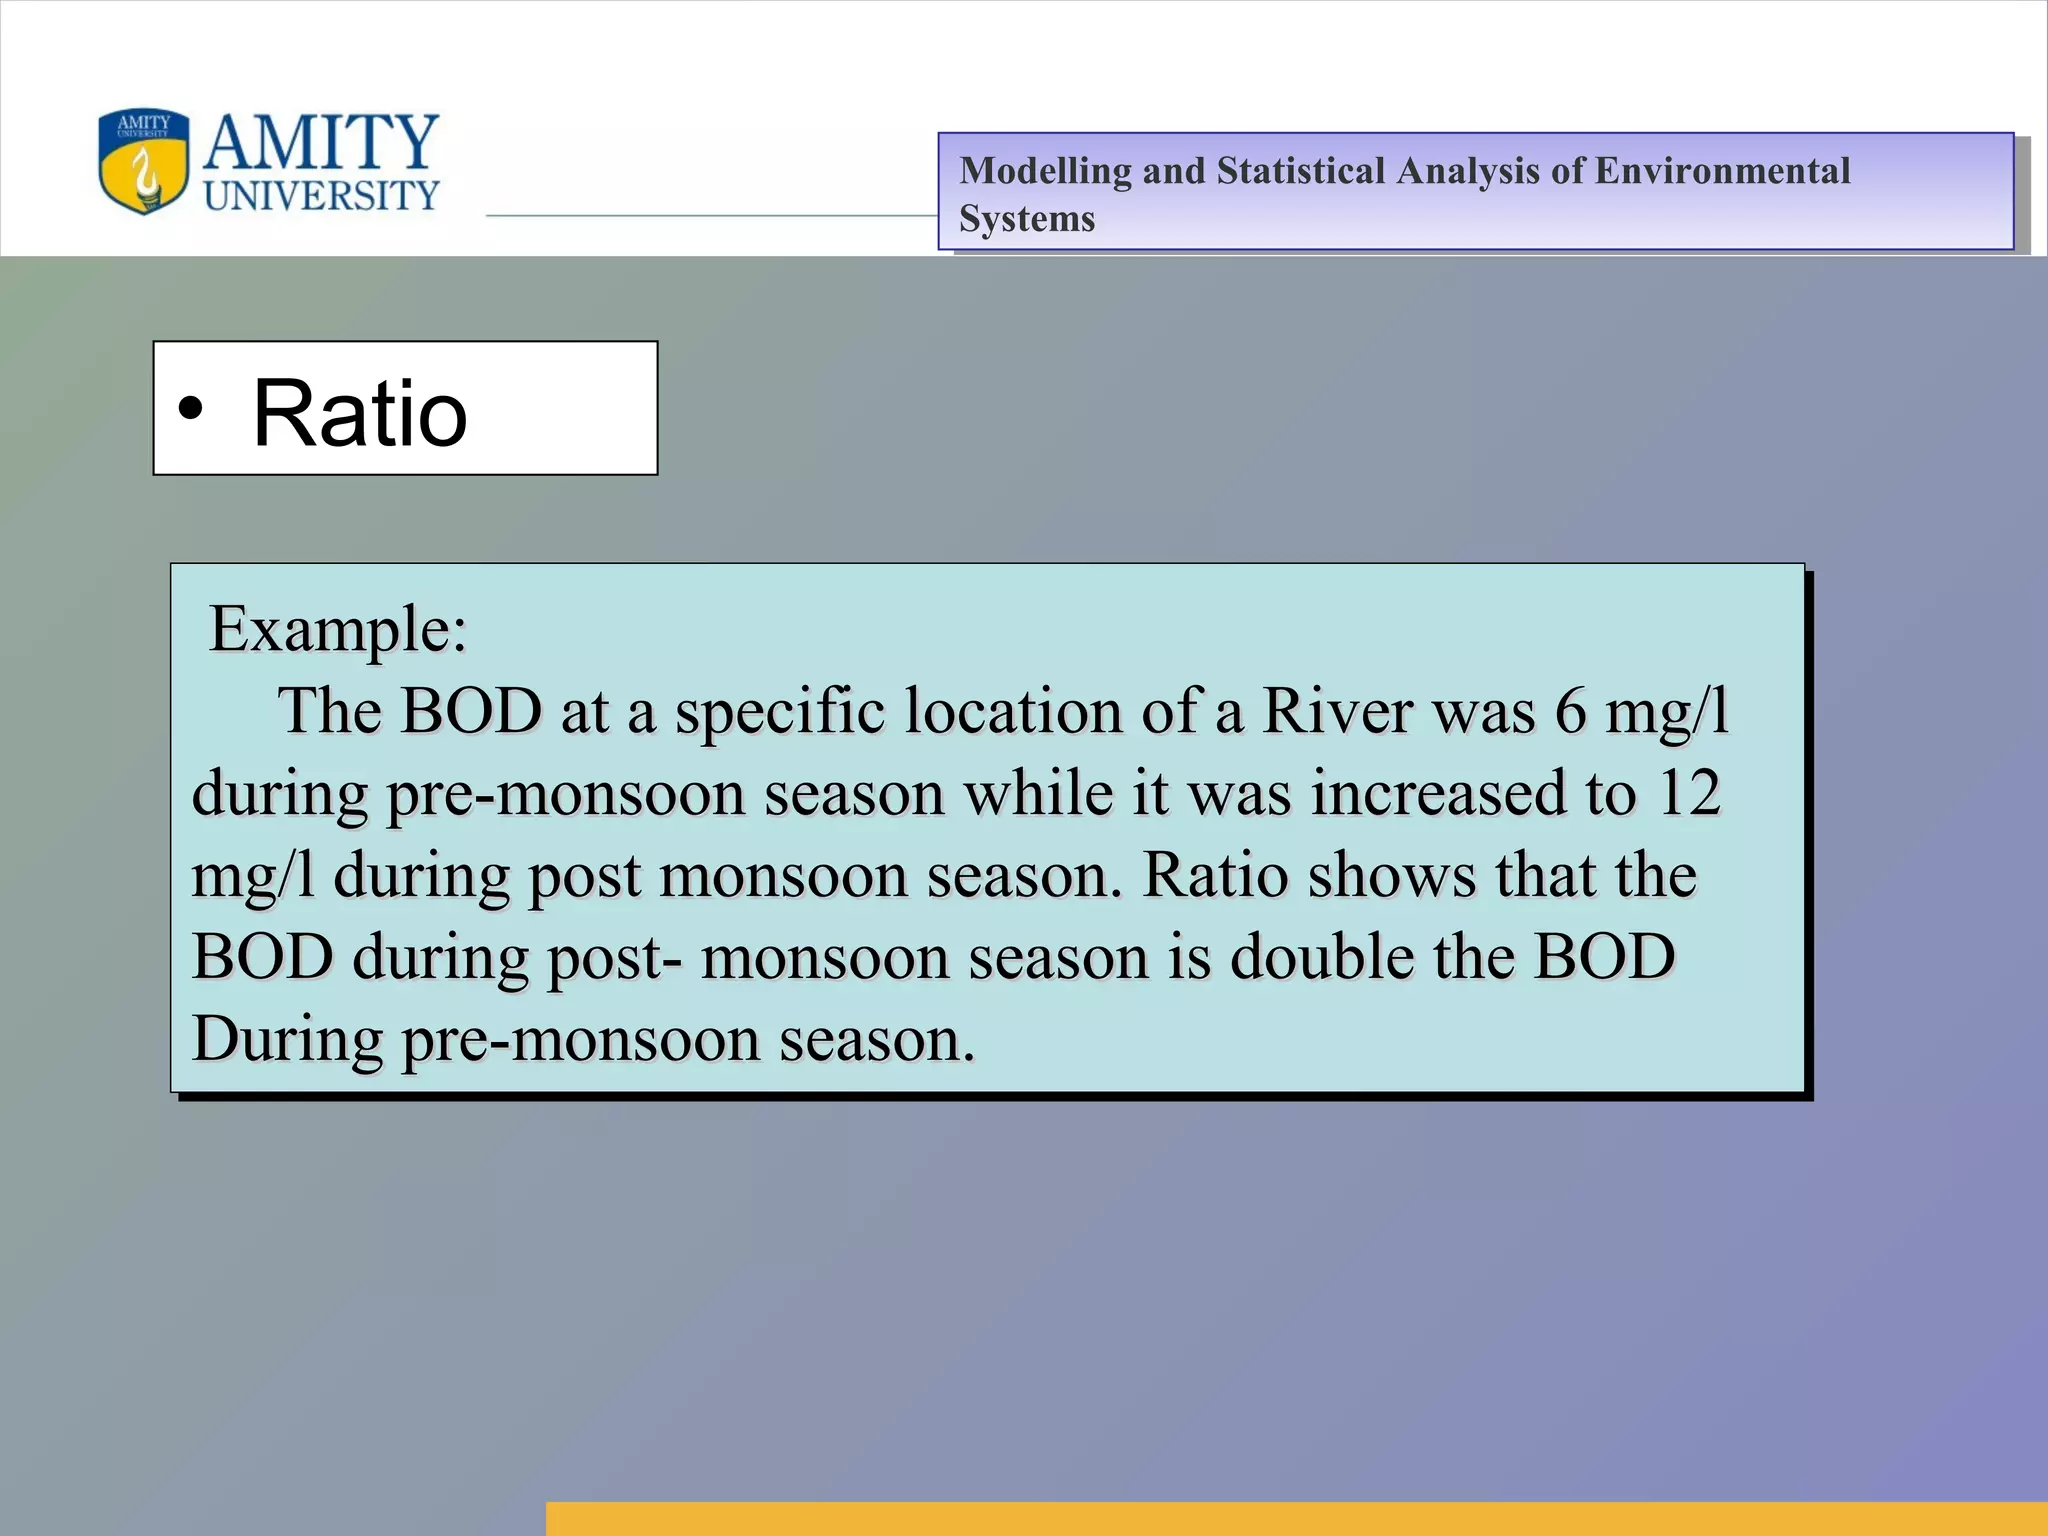
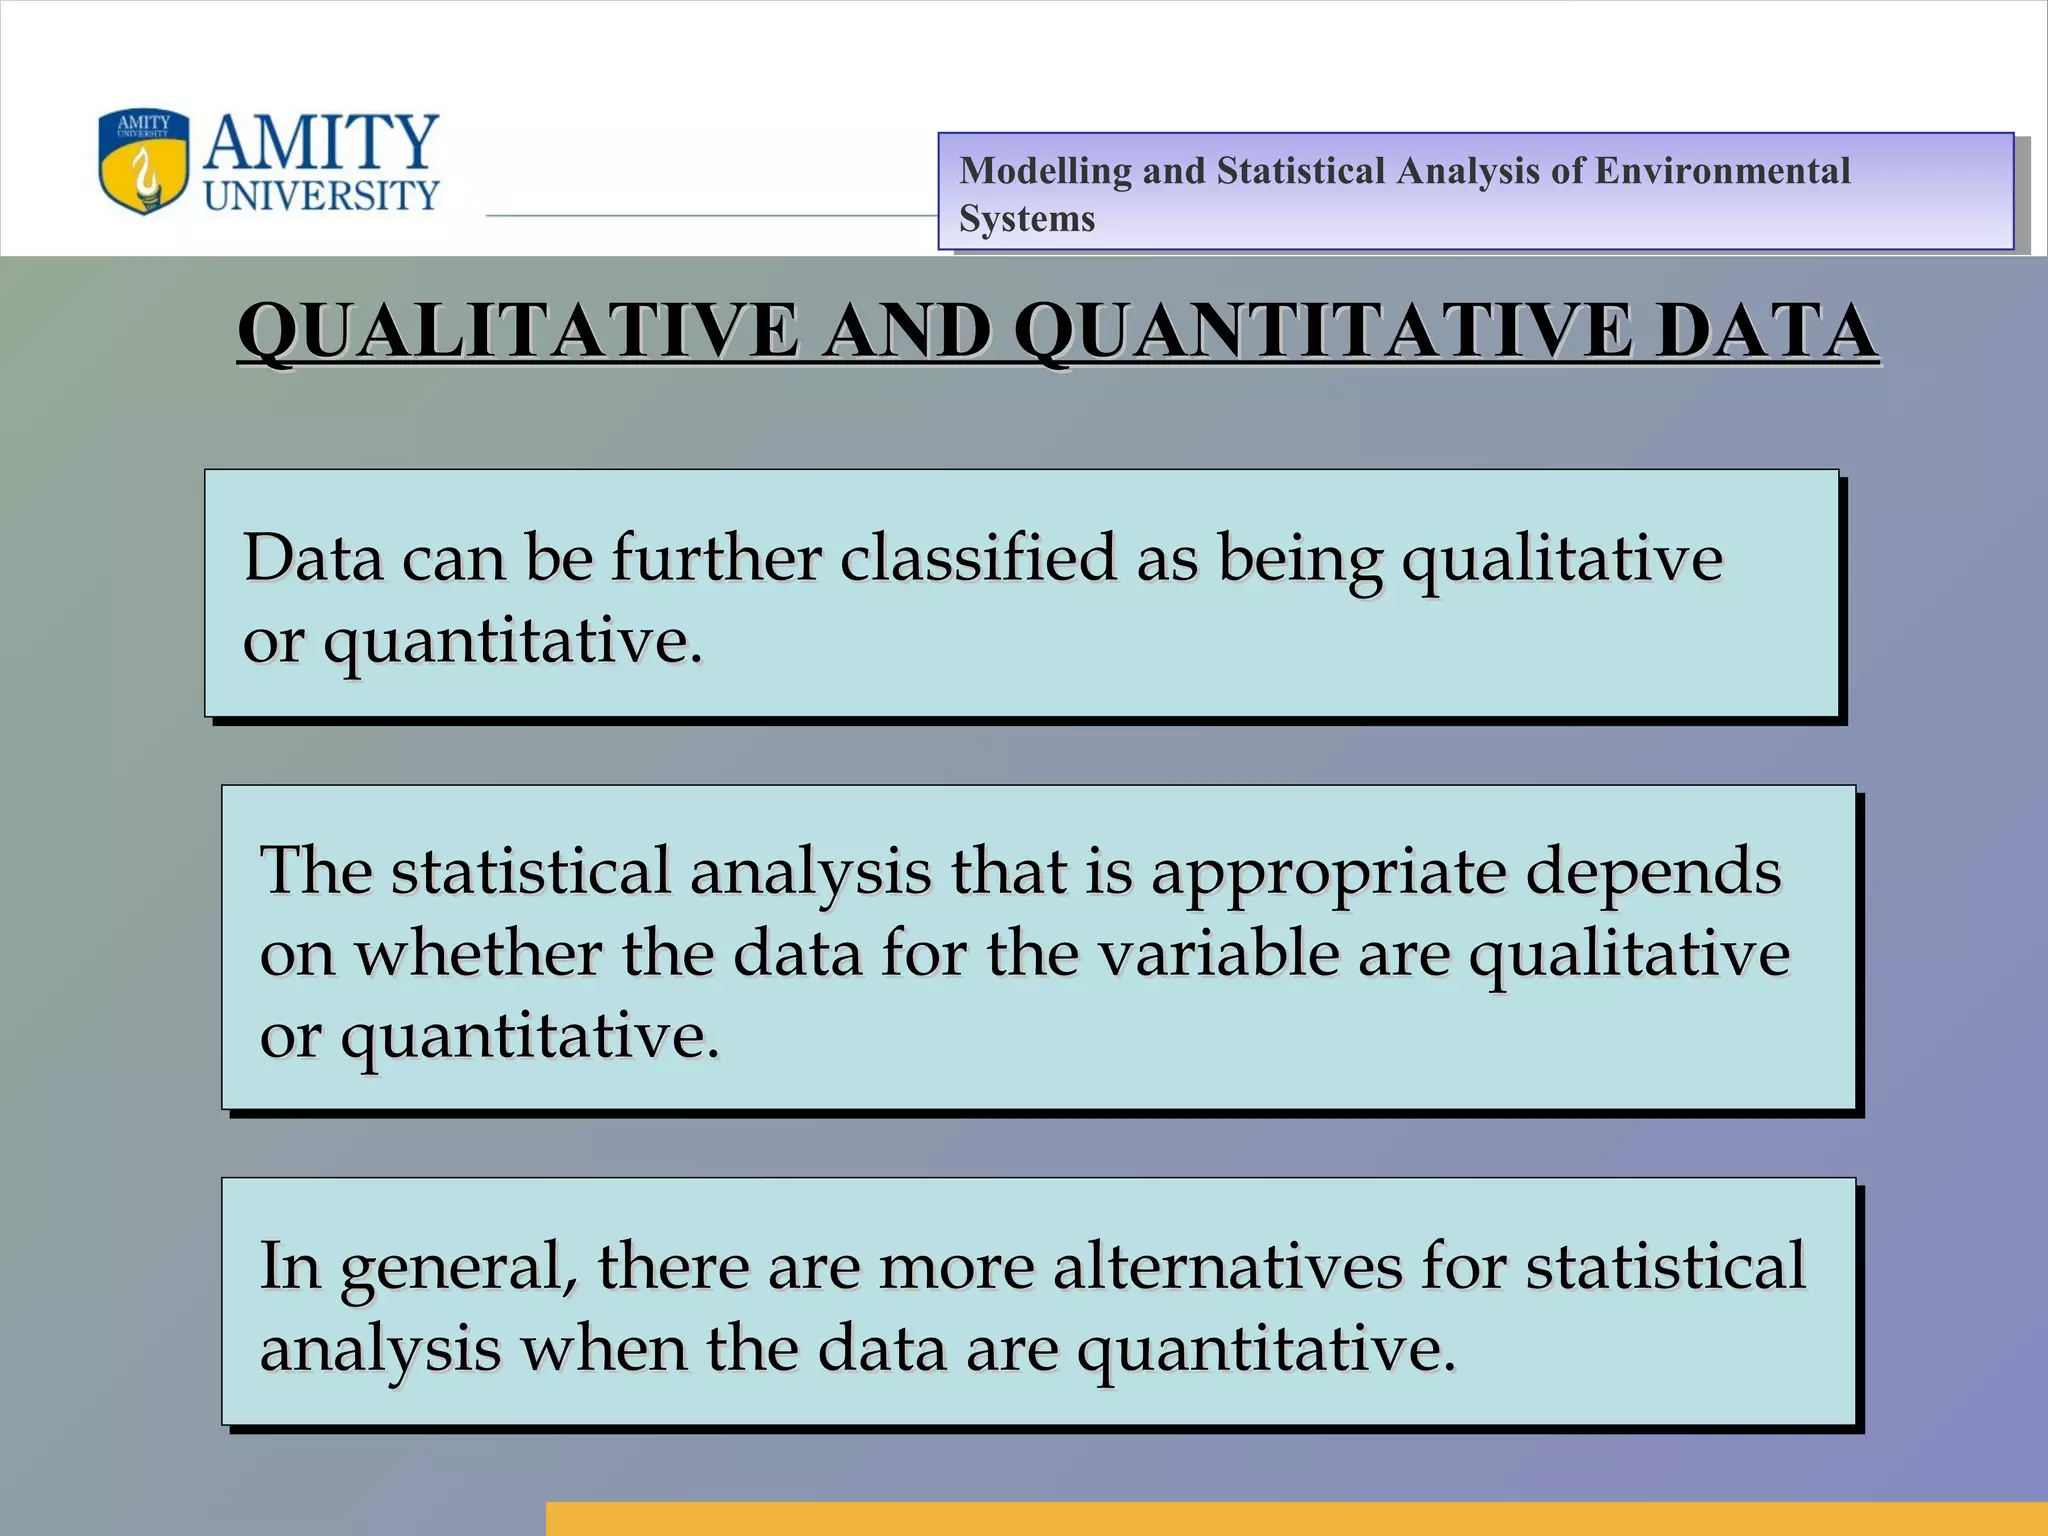
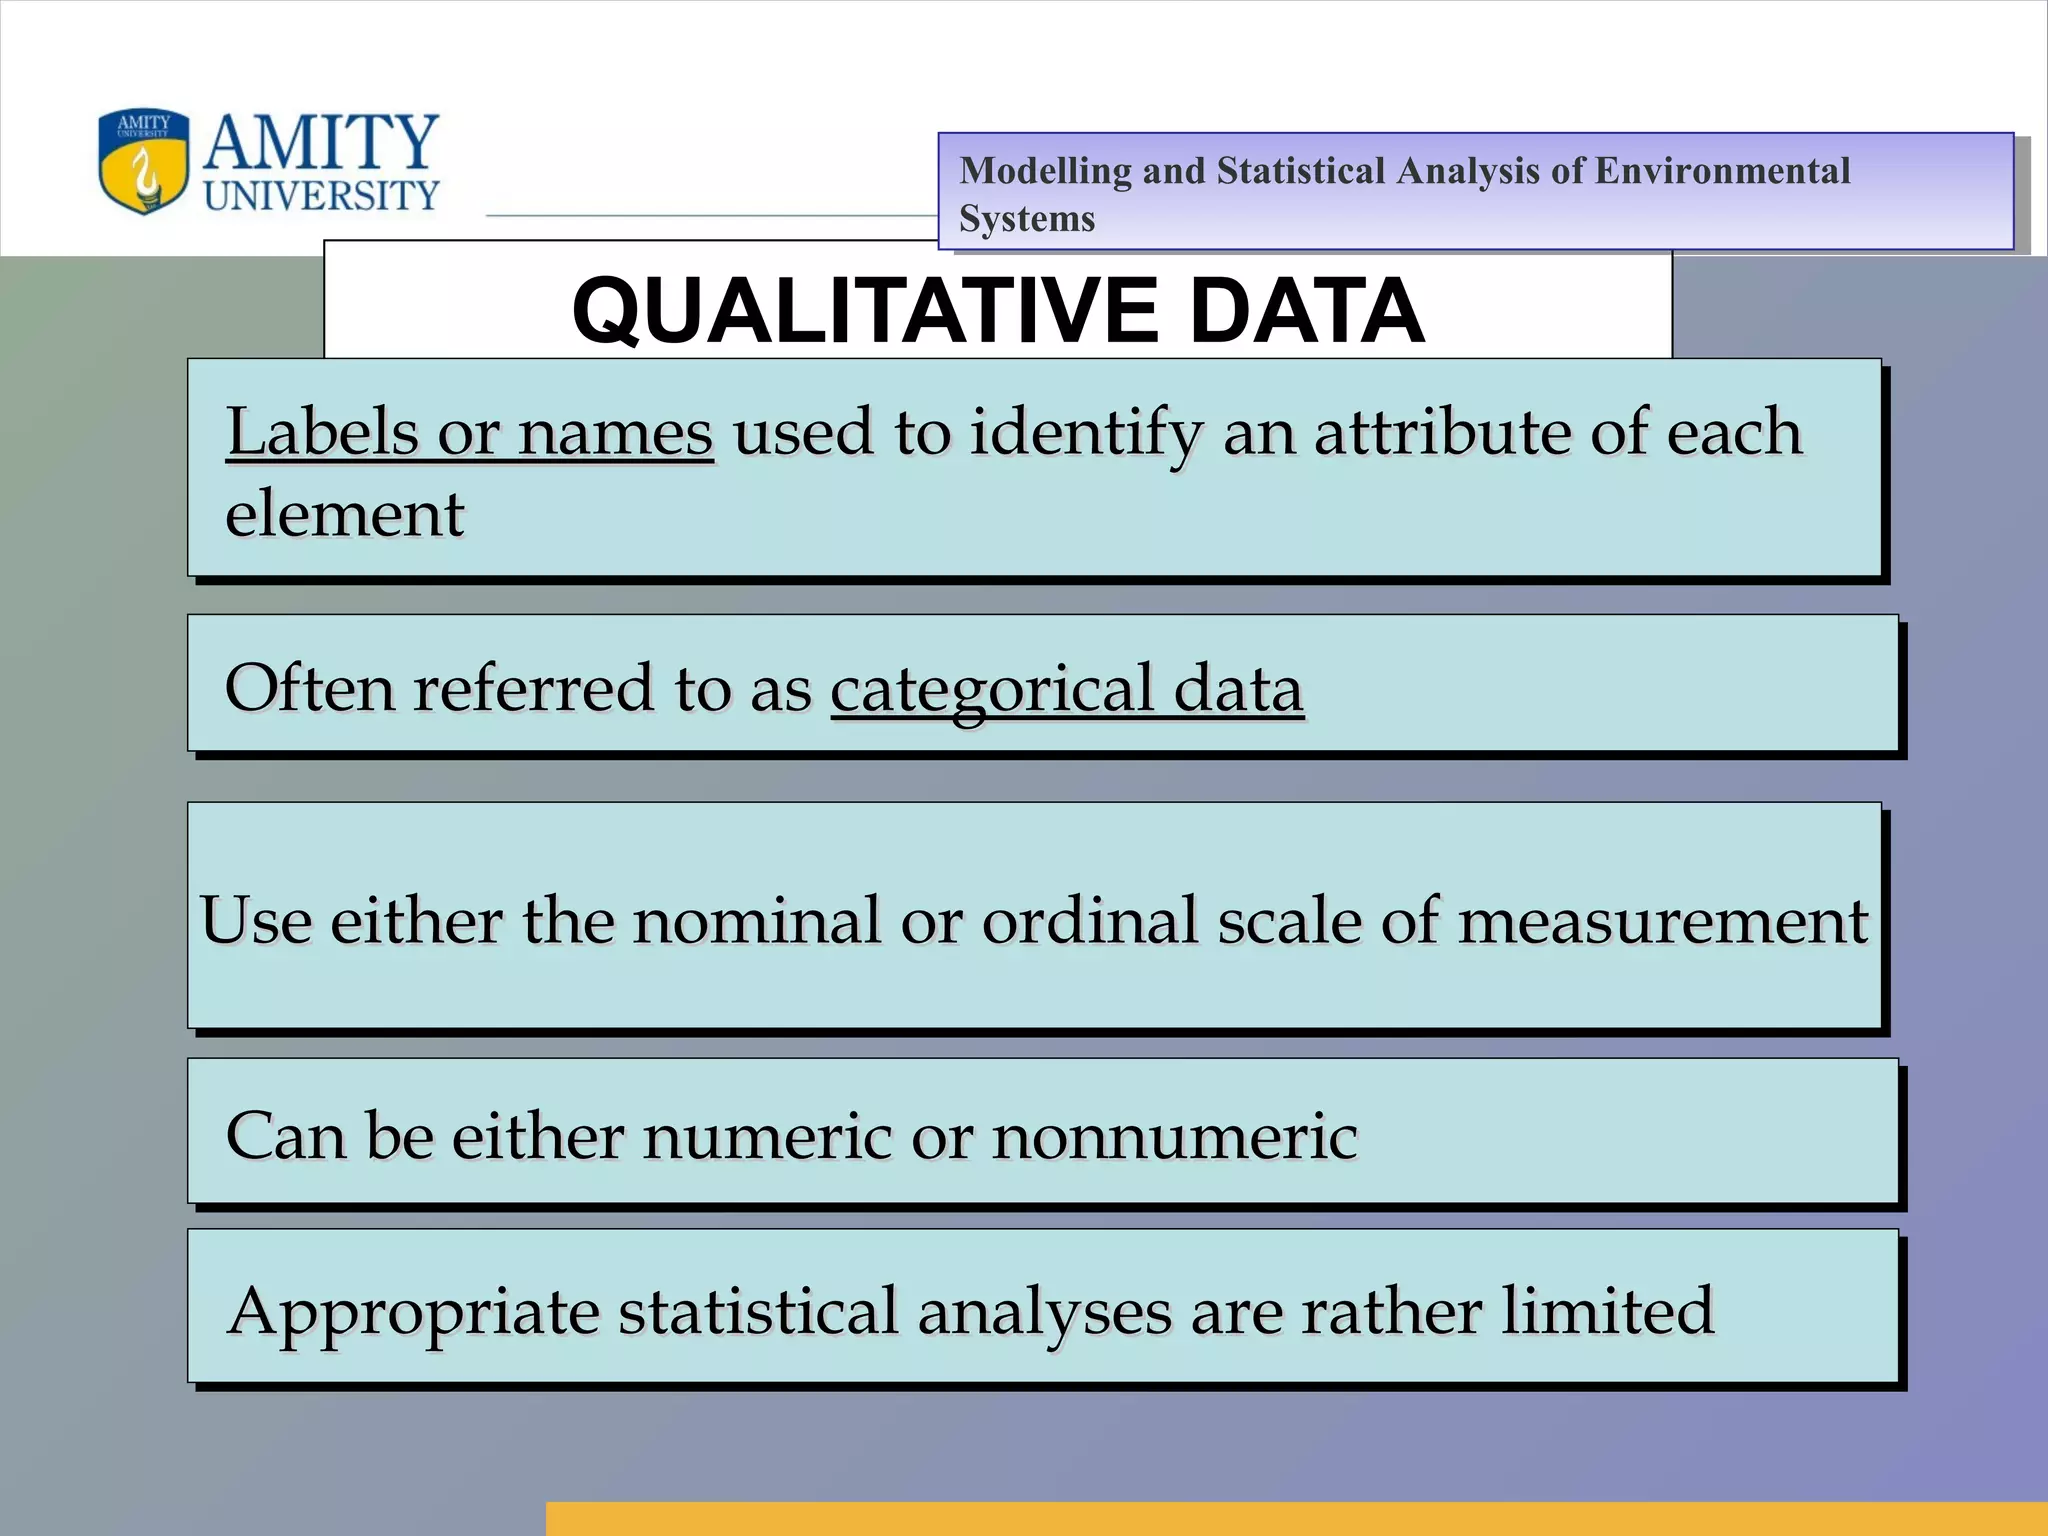
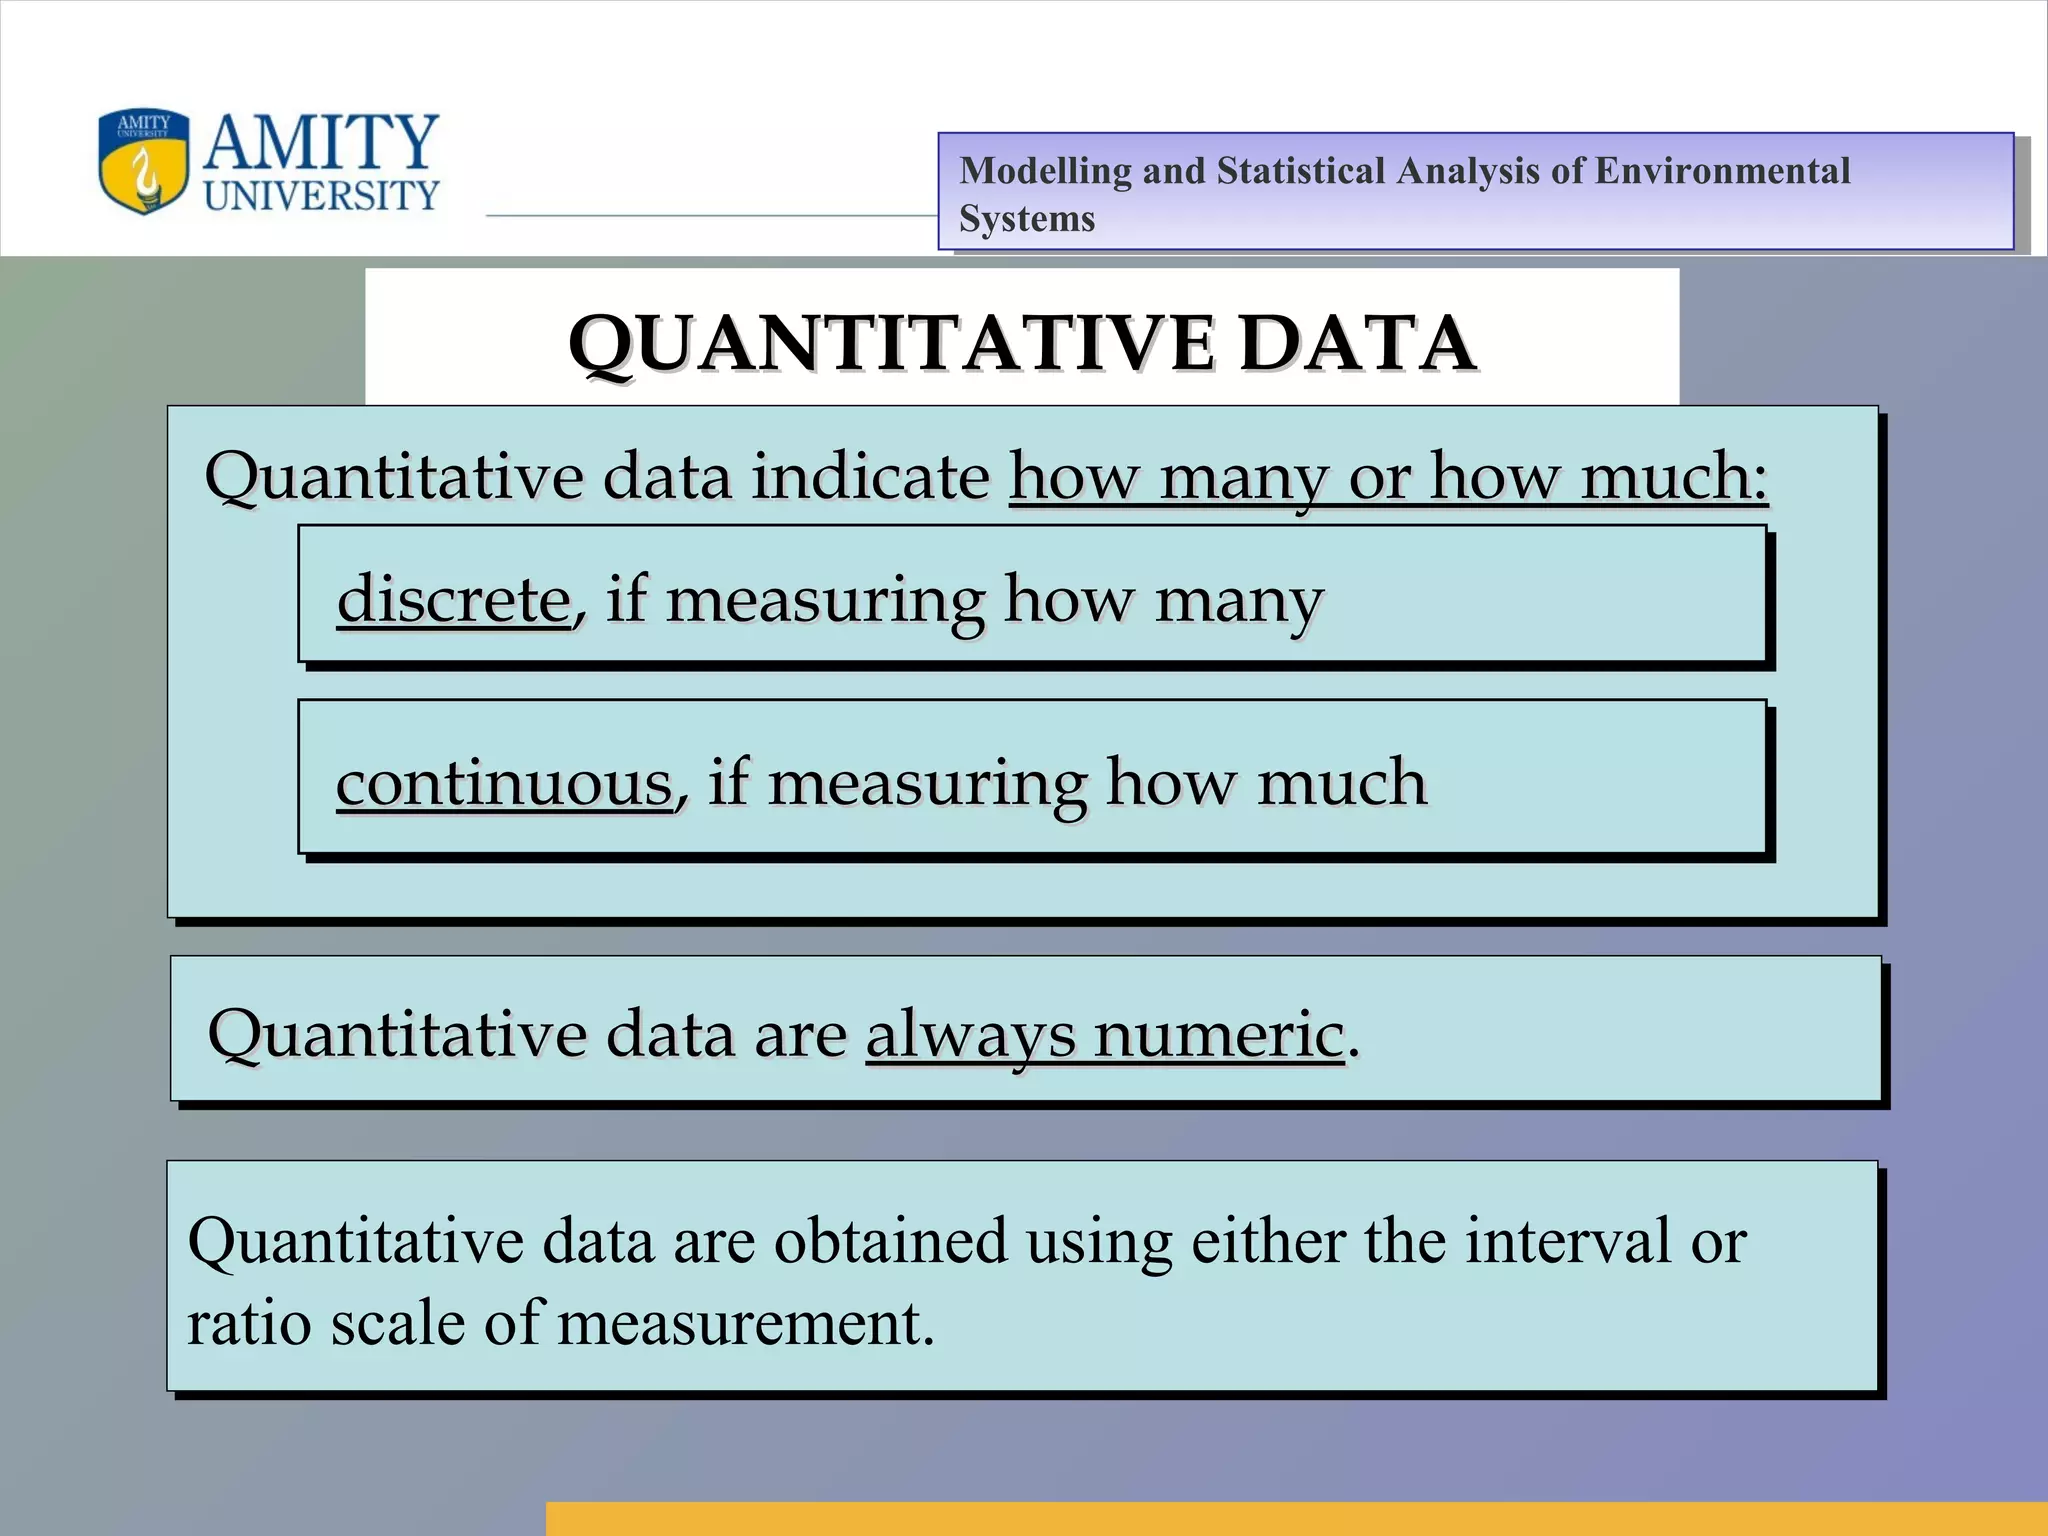
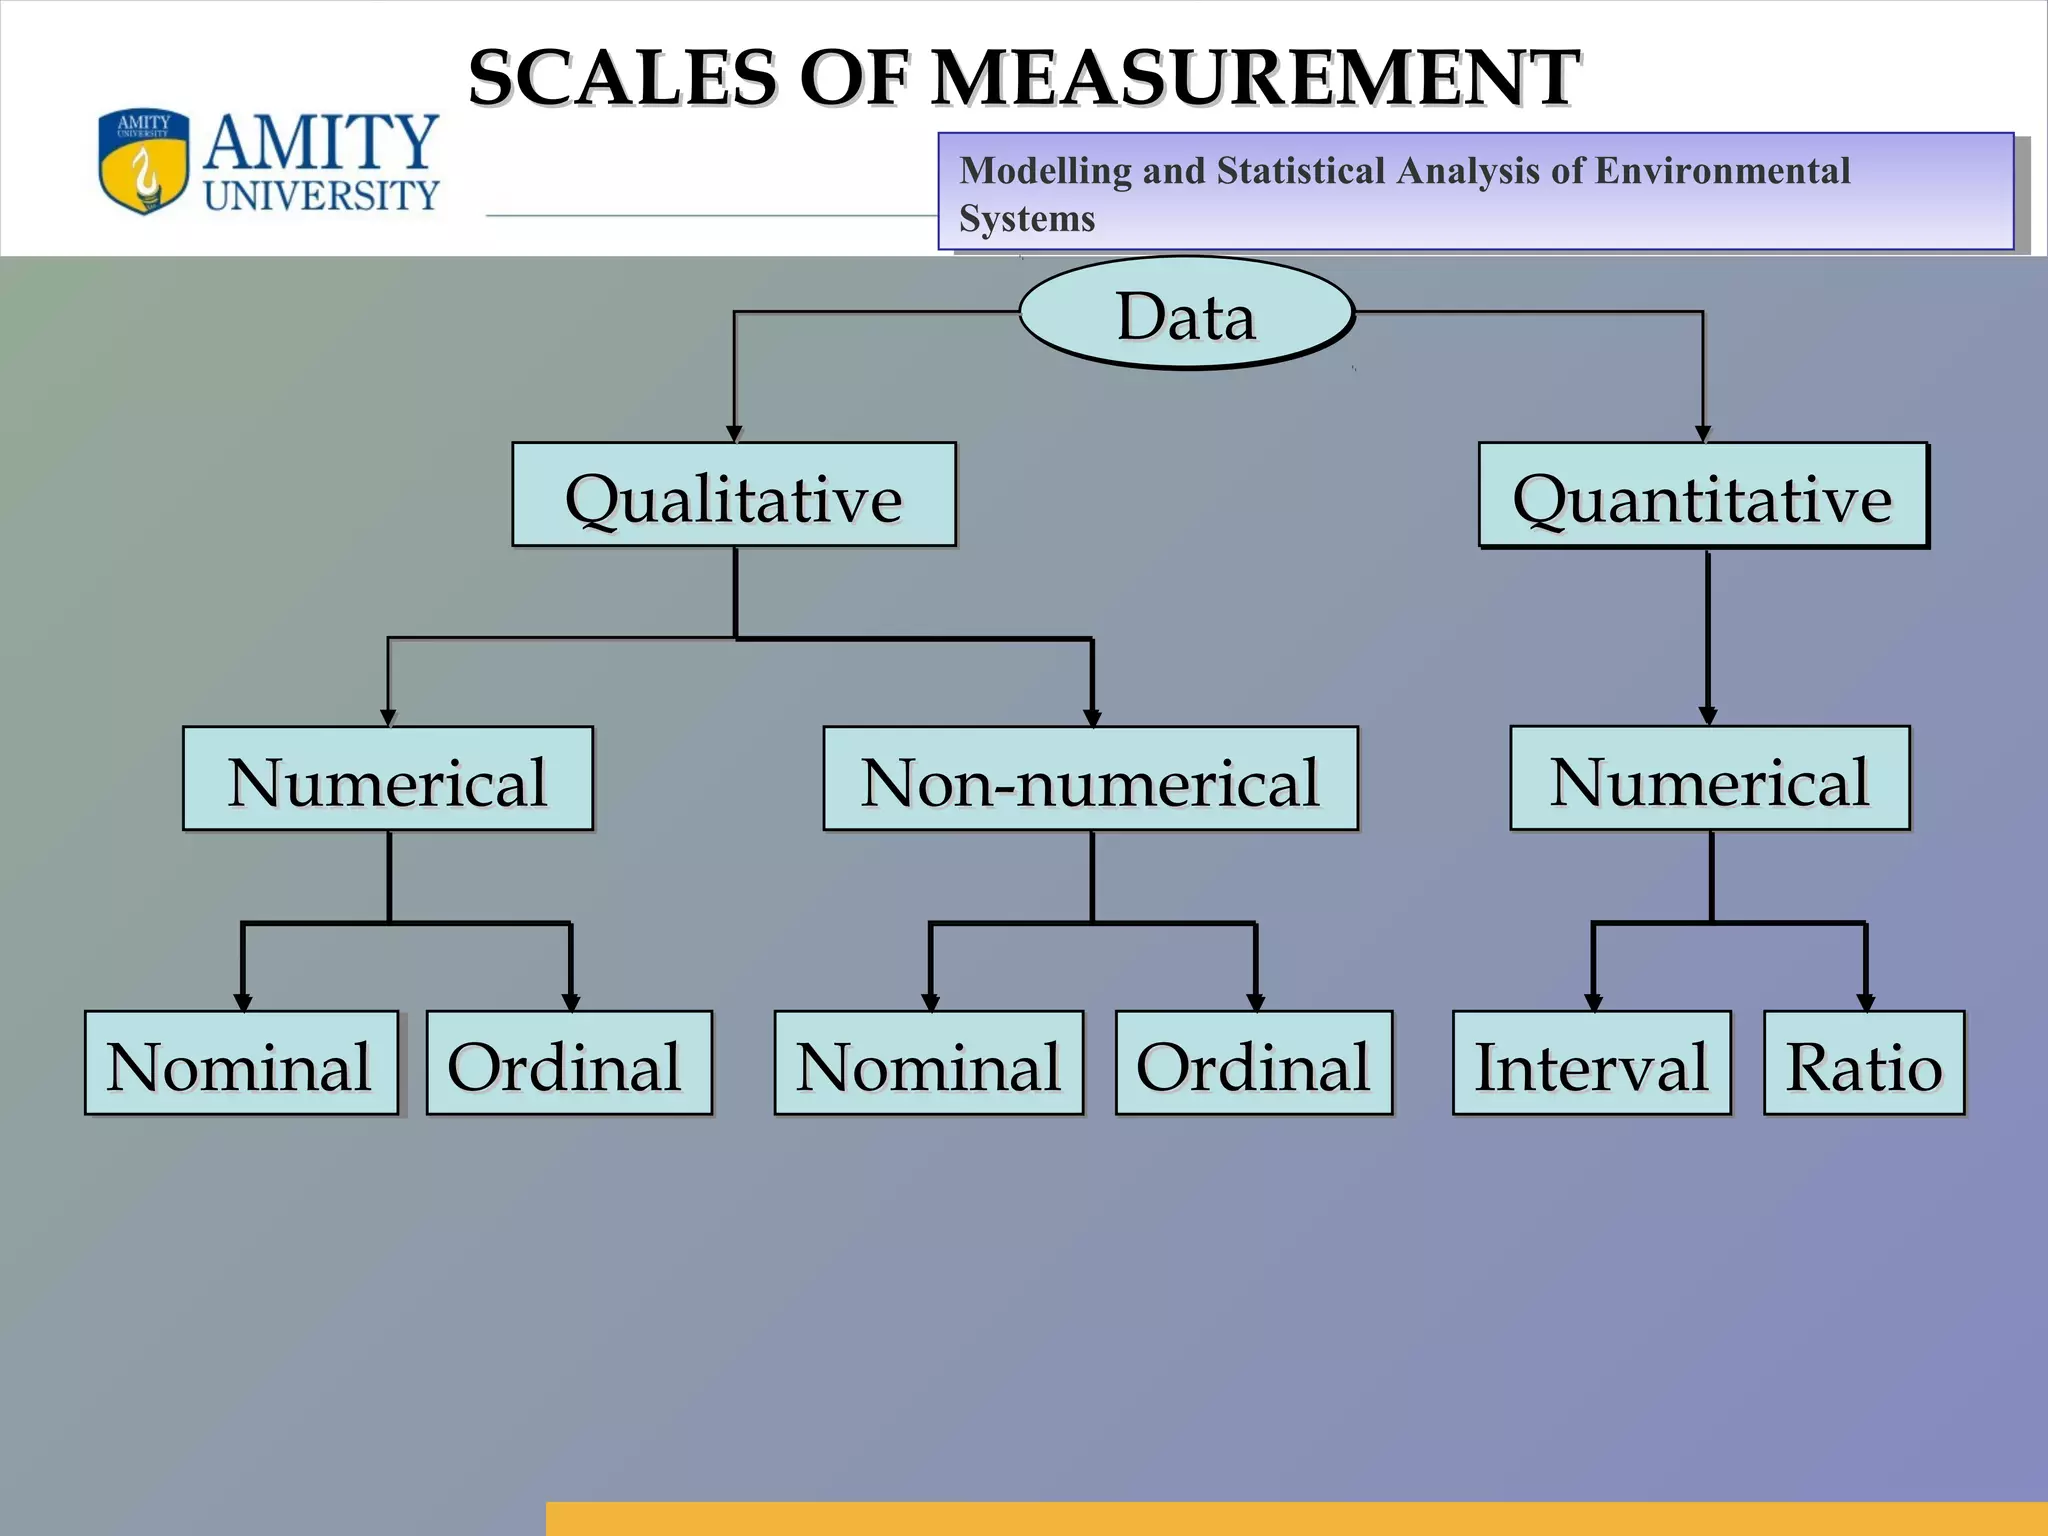
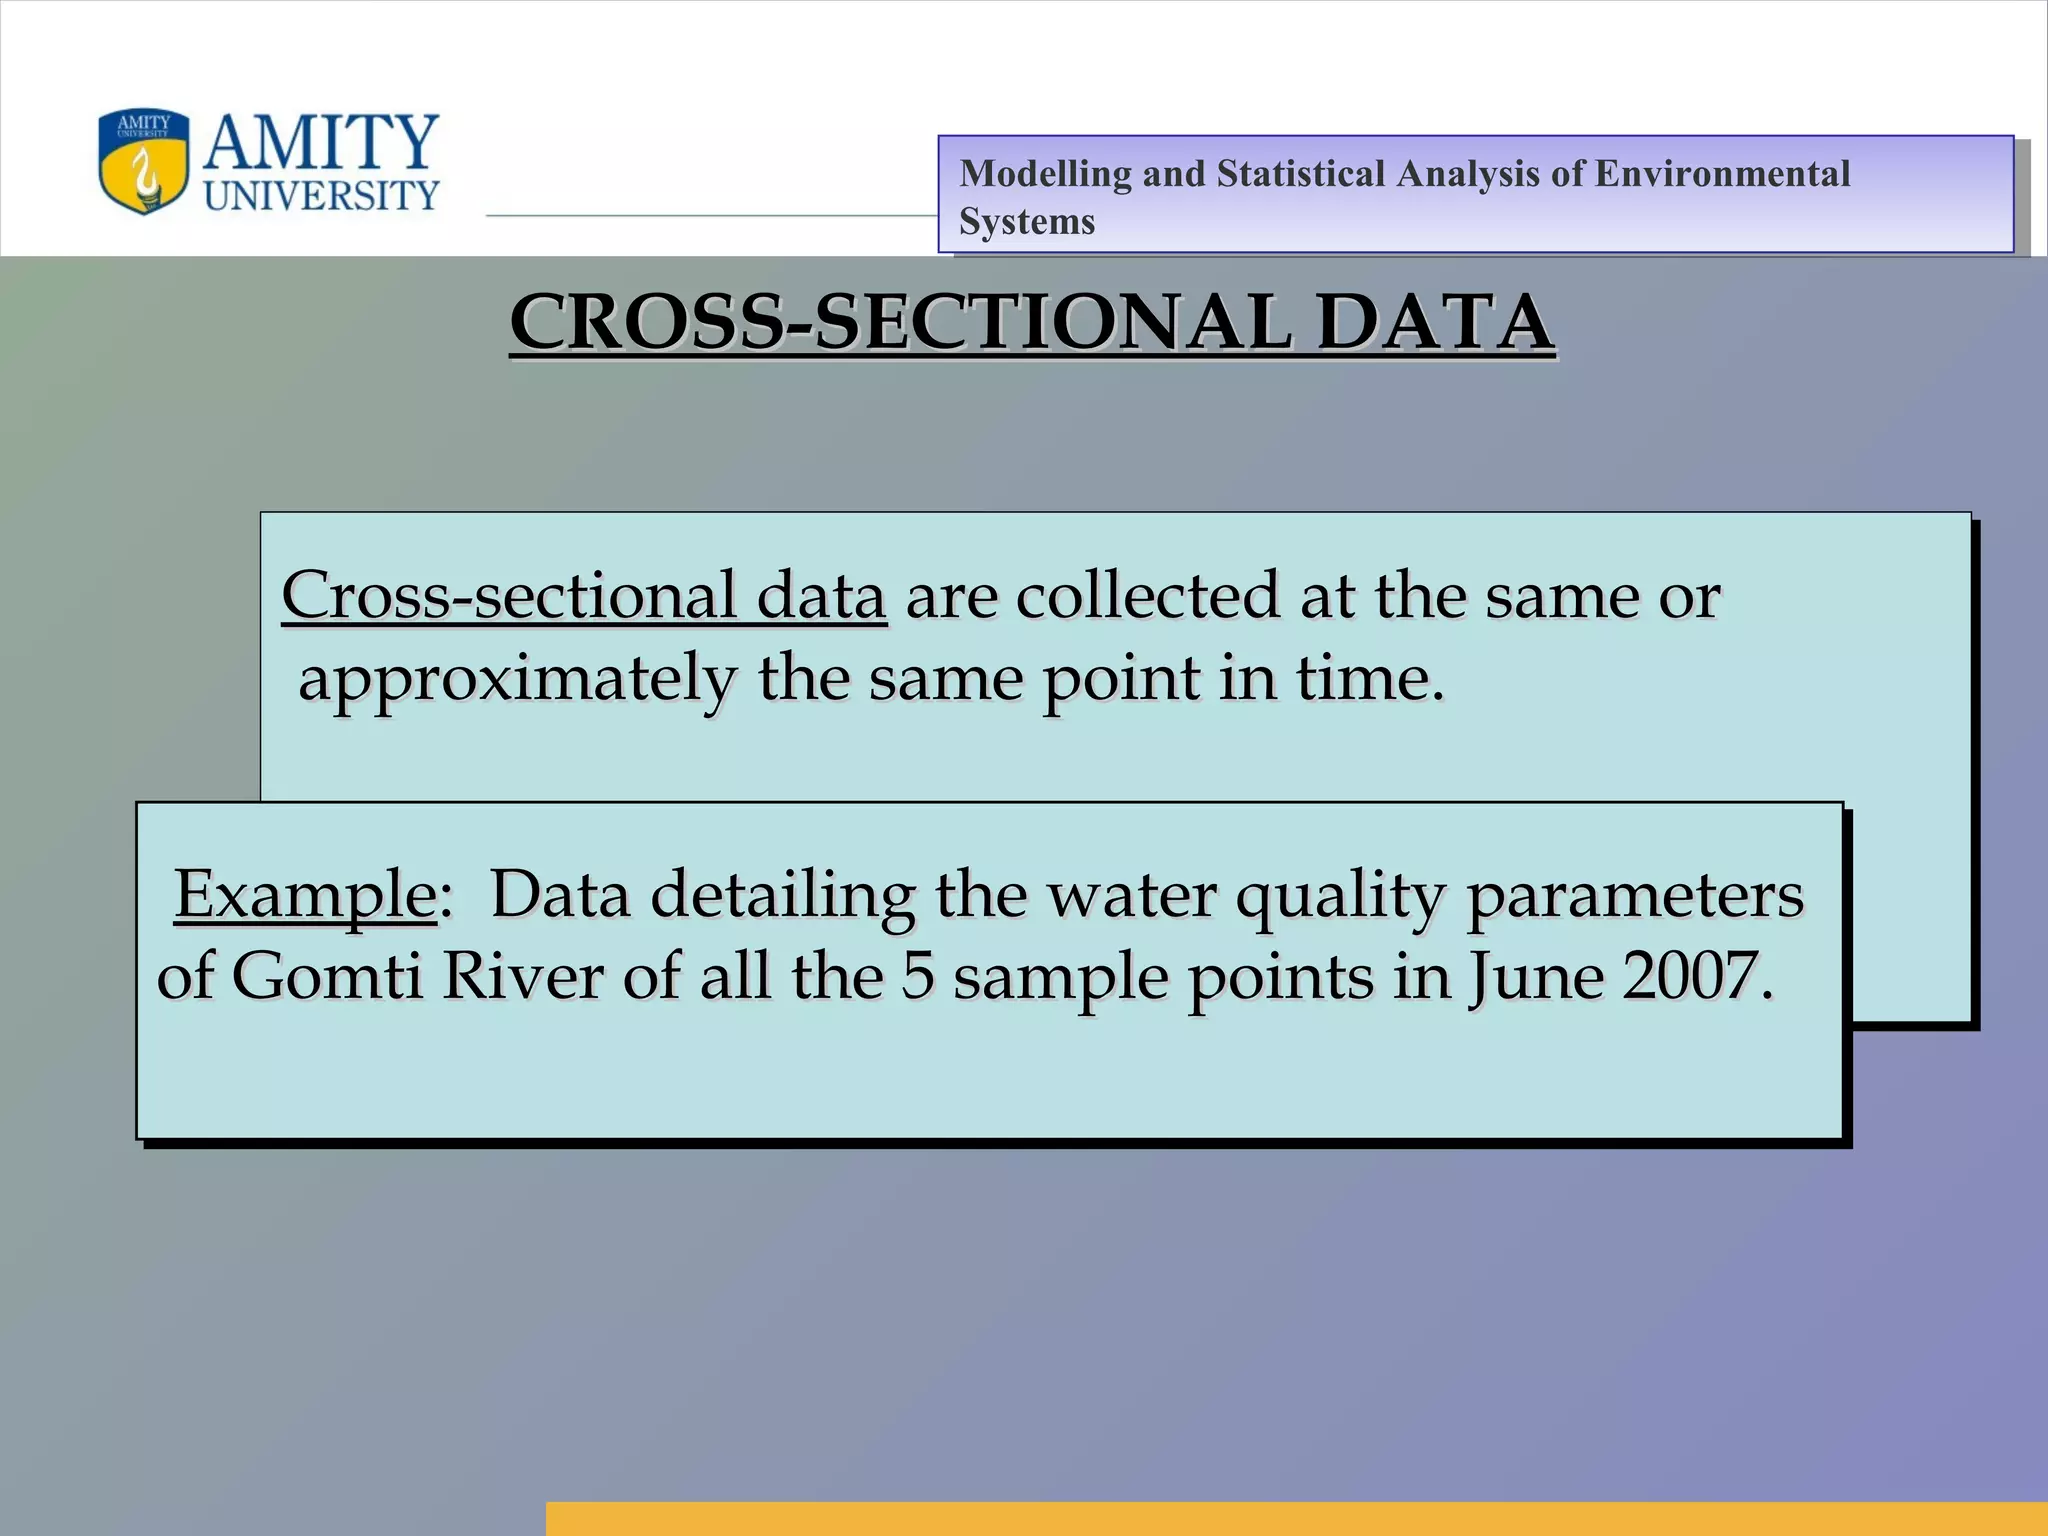
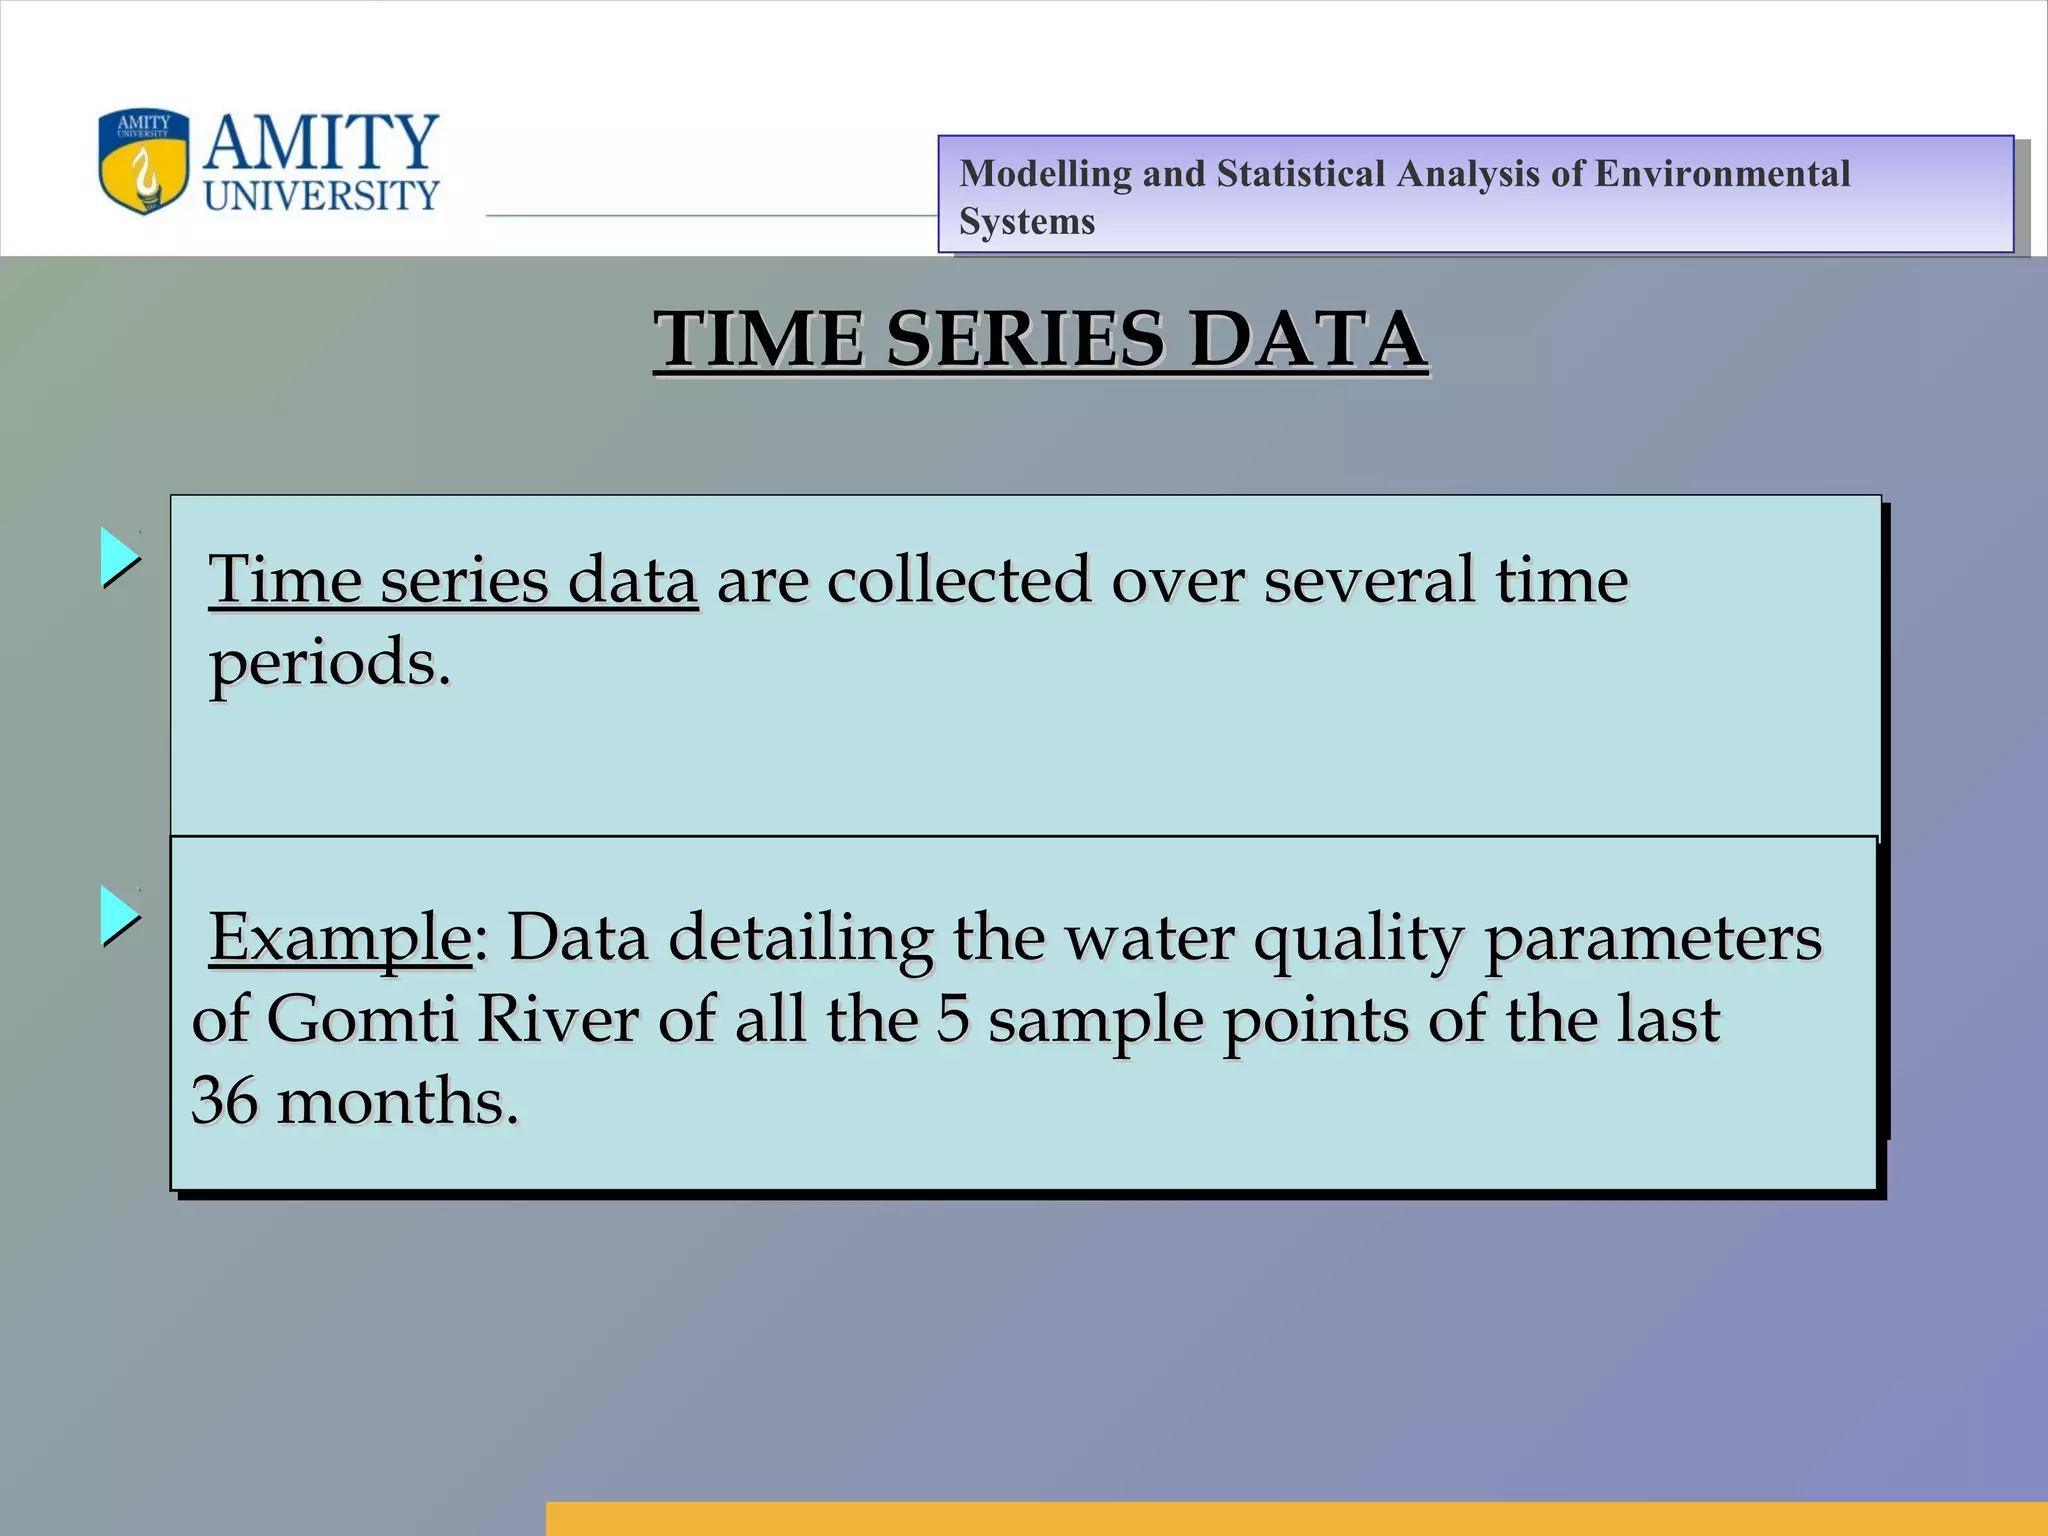
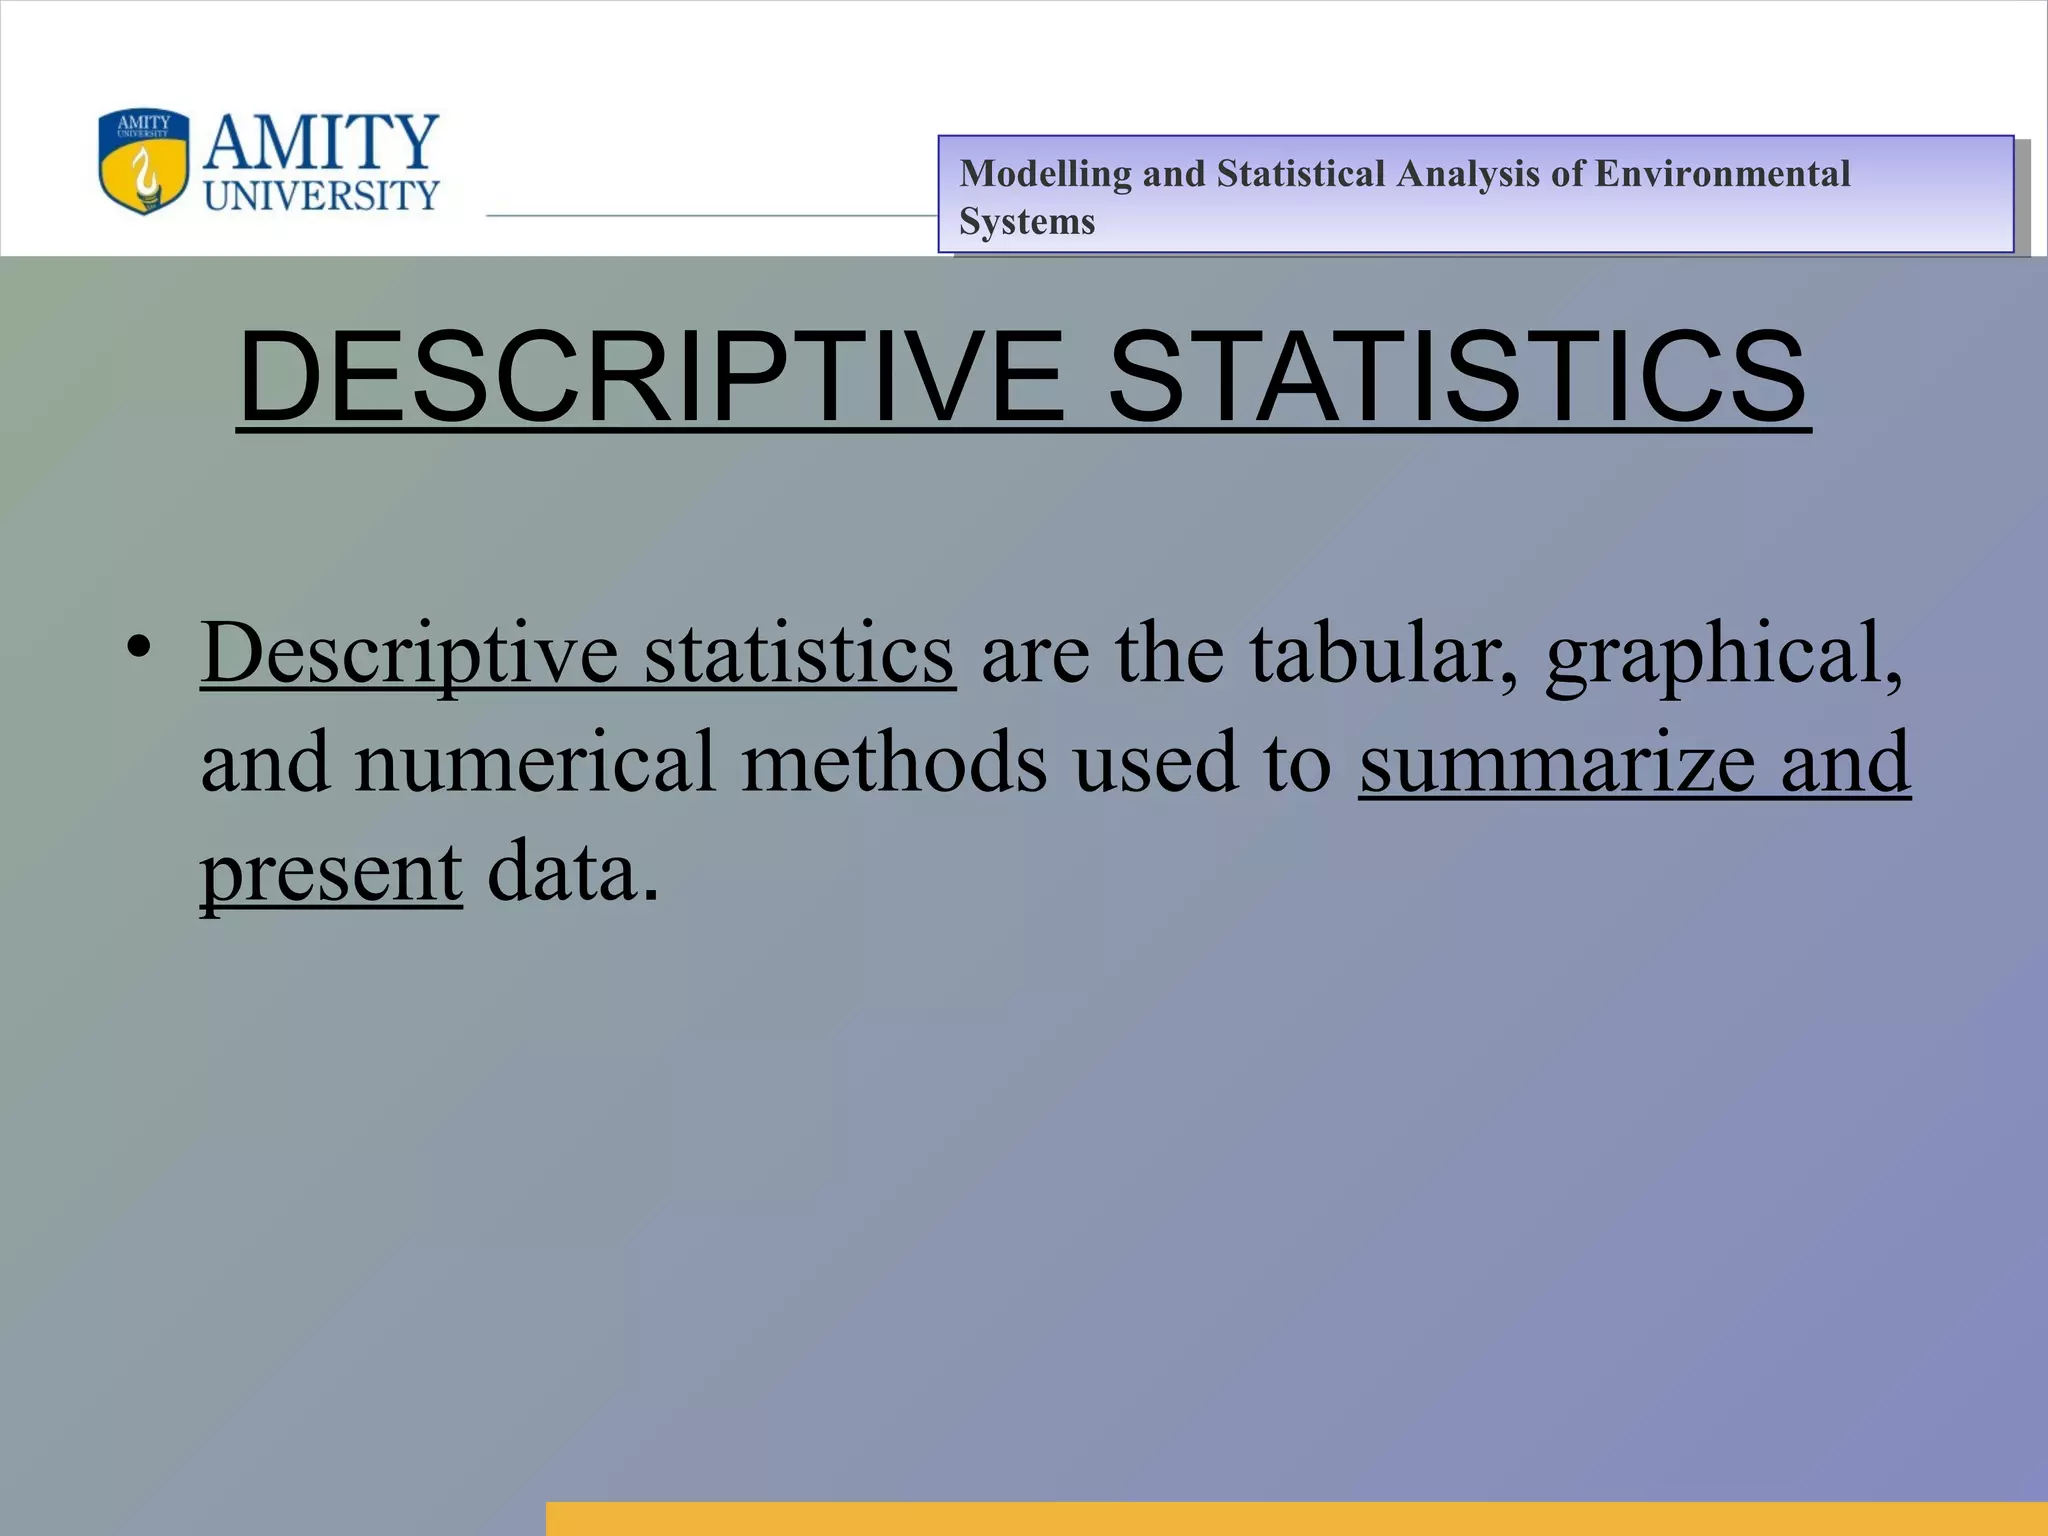
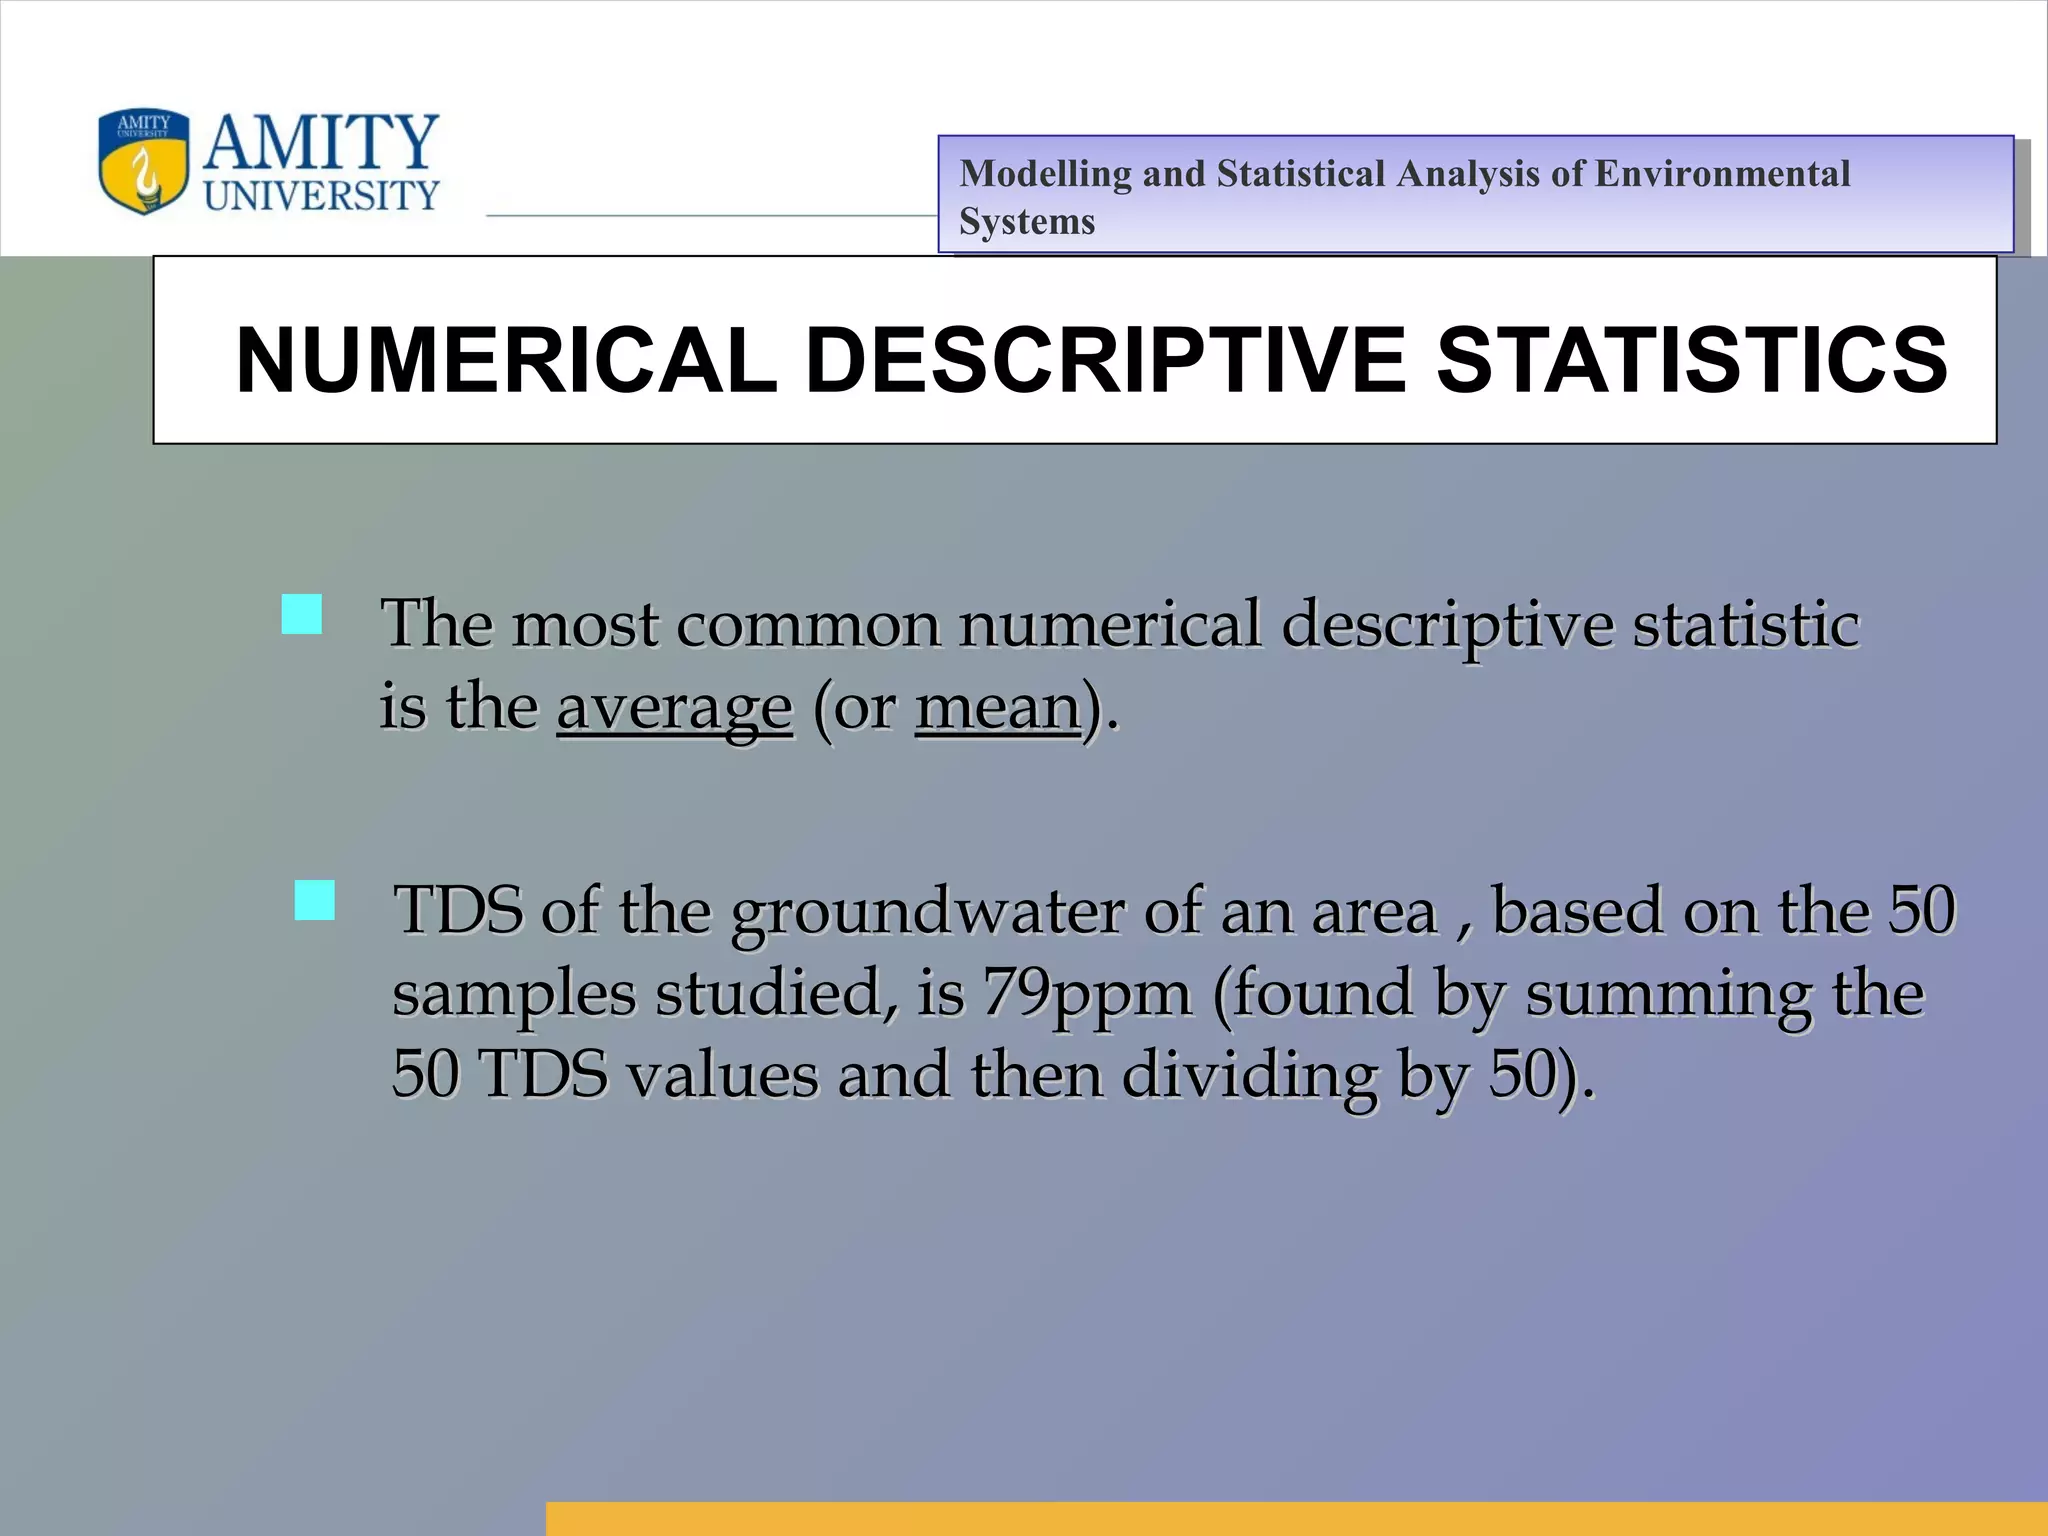
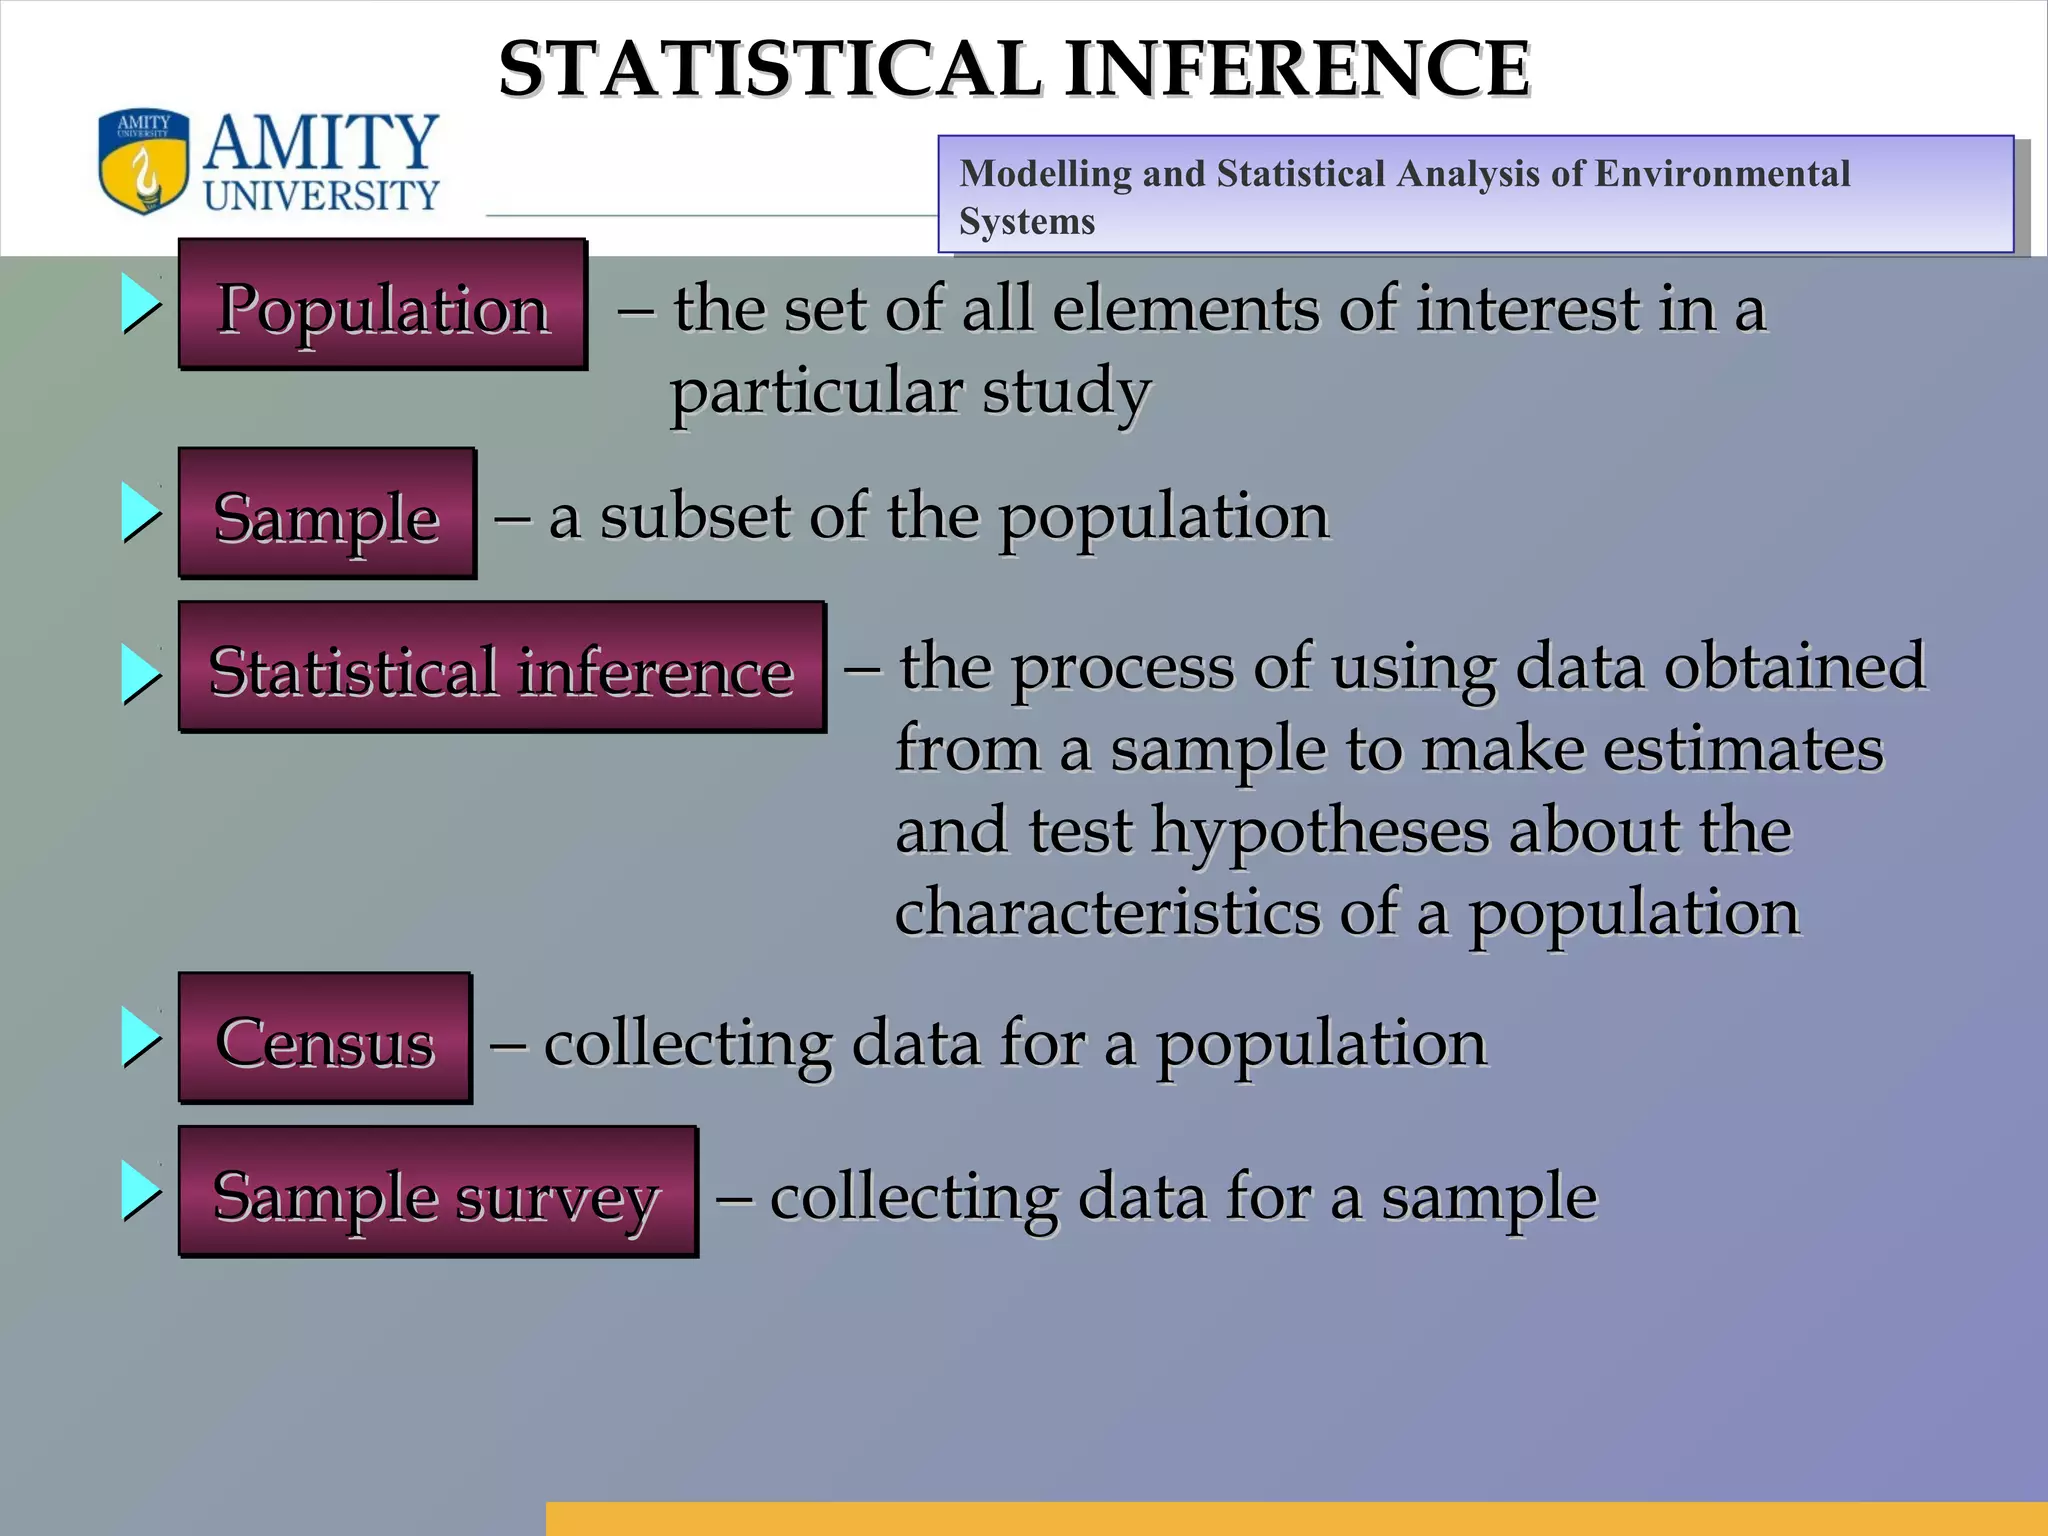
Amity Business School, Noida
Amity Institute of Environmental
Sciences (AIES)
Semester III
Modelling and Statistical Analysis of Environmental Systems
Ms. Shivangi Somvanshi
ssomvanshi@amity.edu
1
Modelling and Statistical Analysis of Environmental
Systems
Modelling and Statistical Analysis of Environmental
Systems
Amity Business School, Noida
DATA AND DATA SETS
• Data are the facts and figures collected,
summarized, analyzed, and interpreted.
• The data collected in a particular study areThe data collected in a particular study are
referred to as thereferred to as the data setdata set..
Modelling and Statistical Analysis of Environmental
Systems
Modelling and Statistical Analysis of Environmental
Systems
Amity Business School, Noida
TheThe elementselements are the entities on which data are collected.are the entities on which data are collected.
AA variablevariable is a characteristic of interest for the elementsis a characteristic of interest for the elements..
The set of measurements collected for a particular element isThe set of measurements collected for a particular element is
called ancalled an observationobservation..
The total number of data values in a complete data set is theThe total number of data values in a complete data set is the
number of elements multiplied by the number of variables.number of elements multiplied by the number of variables.
ELEMENTS, VARIABLES, AND OBSERVATIONSELEMENTS, VARIABLES, AND OBSERVATIONS
Modelling and Statistical Analysis of Environmental
Systems
Modelling and Statistical Analysis of Environmental
Systems
Amity Business School, Noida
PositionPosition BODBOD DODO THTHSample sitesSample sites
(Gomti River)(Gomti River)
Bhatpur (S.P.1)Bhatpur (S.P.1)
Gaughat (S.P.2)Gaughat (S.P.2)
M.Meakins (S.P.3)M.Meakins (S.P.3)
Pipraghat (S.P.4)Pipraghat (S.P.4)
Gangaganj (S.P.5)Gangaganj (S.P.5)
USUS 4.24.2 6.96.9 184184
USUS 3.43.4 7.17.1 198198
DSDS 1212 2.42.4 200200
USUS 16.516.5 1.31.3 208208
DSDS 11 4.311 4.3 170170
VariablesVariables
ElementElement
NamesNames
Data SetData Set
ObservationObservation
Modelling and Statistical Analysis of Environmental
Systems
Modelling and Statistical Analysis of Environmental
Systems
Amity Business School, Noida
SCALES OF MEASUREMENT
The scale indicates the data summarization and statisticalThe scale indicates the data summarization and statistical
analyses that are most appropriate.analyses that are most appropriate.
The scale indicates the data summarization and statisticalThe scale indicates the data summarization and statistical
analyses that are most appropriate.analyses that are most appropriate.
The scale determines the amount of information containedThe scale determines the amount of information contained
in the data.in the data.
The scale determines the amount of information containedThe scale determines the amount of information contained
in the data.in the data.
Scales of measurement include:Scales of measurement include:Scales of measurement include:Scales of measurement include:
NominalNominal
OrdinalOrdinal
IntervalInterval
RatioRatio
Modelling and Statistical Analysis of Environmental
Systems
Modelling and Statistical Analysis of Environmental
Systems
Amity Business School, Noida
1. NOMINAL SCALE
AA non-numeric labelnon-numeric label oror numeric codenumeric code may be used.may be used.AA non-numeric labelnon-numeric label oror numeric codenumeric code may be used.may be used.
Data areData are labels or nameslabels or names used to identify an attributeused to identify an attribute
of the element.of the element.
Data areData are labels or nameslabels or names used to identify an attributeused to identify an attribute
of the element.of the element.
Modelling and Statistical Analysis of Environmental
Systems
Modelling and Statistical Analysis of Environmental
Systems
Amity Business School, Noida
2. ORDINAL SCALE
AA non-numeric labelnon-numeric label oror numeric codenumeric code may be used.may be used.AA non-numeric labelnon-numeric label oror numeric codenumeric code may be used.may be used.
The data have the properties of nominal data andThe data have the properties of nominal data and
thethe order or rank of the data is meaningfulorder or rank of the data is meaningful..
The data have the properties of nominal data andThe data have the properties of nominal data and
thethe order or rank of the data is meaningfulorder or rank of the data is meaningful..
Modelling and Statistical Analysis of Environmental
Systems
Modelling and Statistical Analysis of Environmental
Systems
Amity Business School, Noida
• Ordinal
Example:Example:
Observer provide rating of water quality of the above mentioned sampleObserver provide rating of water quality of the above mentioned sample
sites as good, poor and very poor.sites as good, poor and very poor. Because the data obtained are the labels—
good, poor or very poor—the data have the properties of nominal data. In
addition, the data can be ranked, or ordered, with respect to the water quality.
Data recorded as good indicate the best quality, followed by poor and very
poor. Thus, the scale of measurement is ordinal. Note that the ordinal data can
also be recorded using a numeric code. Code 1 for good, 2 for poor and 3Code 1 for good, 2 for poor and 3
for very poorfor very poor..
Modelling and Statistical Analysis of Environmental
Systems
Modelling and Statistical Analysis of Environmental
Systems
Amity Business School, Noida
3. INTERVAL SCALE
Interval data areInterval data are always numericalways numeric..Interval data areInterval data are always numericalways numeric..
The data have the properties of ordinal data, andThe data have the properties of ordinal data, and
the interval between observations is expressed inthe interval between observations is expressed in
terms of a fixed unit of measure.terms of a fixed unit of measure.
The data have the properties of ordinal data, andThe data have the properties of ordinal data, and
the interval between observations is expressed inthe interval between observations is expressed in
terms of a fixed unit of measure.terms of a fixed unit of measure.
Amity Business School, Noida
Interval
Example:Example:
BOD of sample point 1 is 4.2 mg/l and sampleBOD of sample point 1 is 4.2 mg/l and sample
point 2 is 3.4mg/l. Sample point 1 has more BODpoint 2 is 3.4mg/l. Sample point 1 has more BOD
than sample point 2 by 0.8mg/l. Similarly samplethan sample point 2 by 0.8mg/l. Similarly sample
Point 3 has more BOD than sample point 2 by 8.6 mg/lPoint 3 has more BOD than sample point 2 by 8.6 mg/l
Modelling and Statistical Analysis of Environmental
Systems
Modelling and Statistical Analysis of Environmental
Systems
Amity Business School, Noida
4. RATIO SCALE
The data have all the properties of interval dataThe data have all the properties of interval data
and theand the ratio of two values is meaningfulratio of two values is meaningful..
The data have all the properties of interval dataThe data have all the properties of interval data
and theand the ratio of two values is meaningfulratio of two values is meaningful..
Variables such as distance, height, weight, and timeVariables such as distance, height, weight, and time
use the ratio scale.use the ratio scale.
Variables such as distance, height, weight, and timeVariables such as distance, height, weight, and time
use the ratio scale.use the ratio scale.
ThisThis scale must contain a zero valuescale must contain a zero value that indicatesthat indicates
that nothing exists for the variable at the zero point.that nothing exists for the variable at the zero point.
ThisThis scale must contain a zero valuescale must contain a zero value that indicatesthat indicates
that nothing exists for the variable at the zero point.that nothing exists for the variable at the zero point.
Modelling and Statistical Analysis of Environmental
Systems
Modelling and Statistical Analysis of Environmental
Systems
Amity Business School, Noida
• Ratio
Example:Example:
The BOD at a specific location of a River was 6 mg/lThe BOD at a specific location of a River was 6 mg/l
during pre-monsoon season while it was increased to 12during pre-monsoon season while it was increased to 12
mg/l during post monsoon season. Ratio shows that themg/l during post monsoon season. Ratio shows that the
BOD during post- monsoon season is double the BODBOD during post- monsoon season is double the BOD
During pre-monsoon season.During pre-monsoon season.
Modelling and Statistical Analysis of Environmental
Systems
Modelling and Statistical Analysis of Environmental
Systems
Amity Business School, Noida
Data can be further classified as being qualitativeData can be further classified as being qualitative
or quantitative.or quantitative.
Data can be further classified as being qualitativeData can be further classified as being qualitative
or quantitative.or quantitative.
The statistical analysis that is appropriate dependsThe statistical analysis that is appropriate depends
on whether the data for the variable are qualitativeon whether the data for the variable are qualitative
or quantitative.or quantitative.
The statistical analysis that is appropriate dependsThe statistical analysis that is appropriate depends
on whether the data for the variable are qualitativeon whether the data for the variable are qualitative
or quantitative.or quantitative.
In general, there are more alternatives for statisticalIn general, there are more alternatives for statistical
analysis when the data are quantitative.analysis when the data are quantitative.
In general, there are more alternatives for statisticalIn general, there are more alternatives for statistical
analysis when the data are quantitative.analysis when the data are quantitative.
QUALITATIVE AND QUANTITATIVE DATAQUALITATIVE AND QUANTITATIVE DATA
Modelling and Statistical Analysis of Environmental
Systems
Modelling and Statistical Analysis of Environmental
Systems
Amity Business School, Noida
QUALITATIVE DATA
Labels or namesLabels or names used to identify an attribute of eachused to identify an attribute of each
elementelement
Labels or namesLabels or names used to identify an attribute of eachused to identify an attribute of each
elementelement
Often referred to asOften referred to as categorical datacategorical dataOften referred to asOften referred to as categorical datacategorical data
Use either the nominal or ordinal scale of measurementUse either the nominal or ordinal scale of measurementUse either the nominal or ordinal scale of measurementUse either the nominal or ordinal scale of measurement
Can be either numeric or nonnumericCan be either numeric or nonnumericCan be either numeric or nonnumericCan be either numeric or nonnumeric
Appropriate statistical analyses are rather limitedAppropriate statistical analyses are rather limitedAppropriate statistical analyses are rather limitedAppropriate statistical analyses are rather limited
Modelling and Statistical Analysis of Environmental
Systems
Modelling and Statistical Analysis of Environmental
Systems
Amity Business School, Noida
QUANTITATIVE DATAQUANTITATIVE DATA
Quantitative data indicateQuantitative data indicate how many or how much:how many or how much:Quantitative data indicateQuantitative data indicate how many or how much:how many or how much:
discretediscrete, if measuring how many, if measuring how manydiscretediscrete, if measuring how many, if measuring how many
continuouscontinuous, if measuring how much, if measuring how muchcontinuouscontinuous, if measuring how much, if measuring how much
Quantitative data areQuantitative data are always numericalways numeric..Quantitative data areQuantitative data are always numericalways numeric..
Quantitative data are obtained using either the interval or
ratio scale of measurement.
Quantitative data are obtained using either the interval or
ratio scale of measurement.
Modelling and Statistical Analysis of Environmental
Systems
Modelling and Statistical Analysis of Environmental
Systems
Amity Business School, Noida
SCALES OF MEASUREMENTSCALES OF MEASUREMENT
QualitativeQualitativeQualitativeQualitative QuantitativeQuantitativeQuantitativeQuantitative
NumericalNumericalNumericalNumerical NumericalNumericalNumericalNumericalNon-numericalNon-numericalNon-numericalNon-numerical
DataDataDataData
NominalNominalNominalNominal OrdinalOrdinalOrdinalOrdinal NominalNominalNominalNominal OrdinalOrdinalOrdinalOrdinal IntervalIntervalIntervalInterval RatioRatioRatioRatio
Modelling and Statistical Analysis of Environmental
Systems
Modelling and Statistical Analysis of Environmental
Systems
Amity Business School, Noida
CROSS-SECTIONAL DATACROSS-SECTIONAL DATA
Cross-sectional dataCross-sectional data are collected at the same orare collected at the same or
approximately the same point in time.approximately the same point in time.
Cross-sectional dataCross-sectional data are collected at the same orare collected at the same or
approximately the same point in time.approximately the same point in time.
ExampleExample: Data detailing the water quality parameters: Data detailing the water quality parameters
of Gomti River of all the 5 sample points in June 2007.of Gomti River of all the 5 sample points in June 2007.
ExampleExample: Data detailing the water quality parameters: Data detailing the water quality parameters
of Gomti River of all the 5 sample points in June 2007.of Gomti River of all the 5 sample points in June 2007.
Modelling and Statistical Analysis of Environmental
Systems
Modelling and Statistical Analysis of Environmental
Systems
Amity Business School, Noida
TIME SERIES DATATIME SERIES DATA
Time series dataTime series data are collected over several timeare collected over several time
periods.periods.
Time series dataTime series data are collected over several timeare collected over several time
periods.periods.
ExampleExample: Data detailing the water quality parameters: Data detailing the water quality parameters
of Gomti River of all the 5 sample points of the lastof Gomti River of all the 5 sample points of the last
36 months.36 months.
ExampleExample: Data detailing the water quality parameters: Data detailing the water quality parameters
of Gomti River of all the 5 sample points of the lastof Gomti River of all the 5 sample points of the last
36 months.36 months.
Modelling and Statistical Analysis of Environmental
Systems
Modelling and Statistical Analysis of Environmental
Systems
Amity Business School, Noida
DESCRIPTIVE STATISTICS
• Descriptive statistics are the tabular, graphical,
and numerical methods used to summarize and
present data.
Modelling and Statistical Analysis of Environmental
Systems
Modelling and Statistical Analysis of Environmental
Systems
Amity Business School, Noida
TDS (ppm) for 50 samples of a groundwater of aTDS (ppm) for 50 samples of a groundwater of a
districtdistrict
91 78 93 57 75 52 99 80 97 62
71 69 72 89 66 75 79 75 72 76
104 74 62 68 97 105 77 65 80 109
85 97 88 68 83 68 71 69 67 74
62 82 98 101 79 105 79 69 62 73
91 78 93 57 75 52 99 80 97 62
71 69 72 89 66 75 79 75 72 76
104 74 62 68 97 105 77 65 80 109
85 97 88 68 83 68 71 69 67 74
62 82 98 101 79 105 79 69 62 73
Modelling and Statistical Analysis of Environmental
Systems
Modelling and Statistical Analysis of Environmental
Systems
Amity Business School, Noida
NUMERICAL DESCRIPTIVE STATISTICS
 TDS of the groundwater of an area , based on the 50TDS of the groundwater of an area , based on the 50
samples studied, is 79ppm (found by summing thesamples studied, is 79ppm (found by summing the
50 TDS values and then dividing by 50).50 TDS values and then dividing by 50).
 The most common numerical descriptive statisticThe most common numerical descriptive statistic
is theis the averageaverage (or(or meanmean).).
Modelling and Statistical Analysis of Environmental
Systems
Modelling and Statistical Analysis of Environmental
Systems
Amity Business School, Noida
STATISTICAL INFERENCESTATISTICAL INFERENCE
PopulationPopulationPopulationPopulation
SampleSampleSampleSample
Statistical inferenceStatistical inferenceStatistical inferenceStatistical inference
CensusCensusCensusCensus
Sample surveySample surveySample surveySample survey
−− the set of all elements of interest in athe set of all elements of interest in a
particular studyparticular study
−− a subset of the populationa subset of the population
−− the process of using data obtainedthe process of using data obtained
from a sample to make estimatesfrom a sample to make estimates
and test hypotheses about theand test hypotheses about the
characteristics of a populationcharacteristics of a population
−− collecting data for a populationcollecting data for a population
−− collecting data for a samplecollecting data for a sample
Modelling and Statistical Analysis of Environmental
Systems
Modelling and Statistical Analysis of Environmental
Systems
Amity Business School, Noida
COMPUTERS AND STATISTICAL ANALYSIS
 Statistical analysis typically involves working withStatistical analysis typically involves working with
large amounts of datalarge amounts of data..
 Computer softwareComputer software is typically used to conduct theis typically used to conduct the
analysis.analysis.
Modelling and Statistical Analysis of Environmental
Systems
Modelling and Statistical Analysis of Environmental
Systems
Amity Business School, Noida
DESCRIPTIVE STATISTICS:
TABULAR AND GRAPHICAL PRESENTATIONS
• Summarizing Qualitative Data
• Summarizing Quantitative Data
Modelling and Statistical Analysis of Environmental
Systems
Modelling and Statistical Analysis of Environmental
Systems
Amity Business School, Noida
SUMMARIZING QUALITATIVE DATA
• Frequency Distribution
• Relative Frequency Distribution
• Percent Frequency Distribution
• Bar Graphs
• Pie Charts
Modelling and Statistical Analysis of Environmental
Systems
Modelling and Statistical Analysis of Environmental
Systems
Amity Business School, Noida
AA frequency distributionfrequency distribution is a tabular summary ofis a tabular summary of
data showing the frequency (or number) of itemsdata showing the frequency (or number) of items
in each of several non-overlapping classes.in each of several non-overlapping classes.
AA frequency distributionfrequency distribution is a tabular summary ofis a tabular summary of
data showing the frequency (or number) of itemsdata showing the frequency (or number) of items
in each of several non-overlapping classes.in each of several non-overlapping classes.
The objective is toThe objective is to provide insightsprovide insights about the dataabout the data
that cannot be quickly obtained by looking only atthat cannot be quickly obtained by looking only at
the original data.the original data.
The objective is toThe objective is to provide insightsprovide insights about the dataabout the data
that cannot be quickly obtained by looking only atthat cannot be quickly obtained by looking only at
the original data.the original data.
FREQUENCY DISTRIBUTIONFREQUENCY DISTRIBUTION
Modelling and Statistical Analysis of Environmental
Systems
Modelling and Statistical Analysis of Environmental
Systems
Amity Business School, Noida
TABULAR SUMMARY:
FREQUENCY AND PERCENT FREQUENCY
Very GoodVery Good
GoodGood
Above AverageAbove Average
AverageAverage
PoorPoor
Very PoorVery Poor
22
1313
1616
77
77
55
5050
44
2626
3232
1414
1414
1010
100100
(2/50)100(2/50)100(2/50)100(2/50)100
WaterWater
QualityQuality
FrequencyFrequency
DistributionDistribution
PercentPercent
FrequencyFrequency
For example groundwater quality of 50 samples
Amity Business School, Noida
TheThe relative frequencyrelative frequency of a class is the fraction orof a class is the fraction or
proportion of the total number of data itemsproportion of the total number of data items
belonging to the class.belonging to the class.
TheThe relative frequencyrelative frequency of a class is the fraction orof a class is the fraction or
proportion of the total number of data itemsproportion of the total number of data items
belonging to the class.belonging to the class.
AA relative frequency distributionrelative frequency distribution is a tabularis a tabular
summary of a set of data showing the relativesummary of a set of data showing the relative
frequency for each class.frequency for each class.
AA relative frequency distributionrelative frequency distribution is a tabularis a tabular
summary of a set of data showing the relativesummary of a set of data showing the relative
frequency for each class.frequency for each class.
RELATIVE FREQUENCY DISTRIBUTIONRELATIVE FREQUENCY DISTRIBUTION
Modelling and Statistical Analysis of Environmental
Systems
Modelling and Statistical Analysis of Environmental
Systems
Amity Business School, Noida
PERCENT FREQUENCY DISTRIBUTION
TheThe percent frequencypercent frequency of a class is the relativeof a class is the relative
frequency multiplied by 100.frequency multiplied by 100.
TheThe percent frequencypercent frequency of a class is the relativeof a class is the relative
frequency multiplied by 100.frequency multiplied by 100.
AA percent frequency distributionpercent frequency distribution is a tabularis a tabular
summary of a set of data showing the percentsummary of a set of data showing the percent
frequency for each class.frequency for each class.
AA percent frequency distributionpercent frequency distribution is a tabularis a tabular
summary of a set of data showing the percentsummary of a set of data showing the percent
frequency for each class.frequency for each class.
Modelling and Statistical Analysis of Environmental
Systems
Modelling and Statistical Analysis of Environmental
Systems
Amity Business School, Noida
RELATIVE FREQUENCY AND PERCENT FREQUENCY DISTRIBUTIONSRELATIVE FREQUENCY AND PERCENT FREQUENCY DISTRIBUTIONS
Very GoodVery Good
GoodGood
Above AverageAbove Average
AverageAverage
PoorPoor
Very PoorVery Poor
.04.04
.26.26
.32.32
.14.14
.14.14
.10.10
TotalTotal 1.001.00
0404
2626
3232
1414
1414
1010
100100
RelativeRelative
FrequencyFrequency
PercentPercent
FrequencyFrequencyRatingRating
.04(100) = 4.04(100) = 4.04(100) = 4.04(100) = 4
5/50 = .105/50 = .105/50 = .105/50 = .10
Modelling and Statistical Analysis of Environmental
Systems
Modelling and Statistical Analysis of Environmental
Systems
Amity Business School, Noida
BAR GRAPH
 AA bar graphbar graph is a graphical device for depictingis a graphical device for depicting
qualitative data.qualitative data.
 On one axis (usually the horizontal axis), we specifyOn one axis (usually the horizontal axis), we specify
the labels that are used for each of the classes.the labels that are used for each of the classes.
 AA frequencyfrequency,, relative frequencyrelative frequency, or, or percent frequencypercent frequency
scale can be used for the other axis (usually thescale can be used for the other axis (usually the
vertical axis).vertical axis).
 Using aUsing a bar of fixed widthbar of fixed width drawn above each classdrawn above each class
label, we extend the height appropriately.label, we extend the height appropriately.
 TheThe bars are separatedbars are separated to emphasize the fact that eachto emphasize the fact that each
class is a separate category.class is a separate category.
Modelling and Statistical Analysis of Environmental
Systems
Modelling and Statistical Analysis of Environmental
Systems
Amity Business School, Noida
Poor Below
Average
Average Above
Average
Excellent
Frequency
Rating
1
2
3
4
5
6
7
8
9
10 Water Quality RatingsWater Quality RatingsWater Quality RatingsWater Quality Ratings
Modelling and Statistical Analysis of Environmental
Systems
Modelling and Statistical Analysis of Environmental
Systems
Amity Business School, Noida
PIE CHART
 TheThe pie chartpie chart is a commonly used graphical deviceis a commonly used graphical device
for presenting relative frequency distributions forfor presenting relative frequency distributions for
qualitative data.qualitative data.
First draw aFirst draw a circlecircle; then use the relative; then use the relative
frequencies to subdivide the circlefrequencies to subdivide the circle
into sectors that correspond to theinto sectors that correspond to the
relative frequency for each class.relative frequency for each class.
Since there are 360 degrees in a circle,Since there are 360 degrees in a circle,
a class with a relative frequency of .25 woulda class with a relative frequency of .25 would
consume .25(360) = 90 degrees of the circle.consume .25(360) = 90 degrees of the circle.
Modelling and Statistical Analysis of Environmental
Systems
Modelling and Statistical Analysis of Environmental
Systems
Amity Business School, Noida
Below
Average
15%
Average
25%
Above
Average
45%
Poor
10%
Excellent
5%
Watrer Quality RatingsWatrer Quality RatingsWatrer Quality RatingsWatrer Quality Ratings
Modelling and Statistical Analysis of Environmental
Systems
Modelling and Statistical Analysis of Environmental
Systems
Amity Business School, Noida
SUMMARIZING QUANTITATIVE DATA
• Frequency Distribution
• Relative Frequency Distribution
• Percent Frequency Distribution
• Histogram
• Cumulative Distributions
• Ogive
Modelling and Statistical Analysis of Environmental
Systems
Modelling and Statistical Analysis of Environmental
Systems
Amity Business School, Noida
TDS (ppm) for 50 samples of a groundwater of aTDS (ppm) for 50 samples of a groundwater of a
districtdistrict
91 78 93 57 75 52 99 80 97 62
71 69 72 89 66 75 79 75 72 76
104 74 62 68 97 105 77 65 80 109
85 97 88 68 83 68 71 69 67 74
62 82 98 101 79 105 79 69 62 73
91 78 93 57 75 52 99 80 97 62
71 69 72 89 66 75 79 75 72 76
104 74 62 68 97 105 77 65 80 109
85 97 88 68 83 68 71 69 67 74
62 82 98 101 79 105 79 69 62 73
Modelling and Statistical Analysis of Environmental
Systems
Modelling and Statistical Analysis of Environmental
Systems
Amity Business School, Noida
FREQUENCY DISTRIBUTION
• Guidelines for Selecting Width of Classes
Largest Data Value Smallest Data Value
Number of Classes
−
• Use classes of equal width.Use classes of equal width.
• Approximate Class Width =Approximate Class Width =
Modelling and Statistical Analysis of Environmental
Systems
Modelling and Statistical Analysis of Environmental
Systems
Amity Business School, Noida
50-5950-59
60-6960-69
70-7970-79
80-8980-89
90-9990-99
100-109100-109
22
1313
1616
77
77
55
Total 50Total 50
TDS(ppm)TDS(ppm) FrequencyFrequency
Approximate Class Width = (109 - 52)/6 = 9.5Approximate Class Width = (109 - 52)/6 = 9.5 ≅≅ 1010
Modelling and Statistical Analysis of Environmental
Systems
Modelling and Statistical Analysis of Environmental
Systems
Amity Business School, Noida
RELATIVE FREQUENCY AND
PERCENT FREQUENCY DISTRIBUTIONS
50-5950-59
60-6960-69
70-7970-79
80-8980-89
90-9990-99
100-109100-109
TDSTDS(ppm(ppm))
.04.04
.26.26
.32.32
.14.14
.14.14
.10.10
Total 1.00Total 1.00
RelativeRelative
FrequencyFrequency
44
2626
3232
1414
1414
1010
100100
PercentPercent
FrequencyFrequency
2/502/502/502/50 .04(100).04(100).04(100).04(100)
Modelling and Statistical Analysis of Environmental
Systems
Modelling and Statistical Analysis of Environmental
Systems
Amity Business School, Noida
• Only 4% of the 50 samples have TDS in the 50-59 class.Only 4% of the 50 samples have TDS in the 50-59 class.
• The greatest percentage (32% or almost one-third)The greatest percentage (32% or almost one-third)
of the samples have TDS in the 70-79 class.of the samples have TDS in the 70-79 class.
• 30% of the samples have TDS under 70ppm.30% of the samples have TDS under 70ppm.
• 10% of the samples have TDS of 100ppm or more.10% of the samples have TDS of 100ppm or more.
Insights Gained from the Percent FrequencyInsights Gained from the Percent Frequency
DistributionDistribution
RELATIVE FREQUENCY ANDRELATIVE FREQUENCY AND
PERCENT FREQUENCY DISTRIBUTIONSPERCENT FREQUENCY DISTRIBUTIONS
Modelling and Statistical Analysis of Environmental
Systems
Modelling and Statistical Analysis of Environmental
Systems
Amity Business School, Noida
DOT PLOTDOT PLOT
One of the simplest graphical summaries of data is aOne of the simplest graphical summaries of data is a
dot plotdot plot..
A horizontal axis shows the range of data values.A horizontal axis shows the range of data values.
Then each data value is represented by a dot placedThen each data value is represented by a dot placed
above the axis.above the axis.
Modelling and Statistical Analysis of Environmental
Systems
Modelling and Statistical Analysis of Environmental
Systems
Amity Business School, Noida
5050 6060 7070 8080 9090 100100 110110
TDS (ppm)
Groundwater samples (TDS)Groundwater samples (TDS)
Modelling and Statistical Analysis of Environmental
Systems
Modelling and Statistical Analysis of Environmental
Systems
Amity Business School, Noida
HISTOGRAM
 Another common graphical presentation ofAnother common graphical presentation of
quantitative data is aquantitative data is a histogramhistogram..
 The variable of interest is placed on the horizontalThe variable of interest is placed on the horizontal
axis.axis.
 A rectangle is drawn above each class interval withA rectangle is drawn above each class interval with
its height corresponding to the interval’sits height corresponding to the interval’s frequencyfrequency,,
relative frequencyrelative frequency, or, or percent frequencypercent frequency..
 Unlike a bar graph, a histogram hasUnlike a bar graph, a histogram has no naturalno natural
separation between rectanglesseparation between rectangles of adjacent classes.of adjacent classes.
Modelling and Statistical Analysis of Environmental
Systems
Modelling and Statistical Analysis of Environmental
Systems
Amity Business School, Noida
GRAPHICAL SUMMARY: HISTOGRAM
2
4
6
8
10
12
14
16
18
TDS(ppm)
Frequency
50−59 60−69 70−79 80−89 90−99 100-110
TDSTDSTDSTDS
Amity Business School, Noida
• SYMMETRIC HISTOGRAM
– Left tail is the mirror image of the right tailRelativeFrequency
.05
.10
.15
.20
.25
.30
.35
0
Modelling and Statistical Analysis of Environmental
Systems
Modelling and Statistical Analysis of Environmental
Systems
Amity Business School, Noida
• MODERATELY SKEWED LEFT
– A longer tail to the leftRelativeFrequency
.05
.10
.15
.20
.25
.30
.35
0
Modelling and Statistical Analysis of Environmental
Systems
Modelling and Statistical Analysis of Environmental
Systems
Amity Business School, Noida
• MODERATELY RIGHT SKEWED
– A longer tail to the rightRelativeFrequency
.05
.10
.15
.20
.25
.30
.35
0
Modelling and Statistical Analysis of Environmental
Systems
Modelling and Statistical Analysis of Environmental
Systems
Amity Business School, Noida
• HIGHLY SKEWED RIGHT
– A very long tail to the right
RelativeFrequency
.05
.10
.15
.20
.25
.30
.35
0
Modelling and Statistical Analysis of Environmental
Systems
Modelling and Statistical Analysis of Environmental
Systems
Amity Business School, Noida
Cumulative frequency distributionCumulative frequency distribution −− shows theshows the
numbernumber of items with values less than or equal to theof items with values less than or equal to the
upper limit of each class..upper limit of each class..
Cumulative frequency distributionCumulative frequency distribution −− shows theshows the
numbernumber of items with values less than or equal to theof items with values less than or equal to the
upper limit of each class..upper limit of each class..
Cumulative relative frequency distributionCumulative relative frequency distribution – shows– shows
thethe proportionproportion of items with values less than orof items with values less than or
equal to the upper limit of each class.equal to the upper limit of each class.
Cumulative relative frequency distributionCumulative relative frequency distribution – shows– shows
thethe proportionproportion of items with values less than orof items with values less than or
equal to the upper limit of each class.equal to the upper limit of each class.
CUMULATIVE DISTRIBUTIONSCUMULATIVE DISTRIBUTIONS
Cumulative percent frequency distributionCumulative percent frequency distribution – shows– shows
thethe percentagepercentage of items with values less than orof items with values less than or
equal to the upper limit of each class.equal to the upper limit of each class.
Cumulative percent frequency distributionCumulative percent frequency distribution – shows– shows
thethe percentagepercentage of items with values less than orof items with values less than or
equal to the upper limit of each class.equal to the upper limit of each class.
Modelling and Statistical Analysis of Environmental
Systems
Modelling and Statistical Analysis of Environmental
Systems
Amity Business School, Noida
<< 5959
<< 6969
<< 7979
<< 8989
<< 9999
<< 109109
TDS (ppm)TDS (ppm)
CumulativeCumulative
FrequencyFrequency
CumulativeCumulative
RelativeRelative
FrequencyFrequency
CumulativeCumulative
PercentPercent
FrequencyFrequency
22
1515
3131
3838
4545
5050
.04.04
.30.30
.62.62
.76.76
.90.90
1.001.00
44
3030
6262
7676
9090
100100
2 + 132 + 132 + 132 + 13 15/5015/5015/5015/50 .30(100).30(100).30(100).30(100)
Modelling and Statistical Analysis of Environmental
Systems
Modelling and Statistical Analysis of Environmental
Systems
Amity Business School, Noida
OGIVEOGIVE
AnAn ogiveogive is a graph of a cumulative distribution.is a graph of a cumulative distribution.
The data values are shown on the horizontal axis.The data values are shown on the horizontal axis.
Shown on the vertical axis are the:Shown on the vertical axis are the:
• cumulative frequencies, orcumulative frequencies, or
• cumulative relative frequencies, orcumulative relative frequencies, or
• cumulative percent frequenciescumulative percent frequencies
The frequency (one of the above) of each class isThe frequency (one of the above) of each class is
plotted as a point.plotted as a point.
The plotted points are connected by straight lines.The plotted points are connected by straight lines.
Modelling and Statistical Analysis of Environmental
Systems
Modelling and Statistical Analysis of Environmental
Systems
Amity Business School, Noida
• Because the class limits for the groundwater TDSBecause the class limits for the groundwater TDS
data are 50-59, 60-69, and so on, there appear to bedata are 50-59, 60-69, and so on, there appear to be
one-unit gaps from 59 to 60, 69 to 70, and so on.one-unit gaps from 59 to 60, 69 to 70, and so on.
• These gaps are eliminated by plotting pointsThese gaps are eliminated by plotting points
halfway between the class limits.halfway between the class limits.
• Thus, 59.5 is used for the 50-59 class, 69.5 is usedThus, 59.5 is used for the 50-59 class, 69.5 is used
for the 60-69 class, and so on.for the 60-69 class, and so on.
Modelling and Statistical Analysis of Environmental
Systems
Modelling and Statistical Analysis of Environmental
Systems
Amity Business School, Noida
TDSTDS
20
40
60
80
100
CumulativePercentFrequencyCumulativePercentFrequency
50 60 70 80 90 100 11050 60 70 80 90 100 110
(89.5, 76)(89.5, 76)
Ogive with Cumulative Percent FrequenciesOgive with Cumulative Percent Frequencies
Modelling and Statistical Analysis of Environmental
Systems
Modelling and Statistical Analysis of Environmental
Systems
Amity Business School, Noida
THANK YOU
54
Modelling and Statistical Analysis of Environmental
Systems
Modelling and Statistical Analysis of Environmental
Systems

Modelling and statistical analysis

  • 1.
    Amity Business School,Noida Amity Institute of Environmental Sciences (AIES) Semester III Modelling and Statistical Analysis of Environmental Systems Ms. Shivangi Somvanshi ssomvanshi@amity.edu 1 Modelling and Statistical Analysis of Environmental Systems Modelling and Statistical Analysis of Environmental Systems
  • 2.
    Amity Business School,Noida DATA AND DATA SETS • Data are the facts and figures collected, summarized, analyzed, and interpreted. • The data collected in a particular study areThe data collected in a particular study are referred to as thereferred to as the data setdata set.. Modelling and Statistical Analysis of Environmental Systems Modelling and Statistical Analysis of Environmental Systems
  • 3.
    Amity Business School,Noida TheThe elementselements are the entities on which data are collected.are the entities on which data are collected. AA variablevariable is a characteristic of interest for the elementsis a characteristic of interest for the elements.. The set of measurements collected for a particular element isThe set of measurements collected for a particular element is called ancalled an observationobservation.. The total number of data values in a complete data set is theThe total number of data values in a complete data set is the number of elements multiplied by the number of variables.number of elements multiplied by the number of variables. ELEMENTS, VARIABLES, AND OBSERVATIONSELEMENTS, VARIABLES, AND OBSERVATIONS Modelling and Statistical Analysis of Environmental Systems Modelling and Statistical Analysis of Environmental Systems
  • 4.
    Amity Business School,Noida PositionPosition BODBOD DODO THTHSample sitesSample sites (Gomti River)(Gomti River) Bhatpur (S.P.1)Bhatpur (S.P.1) Gaughat (S.P.2)Gaughat (S.P.2) M.Meakins (S.P.3)M.Meakins (S.P.3) Pipraghat (S.P.4)Pipraghat (S.P.4) Gangaganj (S.P.5)Gangaganj (S.P.5) USUS 4.24.2 6.96.9 184184 USUS 3.43.4 7.17.1 198198 DSDS 1212 2.42.4 200200 USUS 16.516.5 1.31.3 208208 DSDS 11 4.311 4.3 170170 VariablesVariables ElementElement NamesNames Data SetData Set ObservationObservation Modelling and Statistical Analysis of Environmental Systems Modelling and Statistical Analysis of Environmental Systems
  • 5.
    Amity Business School,Noida SCALES OF MEASUREMENT The scale indicates the data summarization and statisticalThe scale indicates the data summarization and statistical analyses that are most appropriate.analyses that are most appropriate. The scale indicates the data summarization and statisticalThe scale indicates the data summarization and statistical analyses that are most appropriate.analyses that are most appropriate. The scale determines the amount of information containedThe scale determines the amount of information contained in the data.in the data. The scale determines the amount of information containedThe scale determines the amount of information contained in the data.in the data. Scales of measurement include:Scales of measurement include:Scales of measurement include:Scales of measurement include: NominalNominal OrdinalOrdinal IntervalInterval RatioRatio Modelling and Statistical Analysis of Environmental Systems Modelling and Statistical Analysis of Environmental Systems
  • 6.
    Amity Business School,Noida 1. NOMINAL SCALE AA non-numeric labelnon-numeric label oror numeric codenumeric code may be used.may be used.AA non-numeric labelnon-numeric label oror numeric codenumeric code may be used.may be used. Data areData are labels or nameslabels or names used to identify an attributeused to identify an attribute of the element.of the element. Data areData are labels or nameslabels or names used to identify an attributeused to identify an attribute of the element.of the element. Modelling and Statistical Analysis of Environmental Systems Modelling and Statistical Analysis of Environmental Systems
  • 7.
    Amity Business School,Noida 2. ORDINAL SCALE AA non-numeric labelnon-numeric label oror numeric codenumeric code may be used.may be used.AA non-numeric labelnon-numeric label oror numeric codenumeric code may be used.may be used. The data have the properties of nominal data andThe data have the properties of nominal data and thethe order or rank of the data is meaningfulorder or rank of the data is meaningful.. The data have the properties of nominal data andThe data have the properties of nominal data and thethe order or rank of the data is meaningfulorder or rank of the data is meaningful.. Modelling and Statistical Analysis of Environmental Systems Modelling and Statistical Analysis of Environmental Systems
  • 8.
    Amity Business School,Noida • Ordinal Example:Example: Observer provide rating of water quality of the above mentioned sampleObserver provide rating of water quality of the above mentioned sample sites as good, poor and very poor.sites as good, poor and very poor. Because the data obtained are the labels— good, poor or very poor—the data have the properties of nominal data. In addition, the data can be ranked, or ordered, with respect to the water quality. Data recorded as good indicate the best quality, followed by poor and very poor. Thus, the scale of measurement is ordinal. Note that the ordinal data can also be recorded using a numeric code. Code 1 for good, 2 for poor and 3Code 1 for good, 2 for poor and 3 for very poorfor very poor.. Example:Example: Observer provide rating of water quality of the above mentioned sampleObserver provide rating of water quality of the above mentioned sample sites as good, poor and very poor.sites as good, poor and very poor. Because the data obtained are the labels— good, poor or very poor—the data have the properties of nominal data. In addition, the data can be ranked, or ordered, with respect to the water quality. Data recorded as good indicate the best quality, followed by poor and very poor. Thus, the scale of measurement is ordinal. Note that the ordinal data can also be recorded using a numeric code. Code 1 for good, 2 for poor and 3Code 1 for good, 2 for poor and 3 for very poorfor very poor.. Modelling and Statistical Analysis of Environmental Systems Modelling and Statistical Analysis of Environmental Systems
  • 9.
    Amity Business School,Noida 3. INTERVAL SCALE Interval data areInterval data are always numericalways numeric..Interval data areInterval data are always numericalways numeric.. The data have the properties of ordinal data, andThe data have the properties of ordinal data, and the interval between observations is expressed inthe interval between observations is expressed in terms of a fixed unit of measure.terms of a fixed unit of measure. The data have the properties of ordinal data, andThe data have the properties of ordinal data, and the interval between observations is expressed inthe interval between observations is expressed in terms of a fixed unit of measure.terms of a fixed unit of measure.
  • 10.
    Amity Business School,Noida Interval Example:Example: BOD of sample point 1 is 4.2 mg/l and sampleBOD of sample point 1 is 4.2 mg/l and sample point 2 is 3.4mg/l. Sample point 1 has more BODpoint 2 is 3.4mg/l. Sample point 1 has more BOD than sample point 2 by 0.8mg/l. Similarly samplethan sample point 2 by 0.8mg/l. Similarly sample Point 3 has more BOD than sample point 2 by 8.6 mg/lPoint 3 has more BOD than sample point 2 by 8.6 mg/l Example:Example: BOD of sample point 1 is 4.2 mg/l and sampleBOD of sample point 1 is 4.2 mg/l and sample point 2 is 3.4mg/l. Sample point 1 has more BODpoint 2 is 3.4mg/l. Sample point 1 has more BOD than sample point 2 by 0.8mg/l. Similarly samplethan sample point 2 by 0.8mg/l. Similarly sample Point 3 has more BOD than sample point 2 by 8.6 mg/lPoint 3 has more BOD than sample point 2 by 8.6 mg/l Modelling and Statistical Analysis of Environmental Systems Modelling and Statistical Analysis of Environmental Systems
  • 11.
    Amity Business School,Noida 4. RATIO SCALE The data have all the properties of interval dataThe data have all the properties of interval data and theand the ratio of two values is meaningfulratio of two values is meaningful.. The data have all the properties of interval dataThe data have all the properties of interval data and theand the ratio of two values is meaningfulratio of two values is meaningful.. Variables such as distance, height, weight, and timeVariables such as distance, height, weight, and time use the ratio scale.use the ratio scale. Variables such as distance, height, weight, and timeVariables such as distance, height, weight, and time use the ratio scale.use the ratio scale. ThisThis scale must contain a zero valuescale must contain a zero value that indicatesthat indicates that nothing exists for the variable at the zero point.that nothing exists for the variable at the zero point. ThisThis scale must contain a zero valuescale must contain a zero value that indicatesthat indicates that nothing exists for the variable at the zero point.that nothing exists for the variable at the zero point. Modelling and Statistical Analysis of Environmental Systems Modelling and Statistical Analysis of Environmental Systems
  • 12.
    Amity Business School,Noida • Ratio Example:Example: The BOD at a specific location of a River was 6 mg/lThe BOD at a specific location of a River was 6 mg/l during pre-monsoon season while it was increased to 12during pre-monsoon season while it was increased to 12 mg/l during post monsoon season. Ratio shows that themg/l during post monsoon season. Ratio shows that the BOD during post- monsoon season is double the BODBOD during post- monsoon season is double the BOD During pre-monsoon season.During pre-monsoon season. Example:Example: The BOD at a specific location of a River was 6 mg/lThe BOD at a specific location of a River was 6 mg/l during pre-monsoon season while it was increased to 12during pre-monsoon season while it was increased to 12 mg/l during post monsoon season. Ratio shows that themg/l during post monsoon season. Ratio shows that the BOD during post- monsoon season is double the BODBOD during post- monsoon season is double the BOD During pre-monsoon season.During pre-monsoon season. Modelling and Statistical Analysis of Environmental Systems Modelling and Statistical Analysis of Environmental Systems
  • 13.
    Amity Business School,Noida Data can be further classified as being qualitativeData can be further classified as being qualitative or quantitative.or quantitative. Data can be further classified as being qualitativeData can be further classified as being qualitative or quantitative.or quantitative. The statistical analysis that is appropriate dependsThe statistical analysis that is appropriate depends on whether the data for the variable are qualitativeon whether the data for the variable are qualitative or quantitative.or quantitative. The statistical analysis that is appropriate dependsThe statistical analysis that is appropriate depends on whether the data for the variable are qualitativeon whether the data for the variable are qualitative or quantitative.or quantitative. In general, there are more alternatives for statisticalIn general, there are more alternatives for statistical analysis when the data are quantitative.analysis when the data are quantitative. In general, there are more alternatives for statisticalIn general, there are more alternatives for statistical analysis when the data are quantitative.analysis when the data are quantitative. QUALITATIVE AND QUANTITATIVE DATAQUALITATIVE AND QUANTITATIVE DATA Modelling and Statistical Analysis of Environmental Systems Modelling and Statistical Analysis of Environmental Systems
  • 14.
    Amity Business School,Noida QUALITATIVE DATA Labels or namesLabels or names used to identify an attribute of eachused to identify an attribute of each elementelement Labels or namesLabels or names used to identify an attribute of eachused to identify an attribute of each elementelement Often referred to asOften referred to as categorical datacategorical dataOften referred to asOften referred to as categorical datacategorical data Use either the nominal or ordinal scale of measurementUse either the nominal or ordinal scale of measurementUse either the nominal or ordinal scale of measurementUse either the nominal or ordinal scale of measurement Can be either numeric or nonnumericCan be either numeric or nonnumericCan be either numeric or nonnumericCan be either numeric or nonnumeric Appropriate statistical analyses are rather limitedAppropriate statistical analyses are rather limitedAppropriate statistical analyses are rather limitedAppropriate statistical analyses are rather limited Modelling and Statistical Analysis of Environmental Systems Modelling and Statistical Analysis of Environmental Systems
  • 15.
    Amity Business School,Noida QUANTITATIVE DATAQUANTITATIVE DATA Quantitative data indicateQuantitative data indicate how many or how much:how many or how much:Quantitative data indicateQuantitative data indicate how many or how much:how many or how much: discretediscrete, if measuring how many, if measuring how manydiscretediscrete, if measuring how many, if measuring how many continuouscontinuous, if measuring how much, if measuring how muchcontinuouscontinuous, if measuring how much, if measuring how much Quantitative data areQuantitative data are always numericalways numeric..Quantitative data areQuantitative data are always numericalways numeric.. Quantitative data are obtained using either the interval or ratio scale of measurement. Quantitative data are obtained using either the interval or ratio scale of measurement. Modelling and Statistical Analysis of Environmental Systems Modelling and Statistical Analysis of Environmental Systems
  • 16.
    Amity Business School,Noida SCALES OF MEASUREMENTSCALES OF MEASUREMENT QualitativeQualitativeQualitativeQualitative QuantitativeQuantitativeQuantitativeQuantitative NumericalNumericalNumericalNumerical NumericalNumericalNumericalNumericalNon-numericalNon-numericalNon-numericalNon-numerical DataDataDataData NominalNominalNominalNominal OrdinalOrdinalOrdinalOrdinal NominalNominalNominalNominal OrdinalOrdinalOrdinalOrdinal IntervalIntervalIntervalInterval RatioRatioRatioRatio Modelling and Statistical Analysis of Environmental Systems Modelling and Statistical Analysis of Environmental Systems
  • 17.
    Amity Business School,Noida CROSS-SECTIONAL DATACROSS-SECTIONAL DATA Cross-sectional dataCross-sectional data are collected at the same orare collected at the same or approximately the same point in time.approximately the same point in time. Cross-sectional dataCross-sectional data are collected at the same orare collected at the same or approximately the same point in time.approximately the same point in time. ExampleExample: Data detailing the water quality parameters: Data detailing the water quality parameters of Gomti River of all the 5 sample points in June 2007.of Gomti River of all the 5 sample points in June 2007. ExampleExample: Data detailing the water quality parameters: Data detailing the water quality parameters of Gomti River of all the 5 sample points in June 2007.of Gomti River of all the 5 sample points in June 2007. Modelling and Statistical Analysis of Environmental Systems Modelling and Statistical Analysis of Environmental Systems
  • 18.
    Amity Business School,Noida TIME SERIES DATATIME SERIES DATA Time series dataTime series data are collected over several timeare collected over several time periods.periods. Time series dataTime series data are collected over several timeare collected over several time periods.periods. ExampleExample: Data detailing the water quality parameters: Data detailing the water quality parameters of Gomti River of all the 5 sample points of the lastof Gomti River of all the 5 sample points of the last 36 months.36 months. ExampleExample: Data detailing the water quality parameters: Data detailing the water quality parameters of Gomti River of all the 5 sample points of the lastof Gomti River of all the 5 sample points of the last 36 months.36 months. Modelling and Statistical Analysis of Environmental Systems Modelling and Statistical Analysis of Environmental Systems
  • 19.
    Amity Business School,Noida DESCRIPTIVE STATISTICS • Descriptive statistics are the tabular, graphical, and numerical methods used to summarize and present data. Modelling and Statistical Analysis of Environmental Systems Modelling and Statistical Analysis of Environmental Systems
  • 20.
    Amity Business School,Noida TDS (ppm) for 50 samples of a groundwater of aTDS (ppm) for 50 samples of a groundwater of a districtdistrict 91 78 93 57 75 52 99 80 97 62 71 69 72 89 66 75 79 75 72 76 104 74 62 68 97 105 77 65 80 109 85 97 88 68 83 68 71 69 67 74 62 82 98 101 79 105 79 69 62 73 91 78 93 57 75 52 99 80 97 62 71 69 72 89 66 75 79 75 72 76 104 74 62 68 97 105 77 65 80 109 85 97 88 68 83 68 71 69 67 74 62 82 98 101 79 105 79 69 62 73 Modelling and Statistical Analysis of Environmental Systems Modelling and Statistical Analysis of Environmental Systems
  • 21.
    Amity Business School,Noida NUMERICAL DESCRIPTIVE STATISTICS  TDS of the groundwater of an area , based on the 50TDS of the groundwater of an area , based on the 50 samples studied, is 79ppm (found by summing thesamples studied, is 79ppm (found by summing the 50 TDS values and then dividing by 50).50 TDS values and then dividing by 50).  The most common numerical descriptive statisticThe most common numerical descriptive statistic is theis the averageaverage (or(or meanmean).). Modelling and Statistical Analysis of Environmental Systems Modelling and Statistical Analysis of Environmental Systems
  • 22.
    Amity Business School,Noida STATISTICAL INFERENCESTATISTICAL INFERENCE PopulationPopulationPopulationPopulation SampleSampleSampleSample Statistical inferenceStatistical inferenceStatistical inferenceStatistical inference CensusCensusCensusCensus Sample surveySample surveySample surveySample survey −− the set of all elements of interest in athe set of all elements of interest in a particular studyparticular study −− a subset of the populationa subset of the population −− the process of using data obtainedthe process of using data obtained from a sample to make estimatesfrom a sample to make estimates and test hypotheses about theand test hypotheses about the characteristics of a populationcharacteristics of a population −− collecting data for a populationcollecting data for a population −− collecting data for a samplecollecting data for a sample Modelling and Statistical Analysis of Environmental Systems Modelling and Statistical Analysis of Environmental Systems
  • 23.
    Amity Business School,Noida COMPUTERS AND STATISTICAL ANALYSIS  Statistical analysis typically involves working withStatistical analysis typically involves working with large amounts of datalarge amounts of data..  Computer softwareComputer software is typically used to conduct theis typically used to conduct the analysis.analysis. Modelling and Statistical Analysis of Environmental Systems Modelling and Statistical Analysis of Environmental Systems
  • 24.
    Amity Business School,Noida DESCRIPTIVE STATISTICS: TABULAR AND GRAPHICAL PRESENTATIONS • Summarizing Qualitative Data • Summarizing Quantitative Data Modelling and Statistical Analysis of Environmental Systems Modelling and Statistical Analysis of Environmental Systems
  • 25.
    Amity Business School,Noida SUMMARIZING QUALITATIVE DATA • Frequency Distribution • Relative Frequency Distribution • Percent Frequency Distribution • Bar Graphs • Pie Charts Modelling and Statistical Analysis of Environmental Systems Modelling and Statistical Analysis of Environmental Systems
  • 26.
    Amity Business School,Noida AA frequency distributionfrequency distribution is a tabular summary ofis a tabular summary of data showing the frequency (or number) of itemsdata showing the frequency (or number) of items in each of several non-overlapping classes.in each of several non-overlapping classes. AA frequency distributionfrequency distribution is a tabular summary ofis a tabular summary of data showing the frequency (or number) of itemsdata showing the frequency (or number) of items in each of several non-overlapping classes.in each of several non-overlapping classes. The objective is toThe objective is to provide insightsprovide insights about the dataabout the data that cannot be quickly obtained by looking only atthat cannot be quickly obtained by looking only at the original data.the original data. The objective is toThe objective is to provide insightsprovide insights about the dataabout the data that cannot be quickly obtained by looking only atthat cannot be quickly obtained by looking only at the original data.the original data. FREQUENCY DISTRIBUTIONFREQUENCY DISTRIBUTION Modelling and Statistical Analysis of Environmental Systems Modelling and Statistical Analysis of Environmental Systems
  • 27.
    Amity Business School,Noida TABULAR SUMMARY: FREQUENCY AND PERCENT FREQUENCY Very GoodVery Good GoodGood Above AverageAbove Average AverageAverage PoorPoor Very PoorVery Poor 22 1313 1616 77 77 55 5050 44 2626 3232 1414 1414 1010 100100 (2/50)100(2/50)100(2/50)100(2/50)100 WaterWater QualityQuality FrequencyFrequency DistributionDistribution PercentPercent FrequencyFrequency For example groundwater quality of 50 samples
  • 28.
    Amity Business School,Noida TheThe relative frequencyrelative frequency of a class is the fraction orof a class is the fraction or proportion of the total number of data itemsproportion of the total number of data items belonging to the class.belonging to the class. TheThe relative frequencyrelative frequency of a class is the fraction orof a class is the fraction or proportion of the total number of data itemsproportion of the total number of data items belonging to the class.belonging to the class. AA relative frequency distributionrelative frequency distribution is a tabularis a tabular summary of a set of data showing the relativesummary of a set of data showing the relative frequency for each class.frequency for each class. AA relative frequency distributionrelative frequency distribution is a tabularis a tabular summary of a set of data showing the relativesummary of a set of data showing the relative frequency for each class.frequency for each class. RELATIVE FREQUENCY DISTRIBUTIONRELATIVE FREQUENCY DISTRIBUTION Modelling and Statistical Analysis of Environmental Systems Modelling and Statistical Analysis of Environmental Systems
  • 29.
    Amity Business School,Noida PERCENT FREQUENCY DISTRIBUTION TheThe percent frequencypercent frequency of a class is the relativeof a class is the relative frequency multiplied by 100.frequency multiplied by 100. TheThe percent frequencypercent frequency of a class is the relativeof a class is the relative frequency multiplied by 100.frequency multiplied by 100. AA percent frequency distributionpercent frequency distribution is a tabularis a tabular summary of a set of data showing the percentsummary of a set of data showing the percent frequency for each class.frequency for each class. AA percent frequency distributionpercent frequency distribution is a tabularis a tabular summary of a set of data showing the percentsummary of a set of data showing the percent frequency for each class.frequency for each class. Modelling and Statistical Analysis of Environmental Systems Modelling and Statistical Analysis of Environmental Systems
  • 30.
    Amity Business School,Noida RELATIVE FREQUENCY AND PERCENT FREQUENCY DISTRIBUTIONSRELATIVE FREQUENCY AND PERCENT FREQUENCY DISTRIBUTIONS Very GoodVery Good GoodGood Above AverageAbove Average AverageAverage PoorPoor Very PoorVery Poor .04.04 .26.26 .32.32 .14.14 .14.14 .10.10 TotalTotal 1.001.00 0404 2626 3232 1414 1414 1010 100100 RelativeRelative FrequencyFrequency PercentPercent FrequencyFrequencyRatingRating .04(100) = 4.04(100) = 4.04(100) = 4.04(100) = 4 5/50 = .105/50 = .105/50 = .105/50 = .10 Modelling and Statistical Analysis of Environmental Systems Modelling and Statistical Analysis of Environmental Systems
  • 31.
    Amity Business School,Noida BAR GRAPH  AA bar graphbar graph is a graphical device for depictingis a graphical device for depicting qualitative data.qualitative data.  On one axis (usually the horizontal axis), we specifyOn one axis (usually the horizontal axis), we specify the labels that are used for each of the classes.the labels that are used for each of the classes.  AA frequencyfrequency,, relative frequencyrelative frequency, or, or percent frequencypercent frequency scale can be used for the other axis (usually thescale can be used for the other axis (usually the vertical axis).vertical axis).  Using aUsing a bar of fixed widthbar of fixed width drawn above each classdrawn above each class label, we extend the height appropriately.label, we extend the height appropriately.  TheThe bars are separatedbars are separated to emphasize the fact that eachto emphasize the fact that each class is a separate category.class is a separate category. Modelling and Statistical Analysis of Environmental Systems Modelling and Statistical Analysis of Environmental Systems
  • 32.
    Amity Business School,Noida Poor Below Average Average Above Average Excellent Frequency Rating 1 2 3 4 5 6 7 8 9 10 Water Quality RatingsWater Quality RatingsWater Quality RatingsWater Quality Ratings Modelling and Statistical Analysis of Environmental Systems Modelling and Statistical Analysis of Environmental Systems
  • 33.
    Amity Business School,Noida PIE CHART  TheThe pie chartpie chart is a commonly used graphical deviceis a commonly used graphical device for presenting relative frequency distributions forfor presenting relative frequency distributions for qualitative data.qualitative data. First draw aFirst draw a circlecircle; then use the relative; then use the relative frequencies to subdivide the circlefrequencies to subdivide the circle into sectors that correspond to theinto sectors that correspond to the relative frequency for each class.relative frequency for each class. Since there are 360 degrees in a circle,Since there are 360 degrees in a circle, a class with a relative frequency of .25 woulda class with a relative frequency of .25 would consume .25(360) = 90 degrees of the circle.consume .25(360) = 90 degrees of the circle. Modelling and Statistical Analysis of Environmental Systems Modelling and Statistical Analysis of Environmental Systems
  • 34.
    Amity Business School,Noida Below Average 15% Average 25% Above Average 45% Poor 10% Excellent 5% Watrer Quality RatingsWatrer Quality RatingsWatrer Quality RatingsWatrer Quality Ratings Modelling and Statistical Analysis of Environmental Systems Modelling and Statistical Analysis of Environmental Systems
  • 35.
    Amity Business School,Noida SUMMARIZING QUANTITATIVE DATA • Frequency Distribution • Relative Frequency Distribution • Percent Frequency Distribution • Histogram • Cumulative Distributions • Ogive Modelling and Statistical Analysis of Environmental Systems Modelling and Statistical Analysis of Environmental Systems
  • 36.
    Amity Business School,Noida TDS (ppm) for 50 samples of a groundwater of aTDS (ppm) for 50 samples of a groundwater of a districtdistrict 91 78 93 57 75 52 99 80 97 62 71 69 72 89 66 75 79 75 72 76 104 74 62 68 97 105 77 65 80 109 85 97 88 68 83 68 71 69 67 74 62 82 98 101 79 105 79 69 62 73 91 78 93 57 75 52 99 80 97 62 71 69 72 89 66 75 79 75 72 76 104 74 62 68 97 105 77 65 80 109 85 97 88 68 83 68 71 69 67 74 62 82 98 101 79 105 79 69 62 73 Modelling and Statistical Analysis of Environmental Systems Modelling and Statistical Analysis of Environmental Systems
  • 37.
    Amity Business School,Noida FREQUENCY DISTRIBUTION • Guidelines for Selecting Width of Classes Largest Data Value Smallest Data Value Number of Classes − • Use classes of equal width.Use classes of equal width. • Approximate Class Width =Approximate Class Width = Modelling and Statistical Analysis of Environmental Systems Modelling and Statistical Analysis of Environmental Systems
  • 38.
    Amity Business School,Noida 50-5950-59 60-6960-69 70-7970-79 80-8980-89 90-9990-99 100-109100-109 22 1313 1616 77 77 55 Total 50Total 50 TDS(ppm)TDS(ppm) FrequencyFrequency Approximate Class Width = (109 - 52)/6 = 9.5Approximate Class Width = (109 - 52)/6 = 9.5 ≅≅ 1010 Modelling and Statistical Analysis of Environmental Systems Modelling and Statistical Analysis of Environmental Systems
  • 39.
    Amity Business School,Noida RELATIVE FREQUENCY AND PERCENT FREQUENCY DISTRIBUTIONS 50-5950-59 60-6960-69 70-7970-79 80-8980-89 90-9990-99 100-109100-109 TDSTDS(ppm(ppm)) .04.04 .26.26 .32.32 .14.14 .14.14 .10.10 Total 1.00Total 1.00 RelativeRelative FrequencyFrequency 44 2626 3232 1414 1414 1010 100100 PercentPercent FrequencyFrequency 2/502/502/502/50 .04(100).04(100).04(100).04(100) Modelling and Statistical Analysis of Environmental Systems Modelling and Statistical Analysis of Environmental Systems
  • 40.
    Amity Business School,Noida • Only 4% of the 50 samples have TDS in the 50-59 class.Only 4% of the 50 samples have TDS in the 50-59 class. • The greatest percentage (32% or almost one-third)The greatest percentage (32% or almost one-third) of the samples have TDS in the 70-79 class.of the samples have TDS in the 70-79 class. • 30% of the samples have TDS under 70ppm.30% of the samples have TDS under 70ppm. • 10% of the samples have TDS of 100ppm or more.10% of the samples have TDS of 100ppm or more. Insights Gained from the Percent FrequencyInsights Gained from the Percent Frequency DistributionDistribution RELATIVE FREQUENCY ANDRELATIVE FREQUENCY AND PERCENT FREQUENCY DISTRIBUTIONSPERCENT FREQUENCY DISTRIBUTIONS Modelling and Statistical Analysis of Environmental Systems Modelling and Statistical Analysis of Environmental Systems
  • 41.
    Amity Business School,Noida DOT PLOTDOT PLOT One of the simplest graphical summaries of data is aOne of the simplest graphical summaries of data is a dot plotdot plot.. A horizontal axis shows the range of data values.A horizontal axis shows the range of data values. Then each data value is represented by a dot placedThen each data value is represented by a dot placed above the axis.above the axis. Modelling and Statistical Analysis of Environmental Systems Modelling and Statistical Analysis of Environmental Systems
  • 42.
    Amity Business School,Noida 5050 6060 7070 8080 9090 100100 110110 TDS (ppm) Groundwater samples (TDS)Groundwater samples (TDS) Modelling and Statistical Analysis of Environmental Systems Modelling and Statistical Analysis of Environmental Systems
  • 43.
    Amity Business School,Noida HISTOGRAM  Another common graphical presentation ofAnother common graphical presentation of quantitative data is aquantitative data is a histogramhistogram..  The variable of interest is placed on the horizontalThe variable of interest is placed on the horizontal axis.axis.  A rectangle is drawn above each class interval withA rectangle is drawn above each class interval with its height corresponding to the interval’sits height corresponding to the interval’s frequencyfrequency,, relative frequencyrelative frequency, or, or percent frequencypercent frequency..  Unlike a bar graph, a histogram hasUnlike a bar graph, a histogram has no naturalno natural separation between rectanglesseparation between rectangles of adjacent classes.of adjacent classes. Modelling and Statistical Analysis of Environmental Systems Modelling and Statistical Analysis of Environmental Systems
  • 44.
    Amity Business School,Noida GRAPHICAL SUMMARY: HISTOGRAM 2 4 6 8 10 12 14 16 18 TDS(ppm) Frequency 50−59 60−69 70−79 80−89 90−99 100-110 TDSTDSTDSTDS
  • 45.
    Amity Business School,Noida • SYMMETRIC HISTOGRAM – Left tail is the mirror image of the right tailRelativeFrequency .05 .10 .15 .20 .25 .30 .35 0 Modelling and Statistical Analysis of Environmental Systems Modelling and Statistical Analysis of Environmental Systems
  • 46.
    Amity Business School,Noida • MODERATELY SKEWED LEFT – A longer tail to the leftRelativeFrequency .05 .10 .15 .20 .25 .30 .35 0 Modelling and Statistical Analysis of Environmental Systems Modelling and Statistical Analysis of Environmental Systems
  • 47.
    Amity Business School,Noida • MODERATELY RIGHT SKEWED – A longer tail to the rightRelativeFrequency .05 .10 .15 .20 .25 .30 .35 0 Modelling and Statistical Analysis of Environmental Systems Modelling and Statistical Analysis of Environmental Systems
  • 48.
    Amity Business School,Noida • HIGHLY SKEWED RIGHT – A very long tail to the right RelativeFrequency .05 .10 .15 .20 .25 .30 .35 0 Modelling and Statistical Analysis of Environmental Systems Modelling and Statistical Analysis of Environmental Systems
  • 49.
    Amity Business School,Noida Cumulative frequency distributionCumulative frequency distribution −− shows theshows the numbernumber of items with values less than or equal to theof items with values less than or equal to the upper limit of each class..upper limit of each class.. Cumulative frequency distributionCumulative frequency distribution −− shows theshows the numbernumber of items with values less than or equal to theof items with values less than or equal to the upper limit of each class..upper limit of each class.. Cumulative relative frequency distributionCumulative relative frequency distribution – shows– shows thethe proportionproportion of items with values less than orof items with values less than or equal to the upper limit of each class.equal to the upper limit of each class. Cumulative relative frequency distributionCumulative relative frequency distribution – shows– shows thethe proportionproportion of items with values less than orof items with values less than or equal to the upper limit of each class.equal to the upper limit of each class. CUMULATIVE DISTRIBUTIONSCUMULATIVE DISTRIBUTIONS Cumulative percent frequency distributionCumulative percent frequency distribution – shows– shows thethe percentagepercentage of items with values less than orof items with values less than or equal to the upper limit of each class.equal to the upper limit of each class. Cumulative percent frequency distributionCumulative percent frequency distribution – shows– shows thethe percentagepercentage of items with values less than orof items with values less than or equal to the upper limit of each class.equal to the upper limit of each class. Modelling and Statistical Analysis of Environmental Systems Modelling and Statistical Analysis of Environmental Systems
  • 50.
    Amity Business School,Noida << 5959 << 6969 << 7979 << 8989 << 9999 << 109109 TDS (ppm)TDS (ppm) CumulativeCumulative FrequencyFrequency CumulativeCumulative RelativeRelative FrequencyFrequency CumulativeCumulative PercentPercent FrequencyFrequency 22 1515 3131 3838 4545 5050 .04.04 .30.30 .62.62 .76.76 .90.90 1.001.00 44 3030 6262 7676 9090 100100 2 + 132 + 132 + 132 + 13 15/5015/5015/5015/50 .30(100).30(100).30(100).30(100) Modelling and Statistical Analysis of Environmental Systems Modelling and Statistical Analysis of Environmental Systems
  • 51.
    Amity Business School,Noida OGIVEOGIVE AnAn ogiveogive is a graph of a cumulative distribution.is a graph of a cumulative distribution. The data values are shown on the horizontal axis.The data values are shown on the horizontal axis. Shown on the vertical axis are the:Shown on the vertical axis are the: • cumulative frequencies, orcumulative frequencies, or • cumulative relative frequencies, orcumulative relative frequencies, or • cumulative percent frequenciescumulative percent frequencies The frequency (one of the above) of each class isThe frequency (one of the above) of each class is plotted as a point.plotted as a point. The plotted points are connected by straight lines.The plotted points are connected by straight lines. Modelling and Statistical Analysis of Environmental Systems Modelling and Statistical Analysis of Environmental Systems
  • 52.
    Amity Business School,Noida • Because the class limits for the groundwater TDSBecause the class limits for the groundwater TDS data are 50-59, 60-69, and so on, there appear to bedata are 50-59, 60-69, and so on, there appear to be one-unit gaps from 59 to 60, 69 to 70, and so on.one-unit gaps from 59 to 60, 69 to 70, and so on. • These gaps are eliminated by plotting pointsThese gaps are eliminated by plotting points halfway between the class limits.halfway between the class limits. • Thus, 59.5 is used for the 50-59 class, 69.5 is usedThus, 59.5 is used for the 50-59 class, 69.5 is used for the 60-69 class, and so on.for the 60-69 class, and so on. Modelling and Statistical Analysis of Environmental Systems Modelling and Statistical Analysis of Environmental Systems
  • 53.
    Amity Business School,Noida TDSTDS 20 40 60 80 100 CumulativePercentFrequencyCumulativePercentFrequency 50 60 70 80 90 100 11050 60 70 80 90 100 110 (89.5, 76)(89.5, 76) Ogive with Cumulative Percent FrequenciesOgive with Cumulative Percent Frequencies Modelling and Statistical Analysis of Environmental Systems Modelling and Statistical Analysis of Environmental Systems
  • 54.
    Amity Business School,Noida THANK YOU 54 Modelling and Statistical Analysis of Environmental Systems Modelling and Statistical Analysis of Environmental Systems