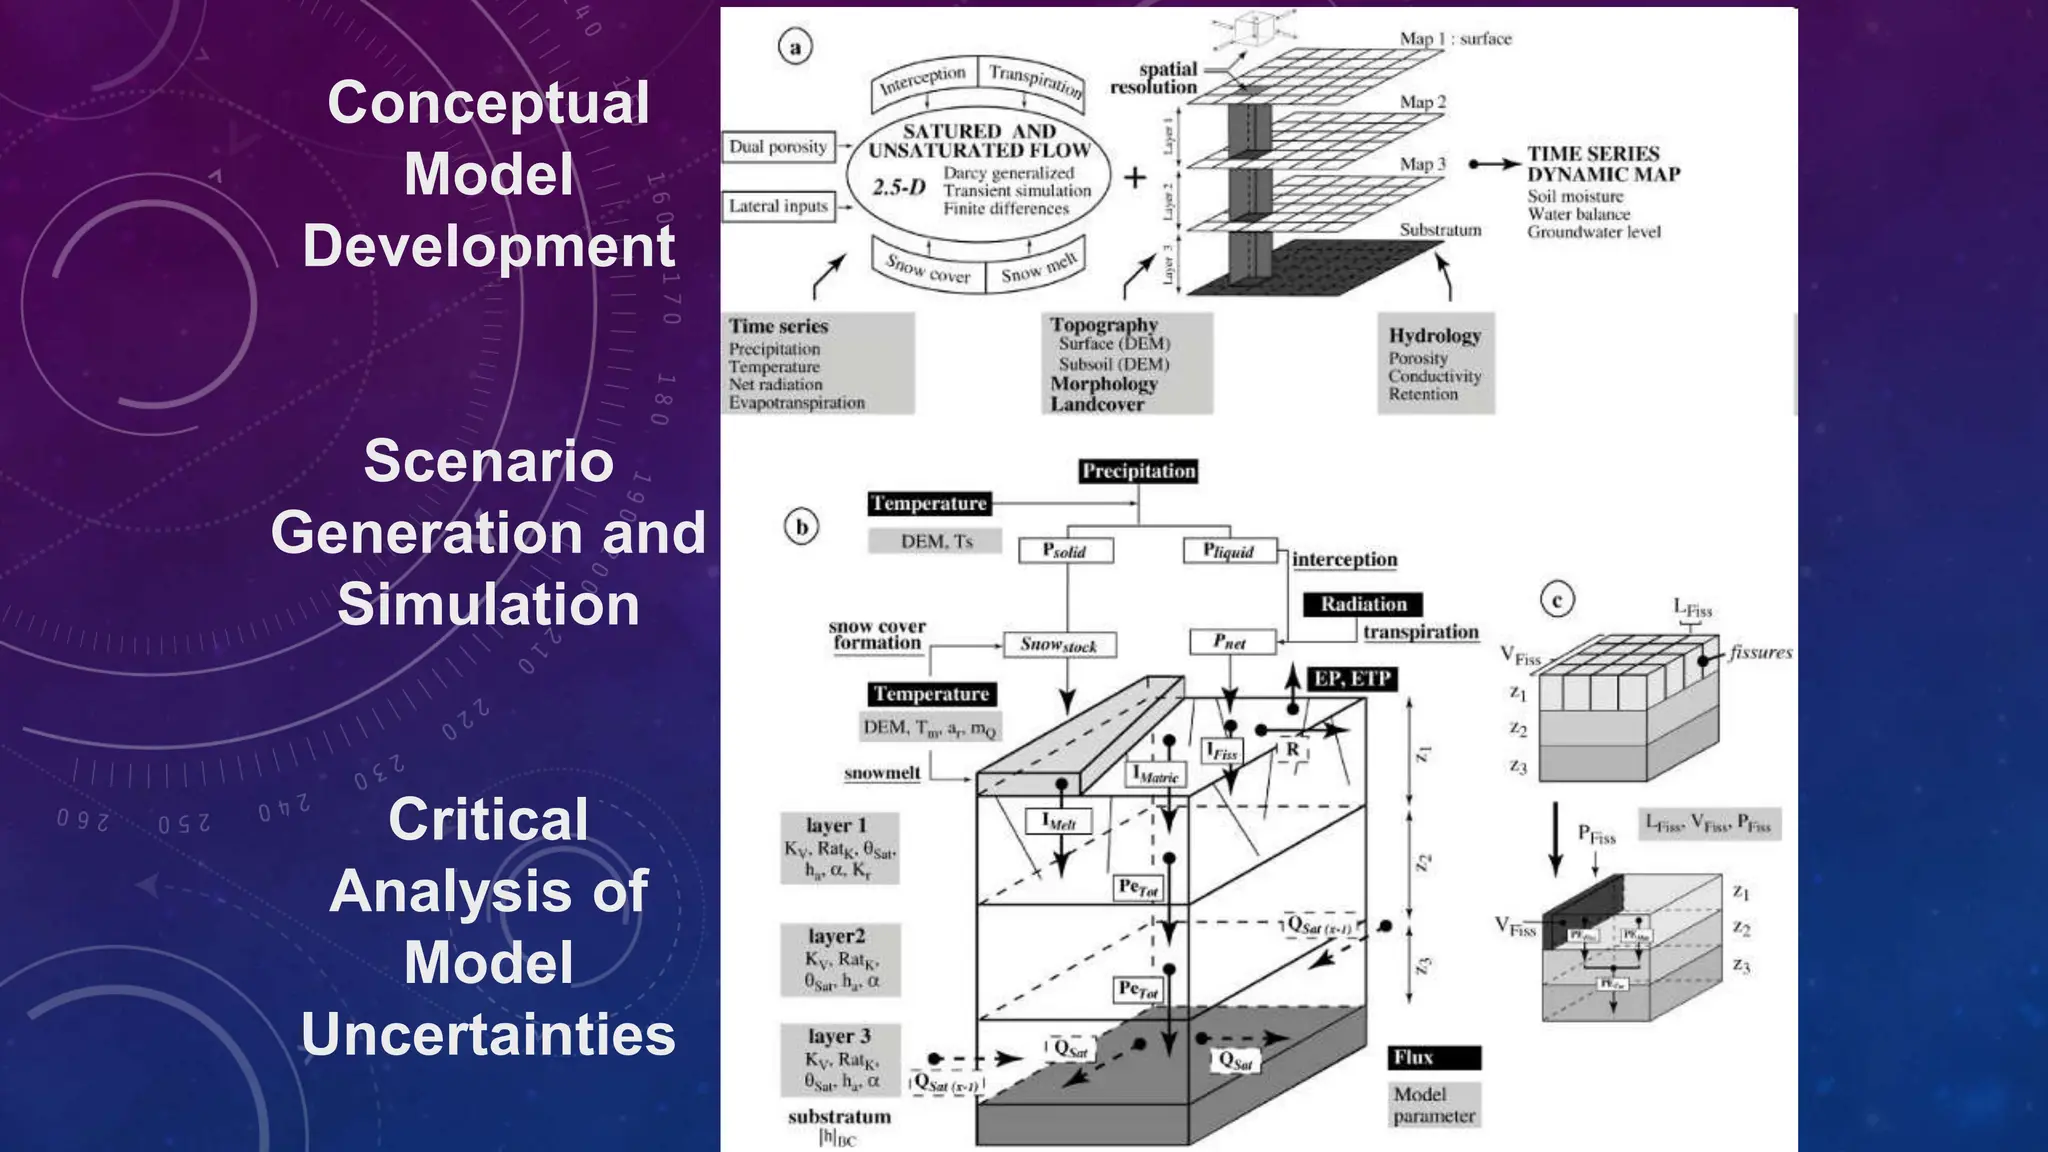
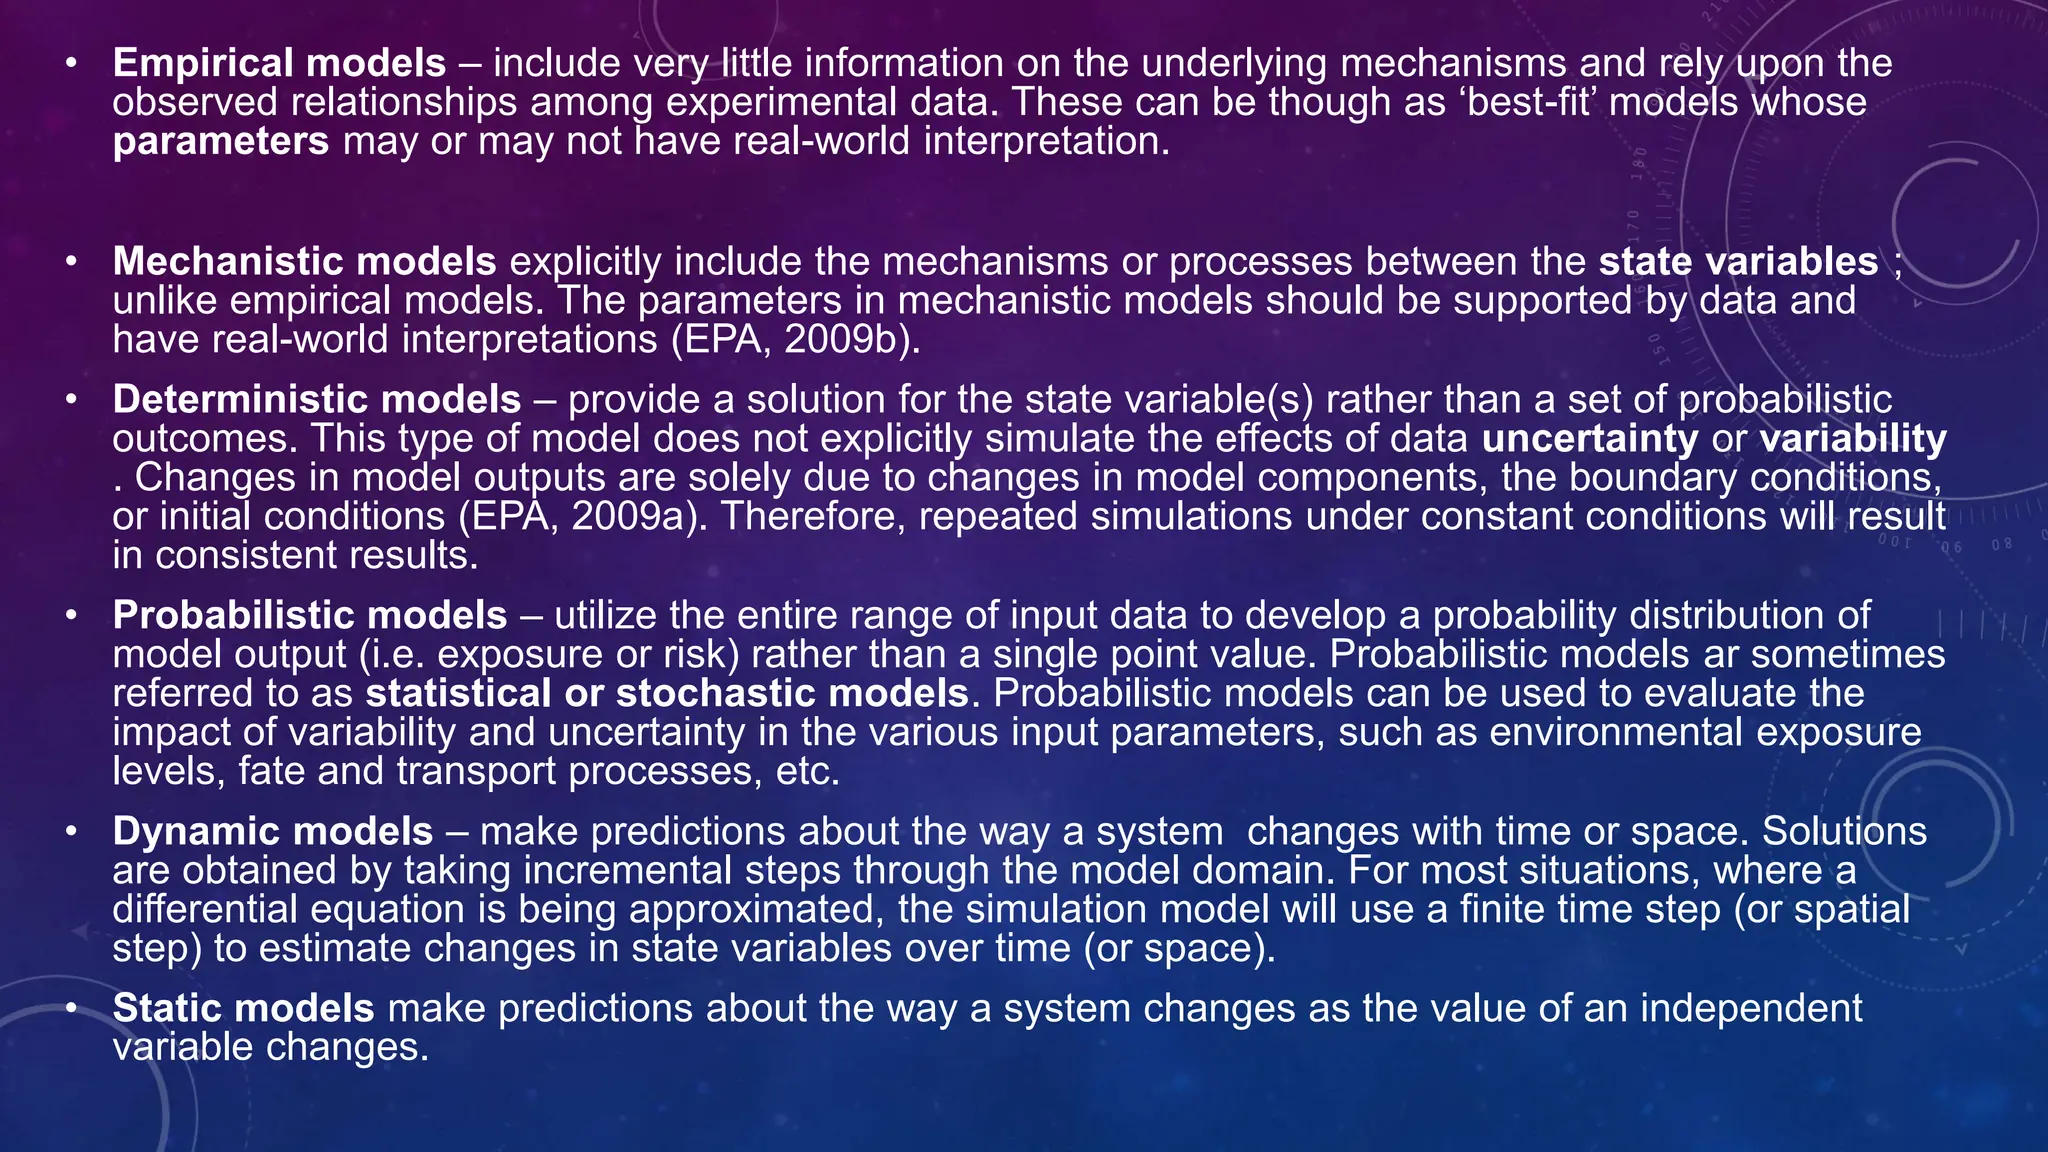
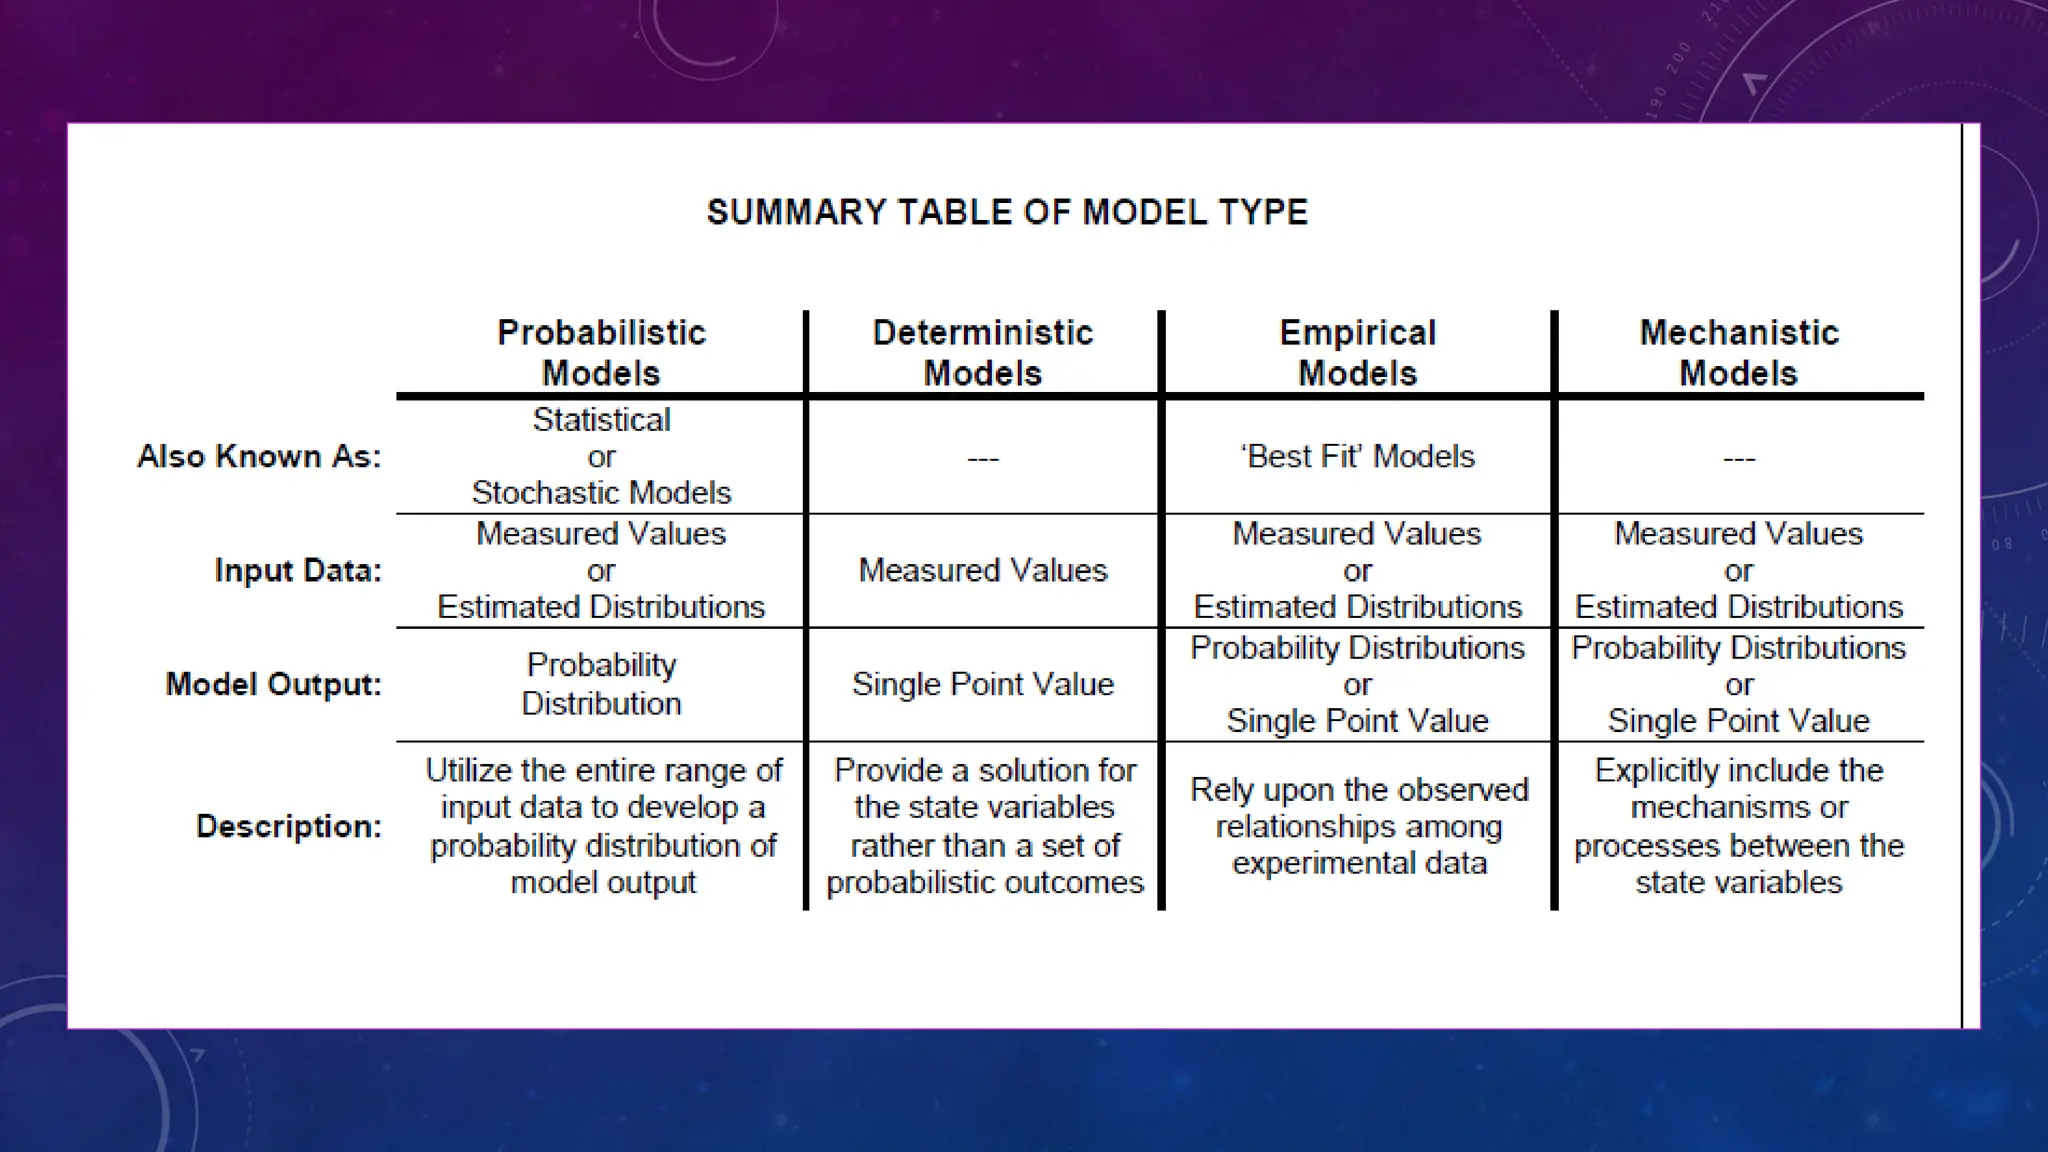
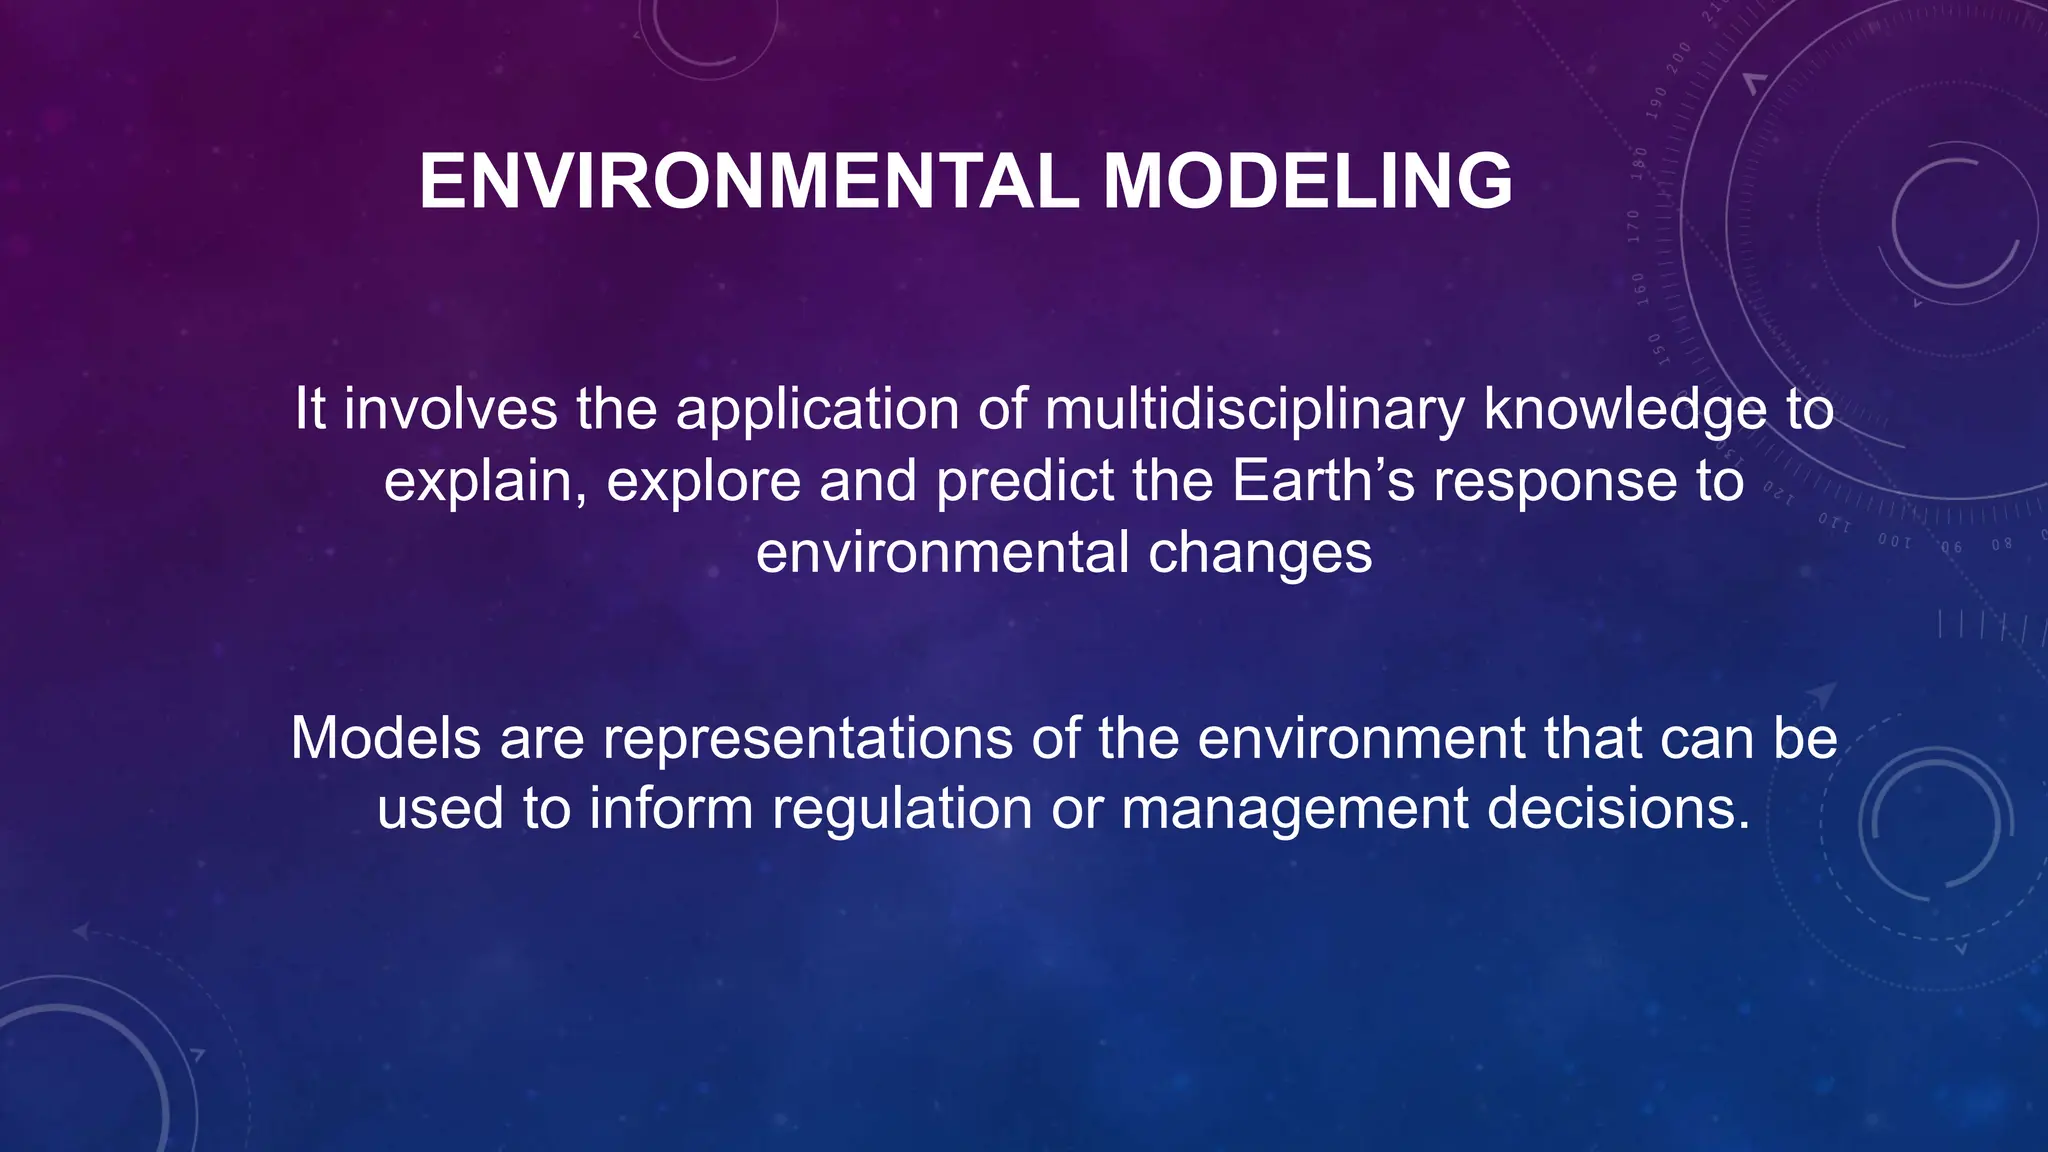
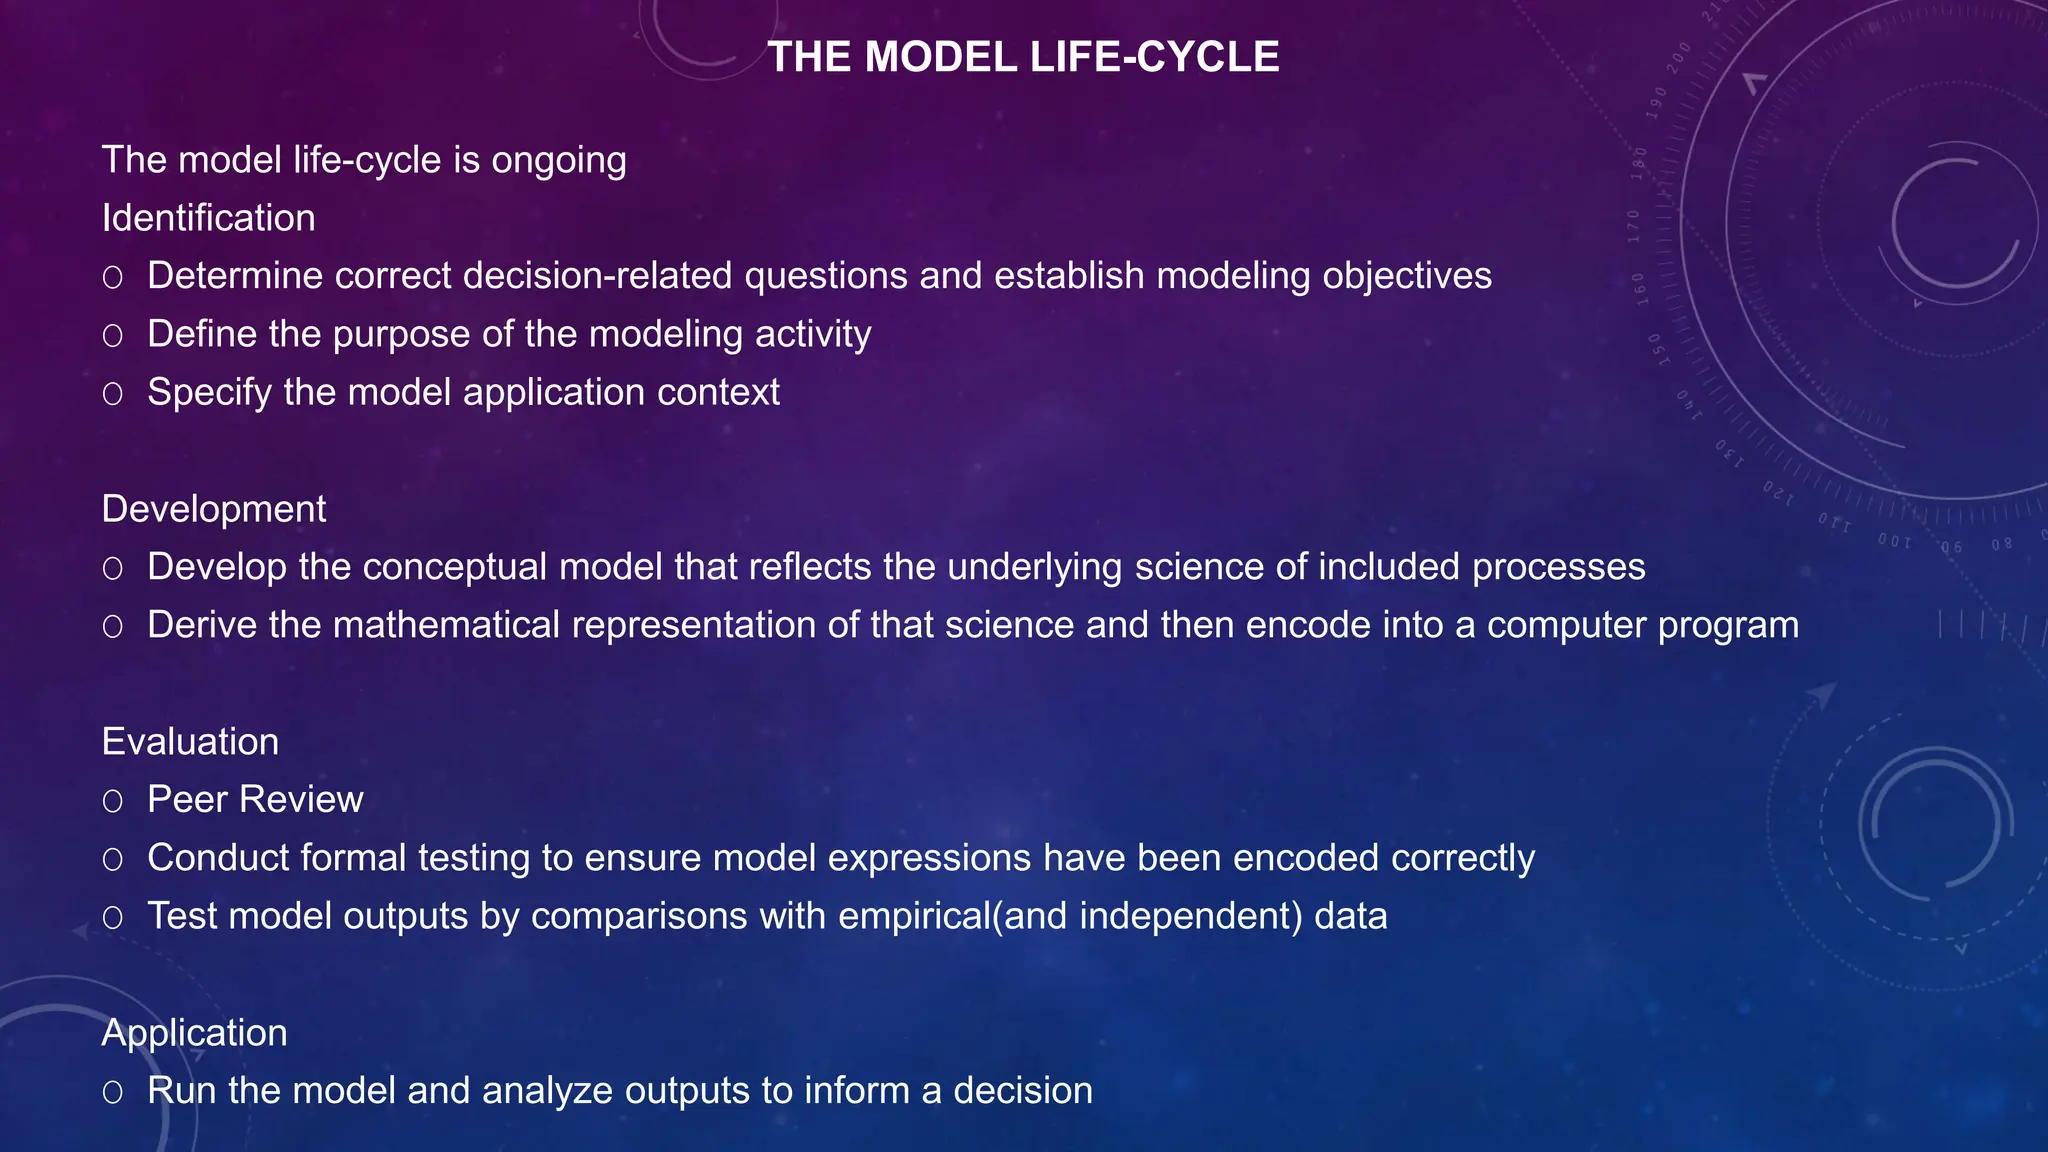
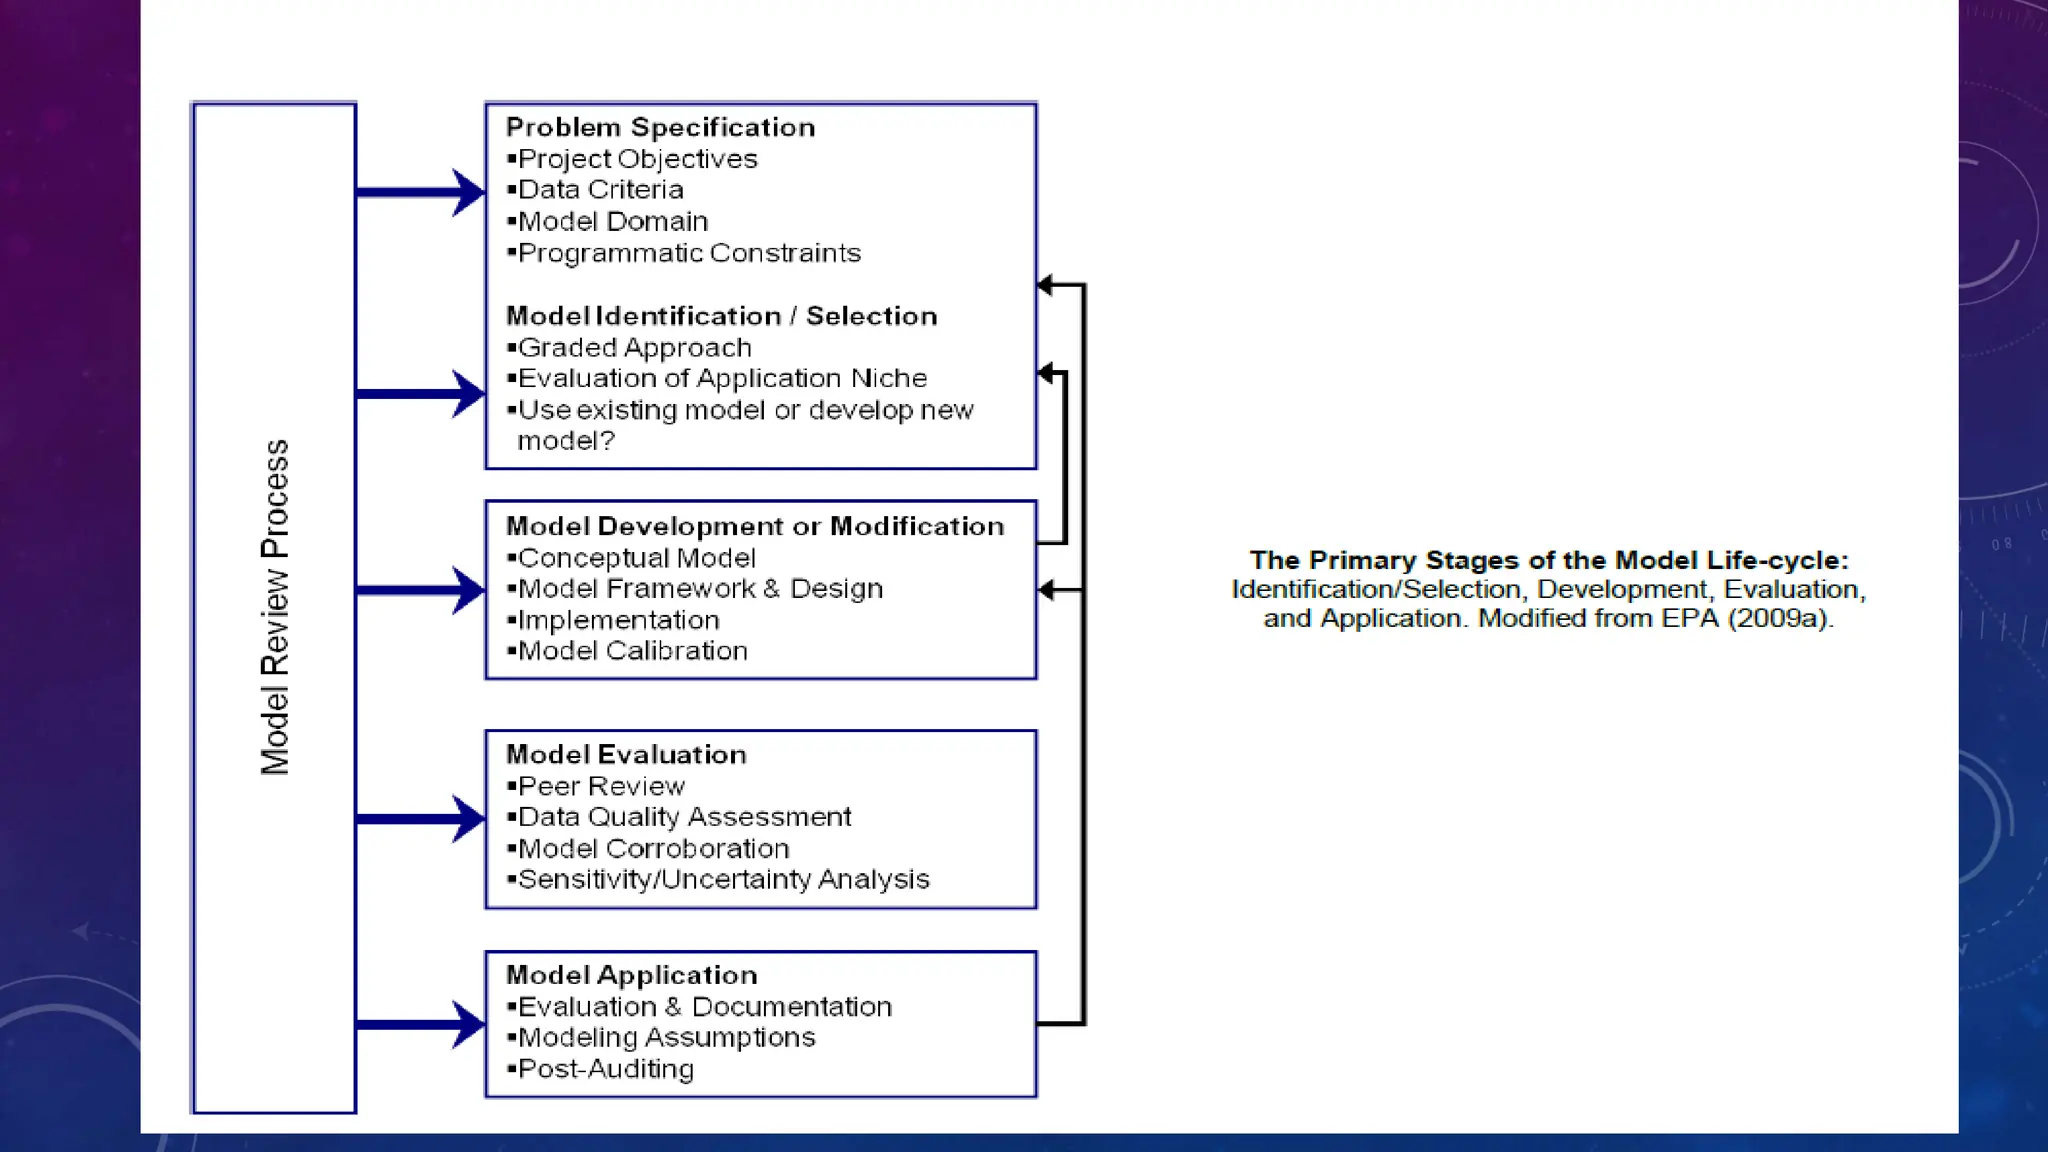
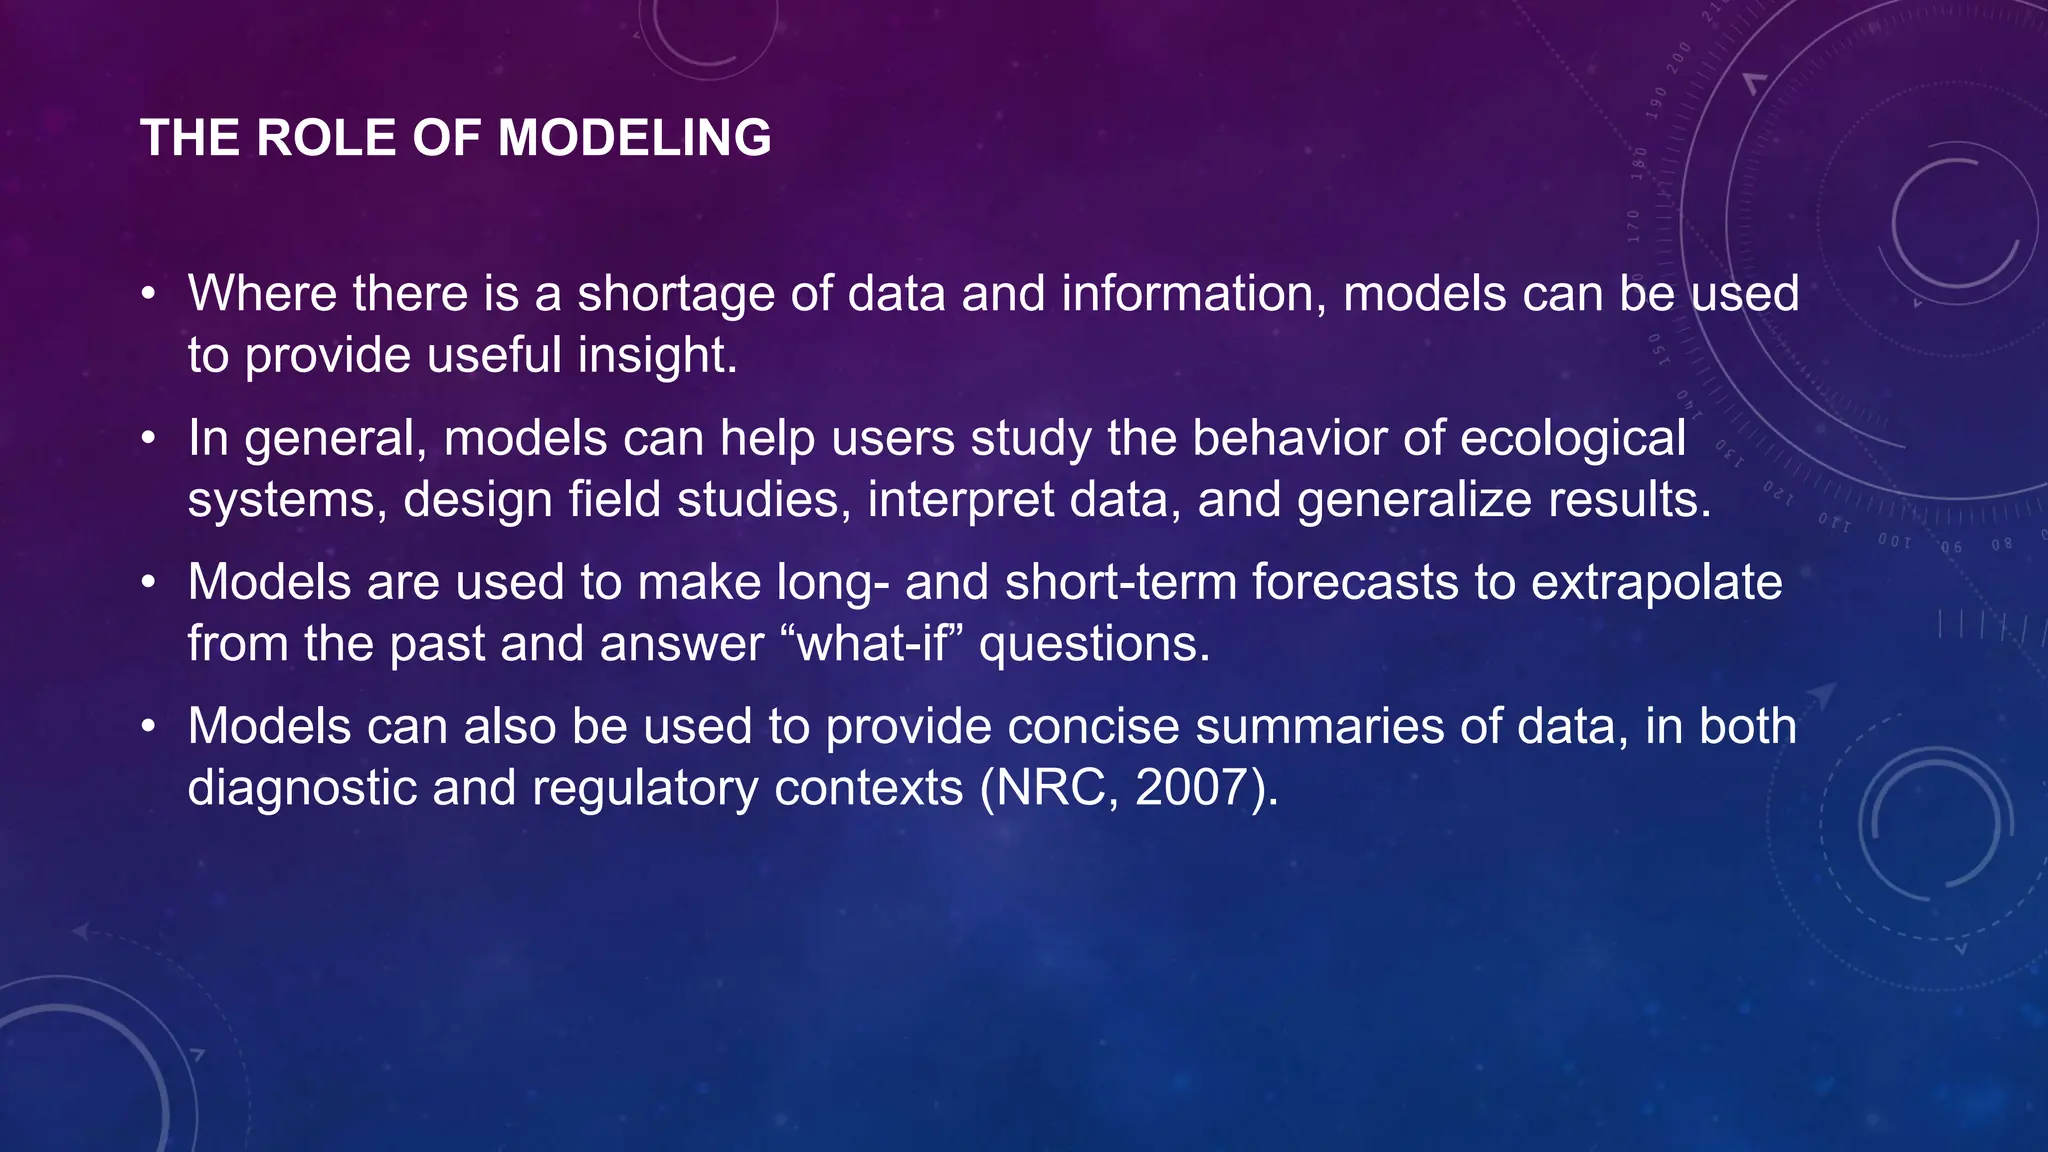
SlideShare a Scribd company logo
1 of 38
UNIT- 1
ENVIRONMENT MODELLING
AN INTRODUCTION
ENVIRONMENTAL SYSTEMS
1. Introduction
• An environmental system is an arrangement of a number of separable
biological, physical, or chemical components, as well as social and economic
components, that interact with each other as a part of the Earth’s environment.
• Examples of environmental systems include the atmosphere and oceans,
populations of plants and animals and catchments.
• Many problems are currently being observed in environmental systems such as
the potential for global warming due to the effects of industrialization on the
atmosphere, increasing salinization of land and water systems and the extinction
of many species.
• Models of environmental systems have been developed for a broad range of
applications and environmental issues.
Environmental systems are generally characterized by four main features.
(I) environmental systems generally depend on complex nonlinear interactions of different
system components.
(Ii) the main forcing variables or states of environmental systems, such as those related to
climate, topography, soil types or population density are commonly extremely heterogeneous,
varying over fairly small temporal and spatial scales
(iii) the characteristic temporal and spatial scales of environmental system components
are often incompatible, meaning that it presents challenges for combining models of different
system components.
(Iv) many environmental systems are inaccessible, or their processes are unobservable, for
example groundwater behavior cannot be observed directly; rather it must be inferred using
sparse measurements.
ENVIRONMENTAL SYSTEMS
Three main types of models are used to model environmental systems:
• empirical,
• conceptual and
• process-based models.
• These model types differ in complexity, with empirical models generally being considered to
be the most simple model type, used for describing aggregate processes, commonly used in
areas such as ecological modeling, to model population or biodiversity.
• Conceptual models are considered to have a complexity between these two model types.
Different types of models are more commonly used with different environmental systems.
• process-based models being the most complex model type, generally containing a large
number of spatially distributed parameters.
Conceptual
Model
Development
Scenario
Generation and
Simulation
Critical
Analysis of
Model
Uncertainties
Common Features of Environmental Systems
While the term “environmental system” covers a myriad of possible systems and processes, including
land, ocean and atmospheric based systems, there are a number of features which are common to almost
all environmental systems, regardless of whether they are physical, biological, or chemical in nature.
1. Complex Nonlinear Interactions
Environmental systems generally consist of complex nonlinear interactions between different system
features. Environmental systems are driven by the interaction of physical, chemical, biological, social,
and economic processes.
2. Heterogeneity of System Features
Important characteristics of environmental systems vary both spatially and temporally over a variety of
scales. Characteristic scales of component processes of environmental systems may be extremely small,
as is the case for some ecological systems where spatial scales may be less than one millimeter and
temporal scales may be over seconds to hours, to very large systems, such as those found for some
ocean or groundwater processes where spatial scales may be in the order of hundreds or thousands of
kilometers and temporal scales may range over decades or centuries, or longer. In many cases these
heterogeneous features are difficult or even impossible to characterize with the limited observational
data that are available.
3. Incompatible Scales
• The characteristic temporal and spatial scales of different features of most
environmental systems vary, making it difficult to create truly generic
models of environmental systems.
• For example, the system response to a rainfall event in a surface water
system such as a river or stream may occur over hours or days, whilst the
response of the groundwater system to this recharge event may occur over
a number of years, even though these two systems are linked.
4. Inaccessible or Unobservable System Processes
• Important processes or features of environmental systems are often
inaccessible or unobservable.
• This may be because the scale of component processes is very large or
very small, as is the case with many oceanic systems which may cover
thousands of square kilometers, or may be because of other difficulties
in obtaining measurements or physical observations of system
processes, such as is the case with many groundwater systems.
MODELLING
What is a model?
DEFINITION :
According to the EPA (2009a) a model is defined as: “A simplification of reality that is constructed to gain
insights into select attributes of a physical, biological, economic, or social system. A formal representation
of the behavior of system processes, often in mathematical or statistical terms.
(A) Modeling
• Modeling is a systematic approach and projected representation of a system, phenomenon or situation
through equation, graph, map and visuals.
• Model can help to understand a state or situation or phenomenon, not experienced or visualized at
present, but there is possibility of it occurring in future.
• One of the purposes of any model is to enable an analyst/ user to predict the effect of changes in the
concerned system or phenomenon.
• Such predictive Modeling is the process of using previous known results to create a model that can be
used to forecast future outcomes.
• But, a model, on one hand, should be a close approximation to the real system. On the other hand, it
should not be very complex to understand and unable to do experiment using it.
• So, a good model is one that keeps balance between realism and simplicity.
WHY ARE MODELS USED?
• Models have a long history of helping to explain scientific phenomena and predict outcomes and
behavior in settings where empirical observations are limited or not available (EPA,2009a).
• Models are based on simplifying assumptions of environmental processes and cannot completely
replicate the inherent complexity of the entire environmental system. Despite these limitations,
models are essential for a variety of purposes; described in two broad categories:
• To diagnose (i.e., assess what happened) and examine causes and precursor conditions (i.e., why it
happened) of events that have taken place
• To forecast outcomes and future events (i.e., what will happen).
Models can be used to inform a variety of activities including:
• Research
• Toxicity screening
• Policy analysis
• National regulatory decision making
• Implementation applications
MODEL STRUCTURE
• In any modeling exercise, the system of interest should be
defined. This definition is not only used to identify the
boundaries of the model, but also serves to define how the
model can be applied and to which systems/situations.
• Therefore, model structure can be described two ways:
1.Included Processes (chemical, physical, or biological)
2.Scope / Scale (time or space)
Model developers should answer the following questions:
1. What processes is the model attempting to reproduce and
include?
2. At what time scale are the included processes occurring?
3. At what spatial scale are the included processes occurring?
TYPES OF COMPUTATIONAL MODELS
The types of computational models are determined by the available data, the
intended use, and the interpretation of model generated results.
1 Empirical vs. Mechanistic models
2 Deterministic vs. Probabilistic models
3 Dynamic vs. Static models
4 Generic equations by model type
5 Other relevant modeling terms
• Empirical models – include very little information on the underlying mechanisms and rely upon the
observed relationships among experimental data. These can be though as ‘best-fit’ models whose
parameters may or may not have real-world interpretation.
• Mechanistic models explicitly include the mechanisms or processes between the state variables ;
unlike empirical models. The parameters in mechanistic models should be supported by data and
have real-world interpretations (EPA, 2009b).
• Deterministic models – provide a solution for the state variable(s) rather than a set of probabilistic
outcomes. This type of model does not explicitly simulate the effects of data uncertainty or variability
. Changes in model outputs are solely due to changes in model components, the boundary conditions,
or initial conditions (EPA, 2009a). Therefore, repeated simulations under constant conditions will result
in consistent results.
• Probabilistic models – utilize the entire range of input data to develop a probability distribution of
model output (i.e. exposure or risk) rather than a single point value. Probabilistic models ar sometimes
referred to as statistical or stochastic models. Probabilistic models can be used to evaluate the
impact of variability and uncertainty in the various input parameters, such as environmental exposure
levels, fate and transport processes, etc.
• Dynamic models – make predictions about the way a system changes with time or space. Solutions
are obtained by taking incremental steps through the model domain. For most situations, where a
differential equation is being approximated, the simulation model will use a finite time step (or spatial
step) to estimate changes in state variables over time (or space).
• Static models make predictions about the way a system changes as the value of an independent
variable changes.
Other Relevant Modeling Terms
• The model framework is defined as the system of governing equations,
parameterization and data structures that represent the formal mathematical
specification of a conceptual model
• Mode (of a model): The manner in which a model operates. Models can be
designed to represent phenomena in different modes.
• Prognostic (or predictive) models are designed to forecast outcomes and future
events, while diagnostic models work “backwards” to assess causes and
precursor conditions
ENVIRONMENTAL MODELING
It involves the application of multidisciplinary knowledge to
explain, explore and predict the Earth’s response to
environmental changes
Models are representations of the environment that can be
used to inform regulation or management decisions.
WHY MODELLING IS ESSENTIAL ?
• Management of natural resource depends scientifically on reliable
projections of future conditions (Modeling) to design, plan and
implement desired actions towards sustainable living.
• Virtually, Modeling helps to visualize the future scenario from the
historical information/events/data that aid to design and plan the
activities for sustainable future.
• In addition, it also assists to forecast/ predict consequences of our
quality of life in case we continue to exploit the natural resources
irrationally to meet our demands. This also enables us to evolve
sustainable way(s) for resource planning, allocation and management
leading towards sustainable lifestyles for all.
Physical model
it is a smaller or larger physical copy of an object. The object being modelled
may be small (e.G., An atom) or large (e.G., Solar system).In other words,
the physical models are smaller and simpler representations of the thing
being studied (viz., A globe or a map). The structure of the model and the
object it represents need be similar in the sense that one resembles the
other. But in such cases, the scale is the most important characteristic to be
followed accurately.
Schematic Model
Schematic models are more abstract than physical models. While they do have
some visual correspondence with reality, they look much less like the physical
reality they represent. Graphs and charts are schematic models that provide
pictorial representations of mathematical relationships. Pie charts, bar charts,
and histograms are all models of some real situations, but they really bear no
physical resemblance to anything. Diagrams, drawings, and blueprints also are
versions of schematic model.
Conceptual models tie together many ideas to explain a phenomenon or event.
It is representations of a system, made of the composition of concepts which are used to help
people know and understand a subject that the model represents.
A conceptual model’s primary objective is to convey the fundamental principles and basic
functionality of the system which it represents.
A conceptual model, when implemented properly, should satisfy its fundamental objectives. The
conceptual model plays an important role in the overall system development life cycle.
Conceptual models
Mathematical Model
• Mathematical models are perhaps the most abstract of the four
classifications.
• These models do not look like their real-life counterparts at all.
• Mathematical models are built using numbers and symbols that can be
transformed into functions, equations, and formulas.
• Mathematical Modeling is the process of using various mathematical
structures - graphs, equations, diagrams, scatter plots, tree diagrams, etc.,
to represent real situations.
A mathematical model can be used for a number of different reasons:
Developing scientific understanding - through quantitative expression of
current knowledge of a system
Supports in examining the effect of changes in a system
Aids in decision making
(B) Design
• Design is an approach to give a shape /structure of an
object/tools/gears/ assets to enhance / strengthen its
functional efficiency, easy to handle/use/manage,
minimize the use of material and energy, labour cost,
along with aesthetic values.
• Different principles of mathematics, physics, chemistry,
biology etc., along with elements of art are used for
designing any object/article.
• In context of sustainable living, it is focused on different
day-to-day utilities, tools and gears, infrastructures
which ultimately based on the principle of minimum input
use and maximum output.
• Example: Life Cycle Design (LCD) and Cradle to Cradle
(C2C) mainly focus on the products’ flow of material
resources from its raw material collection to its end of
life
(C) Planning
• Planning is a systematically organised
actions for effective implementation
strategy towards achieving a particular
goal.
• It is a system that ensures developmental
plan for people’s interest, taking into
consideration economic,
• environmental and social benefits (and
also drawbacks). Such planning is
undertaken using scientific approach with
analysis of collected data, developing
necessary models and then developing
designs.
EXAMPLE MODEL : SUSTAINABLE LIVING
Sustainable design seeks to
• reduce negative impacts on the environment, the health and comfort of the Principles of design for
sustainability include the ability to
• (a) optimize site potential,
• b) minimize non-renewable energy consumption,
• (c) use environmentally preferable products,
• (d) protect and conserve water,
• (e) enhance indoor environmental quality and
• (f) optimize operational and maintenance practices
In fact, environmental and natural resource planning use balanced decision-making that takes into consideration
the natural environment.
• The process combines protection of environmental resources with community goals.
• Natural resource planning and management deal with managing the way in which people and natural
landscapes interact in rational ways.
• It brings together land use planning, water management, biodiversity conservation, and the future sustainability
of industries/ activities like agriculture, mining, tourism, fisheries, forestry and many more.
Project – 1: Land use change and its impact on natural and cultural
landscape
Background
Land use change is a process by which human activities transform the natural
landscape, referring to how land has been used, usually the purpose. Land
use changes are often nonlinear and sometimes may be causing multi-
dimensional impacts to the environment. Therefore, land use changes need
assessment, and it is also possible to model future conditions as per
assumptions, to ensure sustainable conditions.
Objectives
1. To assess the land use changes over a time period
2. To conduct field level survey to verify and document land use changes.
3. To quantify changes in land use.
Methodology
To conduct the study, Step – by-step
procedure, as given below, is to be followed.
1. Identify the area of study, with a natural or
manmade boundary, that can be
easily identifiable in the Google Earth image.
2. Save the images of the area from Google
Earth for the available years
3. Demarcate land use classes for each year
like forest, agricultural land,
built up area, water body etc.
4. Find out the area of each classes in every
year (using Google Earth; area
tool)
5. Tabulate the data and calculate
percentages
6. Calculate percentage changes for each
category
• Expected Results
• 1. Major land use categories in the area
• 2. Extent of each land use in different years
• 3. Changes in land use during these years
• 4. Decline or increase in respective land use categories with time
• Expected outcomes
• 1. Use of free satellite image data for local understanding
• 2. Changes in pattern of land use over time
THE MODEL LIFE-CYCLE
The model life-cycle is ongoing
Identification
O Determine correct decision-related questions and establish modeling objectives
O Define the purpose of the modeling activity
O Specify the model application context
Development
O Develop the conceptual model that reflects the underlying science of included processes
O Derive the mathematical representation of that science and then encode into a computer program
Evaluation
O Peer Review
O Conduct formal testing to ensure model expressions have been encoded correctly
O Test model outputs by comparisons with empirical(and independent) data
Application
O Run the model and analyze outputs to inform a decision
THE ROLE OF MODELING
• Where there is a shortage of data and information, models can be used
to provide useful insight.
• In general, models can help users study the behavior of ecological
systems, design field studies, interpret data, and generalize results.
• Models are used to make long- and short-term forecasts to extrapolate
from the past and answer “what-if” questions.
• Models can also be used to provide concise summaries of data, in both
diagnostic and regulatory contexts (NRC, 2007).
APPLIED METHODS IN THE ENVIRONMENTAL SCIENCES
1. Environmental Statistics (Statistical Programming)
• Environmental data
• Introduction into statistics and time series analysis
• Spatial statistics – Geo-statistics
• Data analysis and presentation tools
2. Environmental (Geographical) Information Systems
• Spatial data – types and structures
• Spatial data bases and how to use them
• Grid based digital terrain analysis
• GIS for hydrological modelling
3. Environmental Modelling
• Modelling in an environmental context
• Model types and model building
• Model procedures, calibration and validation techniques
• Scenario techniques
• Model uncertainties
ENVIRONMENTAL MODELS
• Environmental models are categorized into groups representing a continuum of processes which translate
the interactions between human activities and natural processes into human health and environmental
impacts.
• •Human Activity Models
• •Natural Systems Process
• •Emissions Models
• •Fate and Transport Models
• •Exposure Models
• •Human Health Effects Models
• •Ecological Effects Models
• •Economic Impact Models
• •Noneconomic Impact Models
HUMAN ACTIVITY MODEL
FATE AND TRANSPORT MODEL
A SOCIO-ECOLOGICAL MODEL FOR PREDICTING IMPACTS OF
LAND-USE AND CLIMATE CHANGE ON REGIONAL PLANT DIVERSITY
IN THE AUSTRIAN ALPS
GLOSSARY
• Algorithm: A precise rule (or set of rules) for solving some problem.
• Analogous Models: When nonhuman species are used to demonstrate the potential health effects of chemicals on humans
• Calibration: The process of adjusting model parameters within physically defensible ranges until the resulting predictions give the best possible fit to the observed data. In some disciplines, calibration
is also referred to as “parameter estimation”.
• Computational models: Computational models express the relationships among components of a system using mathematical representations (Van Waveren et al., 2000).
• Conceptual Models: A hypothesis regarding the important factors that govern the behavior of an object or process of interest. This can be an interpretation or working description of the characteristics
and dynamics of a physical system.
• Ecological Effects Models: Provide a statistical relationship between a level of pollutant exposure and a particular ecological indicator.
• Economic Impact Models: Used in rulemaking, priority setting, enforcement; model output as a monetary value.
• Emissions Models: Estimate the rate or amount of pollutant emissions to water bodies and atmosphere.
• Exposure Models: Estimate the dose of pollutant which humans or animals are exposed.
• Fate and Transport Models: Calculate the movement of pollutants in the environment. Further classified into Subsurface Water Quality Models, Surface Water Quality Models, and Air Quality Models.
• Human Activity Models: Simulate human activities and the behaviors that result in emission of pollutants.
• Human Health Effects Models: Provide a statistical relationship between a dose of a chemical and an adverse human health effect.
• Model: A simplification of reality that is constructed to gain insights into select attributes of a physical, biological, economic, or social system. A formal representation of the behavior of system
processes, often in mathematical or statistical terms.
• Natural Systems Process: Simulate dynamics of ecosystems that give rise to fluxes of nutrients and/or emissions.
• Noneconomic Impact Models: Evaluate the effects of contaminants on a variety of noneconomic parameters (e.g. crop yields).
• Parameter: Terms in the model that are fixed during a model run or simulation but can be changed in different runs as a method for conducting sensitivity analysis or to achieve calibration goals.
• Peer Review: Performed by independent and objective experts, a review of and judgment on a model’s underlying science, the process through which it was developed, and its overall “trustworthiness”
and “reliability” for prediction.
• Post-auditing: Assesses a model’s ability to provide valuable predictions of future conditions for management decisions.
• State variable: The dependent variables calculated within the model, which are also often the performance indicators of the models that change over the simulation.
• System: A collection of objects or variables and the relations among them.
• Transparency: The clarity and completeness with which data, assumptions and methods of analysis are documented. Experimental replication is possible when information about modeling processes
is properly and adequately communicated.
• Uncertainty: Describes a lack of knowledge about models, parameters, constants, data, and beliefs.
• Variability: Variability refers to observed differences attributable to true heterogeneity or diversity. Variability is the result of natural random processes and is usually not reducible by further
measurement or study (although it can be better characterized).

More Related Content

Similar to Environment modelling and its environmental aspects

Introduction to computer based agricultural models
Introduction to computer based agricultural modelsIntroduction to computer based agricultural models
Introduction to computer based agricultural modelsmsk05052003
 
Eia prediction, evaluation & mitigration
Eia prediction, evaluation & mitigrationEia prediction, evaluation & mitigration
Eia prediction, evaluation & mitigrationMizanur R. Shohel
 
LIFE CYCLE ASSESSMENT POWERPOINT SLIDES. PPT
LIFE CYCLE ASSESSMENT POWERPOINT SLIDES. PPTLIFE CYCLE ASSESSMENT POWERPOINT SLIDES. PPT
LIFE CYCLE ASSESSMENT POWERPOINT SLIDES. PPTThinagaranNManiam1
 
02 chapter02
02 chapter0202 chapter02
02 chapter02ELIMENG
 
02 chapter02(1)
02 chapter02(1)02 chapter02(1)
02 chapter02(1)ELIMENG
 
Impact prediction, evaluation and mitigation in eia
Impact prediction, evaluation and mitigation in eiaImpact prediction, evaluation and mitigation in eia
Impact prediction, evaluation and mitigation in eiaMizanur R. Shohel
 
Emergent global patterns_of_ecosystem_structure_and_function_form_a_mechanist...
Emergent global patterns_of_ecosystem_structure_and_function_form_a_mechanist...Emergent global patterns_of_ecosystem_structure_and_function_form_a_mechanist...
Emergent global patterns_of_ecosystem_structure_and_function_form_a_mechanist...Dr Lendy Spires
 
Environment modelling
Environment modellingEnvironment modelling
Environment modellingMansi Rastogi
 
Colin Prentice SPEDDEXES 2014
Colin Prentice SPEDDEXES 2014Colin Prentice SPEDDEXES 2014
Colin Prentice SPEDDEXES 2014aceas13tern
 
Methodological Framework for Assessing Vulnerability to Climate Change by IPCC
Methodological Framework for AssessingVulnerability to Climate Change by IPCCMethodological Framework for AssessingVulnerability to Climate Change by IPCC
Methodological Framework for Assessing Vulnerability to Climate Change by IPCCHILLFORT
 
Course Learning Outcomes Virtual Systems and Services
Course Learning Outcomes Virtual Systems and ServicesCourse Learning Outcomes Virtual Systems and Services
Course Learning Outcomes Virtual Systems and ServicesKdmFarooqMurad
 
Introduction to Statistics and Probability:
Introduction to Statistics and Probability:Introduction to Statistics and Probability:
Introduction to Statistics and Probability:Shrihari Shrihari
 
PERICLES workshop (IDCC 2016) - Introduction to the PERICLES project
PERICLES workshop (IDCC 2016) - Introduction to the PERICLES projectPERICLES workshop (IDCC 2016) - Introduction to the PERICLES project
PERICLES workshop (IDCC 2016) - Introduction to the PERICLES projectPERICLES_FP7
 
Week 2 Environmental Monitoring_Sampling & Data Quality Objectives.pptx
Week 2 Environmental Monitoring_Sampling & Data Quality Objectives.pptxWeek 2 Environmental Monitoring_Sampling & Data Quality Objectives.pptx
Week 2 Environmental Monitoring_Sampling & Data Quality Objectives.pptxSansenHandagJr
 

Similar to Environment modelling and its environmental aspects (20)

Introduction to computer based agricultural models
Introduction to computer based agricultural modelsIntroduction to computer based agricultural models
Introduction to computer based agricultural models
 
Eia prediction, evaluation & mitigration
Eia prediction, evaluation & mitigrationEia prediction, evaluation & mitigration
Eia prediction, evaluation & mitigration
 
LIFE CYCLE ASSESSMENT POWERPOINT SLIDES. PPT
LIFE CYCLE ASSESSMENT POWERPOINT SLIDES. PPTLIFE CYCLE ASSESSMENT POWERPOINT SLIDES. PPT
LIFE CYCLE ASSESSMENT POWERPOINT SLIDES. PPT
 
02 chapter02
02 chapter0202 chapter02
02 chapter02
 
02 chapter02(1)
02 chapter02(1)02 chapter02(1)
02 chapter02(1)
 
Impact prediction, evaluation and mitigation in eia
Impact prediction, evaluation and mitigation in eiaImpact prediction, evaluation and mitigation in eia
Impact prediction, evaluation and mitigation in eia
 
M 3 iot
M 3 iotM 3 iot
M 3 iot
 
Emergent global patterns_of_ecosystem_structure_and_function_form_a_mechanist...
Emergent global patterns_of_ecosystem_structure_and_function_form_a_mechanist...Emergent global patterns_of_ecosystem_structure_and_function_form_a_mechanist...
Emergent global patterns_of_ecosystem_structure_and_function_form_a_mechanist...
 
Crop simulation model
Crop simulation modelCrop simulation model
Crop simulation model
 
Environment modelling
Environment modellingEnvironment modelling
Environment modelling
 
Ocean Modelling
Ocean ModellingOcean Modelling
Ocean Modelling
 
Lecture-01.pptx
Lecture-01.pptxLecture-01.pptx
Lecture-01.pptx
 
Colin Prentice SPEDDEXES 2014
Colin Prentice SPEDDEXES 2014Colin Prentice SPEDDEXES 2014
Colin Prentice SPEDDEXES 2014
 
Methodological Framework for Assessing Vulnerability to Climate Change by IPCC
Methodological Framework for AssessingVulnerability to Climate Change by IPCCMethodological Framework for AssessingVulnerability to Climate Change by IPCC
Methodological Framework for Assessing Vulnerability to Climate Change by IPCC
 
Course Learning Outcomes Virtual Systems and Services
Course Learning Outcomes Virtual Systems and ServicesCourse Learning Outcomes Virtual Systems and Services
Course Learning Outcomes Virtual Systems and Services
 
Introduction to Statistics and Probability:
Introduction to Statistics and Probability:Introduction to Statistics and Probability:
Introduction to Statistics and Probability:
 
PERICLES workshop (IDCC 2016) - Introduction to the PERICLES project
PERICLES workshop (IDCC 2016) - Introduction to the PERICLES projectPERICLES workshop (IDCC 2016) - Introduction to the PERICLES project
PERICLES workshop (IDCC 2016) - Introduction to the PERICLES project
 
Week 2 Environmental Monitoring_Sampling & Data Quality Objectives.pptx
Week 2 Environmental Monitoring_Sampling & Data Quality Objectives.pptxWeek 2 Environmental Monitoring_Sampling & Data Quality Objectives.pptx
Week 2 Environmental Monitoring_Sampling & Data Quality Objectives.pptx
 
Crop growth model
Crop growth modelCrop growth model
Crop growth model
 
Eia methodogies
Eia methodogiesEia methodogies
Eia methodogies
 

More from Mansi Rastogi

Water resources. its depletion and its conservation
Water resources. its depletion and its conservationWater resources. its depletion and its conservation
Water resources. its depletion and its conservationMansi Rastogi
 
linear Regression, multiple Regression and Annova
linear Regression, multiple Regression and Annovalinear Regression, multiple Regression and Annova
linear Regression, multiple Regression and AnnovaMansi Rastogi
 
plume behavior and their flow at various locations
plume behavior and their flow at various locationsplume behavior and their flow at various locations
plume behavior and their flow at various locationsMansi Rastogi
 
Fate of pollutants and pathways in environment
Fate of pollutants and pathways in environmentFate of pollutants and pathways in environment
Fate of pollutants and pathways in environmentMansi Rastogi
 
Air quality, Atmospheric stability and measure of air quality
Air quality, Atmospheric stability and measure of air qualityAir quality, Atmospheric stability and measure of air quality
Air quality, Atmospheric stability and measure of air qualityMansi Rastogi
 
Scope of Environment.pdf
Scope of Environment.pdfScope of Environment.pdf
Scope of Environment.pdfMansi Rastogi
 
ecosystem -2 energyflow.pdf
ecosystem -2 energyflow.pdfecosystem -2 energyflow.pdf
ecosystem -2 energyflow.pdfMansi Rastogi
 

More from Mansi Rastogi (8)

Water resources. its depletion and its conservation
Water resources. its depletion and its conservationWater resources. its depletion and its conservation
Water resources. its depletion and its conservation
 
linear Regression, multiple Regression and Annova
linear Regression, multiple Regression and Annovalinear Regression, multiple Regression and Annova
linear Regression, multiple Regression and Annova
 
plume behavior and their flow at various locations
plume behavior and their flow at various locationsplume behavior and their flow at various locations
plume behavior and their flow at various locations
 
Fate of pollutants and pathways in environment
Fate of pollutants and pathways in environmentFate of pollutants and pathways in environment
Fate of pollutants and pathways in environment
 
Air quality, Atmospheric stability and measure of air quality
Air quality, Atmospheric stability and measure of air qualityAir quality, Atmospheric stability and measure of air quality
Air quality, Atmospheric stability and measure of air quality
 
ozone .pptx
ozone .pptxozone .pptx
ozone .pptx
 
Scope of Environment.pdf
Scope of Environment.pdfScope of Environment.pdf
Scope of Environment.pdf
 
ecosystem -2 energyflow.pdf
ecosystem -2 energyflow.pdfecosystem -2 energyflow.pdf
ecosystem -2 energyflow.pdf
 

Recently uploaded

Module 4: Mendelian Genetics and Punnett Square
Module 4:  Mendelian Genetics and Punnett SquareModule 4:  Mendelian Genetics and Punnett Square
Module 4: Mendelian Genetics and Punnett SquareIsiahStephanRadaza
 
Twin's paradox experiment is a meassurement of the extra dimensions.pptx
Twin's paradox experiment is a meassurement of the extra dimensions.pptxTwin's paradox experiment is a meassurement of the extra dimensions.pptx
Twin's paradox experiment is a meassurement of the extra dimensions.pptxEran Akiva Sinbar
 
Recombinant DNA technology( Transgenic plant and animal)
Recombinant DNA technology( Transgenic plant and animal)Recombinant DNA technology( Transgenic plant and animal)
Recombinant DNA technology( Transgenic plant and animal)DHURKADEVIBASKAR
 
Welcome to GFDL for Take Your Child To Work Day
Welcome to GFDL for Take Your Child To Work DayWelcome to GFDL for Take Your Child To Work Day
Welcome to GFDL for Take Your Child To Work DayZachary Labe
 
Forest laws, Indian forest laws, why they are important
Forest laws, Indian forest laws, why they are importantForest laws, Indian forest laws, why they are important
Forest laws, Indian forest laws, why they are importantadityabhardwaj282
 
BIOETHICS IN RECOMBINANT DNA TECHNOLOGY.
BIOETHICS IN RECOMBINANT DNA TECHNOLOGY.BIOETHICS IN RECOMBINANT DNA TECHNOLOGY.
BIOETHICS IN RECOMBINANT DNA TECHNOLOGY.PraveenaKalaiselvan1
 
Heredity: Inheritance and Variation of Traits
Heredity: Inheritance and Variation of TraitsHeredity: Inheritance and Variation of Traits
Heredity: Inheritance and Variation of TraitsCharlene Llagas
 
Call Girls In Nihal Vihar Delhi ❤️8860477959 Looking Escorts In 24/7 Delhi NCR
Call Girls In Nihal Vihar Delhi ❤️8860477959 Looking Escorts In 24/7 Delhi NCRCall Girls In Nihal Vihar Delhi ❤️8860477959 Looking Escorts In 24/7 Delhi NCR
Call Girls In Nihal Vihar Delhi ❤️8860477959 Looking Escorts In 24/7 Delhi NCRlizamodels9
 
Call Us ≽ 9953322196 ≼ Call Girls In Mukherjee Nagar(Delhi) |
Call Us ≽ 9953322196 ≼ Call Girls In Mukherjee Nagar(Delhi) |Call Us ≽ 9953322196 ≼ Call Girls In Mukherjee Nagar(Delhi) |
Call Us ≽ 9953322196 ≼ Call Girls In Mukherjee Nagar(Delhi) |aasikanpl
 
Call Girls in Munirka Delhi 💯Call Us 🔝8264348440🔝
Call Girls in Munirka Delhi 💯Call Us 🔝8264348440🔝Call Girls in Munirka Delhi 💯Call Us 🔝8264348440🔝
Call Girls in Munirka Delhi 💯Call Us 🔝8264348440🔝soniya singh
 
Analytical Profile of Coleus Forskohlii | Forskolin .pptx
Analytical Profile of Coleus Forskohlii | Forskolin .pptxAnalytical Profile of Coleus Forskohlii | Forskolin .pptx
Analytical Profile of Coleus Forskohlii | Forskolin .pptxSwapnil Therkar
 
insect anatomy and insect body wall and their physiology
insect anatomy and insect body wall and their  physiologyinsect anatomy and insect body wall and their  physiology
insect anatomy and insect body wall and their physiologyDrAnita Sharma
 
Spermiogenesis or Spermateleosis or metamorphosis of spermatid
Spermiogenesis or Spermateleosis or metamorphosis of spermatidSpermiogenesis or Spermateleosis or metamorphosis of spermatid
Spermiogenesis or Spermateleosis or metamorphosis of spermatidSarthak Sekhar Mondal
 
Microphone- characteristics,carbon microphone, dynamic microphone.pptx
Microphone- characteristics,carbon microphone, dynamic microphone.pptxMicrophone- characteristics,carbon microphone, dynamic microphone.pptx
Microphone- characteristics,carbon microphone, dynamic microphone.pptxpriyankatabhane
 
Temporomandibular joint Muscles of Mastication
Temporomandibular joint Muscles of MasticationTemporomandibular joint Muscles of Mastication
Temporomandibular joint Muscles of Masticationvidulajaib
 
Artificial Intelligence In Microbiology by Dr. Prince C P
Artificial Intelligence In Microbiology by Dr. Prince C PArtificial Intelligence In Microbiology by Dr. Prince C P
Artificial Intelligence In Microbiology by Dr. Prince C PPRINCE C P
 
Vision and reflection on Mining Software Repositories research in 2024
Vision and reflection on Mining Software Repositories research in 2024Vision and reflection on Mining Software Repositories research in 2024
Vision and reflection on Mining Software Repositories research in 2024AyushiRastogi48
 
Evidences of Evolution General Biology 2
Evidences of Evolution General Biology 2Evidences of Evolution General Biology 2
Evidences of Evolution General Biology 2John Carlo Rollon
 
Is RISC-V ready for HPC workload? Maybe?
Is RISC-V ready for HPC workload? Maybe?Is RISC-V ready for HPC workload? Maybe?
Is RISC-V ready for HPC workload? Maybe?Patrick Diehl
 
Call Girls in Mayapuri Delhi 💯Call Us 🔝9953322196🔝 💯Escort.
Call Girls in Mayapuri Delhi 💯Call Us 🔝9953322196🔝 💯Escort.Call Girls in Mayapuri Delhi 💯Call Us 🔝9953322196🔝 💯Escort.
Call Girls in Mayapuri Delhi 💯Call Us 🔝9953322196🔝 💯Escort.aasikanpl
 

Recently uploaded (20)

Module 4: Mendelian Genetics and Punnett Square
Module 4:  Mendelian Genetics and Punnett SquareModule 4:  Mendelian Genetics and Punnett Square
Module 4: Mendelian Genetics and Punnett Square
 
Twin's paradox experiment is a meassurement of the extra dimensions.pptx
Twin's paradox experiment is a meassurement of the extra dimensions.pptxTwin's paradox experiment is a meassurement of the extra dimensions.pptx
Twin's paradox experiment is a meassurement of the extra dimensions.pptx
 
Recombinant DNA technology( Transgenic plant and animal)
Recombinant DNA technology( Transgenic plant and animal)Recombinant DNA technology( Transgenic plant and animal)
Recombinant DNA technology( Transgenic plant and animal)
 
Welcome to GFDL for Take Your Child To Work Day
Welcome to GFDL for Take Your Child To Work DayWelcome to GFDL for Take Your Child To Work Day
Welcome to GFDL for Take Your Child To Work Day
 
Forest laws, Indian forest laws, why they are important
Forest laws, Indian forest laws, why they are importantForest laws, Indian forest laws, why they are important
Forest laws, Indian forest laws, why they are important
 
BIOETHICS IN RECOMBINANT DNA TECHNOLOGY.
BIOETHICS IN RECOMBINANT DNA TECHNOLOGY.BIOETHICS IN RECOMBINANT DNA TECHNOLOGY.
BIOETHICS IN RECOMBINANT DNA TECHNOLOGY.
 
Heredity: Inheritance and Variation of Traits
Heredity: Inheritance and Variation of TraitsHeredity: Inheritance and Variation of Traits
Heredity: Inheritance and Variation of Traits
 
Call Girls In Nihal Vihar Delhi ❤️8860477959 Looking Escorts In 24/7 Delhi NCR
Call Girls In Nihal Vihar Delhi ❤️8860477959 Looking Escorts In 24/7 Delhi NCRCall Girls In Nihal Vihar Delhi ❤️8860477959 Looking Escorts In 24/7 Delhi NCR
Call Girls In Nihal Vihar Delhi ❤️8860477959 Looking Escorts In 24/7 Delhi NCR
 
Call Us ≽ 9953322196 ≼ Call Girls In Mukherjee Nagar(Delhi) |
Call Us ≽ 9953322196 ≼ Call Girls In Mukherjee Nagar(Delhi) |Call Us ≽ 9953322196 ≼ Call Girls In Mukherjee Nagar(Delhi) |
Call Us ≽ 9953322196 ≼ Call Girls In Mukherjee Nagar(Delhi) |
 
Call Girls in Munirka Delhi 💯Call Us 🔝8264348440🔝
Call Girls in Munirka Delhi 💯Call Us 🔝8264348440🔝Call Girls in Munirka Delhi 💯Call Us 🔝8264348440🔝
Call Girls in Munirka Delhi 💯Call Us 🔝8264348440🔝
 
Analytical Profile of Coleus Forskohlii | Forskolin .pptx
Analytical Profile of Coleus Forskohlii | Forskolin .pptxAnalytical Profile of Coleus Forskohlii | Forskolin .pptx
Analytical Profile of Coleus Forskohlii | Forskolin .pptx
 
insect anatomy and insect body wall and their physiology
insect anatomy and insect body wall and their  physiologyinsect anatomy and insect body wall and their  physiology
insect anatomy and insect body wall and their physiology
 
Spermiogenesis or Spermateleosis or metamorphosis of spermatid
Spermiogenesis or Spermateleosis or metamorphosis of spermatidSpermiogenesis or Spermateleosis or metamorphosis of spermatid
Spermiogenesis or Spermateleosis or metamorphosis of spermatid
 
Microphone- characteristics,carbon microphone, dynamic microphone.pptx
Microphone- characteristics,carbon microphone, dynamic microphone.pptxMicrophone- characteristics,carbon microphone, dynamic microphone.pptx
Microphone- characteristics,carbon microphone, dynamic microphone.pptx
 
Temporomandibular joint Muscles of Mastication
Temporomandibular joint Muscles of MasticationTemporomandibular joint Muscles of Mastication
Temporomandibular joint Muscles of Mastication
 
Artificial Intelligence In Microbiology by Dr. Prince C P
Artificial Intelligence In Microbiology by Dr. Prince C PArtificial Intelligence In Microbiology by Dr. Prince C P
Artificial Intelligence In Microbiology by Dr. Prince C P
 
Vision and reflection on Mining Software Repositories research in 2024
Vision and reflection on Mining Software Repositories research in 2024Vision and reflection on Mining Software Repositories research in 2024
Vision and reflection on Mining Software Repositories research in 2024
 
Evidences of Evolution General Biology 2
Evidences of Evolution General Biology 2Evidences of Evolution General Biology 2
Evidences of Evolution General Biology 2
 
Is RISC-V ready for HPC workload? Maybe?
Is RISC-V ready for HPC workload? Maybe?Is RISC-V ready for HPC workload? Maybe?
Is RISC-V ready for HPC workload? Maybe?
 
Call Girls in Mayapuri Delhi 💯Call Us 🔝9953322196🔝 💯Escort.
Call Girls in Mayapuri Delhi 💯Call Us 🔝9953322196🔝 💯Escort.Call Girls in Mayapuri Delhi 💯Call Us 🔝9953322196🔝 💯Escort.
Call Girls in Mayapuri Delhi 💯Call Us 🔝9953322196🔝 💯Escort.
 

Environment modelling and its environmental aspects

  • 2. ENVIRONMENTAL SYSTEMS 1. Introduction • An environmental system is an arrangement of a number of separable biological, physical, or chemical components, as well as social and economic components, that interact with each other as a part of the Earth’s environment. • Examples of environmental systems include the atmosphere and oceans, populations of plants and animals and catchments. • Many problems are currently being observed in environmental systems such as the potential for global warming due to the effects of industrialization on the atmosphere, increasing salinization of land and water systems and the extinction of many species. • Models of environmental systems have been developed for a broad range of applications and environmental issues.
  • 3. Environmental systems are generally characterized by four main features. (I) environmental systems generally depend on complex nonlinear interactions of different system components. (Ii) the main forcing variables or states of environmental systems, such as those related to climate, topography, soil types or population density are commonly extremely heterogeneous, varying over fairly small temporal and spatial scales (iii) the characteristic temporal and spatial scales of environmental system components are often incompatible, meaning that it presents challenges for combining models of different system components. (Iv) many environmental systems are inaccessible, or their processes are unobservable, for example groundwater behavior cannot be observed directly; rather it must be inferred using sparse measurements. ENVIRONMENTAL SYSTEMS
  • 4. Three main types of models are used to model environmental systems: • empirical, • conceptual and • process-based models. • These model types differ in complexity, with empirical models generally being considered to be the most simple model type, used for describing aggregate processes, commonly used in areas such as ecological modeling, to model population or biodiversity. • Conceptual models are considered to have a complexity between these two model types. Different types of models are more commonly used with different environmental systems. • process-based models being the most complex model type, generally containing a large number of spatially distributed parameters.
  • 6. Common Features of Environmental Systems While the term “environmental system” covers a myriad of possible systems and processes, including land, ocean and atmospheric based systems, there are a number of features which are common to almost all environmental systems, regardless of whether they are physical, biological, or chemical in nature. 1. Complex Nonlinear Interactions Environmental systems generally consist of complex nonlinear interactions between different system features. Environmental systems are driven by the interaction of physical, chemical, biological, social, and economic processes. 2. Heterogeneity of System Features Important characteristics of environmental systems vary both spatially and temporally over a variety of scales. Characteristic scales of component processes of environmental systems may be extremely small, as is the case for some ecological systems where spatial scales may be less than one millimeter and temporal scales may be over seconds to hours, to very large systems, such as those found for some ocean or groundwater processes where spatial scales may be in the order of hundreds or thousands of kilometers and temporal scales may range over decades or centuries, or longer. In many cases these heterogeneous features are difficult or even impossible to characterize with the limited observational data that are available.
  • 7. 3. Incompatible Scales • The characteristic temporal and spatial scales of different features of most environmental systems vary, making it difficult to create truly generic models of environmental systems. • For example, the system response to a rainfall event in a surface water system such as a river or stream may occur over hours or days, whilst the response of the groundwater system to this recharge event may occur over a number of years, even though these two systems are linked.
  • 8. 4. Inaccessible or Unobservable System Processes • Important processes or features of environmental systems are often inaccessible or unobservable. • This may be because the scale of component processes is very large or very small, as is the case with many oceanic systems which may cover thousands of square kilometers, or may be because of other difficulties in obtaining measurements or physical observations of system processes, such as is the case with many groundwater systems.
  • 9. MODELLING What is a model? DEFINITION : According to the EPA (2009a) a model is defined as: “A simplification of reality that is constructed to gain insights into select attributes of a physical, biological, economic, or social system. A formal representation of the behavior of system processes, often in mathematical or statistical terms. (A) Modeling • Modeling is a systematic approach and projected representation of a system, phenomenon or situation through equation, graph, map and visuals. • Model can help to understand a state or situation or phenomenon, not experienced or visualized at present, but there is possibility of it occurring in future. • One of the purposes of any model is to enable an analyst/ user to predict the effect of changes in the concerned system or phenomenon. • Such predictive Modeling is the process of using previous known results to create a model that can be used to forecast future outcomes. • But, a model, on one hand, should be a close approximation to the real system. On the other hand, it should not be very complex to understand and unable to do experiment using it. • So, a good model is one that keeps balance between realism and simplicity.
  • 10. WHY ARE MODELS USED? • Models have a long history of helping to explain scientific phenomena and predict outcomes and behavior in settings where empirical observations are limited or not available (EPA,2009a). • Models are based on simplifying assumptions of environmental processes and cannot completely replicate the inherent complexity of the entire environmental system. Despite these limitations, models are essential for a variety of purposes; described in two broad categories: • To diagnose (i.e., assess what happened) and examine causes and precursor conditions (i.e., why it happened) of events that have taken place • To forecast outcomes and future events (i.e., what will happen). Models can be used to inform a variety of activities including: • Research • Toxicity screening • Policy analysis • National regulatory decision making • Implementation applications
  • 11. MODEL STRUCTURE • In any modeling exercise, the system of interest should be defined. This definition is not only used to identify the boundaries of the model, but also serves to define how the model can be applied and to which systems/situations. • Therefore, model structure can be described two ways: 1.Included Processes (chemical, physical, or biological) 2.Scope / Scale (time or space) Model developers should answer the following questions: 1. What processes is the model attempting to reproduce and include? 2. At what time scale are the included processes occurring? 3. At what spatial scale are the included processes occurring?
  • 12. TYPES OF COMPUTATIONAL MODELS The types of computational models are determined by the available data, the intended use, and the interpretation of model generated results. 1 Empirical vs. Mechanistic models 2 Deterministic vs. Probabilistic models 3 Dynamic vs. Static models 4 Generic equations by model type 5 Other relevant modeling terms
  • 13. • Empirical models – include very little information on the underlying mechanisms and rely upon the observed relationships among experimental data. These can be though as ‘best-fit’ models whose parameters may or may not have real-world interpretation. • Mechanistic models explicitly include the mechanisms or processes between the state variables ; unlike empirical models. The parameters in mechanistic models should be supported by data and have real-world interpretations (EPA, 2009b). • Deterministic models – provide a solution for the state variable(s) rather than a set of probabilistic outcomes. This type of model does not explicitly simulate the effects of data uncertainty or variability . Changes in model outputs are solely due to changes in model components, the boundary conditions, or initial conditions (EPA, 2009a). Therefore, repeated simulations under constant conditions will result in consistent results. • Probabilistic models – utilize the entire range of input data to develop a probability distribution of model output (i.e. exposure or risk) rather than a single point value. Probabilistic models ar sometimes referred to as statistical or stochastic models. Probabilistic models can be used to evaluate the impact of variability and uncertainty in the various input parameters, such as environmental exposure levels, fate and transport processes, etc. • Dynamic models – make predictions about the way a system changes with time or space. Solutions are obtained by taking incremental steps through the model domain. For most situations, where a differential equation is being approximated, the simulation model will use a finite time step (or spatial step) to estimate changes in state variables over time (or space). • Static models make predictions about the way a system changes as the value of an independent variable changes.
  • 14. Other Relevant Modeling Terms • The model framework is defined as the system of governing equations, parameterization and data structures that represent the formal mathematical specification of a conceptual model • Mode (of a model): The manner in which a model operates. Models can be designed to represent phenomena in different modes. • Prognostic (or predictive) models are designed to forecast outcomes and future events, while diagnostic models work “backwards” to assess causes and precursor conditions
  • 15.
  • 16. ENVIRONMENTAL MODELING It involves the application of multidisciplinary knowledge to explain, explore and predict the Earth’s response to environmental changes Models are representations of the environment that can be used to inform regulation or management decisions.
  • 17. WHY MODELLING IS ESSENTIAL ? • Management of natural resource depends scientifically on reliable projections of future conditions (Modeling) to design, plan and implement desired actions towards sustainable living. • Virtually, Modeling helps to visualize the future scenario from the historical information/events/data that aid to design and plan the activities for sustainable future. • In addition, it also assists to forecast/ predict consequences of our quality of life in case we continue to exploit the natural resources irrationally to meet our demands. This also enables us to evolve sustainable way(s) for resource planning, allocation and management leading towards sustainable lifestyles for all.
  • 18. Physical model it is a smaller or larger physical copy of an object. The object being modelled may be small (e.G., An atom) or large (e.G., Solar system).In other words, the physical models are smaller and simpler representations of the thing being studied (viz., A globe or a map). The structure of the model and the object it represents need be similar in the sense that one resembles the other. But in such cases, the scale is the most important characteristic to be followed accurately. Schematic Model Schematic models are more abstract than physical models. While they do have some visual correspondence with reality, they look much less like the physical reality they represent. Graphs and charts are schematic models that provide pictorial representations of mathematical relationships. Pie charts, bar charts, and histograms are all models of some real situations, but they really bear no physical resemblance to anything. Diagrams, drawings, and blueprints also are versions of schematic model.
  • 19. Conceptual models tie together many ideas to explain a phenomenon or event. It is representations of a system, made of the composition of concepts which are used to help people know and understand a subject that the model represents. A conceptual model’s primary objective is to convey the fundamental principles and basic functionality of the system which it represents. A conceptual model, when implemented properly, should satisfy its fundamental objectives. The conceptual model plays an important role in the overall system development life cycle. Conceptual models
  • 20. Mathematical Model • Mathematical models are perhaps the most abstract of the four classifications. • These models do not look like their real-life counterparts at all. • Mathematical models are built using numbers and symbols that can be transformed into functions, equations, and formulas. • Mathematical Modeling is the process of using various mathematical structures - graphs, equations, diagrams, scatter plots, tree diagrams, etc., to represent real situations.
  • 21. A mathematical model can be used for a number of different reasons: Developing scientific understanding - through quantitative expression of current knowledge of a system Supports in examining the effect of changes in a system Aids in decision making
  • 22. (B) Design • Design is an approach to give a shape /structure of an object/tools/gears/ assets to enhance / strengthen its functional efficiency, easy to handle/use/manage, minimize the use of material and energy, labour cost, along with aesthetic values. • Different principles of mathematics, physics, chemistry, biology etc., along with elements of art are used for designing any object/article. • In context of sustainable living, it is focused on different day-to-day utilities, tools and gears, infrastructures which ultimately based on the principle of minimum input use and maximum output. • Example: Life Cycle Design (LCD) and Cradle to Cradle (C2C) mainly focus on the products’ flow of material resources from its raw material collection to its end of life
  • 23. (C) Planning • Planning is a systematically organised actions for effective implementation strategy towards achieving a particular goal. • It is a system that ensures developmental plan for people’s interest, taking into consideration economic, • environmental and social benefits (and also drawbacks). Such planning is undertaken using scientific approach with analysis of collected data, developing necessary models and then developing designs.
  • 24. EXAMPLE MODEL : SUSTAINABLE LIVING
  • 25. Sustainable design seeks to • reduce negative impacts on the environment, the health and comfort of the Principles of design for sustainability include the ability to • (a) optimize site potential, • b) minimize non-renewable energy consumption, • (c) use environmentally preferable products, • (d) protect and conserve water, • (e) enhance indoor environmental quality and • (f) optimize operational and maintenance practices In fact, environmental and natural resource planning use balanced decision-making that takes into consideration the natural environment. • The process combines protection of environmental resources with community goals. • Natural resource planning and management deal with managing the way in which people and natural landscapes interact in rational ways. • It brings together land use planning, water management, biodiversity conservation, and the future sustainability of industries/ activities like agriculture, mining, tourism, fisheries, forestry and many more.
  • 26. Project – 1: Land use change and its impact on natural and cultural landscape Background Land use change is a process by which human activities transform the natural landscape, referring to how land has been used, usually the purpose. Land use changes are often nonlinear and sometimes may be causing multi- dimensional impacts to the environment. Therefore, land use changes need assessment, and it is also possible to model future conditions as per assumptions, to ensure sustainable conditions. Objectives 1. To assess the land use changes over a time period 2. To conduct field level survey to verify and document land use changes. 3. To quantify changes in land use.
  • 27. Methodology To conduct the study, Step – by-step procedure, as given below, is to be followed. 1. Identify the area of study, with a natural or manmade boundary, that can be easily identifiable in the Google Earth image. 2. Save the images of the area from Google Earth for the available years 3. Demarcate land use classes for each year like forest, agricultural land, built up area, water body etc. 4. Find out the area of each classes in every year (using Google Earth; area tool) 5. Tabulate the data and calculate percentages 6. Calculate percentage changes for each category
  • 28. • Expected Results • 1. Major land use categories in the area • 2. Extent of each land use in different years • 3. Changes in land use during these years • 4. Decline or increase in respective land use categories with time • Expected outcomes • 1. Use of free satellite image data for local understanding • 2. Changes in pattern of land use over time
  • 29. THE MODEL LIFE-CYCLE The model life-cycle is ongoing Identification O Determine correct decision-related questions and establish modeling objectives O Define the purpose of the modeling activity O Specify the model application context Development O Develop the conceptual model that reflects the underlying science of included processes O Derive the mathematical representation of that science and then encode into a computer program Evaluation O Peer Review O Conduct formal testing to ensure model expressions have been encoded correctly O Test model outputs by comparisons with empirical(and independent) data Application O Run the model and analyze outputs to inform a decision
  • 30.
  • 31. THE ROLE OF MODELING • Where there is a shortage of data and information, models can be used to provide useful insight. • In general, models can help users study the behavior of ecological systems, design field studies, interpret data, and generalize results. • Models are used to make long- and short-term forecasts to extrapolate from the past and answer “what-if” questions. • Models can also be used to provide concise summaries of data, in both diagnostic and regulatory contexts (NRC, 2007).
  • 32. APPLIED METHODS IN THE ENVIRONMENTAL SCIENCES 1. Environmental Statistics (Statistical Programming) • Environmental data • Introduction into statistics and time series analysis • Spatial statistics – Geo-statistics • Data analysis and presentation tools 2. Environmental (Geographical) Information Systems • Spatial data – types and structures • Spatial data bases and how to use them • Grid based digital terrain analysis • GIS for hydrological modelling 3. Environmental Modelling • Modelling in an environmental context • Model types and model building • Model procedures, calibration and validation techniques • Scenario techniques • Model uncertainties
  • 33. ENVIRONMENTAL MODELS • Environmental models are categorized into groups representing a continuum of processes which translate the interactions between human activities and natural processes into human health and environmental impacts. • •Human Activity Models • •Natural Systems Process • •Emissions Models • •Fate and Transport Models • •Exposure Models • •Human Health Effects Models • •Ecological Effects Models • •Economic Impact Models • •Noneconomic Impact Models
  • 34.
  • 37. A SOCIO-ECOLOGICAL MODEL FOR PREDICTING IMPACTS OF LAND-USE AND CLIMATE CHANGE ON REGIONAL PLANT DIVERSITY IN THE AUSTRIAN ALPS
  • 38. GLOSSARY • Algorithm: A precise rule (or set of rules) for solving some problem. • Analogous Models: When nonhuman species are used to demonstrate the potential health effects of chemicals on humans • Calibration: The process of adjusting model parameters within physically defensible ranges until the resulting predictions give the best possible fit to the observed data. In some disciplines, calibration is also referred to as “parameter estimation”. • Computational models: Computational models express the relationships among components of a system using mathematical representations (Van Waveren et al., 2000). • Conceptual Models: A hypothesis regarding the important factors that govern the behavior of an object or process of interest. This can be an interpretation or working description of the characteristics and dynamics of a physical system. • Ecological Effects Models: Provide a statistical relationship between a level of pollutant exposure and a particular ecological indicator. • Economic Impact Models: Used in rulemaking, priority setting, enforcement; model output as a monetary value. • Emissions Models: Estimate the rate or amount of pollutant emissions to water bodies and atmosphere. • Exposure Models: Estimate the dose of pollutant which humans or animals are exposed. • Fate and Transport Models: Calculate the movement of pollutants in the environment. Further classified into Subsurface Water Quality Models, Surface Water Quality Models, and Air Quality Models. • Human Activity Models: Simulate human activities and the behaviors that result in emission of pollutants. • Human Health Effects Models: Provide a statistical relationship between a dose of a chemical and an adverse human health effect. • Model: A simplification of reality that is constructed to gain insights into select attributes of a physical, biological, economic, or social system. A formal representation of the behavior of system processes, often in mathematical or statistical terms. • Natural Systems Process: Simulate dynamics of ecosystems that give rise to fluxes of nutrients and/or emissions. • Noneconomic Impact Models: Evaluate the effects of contaminants on a variety of noneconomic parameters (e.g. crop yields). • Parameter: Terms in the model that are fixed during a model run or simulation but can be changed in different runs as a method for conducting sensitivity analysis or to achieve calibration goals. • Peer Review: Performed by independent and objective experts, a review of and judgment on a model’s underlying science, the process through which it was developed, and its overall “trustworthiness” and “reliability” for prediction. • Post-auditing: Assesses a model’s ability to provide valuable predictions of future conditions for management decisions. • State variable: The dependent variables calculated within the model, which are also often the performance indicators of the models that change over the simulation. • System: A collection of objects or variables and the relations among them. • Transparency: The clarity and completeness with which data, assumptions and methods of analysis are documented. Experimental replication is possible when information about modeling processes is properly and adequately communicated. • Uncertainty: Describes a lack of knowledge about models, parameters, constants, data, and beliefs. • Variability: Variability refers to observed differences attributable to true heterogeneity or diversity. Variability is the result of natural random processes and is usually not reducible by further measurement or study (although it can be better characterized).