This presentation gives a overview about the microvolume UV/VIS spectroscopy. Instrumentation , working ,merits, demerits, cleaning of the sample platform. mainly explains about the measurement of sample using nano or micro volume samples.
Derivative spectroscopy involves converting a normal UV-Vis absorption spectrum into its first or second derivative spectrum. This allows removal of spectral interferences and increases selectivity for analytical determinations. Derivative spectra are generated mathematically or by using a dual-beam spectrophotometer with a small wavelength interval between the beams. This provides better resolution of overlapping bands and permits more accurate determination of components in multi-component mixtures compared to conventional absorption spectroscopy. Derivative spectroscopy finds applications in pharmaceutical analysis and other areas requiring determination of individual components in the presence of interferants.
Derivative spectroscopy and applications of uv vis spectroscopyNayeemaKhowser
The main obejectives of derivative spectroscopy
Derivative spectra and its measurements
Orders of derivative spectra
Noise to signal ratio
Instrumentation of derivative spectroscopy
Advantages and disadvantages of derivative spectroscopy
Applications of Derivative and UV-Vis spectroscopy
Derivative spectroscopy involves converting a normal absorption spectrum into its first or second derivative spectrum. This allows for more precise determination of the wavelength of maximum absorption and improved spectral resolution. The first derivative spectrum plots the rate of change of absorbance versus wavelength and shows a maximum, minimum and zero crossing at the absorption band's wavelength. The second derivative shows two satellite maxima with an inverted band minimum at the wavelength of maximum absorption. Area under curve spectroscopy calculates the integrated absorbance value over a specified wavelength range, graphically representing the area under the absorption curve. Both techniques have applications in pharmaceutical analysis for multicomponent assays and determination of physical constants.
This document discusses the technique of difference spectrophotometry and derivative spectrophotometry. It explains that these methods can improve the selectivity and accuracy of spectrophotometric analysis for samples containing absorbing interferents. Difference spectrophotometry works by measuring the difference in absorbance between two equimolar solutions with different chemical forms, while derivative spectrophotometry converts a normal absorption spectrum into its derivative to remove spectral interferences. Both techniques allow determination of a substance's spectrum that is unaffected by pH or other changes.
Infrared Spectroscopy and UV-Visible spectroscopyPreeti Choudhary
Instrumentation of Infrared Spectroscopy and UV-Vis spectroscopy
Discuss the fundamentals and concepts behind Infrared and UV-Vis spectroscopy.
I hope this presentation helpful for you.
https://www.linkedin.com/in/preeti-choudhary-266414182/
https://www.instagram.com/chaudharypreeti1997/
https://www.facebook.com/profile.php?id=100013419194533
https://twitter.com/preetic27018281
Please like, share, comment and follow.
stay connected
If any query then contact:
chaudharypreeti1997@gmail.com
Thanking-You
Preeti Choudhary
This document discusses the working principle of Fourier transform infrared spectroscopy (FTIR). It begins with an introduction to FTIR, describing how it was developed and its advantages over dispersive infrared spectroscopy. It then provides details on the description of FTIR, including its components and how it uses an interferometer to measure infrared absorption over a range of wavelengths simultaneously. The principle of FTIR is explained, noting how it uses a Michelson interferometer to convert the radiation into a slower oscillating signal that is transformed using Fourier transform into a conventional frequency domain spectrum. In conclusion, it states that FTIR has enabled real-time monitoring of chemical processes by providing information about chemical structure from infrared absorption measurements.
This was a presentation by me for a Seminar For My Pharm. Analysis class. I have tried well to include possible things but haven't gone much in deep because it would be irrelevant as per syllabus. If any mistakes, Please do leave a comment
UV-VIS reflectance spectroscopy is a technique that measures the diffuse reflectance of a sample across UV and visible wavelengths. It works by directing light at a sample inside an integrating sphere, which captures reflected light and directs it to a detector. The ratio of reflected to incident light at each wavelength is the reflectance spectrum. Reflectance is affected by factors like particle size, homogeneity, and packing density. It finds applications in pharmaceutical analysis and other industries to qualitatively and quantitatively analyze samples like drugs, proteins, and chemicals.
This document provides an overview of Fourier transform infrared (FTIR) spectroscopy. It discusses the electromagnetic spectrum and how infrared radiation interacts with molecular bonds to produce vibrational modes. The basic principles of FTIR are explained, including how an interferogram is produced and transformed into an infrared absorption spectrum using Fourier transform. Common instrumentation components like detectors, radiation sources, and sample holders are also mentioned. The document serves as an introduction to FTIR spectroscopy and the molecular information it can provide through analysis of infrared absorption spectra.
Analytical instruments are used to analyze materials and establish their composition. They provide qualitative and quantitative information through various components like a chemical information source, transducer, signal conditioner and display. Absorption spectroscopy is one of the most common instrumental analysis methods and is based on the absorption of electromagnetic radiation by a substance. Key laws governing absorption spectroscopy include Lambert's law, Beer's law, and the Beer-Lambert law, which relate absorbance to characteristics of the absorbing substance and its concentration. Common types of absorption spectrophotometers are UV-Vis-NIR spectrophotometers, which use light in the ultraviolet, visible and near-infrared ranges.
This document discusses the attenuated total reflectance (ATR) infrared spectroscopy sampling technique. It begins by introducing ATR and explaining that it allows for little to no sample preparation and a very thin sampling pathlength. It then discusses factors that affect the ATR spectrum such as the refractive indices of the crystal and sample, angle of incidence, depth of penetration, and quality of sample contact. Common ATR crystal materials and their spectral ranges and depths of penetration are presented. Applications include identification of functional groups, contaminated pet food detection, and more. In conclusion, ATR provides high quality reproducible data for a variety of solid and liquid samples.
Near Infrared Surface Enhanced Raman Spectroscopy Ceh 11 3 2010Chaz874
Near-infrared surface enhanced Raman spectroscopy (SERS) is a technique that can be used to rapidly identify viruses through their unique molecular fingerprints. Experiments showed SERS could differentiate between viral strains and genotypes of rotavirus using silver nanorods as substrates and partial least squares discriminant analysis of the spectra. The technique has advantages over current identification methods as it is nondestructive, requires only small sample sizes, and can potentially recognize mutations. With further development of a reference spectral library, SERS may be useful for clinical virus identification and vaccine production.
Nephelometry and turbidimetry are light scattering techniques used to measure particle concentration in solutions. Nephelometry measures the intensity of scattered light, while turbidimetry measures the intensity of transmitted light. Both techniques rely on the principle that light scattering is dependent on particle size, wavelength, distance of observation, particle concentration, and molecular weight. The instrumentation for both techniques includes a light source, monochromators, sample cells, and detectors. Factors like particle concentration and size can affect measurements. Nephelometry and turbidimetry have applications in water quality analysis, biochemistry, and other areas.
Raman spectroscopy uses laser light to study vibrational and rotational modes in molecules. When light interacts with molecules, the light may be scattered at different wavelengths than the incident laser, providing information about the molecule's structure and bonds. Raman spectroscopy has advantages over infrared spectroscopy in that it can be used to study samples in liquid or solid form, including aqueous solutions. It finds applications in elucidating molecular structure, biological analysis, and quantitative and qualitative analysis of materials.
This document provides an overview of spectrophotometry and related analytical techniques. It defines colorimetry and spectrophotometry, describing spectrophotometry as a colorimetric method that uses an instrument to determine analyte concentration based on light absorption. Components of a spectrophotometer are described, including the light source, monochromator, cuvettes, detector, and components. Various types of spectrophotometers are discussed, as well as applications such as enzyme kinetics, organic stereochemistry studies, and more. Related techniques like fluorimetry, phosphorimetry, and circular dichroism are also summarized.
This document discusses the theory, instrumentation, and applications of dispersive and Fourier transform infrared (FTIR) spectroscopy. It begins with an introduction to IR spectroscopy and the IR region. It then covers dispersive IR instrumentation, which uses prism or grating monochromators to separate wavelengths, and has limitations like slow scan speeds and limited resolution. The document introduces FTIR instrumentation, which uses an interferometer to simultaneously measure all wavelengths and overcomes the limitations of dispersive IR. It concludes that FTIR provides faster, more accurate and sensitive analysis compared to dispersive IR.
Raman spectroscopy and infrared spectroscopy are both vibrational spectroscopy techniques but differ in their operating principles. Raman spectroscopy relies on inelastic scattering of monochromatic light, usually from a laser, while infrared spectroscopy relies on absorption of infrared light. Raman spectroscopy can be used to observe samples as solids, liquids, and gases without requiring preparation, and is suitable for aqueous solutions since water does not interfere with the signal. It has advantages over infrared spectroscopy for applications requiring minimal sample preparation and when analyzing biological samples in their native state.
Steve dye onsite oil analysis with astm compliant ftir intrumentszainudinyahya
This document discusses using Fourier transform infrared (FTIR) spectroscopy for onsite oil analysis. FTIR allows for fast, simultaneous detection of multiple oil parameters without extensive sample preparation. Some key advantages include being inexpensive after the initial capital cost and replacing tedious wet chemistry methods. The document reviews FTIR principles, quantitative and qualitative analysis techniques, considerations like interferences and spectral subtraction, and ASTM standards for oil analysis parameters measurable by FTIR. It promotes the Parker Kittiwake FTIR3 as an ASTM-compliant, portable FTIR instrument for onsite oil monitoring and condition testing.
Raman spectroscopy is a technique that analyzes the scattering of monochromatic light, such as from a laser, after its interaction with molecular vibrations. Most light is elastically scattered, but a small amount is scattered at optical frequencies that are different from the incident light. This provides a fingerprint by which molecules can be identified. Raman spectroscopy is useful for chemical analysis and is non-destructive. It can identify materials through glass or plastic and does not require complex sample preparation.
A spectrophotometer measures the amount of light absorbed by a sample by directing light through the sample and detecting the intensities of light at different wavelengths. It was invented in 1940 and provided quick, accurate results compared to older techniques. A spectrophotometer uses dispersion devices like prisms and filters to separate light wavelengths and detectors to measure light intensities. It can be used to identify compounds, determine concentrations, detect impurities, study chemical kinetics, and more.
Applicationofu v-spectroscopy-120416145659-phpapp02Kirsha K S
This document discusses applications of UV-visible spectroscopy. It can be used to quantitatively determine the concentration and amount of a drug in a sample solution and calculate its percentage purity using various methods like a 1% 1cm value, a reference standard, or a calibration curve. Qualitatively, UV-visible spectroscopy can be used to detect impurities, elucidate organic structures, study functional groups, examine polynuclear hydrocarbons, determine molecular weights, and act as a detector for HPLC. It provides a versatile tool for analytical applications in pharmaceutical analysis and quality control.
A spectrophotometer measures the amount of light transmitted through a sample. It uses various wavelengths of light, including ultraviolet and visible, to detect molecules in solutions. The spectrophotometer shines light on a sample, and molecules can absorb, reflect, or transmit the energy. It measures transmittance and uses Beer's law to calculate absorbance values. By comparing absorbance values of unknown samples to a standard curve of samples with known concentrations, a spectrophotometer can determine the concentration of molecules in an unknown sample.
This document discusses near-infrared (NIR) spectroscopy and its potential for detecting vulnerable plaque. It provides background on NIR spectroscopy and how it works. The document also compares NIR spectroscopy to infrared (IR) spectroscopy and Raman spectroscopy in terms of their abilities to penetrate tissue and provide spectral information. It discusses previous research using these techniques to analyze plaque and identifies components like lipid pools and fibrous caps. The document concludes that these photonic technologies have potential but are limited currently due to insufficient research funding and that new tools may help realize their full potential.
This document discusses various spectroscopic techniques used in pharmaceutical analysis including UV-Vis, IR, fluorescence, atomic absorption, light scattering, and Raman spectroscopy. It provides details on the theory, instrumentation, and applications of these techniques for quantitative and qualitative analysis of pharmaceutical samples. Key terms related to spectroscopy are also defined.
Raman spectroscopy has several applications in analyzing both inorganic and organic species. It is useful for investigating inorganic systems using aqueous solutions and identifying metal-ligand bonds. Raman is also useful for detecting functional groups and identifying specific organic compounds. Additionally, Raman spectroscopy has been widely used to study biological systems due to its minimal interference from water. Resonance Raman spectroscopy enhances Raman peaks and allows analysis of molecules at very low concentrations in the presence of water. Surface-enhanced Raman spectroscopy further increases signal intensity and enables detection of molecules at concentrations as low as 10-9 to 10-12 M. Raman spectroscopy has many applications across various fields including chemistry, materials analysis, quality control, medicine, art examination, and electronics.
This document discusses near infrared reflectance spectroscopy (NIRS) and its principles. NIRS is a nondestructive technique used to evaluate food quality by determining components like protein, moisture, starch and lipids. It works by measuring the absorption of near infrared light as it interacts with molecular bonds in organic materials. Different bonds like C=H, C=O and N=H absorb different wavelengths. The absorbed energy is detected to create a spectral profile that can be analyzed using chemometrics to quantify various chemical components through calibration.
Spectrophotometry is used in Biology to plot optical density curves (to determine the concentration of biochemicals) or to conduct a cell count for a suspension.
Instrumentation of UV- Visible Spectroscopy.pptxHariomjaiswal14
This document provides information about a seminar on instrumentation of UV-Visible spectroscopy. It discusses the key components of a UV-Visible spectroscopy instrument: light sources like hydrogen lamps; filters or monochromators to isolate wavelengths; sample cells or cuvettes to hold liquid samples; and detectors like photomultiplier tubes to convert light to electrical signals. It also outlines some applications of UV-Visible spectroscopy like qualitative and quantitative analysis, detecting impurities, and determining the structure of organic compounds.
Medical Laboratory technology Lab Manual for MLT students Vamsi kumar
MLT II lab manual for MLT students
Demonstration of working of spectrophotometer
Demonstration of maintenance of equipments and reagents
Sample formats for reporting test result
Demonstration of policies and procedures for infection control
Demonstration of mock diagnostic lab for learning & understanding patients right
Demonstration of mock environment to learn and understand conducive patient environment
Collection and handling of specimen for histopathology/cytopathology examination
Demonstration of working of Microtome
Demonstration of sharpening methods of microtome knife
Demonstration of tissue processing
Demonstration of PAP staining
Demonstration of PAS staining
Collection and handling of specimen for cytopathology examination
Demonstration of Mounting technique Demonstration of Mounting technique
Demonstration of maintaining record of inventory, test results etc
The document discusses UV-VIS spectroscopy. It introduces the technique, including principles such as the Beer-Lambert law. It describes the components of a spectrophotometer and various modes of analysis including quantitative analysis, kinetics measurements, and multi-component analysis. It also covers topics like method development and validation, including calibration procedures to control absorbance, limit stray light, and ensure proper resolution. The document provides an overview of the fundamentals and applications of UV-VIS spectroscopy.
This document discusses laser medicine and medical imaging projects at RLE including:
1) Developing an ultrahigh resolution OCT system using a microstructured fiber for continuum generation, achieving 2.5 μm resolution for in vivo imaging.
2) Demonstrating spectroscopic OCT of water absorption using a 200 nm bandwidth light source centered at 1400 nm.
3) Designing OCT imaging devices like a colposcope that integrates OCT with standard clinical imaging to enable early disease detection.
Microscope and Microscopy
Principal , Function & Difference of various types of Light & Electron microscope.Microscopy is the technical field of using microscopes to view samples & objects that cannot be seen with the unaided eye (objects that are not within the resolution range of the normal eye).
Microscopists explore the relationships between structures & properties for a very wide variety of materials ranging from soft to very hard, from inanimate materials to living organisms, in order to better understand it. Zachariaz Janssen 1585 Robert Hooks 1665
Joseph Jackson Lister1830
Microfluidics refers to the behavior and control of liquids constrained to small volumes near the microliter range. Microfluidics was developed in the 1980s mainly for use in inkjet printers and is a multidisciplinary field with applications in areas like lab-on-a-chip devices for bacterial testing, fast PCR using nanodroplets, and lab-on-a-robot systems for wireless mobile detection of gas samples. Common components of microfluidic devices include micro-scale handling systems, sample loading and injection devices, electro-osmotic pumps, and variable pressure delivery chambers.
Spectrophotometry in clinical chemistryOfonmbuk Umoh
Spectrophotometry is a technique that uses the measurement of light absorption to determine the concentration of chemical substances. It operates based on Beer's Law, which states that absorbance is directly proportional to concentration. The methodology involves using a spectrophotometer to measure the intensity of light passing through reference and sample solutions. Applications include concentration measurement, detection of impurities, structure elucidation, and more. Spectrophotometry is a widely used analytical technique in clinical chemistry.
Laparoscopy is an operation performed in the abdomen or pelvic area using small incisions, often less than 1.5 cm, with the assistance of a Laparoscopic camera, typically for gallbladder, colon, kidney, and other procedures. Before, if an operation had to be conducted in the belly, doctors had to cut open the area, hence the name laparotomy.
This document provides an overview of spectrophotometry and colorimetry. It discusses the basic principles including how spectrophotometry follows Beer's law and relates light absorption to sample concentration. It describes the history and development of spectrophotometry instrumentation. The basic components and mechanisms of spectrophotometers are outlined. Applications of spectrophotometry include concentration measurement, detection of impurities, and molecular weight determination. Colorimetry is similar but uses only the visible light range. Spectrophotometry has advantages over colorimetry in being able to measure a broader electromagnetic spectrum.
The document discusses various microscopy techniques used in microbiology laboratories, including:
- Bright field microscopy, which produces up to 1000x magnification
- Dark field microscopy, used to view organisms like Treponema pallidum that cause syphilis
- Fluorescent microscopy, which uses fluorescent dyes to stain specimens
- Phase contrast microscopy and electron microscopy, which provide higher magnifications
- Methods for staining, culturing, and isolating pure cultures of microorganisms are also described.
This document discusses dry chemistry techniques. It begins with a brief history, noting the first dry chemistry system for testing urine sugar in 1941. The key was using dried ingredients and controlling humidity.
It then explains the principle of dry chemistry is based on reflectance spectrophotometry. Dry chemistry components use reflectance to measure color changes rather than transmission used in wet chemistry.
Examples of dry chemistry tests for urine analysis using reagent strips are provided, detecting substances like glucose, protein, blood, and pH. Dry chemistry is also used in blood tests measuring analytes like creatinine and uric acid.
Turbidity poster presentation final editKala Drake
Turbidity is caused by particles suspended in water that scatter light, making the water appear cloudy. For a school project, students developed methods to measure turbidity without expensive laboratory equipment. They created a series of standard solutions by mixing specific ratios of barium chloride and sulfuric acid, known as McFarland standards, which produce consistent levels of turbidity. The students then calibrated a simple turbidity tube and a spectrophotometer using the McFarland standards and measured turbidity in pond water samples. Both methods produced similar results, with the tube suitable for field use but less precise and the spectrophotometer more accurate but requiring a lab setting.
Application of uv visible spectroscopy in microbiologyFarhad Ashraf
UV-visible spectroscopy can be used to analyze various biomolecules and nitrogen compounds in microbiology. The interaction of electromagnetic radiation with matter allows for identification of unknown biomolecules based on their characteristic absorption spectra. Beer's law demonstrates that absorbance is directly proportional to concentration, allowing for quantification of substances. Total nitrogen can be determined by digesting all nitrogenous compounds to nitrate via autoclaving, then analyzing the nitrate concentration. Second derivative UV-visible spectroscopy provides an accurate technique for determining nitrate and total nitrogen in wastewater samples.
The document discusses various analytical techniques used in clinical chemistry laboratories including spectrophotometry, fluorometry, luminometry, nephelometry/turbidimetry, electrochemistry/chemical sensors, chromatography, mass spectrometry, and electrophoresis. It provides details on the basic components, principles, and applications of each technique.
This document discusses spectrophotometry and the Beer-Lambert law. It provides:
1) An overview of how spectrophotometers work by measuring the absorption of light by chemical compounds and relating absorption to concentration according to the Beer-Lambert law.
2) A description of the basic components of a spectrophotometer including a light source, wavelength selector, sample cuvette, detector, and readout device.
3) Explanations of how to prepare and measure standards to generate a calibration curve to determine unknown concentrations.
This document provides information about using a spectrophotometer for quantitative analysis. It discusses how spectrophotometers work based on the Beer-Lambert law relating absorbance of light to analyte concentration. The key components of a spectrophotometer are described including the light source, wavelength selector, sample cuvette, detector, and readout device. General procedures are outlined for preparing standard solutions to generate a calibration curve and determining concentrations of unknown samples.
Similar to MICRO VOLUME UV/VIS SPECTROSCOPY ,U5nano spectrophotometer (20)
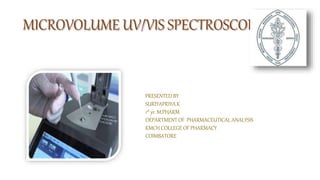
This presentation explains about the principle and procedure involved in elisa method of immunoassay, development o f elisa , application advantages and disadvantages of elisa
This presentation explains about the Immunoassay ,radio immuno assay, definition, types, Principle , procedure, steps involved ,advantages ,disadvantages ,Application, RIA in insulin. RIA in Digitalis drug ligand etc....
ADVANCED ANALYSIS OF CARBOHYDRATES ,ANALYSIS OF CARBOHYDRATES IN FOOD MATRICESsuriyapriya kamaraj
This document discusses advanced analysis methods for carbohydrates in food. It begins with an introduction to carbohydrate classification, including simple sugars, oligosaccharides, and polysaccharides. Sample preparation methods are outlined, such as extraction and fractionation. Advanced analytical techniques for carbohydrate analysis are then described, including gas chromatography, high performance liquid chromatography, capillary electrophoresis, and spectroscopic methods like NMR and mass spectrometry.
This presentation explains about qualifications of HPTLC, types of qualifications, design qualification , installation qualification ,operational qualification, performance qualification ,documentation of qualification .
This slide shows about the Intellectual property rights, Intellectual property laws, Law of protection, Patent, Copyrights, Trade Marks ,Trade secrets, Geographical Indication, Industrial Design, Registration process of Intellectual Property, Period of Validation. Protection of Intellectual Property, WIPO
The document discusses array detectors used in spectroscopy. It describes photodiode array detectors and charged coupled device (CCD) detectors. Photodiode array detectors contain an array of silicon photodiodes on a single chip that can simultaneously measure radiation intensities at all wavelengths. CCD detectors contain an array of linked capacitors that can transfer electric charges between neighboring capacitors, allowing detection of low intensity light signals. Both detector types offer advantages like low noise, wide spectral response, and simultaneous detection of emissions at different wavelengths.
Part 2 Deep Dive: Navigating the 2024 Slowdownjeffkluth1
Introduction
The global retail industry has weathered numerous storms, with the financial crisis of 2008 serving as a poignant reminder of the sector's resilience and adaptability. However, as we navigate the complex landscape of 2024, retailers face a unique set of challenges that demand innovative strategies and a fundamental shift in mindset. This white paper contrasts the impact of the 2008 recession on the retail sector with the current headwinds retailers are grappling with, while offering a comprehensive roadmap for success in this new paradigm.
The Most Inspiring Entrepreneurs to Follow in 2024.pdfthesiliconleaders
In a world where the potential of youth innovation remains vastly untouched, there emerges a guiding light in the form of Norm Goldstein, the Founder and CEO of EduNetwork Partners. His dedication to this cause has earned him recognition as a Congressional Leadership Award recipient.
The APCO Geopolitical Radar - Q3 2024 The Global Operating Environment for Bu...APCO
The Radar reflects input from APCO’s teams located around the world. It distils a host of interconnected events and trends into insights to inform operational and strategic decisions. Issues covered in this edition include:
The Genesis of BriansClub.cm Famous Dark WEb PlatformSabaaSudozai
BriansClub.cm, a famous platform on the dark web, has become one of the most infamous carding marketplaces, specializing in the sale of stolen credit card data.
Industrial Tech SW: Category Renewal and CreationChristian Dahlen
Every industrial revolution has created a new set of categories and a new set of players.
Multiple new technologies have emerged, but Samsara and C3.ai are only two companies which have gone public so far.
Manufacturing startups constitute the largest pipeline share of unicorns and IPO candidates in the SF Bay Area, and software startups dominate in Germany.
The Steadfast and Reliable Bull: Taurus Zodiac Signmy Pandit
Explore the steadfast and reliable nature of the Taurus Zodiac Sign. Discover the personality traits, key dates, and horoscope insights that define the determined and practical Taurus, and learn how their grounded nature makes them the anchor of the zodiac.
[To download this presentation, visit:
https://www.oeconsulting.com.sg/training-presentations]
This PowerPoint compilation offers a comprehensive overview of 20 leading innovation management frameworks and methodologies, selected for their broad applicability across various industries and organizational contexts. These frameworks are valuable resources for a wide range of users, including business professionals, educators, and consultants.
Each framework is presented with visually engaging diagrams and templates, ensuring the content is both informative and appealing. While this compilation is thorough, please note that the slides are intended as supplementary resources and may not be sufficient for standalone instructional purposes.
This compilation is ideal for anyone looking to enhance their understanding of innovation management and drive meaningful change within their organization. Whether you aim to improve product development processes, enhance customer experiences, or drive digital transformation, these frameworks offer valuable insights and tools to help you achieve your goals.
INCLUDED FRAMEWORKS/MODELS:
1. Stanford’s Design Thinking
2. IDEO’s Human-Centered Design
3. Strategyzer’s Business Model Innovation
4. Lean Startup Methodology
5. Agile Innovation Framework
6. Doblin’s Ten Types of Innovation
7. McKinsey’s Three Horizons of Growth
8. Customer Journey Map
9. Christensen’s Disruptive Innovation Theory
10. Blue Ocean Strategy
11. Strategyn’s Jobs-To-Be-Done (JTBD) Framework with Job Map
12. Design Sprint Framework
13. The Double Diamond
14. Lean Six Sigma DMAIC
15. TRIZ Problem-Solving Framework
16. Edward de Bono’s Six Thinking Hats
17. Stage-Gate Model
18. Toyota’s Six Steps of Kaizen
19. Microsoft’s Digital Transformation Framework
20. Design for Six Sigma (DFSS)
To download this presentation, visit:
https://www.oeconsulting.com.sg/training-presentations
Top 10 Free Accounting and Bookkeeping Apps for Small BusinessesYourLegal Accounting
Maintaining a proper record of your money is important for any business whether it is small or large. It helps you stay one step ahead in the financial race and be aware of your earnings and any tax obligations.
However, managing finances without an entire accounting staff can be challenging for small businesses.
Accounting apps can help with that! They resemble your private money manager.
They organize all of your transactions automatically as soon as you link them to your corporate bank account. Additionally, they are compatible with your phone, allowing you to monitor your finances from anywhere. Cool, right?
Thus, we’ll be looking at several fantastic accounting apps in this blog that will help you develop your business and save time.
IMPACT Silver is a pure silver zinc producer with over $260 million in revenue since 2008 and a large 100% owned 210km Mexico land package - 2024 catalysts includes new 14% grade zinc Plomosas mine and 20,000m of fully funded exploration drilling.
NIMA2024 | De toegevoegde waarde van DEI en ESG in campagnes | Nathalie Lam |...BBPMedia1
Nathalie zal delen hoe DEI en ESG een fundamentele rol kunnen spelen in je merkstrategie en je de juiste aansluiting kan creëren met je doelgroep. Door middel van voorbeelden en simpele handvatten toont ze hoe dit in jouw organisatie toegepast kan worden.
Best practices for project execution and deliveryCLIVE MINCHIN
A select set of project management best practices to keep your project on-track, on-cost and aligned to scope. Many firms have don't have the necessary skills, diligence, methods and oversight of their projects; this leads to slippage, higher costs and longer timeframes. Often firms have a history of projects that simply failed to move the needle. These best practices will help your firm avoid these pitfalls but they require fortitude to apply.
2. UV-VIS SPECTROSCOPY (OR SPECTROPHOTOMETRY)
It is a quantitative technique used to measure how much a chemical substance absorbs light.
This is done by measuring the intensity of light that passes through a sample with respect to the
intensity of light through a reference sample or blank.
MICROVOLUME UV-VIS SPECTROSCOPY
UV/VIS micro-volume spectrophotometry is a technique used to measure intensity of light with
only one drop of sample. So it is referred as to as low volume ,small volume ,nano
spectrophotometer . A wide range of concentrations is covered by automatically measured .
3. EVOLUTION OF UV /VISIBLE SPECTROPHOTOMETER :
In 1930s, American government’s interest in measuring vitamin contents using UV/Vis light.
In 1940 commercial launched UV-Vis spectrophotometer.
In 1941, Beckman introduces the DU UV-Vis spectrophotometer.
In 1946, Howard Cary is founded spectrophotometer named as Cary Instrument.
In 1950, National Technologies Laboratories changes its name to Beckman Instruments.
In 1953, Bausch & Lomb introduces the SPECTRONIC 20 UV-Vis spectrophotometer.
In 1954, Applied Physics Corporation launches the Cary 14 spectrophotometer.
In 1963, JASCO introduces the ORDUV-5 with double-beam UV-Vis capabilities.
In 1969, Cecil Instruments introduces the CE 21.
In 1979, Hewlett-Packard launches the first commercially available diode-array spectrophotometer.
In 1980, Bausch & Lomb introduces the Spectronic 2000 UV-Vis spectrophotometer.
In 1987, Pye Unicam Corporation. introduces the PU-8700 UV-Vis spectrophotometer.
4. In 1995, Hewlett-Packard launches the 8453A, diode-array spectrophotometer.
In 2000, Thermo Scientific introduces the GENESYS 10 instruments .
In 2002, Varian Inc. releases the 6000i UV-Vis-NIR spectrophotometer.
In 2003, Thermo Scientific introduces the Evolution 300 spectrophotometer, the first double-
beam xenon lamp-based spectrophotometer.
In 2004, Shimadzu introduces the SolidSpec-3700/3700DUV series of UV-Vis-NIR
spectrophotometers.
In 2005, the Nanodrop ND-1000 UV-Vis spectrophotometer .
In 2008, Shimadzu launches the UV- 1800 compact UV-Vis spectrophotometer.
In 2010, Thermo Scientific introduces the Evolution 200 Series spectrophotometer.
In2010, JASCO offers the SAH-769 One Drop.
In2011, Agilent Technologies releases the Cary 60 UV-Vis spectrophotometer.
5. MICRO-VOLUME UV/VIS SPECTROPHOTOMETER
INTRODUCTION :
Spectrophotometers are instruments used for measuring radiant or light energy, traditionally
with a quartz cuvette.
Improvements in technology now permit measuring in capillary-type or sample plate
containers.
One of such type of instrument is micro volume UV /visible spectrophotometer .
Microvolume spectrophotometers, also referred to as low volume, small volume or nano-
spectrophotometers.
7. MICRO-VOLUME UV/VIS SPECTROPHOTOMETER
WORKING:
Mettler-Toledo provides a spectrophotometer capable of performing micro-volume UV/VIS
measurement.
This instrument is capable of measuring very small volumes and highly concentrated
samples.
The method is fairly straightforward.
The sample is pipetted directly onto the measuring platform, without further dilution.
Therefore, manipulation errors are avoided.
Moreover, the selection of a specific path length allows for the measurement over a large
concentration range with as little as 1 µL of sample.
8. The measurements are performed at the micro-volume platform covered by a movable
arm mounted on the top of the instrument.
Spectrophotometer has both a micro-volume platform as well as a cuvette holder.
Depending on the selected application, the light can be directed either onto the micro-
volume platform or the 1 cm cuvette.
The transmitted light is then focused on the grating where diffraction occurs.
The diffracted light beams of different wavelengths are then directed onto the detector.
9. When the arm is in open position, the micro-volume platform can be easily accessed with
a pipette from either the left or the right side.
The curved lid on top of the instrument allows convenient positioning of the operator's
hand to securely guide the pipette tip.
During measurement, the arm is securely locked to a precisely defined path length and
cannot be opened until the measurement is completed.
The transmitted light is acquired by a detector charged coupled device .
12. CLEANING OF PLATFORM
On a micro-volume platform, samples with very small volumes, such as
microliters, can be measured
An initial cleaning of both measurement surfaces with dH2O is recommended.
dH2o is recommended for blank measurement in order to avoid interferences
with the measurements
Do NOT use a spray bottle to apply water or any other liquid to the surface of the
instrument.
13. Additional cleaning recommendations are as
follows:
Between measurements it is recommended to wipe the sample from both the upper and
lower platforms with a clean, dry, lint-free lab wipe.
Depending on the sample, a 60% isopropanol solution, ethanol or ultrapure water can be
used to clean the micro-volume platform.
If necessary, the solvent used to dissolve the sample can be applied.
When samples dried on the platform, additional cleaning can be performed using 3 µL of
0.5M HCl.
Finally , If detergents or 100% isopropyl alcohol are used, follow with 3 µL of dH2O as final
cleaning step.
14. The polished surface allows for droplet application of aqueous solutions with high contact
angle.
If the droplet flattens out, it is possible that after closing the micro volume arm the
measurement is performed through air, which will lead to erroneous measurement results.
This is visualized in the following images
For decontamination, a solution such as 0.5% sodium hypochlorite (commercial bleach
solution 1:10 diluted) can be applied to the micro-volume platform.
An additional cleansing with deionized water should follow.
18. TRICKS AND TIPS FOR ANALYSIS:
UV5NANO MICRO-VOLUME
SPECTROPHOTOMETER
Effectively clean the sample area
Properly set the pipette
Improve repeatability
Pipette smoothly on the platform
Determine rhythm and speed
19. MERITS
Accurate Microvolume Measurements
Only 1μL of sample is required for reliable measurements.
Measure Wide Concentration Ranges Fast
Double Application Power
The UV5Nano is two instruments in one: you can perform micro-volume or cuvette
measurements.
Convenient and secure
Robust and easy to maintain
With no moving parts in the optical set-up, the instrument is robust and easy to maintain.
The flat surface of the micro-volume platform makes cleaning fast and easy.
Ready to use
The Xenon flash lamp has no warm-up time. Simply power it up and start measuring.
20. DEMERITS
Light source from xenon flash lamp is expensive.
Skilled operator is required for handling sample pipette.
21. APPLICATION:
The capacity to measure volumes in the range of 0.5 to 5 ul,
Some models can measure even lower.
These instruments allow for quick and accurate quantification .
Gives accurate quantification of nucleic acids and protein samples , etc
Ideal for life science applications such as concentration and purity determinations of DNA, RNA
and protein samples
22. FUTURE OF UV-VIS SPECTROPHOTOMETERS
Future improvements in UV-Vis spectrophotometers will focus on ease-of-use,
portability, and application-specific instruments.
UV-Vis analysis of solid samples and materials continues to grow in areas
such as solar cell research, semiconductor products, and coating materials.
Advances in light sources will provide new developments in conventional
spectrophotometers and handheld UV-Vis instruments.
Further development in remote sensors will enable more types of samples to
be measured outside the laboratory.