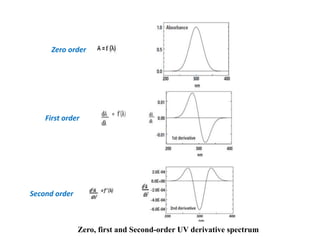
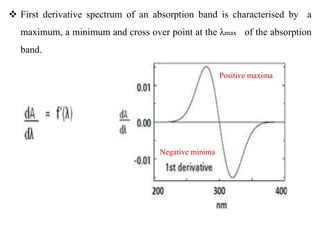
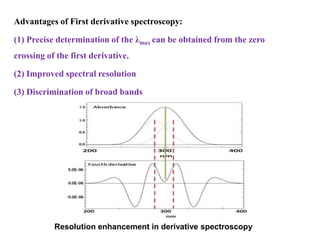
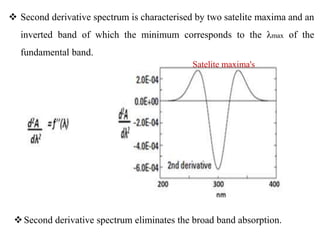
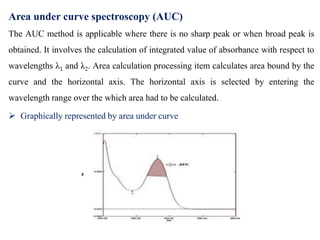
Derivative spectroscopy involves converting a normal absorption spectrum into its first or second derivative spectrum. This allows for more precise determination of the wavelength of maximum absorption and improved spectral resolution. The first derivative spectrum plots the rate of change of absorbance versus wavelength and shows a maximum, minimum and zero crossing at the absorption band's wavelength. The second derivative shows two satellite maxima with an inverted band minimum at the wavelength of maximum absorption. Area under curve spectroscopy calculates the integrated absorbance value over a specified wavelength range, graphically representing the area under the absorption curve. Both techniques have applications in pharmaceutical analysis for multicomponent assays and determination of physical constants.