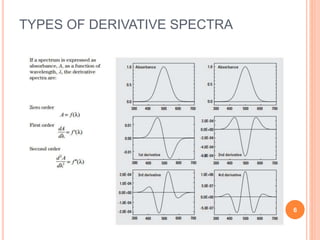
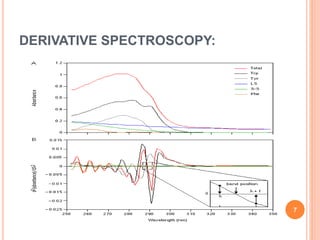
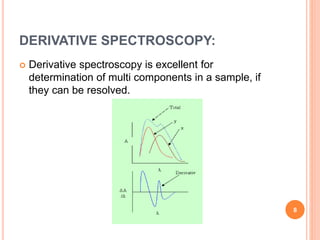
DERIVATIVE
SPECTROPHOTOMETRY
Presented by
RAHUL KRIRSHNAN.P.R
1st Year M.PHARM
Dept. OF PHARMACEUTICS
GRACE COLLEGE OF PHARMACY, PALAKKAD
1
BACKGROUND INFORMATION:
 In Chemistry, Analytical methods based on
measurements of UV or visible light absorption
belong to the most popular and most often used in
laboratory practices.
 Its Commercially available apparatuses are cheap
and easy for operation. Spectroscopy procedures
usually are not time and labor-consuming. The
economical aspects of UV-Vis techniques is worth
emphasizing as it is easily accessible and is a basic
equipment available in all laboratories.
 The main disadvantage and limitation of the
spectroscopy is its low selectivity. 2
 The measurement of absorbance is burden by
interferences derived from others components of
sample. A recorded UV-Vis spectrum is the sum of
absorbances of analyte and matrix.
 Usually, recorded bands are well-defined but more or
less distorted by a background. As the background is
called absorbance exhibited by matrix (reagents or
accompanied compounds).
 The problem with specific or nonspecific
background can be omitted by measurements
versus blank. Such procedure can be successfully
applied only in the case of simple samples, which
composition is stable and well known or when
highly selective reagents are used. An isolation of
an analyte from matrix is another solution for
increasing the selectivity of assay.
 But every additional operation introduced into sample
preparation procedure extents time and costs of single
analysis and increases risk of loss or contamination of
the analyte. 3
BACKGROUND INFORMATION CONT.:
 One of the simplest method for increasing a selectivity
is derivitisation of spectra. This operation allows us to
remove spectral interferences and as a consequence, leads
to the increase selectivity of assay.
 Derivatisation of sets of digital data is a well known
method of separation, using signals from noised data.
 `Historically, the beginning of derivative spectroscopy is
dated on 1953 when the first analogue spectroscopy was
build by Singleton and Cooler.
 But the fast development of this technique started in 70-s
of twentieth century, when new generation of spectroscopy
controlled by computers were constructed.
So what is Derivative Spectroscopy?...
4
DERIVATIVE SPECTROSCOPY:
 Derivative spectroscopy involves the conversion of a normal
spectra to its first, second or higher derivative spectra. The
normal spectrum is known as fundamental, zero order or D0
spectra.
 The first derivative spectrum (D1) is a plot of the rate of change of
absorbance with wavelength against wavelength, i.e. plot of ΔA/Δλ
vs. λ.
 The second derivative spectrum is a plot of Δ2A/ Δλ2 vs. λ.
Not only can the first and second derivative of the absorbance
spectrum be obtained, but up to the fourth derivative is possible.
 However, as the differentiation order increases, the noise
increases as well, and if a lower derivative is fine, going to
higher derivatives is a waste of time and effort.
 The next slide will show how mathematically the
derivatives are graphed
5
TYPES OF DERIVATIVE SPECTRA
6
DERIVATIVE SPECTROSCOPY:
7
DERIVATIVE SPECTROSCOPY:
 Derivative spectroscopy is excellent for
determination of multi components in a sample, if
they can be resolved.
8
The mechanics of Derivative spectra can either be
recorded on time or by manipulation of data
obtained in an absorbance/wavelength spectrum. The
latter is easy and can be made by simple electronic or
mathematic operations; by taking DA for a fixed Dλ
(few nm) and plotting the data versus wavelength.
However, the most common instrumental recording of
derivative spectra involves the use of a dual
wavelength instrument with two monochromator
operated at the same speed but with a lag of few nm
from each other. A chopper will sequentially pass the
beams from both monochromators and thus their
difference divided by the constant nm lag value is
recorded versus the average wavelength.
This is how it works…
9
ADVANTAGES
 Derivative spectrum shows better resolution of
overlapping bands than fundamental spectrum and
permits accurate determination of λmax of individual
bands.
 It also discriminates in the favour of substance of
narrow spectral bandwidth against broadband with
substance.
10
THE MECHANICS OF THE DERIVATIVE
SPECTROSCOPY
11
INSTRUMENTATION
 Derivative spectra may be generated by 3 techniques:
1.Modification of the optical system
 Spectrophotometers with dual monochromators, set a
small wavelength interval (Δ λ typically 1-3nm)apart or
with the facility to oscillate wavelength over a small
range are required.
 In either case, photodetector generates a signal with an
amplitude propotional to slope of spectrum over wavelength
interval. 12
2.ELECTRONIC DIFFERENTIATION OF
SPECTROPHOTOMETER ANALOGUE SIGNAL
Resistance capacitance (RC) modules are
highly dependent on instrumental parameters, the
scan speed and the time constant.
Resistance capacitance modules may be
incorporated in series between spectrophotometer
and recorder to provide differentiation of absorbance.
Standard solution of analysis is employed to
calibrate the measured value under the instrumental
condition selected 13
3.BASED ON MICROCOMPUTER
DIFFERENTIATION
Microcomputer may be programmed to
provide derivative spectra during or after
the scan, to measure derivative amplitudes
between specified wavelength and to
calculate concentration and associated
statistics from the measured amplitudes.
14
APPLICATIONS OF DERIVATIVE
SPECTRA:
The applications for the derivative spectra include:
 Better qualitative analysis and identification of the
number of absorbing species in a sample.
 Multicomponent analysis
 Derivative spectrophotometry (DS) has been mainly
used in pharmaceutical analysis for assaying of a main
ingredient in a presence of others components or its
degradation product. Pharmaceutical samples are
characterised by high level of constituents and presence
of a relatively simple and stable matrix. The spectral
influences of disturbing compounds are easy to remove
by derivatisation of spectra. The most numerous
procedures based on derivative spectra have been
devoted for determination of one components without
sample purification.
15
 Simultaneous determination of two or more
compounds
 Accurate determination of max
 Obtaining spectra in solutions with high scattering is
possible using dual wavelength instruments
16
CONCLUSION:
 The Derivative spectroscopy is a simple method
used during the analysis based on how we can
solve the problem of interferances between two
components inside binary solutions that gives two
maximum wavelengths overlapping one another.
 By using this method we can increase the
selectivity and accuracy of binary mixtures
17
18

Derivative spectrophotometry

  • 1.
    DERIVATIVE SPECTROPHOTOMETRY Presented by RAHUL KRIRSHNAN.P.R 1stYear M.PHARM Dept. OF PHARMACEUTICS GRACE COLLEGE OF PHARMACY, PALAKKAD 1
  • 2.
    BACKGROUND INFORMATION:  InChemistry, Analytical methods based on measurements of UV or visible light absorption belong to the most popular and most often used in laboratory practices.  Its Commercially available apparatuses are cheap and easy for operation. Spectroscopy procedures usually are not time and labor-consuming. The economical aspects of UV-Vis techniques is worth emphasizing as it is easily accessible and is a basic equipment available in all laboratories.  The main disadvantage and limitation of the spectroscopy is its low selectivity. 2
  • 3.
     The measurementof absorbance is burden by interferences derived from others components of sample. A recorded UV-Vis spectrum is the sum of absorbances of analyte and matrix.  Usually, recorded bands are well-defined but more or less distorted by a background. As the background is called absorbance exhibited by matrix (reagents or accompanied compounds).  The problem with specific or nonspecific background can be omitted by measurements versus blank. Such procedure can be successfully applied only in the case of simple samples, which composition is stable and well known or when highly selective reagents are used. An isolation of an analyte from matrix is another solution for increasing the selectivity of assay.  But every additional operation introduced into sample preparation procedure extents time and costs of single analysis and increases risk of loss or contamination of the analyte. 3
  • 4.
    BACKGROUND INFORMATION CONT.: One of the simplest method for increasing a selectivity is derivitisation of spectra. This operation allows us to remove spectral interferences and as a consequence, leads to the increase selectivity of assay.  Derivatisation of sets of digital data is a well known method of separation, using signals from noised data.  `Historically, the beginning of derivative spectroscopy is dated on 1953 when the first analogue spectroscopy was build by Singleton and Cooler.  But the fast development of this technique started in 70-s of twentieth century, when new generation of spectroscopy controlled by computers were constructed. So what is Derivative Spectroscopy?... 4
  • 5.
    DERIVATIVE SPECTROSCOPY:  Derivativespectroscopy involves the conversion of a normal spectra to its first, second or higher derivative spectra. The normal spectrum is known as fundamental, zero order or D0 spectra.  The first derivative spectrum (D1) is a plot of the rate of change of absorbance with wavelength against wavelength, i.e. plot of ΔA/Δλ vs. λ.  The second derivative spectrum is a plot of Δ2A/ Δλ2 vs. λ. Not only can the first and second derivative of the absorbance spectrum be obtained, but up to the fourth derivative is possible.  However, as the differentiation order increases, the noise increases as well, and if a lower derivative is fine, going to higher derivatives is a waste of time and effort.  The next slide will show how mathematically the derivatives are graphed 5
  • 6.
  • 7.
  • 8.
    DERIVATIVE SPECTROSCOPY:  Derivativespectroscopy is excellent for determination of multi components in a sample, if they can be resolved. 8
  • 9.
    The mechanics ofDerivative spectra can either be recorded on time or by manipulation of data obtained in an absorbance/wavelength spectrum. The latter is easy and can be made by simple electronic or mathematic operations; by taking DA for a fixed Dλ (few nm) and plotting the data versus wavelength. However, the most common instrumental recording of derivative spectra involves the use of a dual wavelength instrument with two monochromator operated at the same speed but with a lag of few nm from each other. A chopper will sequentially pass the beams from both monochromators and thus their difference divided by the constant nm lag value is recorded versus the average wavelength. This is how it works… 9
  • 10.
    ADVANTAGES  Derivative spectrumshows better resolution of overlapping bands than fundamental spectrum and permits accurate determination of λmax of individual bands.  It also discriminates in the favour of substance of narrow spectral bandwidth against broadband with substance. 10
  • 11.
    THE MECHANICS OFTHE DERIVATIVE SPECTROSCOPY 11
  • 12.
    INSTRUMENTATION  Derivative spectramay be generated by 3 techniques: 1.Modification of the optical system  Spectrophotometers with dual monochromators, set a small wavelength interval (Δ λ typically 1-3nm)apart or with the facility to oscillate wavelength over a small range are required.  In either case, photodetector generates a signal with an amplitude propotional to slope of spectrum over wavelength interval. 12
  • 13.
    2.ELECTRONIC DIFFERENTIATION OF SPECTROPHOTOMETERANALOGUE SIGNAL Resistance capacitance (RC) modules are highly dependent on instrumental parameters, the scan speed and the time constant. Resistance capacitance modules may be incorporated in series between spectrophotometer and recorder to provide differentiation of absorbance. Standard solution of analysis is employed to calibrate the measured value under the instrumental condition selected 13
  • 14.
    3.BASED ON MICROCOMPUTER DIFFERENTIATION Microcomputermay be programmed to provide derivative spectra during or after the scan, to measure derivative amplitudes between specified wavelength and to calculate concentration and associated statistics from the measured amplitudes. 14
  • 15.
    APPLICATIONS OF DERIVATIVE SPECTRA: Theapplications for the derivative spectra include:  Better qualitative analysis and identification of the number of absorbing species in a sample.  Multicomponent analysis  Derivative spectrophotometry (DS) has been mainly used in pharmaceutical analysis for assaying of a main ingredient in a presence of others components or its degradation product. Pharmaceutical samples are characterised by high level of constituents and presence of a relatively simple and stable matrix. The spectral influences of disturbing compounds are easy to remove by derivatisation of spectra. The most numerous procedures based on derivative spectra have been devoted for determination of one components without sample purification. 15
  • 16.
     Simultaneous determinationof two or more compounds  Accurate determination of max  Obtaining spectra in solutions with high scattering is possible using dual wavelength instruments 16
  • 17.
    CONCLUSION:  The Derivativespectroscopy is a simple method used during the analysis based on how we can solve the problem of interferances between two components inside binary solutions that gives two maximum wavelengths overlapping one another.  By using this method we can increase the selectivity and accuracy of binary mixtures 17
  • 18.