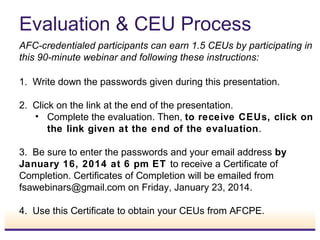
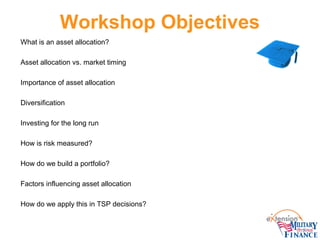
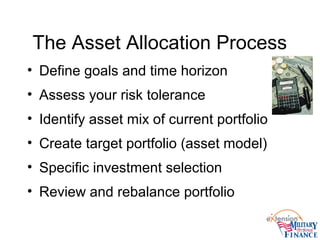
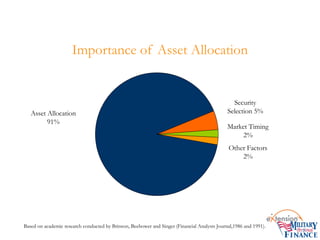
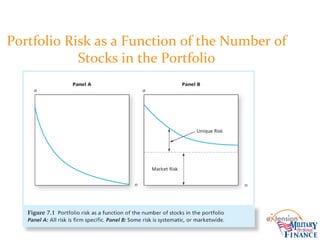
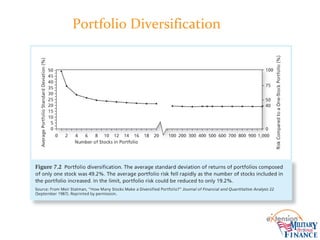
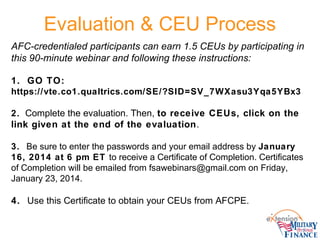
Sign up for webinar email notifications
http://bit.ly/MFLN-Notify
Provide feedback and earn CEU Credit with one link:
We will provide this link at the end of the webinar
Welcome to the
Military Families Learning Network
Webinar
This material is based upon work supported by the National Institute of Food and Agriculture, U.S. Department of Agriculture,
and the Office of Family Policy, Children and Youth, U.S. Department of Defense under Award Numbers 2010-48869-20685 and 2012-48755-20306.
Asset Allocation
and the Military Family
This material is based upon work supported by the National Institute of Food and Agriculture, U.S. Department of Agriculture,
and the Office of Family Policy, Children and Youth, U.S. Department of Defense under Award Numbers 2010-48869-20685 and 2012-48755-20306.
Research and evidenced-based
professional development
through engaged online communities.
eXtension.org/militaryfamilies
Welcome to the
Military Families Learning Network
POLL
How would you best describe your current employer?
Connect with the Personal
Finance Team
Facebook: PersonalFinance4PFMs
Twitter: #MFLNPF
blogs.extension.org/militaryfamilies/personal-finance/
Evaluation & CEU Process
AFC-credentialed participants can earn 1.5 CEUs by participating in
this 90-minute webinar and following these instructions:
1. Write down the passwords given during this presentation.
2. Click on the link at the end of the presentation.
• Complete the evaluation. Then, to receive CEUs, click on
the link given at the end of the evaluation.
3. Be sure to enter the passwords and your email address by
January 16, 2014 at 6 pm ET to receive a Certificate of
Completion. Certificates of Completion will be emailed from
fsawebinars@gmail.com on Friday, January 23, 2014.
4. Use this Certificate to obtain your CEUs from AFCPE.
Additional Resources Available:
learn.extension.org/events/1715
Today’s Speaker
•Michael Gutter, Ph.D. is an Associate Professor, Interim Family and
Consumer Sciences State Program Leader, and Financial
Management State Specialist for the Department of Family, Youth,
and Community Sciences, in the Institute for Food and Agricultural at
the University of Florida. His BS is in Family Financial Management
and his PhD is in Family Resource Management from The Ohio State
University with a specialization in Finance. Gutter currently explores
how financial education and financial socialization are related to
financial capability. His Extension Programming includes the Florida
Master Money Mentor Volunteer Program, Florida Saves, and
Fresh$tart Florida. He recently won Outstanding Conference Paper
Award for the 2010 Association for Financial Counseling and
Planning Education. The common theme that connects Dr. Gutter’s
Research, Teaching and Outreach is helping households achieve
financial security. His projects focus on enabling access to resources
and services as well as improving people’s knowledge and
understanding about family resource management. These projects
have had funding from the Consumer Federation of America and
Bank of America
Asset Allocation
and the Military Family
Michael S. Gutter, Ph.D.
University of Florida IFAS Extension
msgutter@ufl.edu
@mikegutter
Workshop Objectives
1. What is an asset allocation?
2. Asset allocation vs. market timing
3. Importance of asset allocation
4. Diversification
5. Investing for the long run
6. How is risk measured?
7. How do we build a portfolio?
8. Factors influencing asset allocation
9. How do we apply this in TSP decisions?
What is Asset Allocation?
Share your thoughts in the chat box.
What Is Asset Allocation?
• Process of diversifying portfolio investments
among several investment categories to
reduce investment risk
• Example: 50% stock, 30% bonds, 20%
cash assets (e.g., Treasury bills)
• Objective: lower investment risk by reducing
portfolio volatility
• Loss in one investment may be offset by
gains in another
The Callan Periodic Table of
Investment Returns
• Illustrates the need for asset allocation
• Shows how various asset classes
performed during the last 20 years
• Best performing asset class changes
(e.g., large company growth stocks:
1995-99 versus 2000)
• One year’s “winner” can be next year’s
“loser” so you invest in them all
• https://www.callan.com/research/files/757.pdf
Please comment in the chat
box
What have you heard about market
timing?
Please comment in the chat
box
What tricks or tips have you heard
of?
Why Asset Allocation? Because
Market Timing is Futile
• Value of $100 invested from June 1980
to June 2000:
– $2,456 in large company stocks (S&P 500
index)
– $613 in large company stocks minus the
best 15 months
• Biggest market gains are often
concentrated in short periods (can’t
afford to miss)
Growth of $10,000 over 25 Years
1
(3/31/83 – 3/31/08)
1. Source of chart data: FactSet 3/31/08. These asset allocation models are for illustrative purposes only and are not intended as investment advice or recommendations. Results are for
$10,000 hypothetical investments allocated to the percentages shown in each model from 3/31/83 – 3/31/08. Stocks are represented by the S&P 500 Index, a broad-based measure of
domestic stocks performance; bonds by the Lehman Brothers Aggregate Bond Index; foreign stocks by the Morgan Stanley Capital International (MSCI) EAFE Index, a broad-based measure
of foreign stock performance; commodities by the S&P GSCI, a composite index of commodity sector returns re presenting an unleveraged, long-only investment in commodity futures that is
broadly diversified across the spectrum of commodities. Indices include reinvested income, but not transaction costs or taxes, are unmanaged and cannot be purchased directly by investors.
This chart is for illustrative purposes only and does not predict or depict the performance of any investment. Past performance does not guarantee future results.
Stocks, commodities and bonds are subject to different risks. Stocks and commodities are also different from bonds, where bonds, if held to maturity, may offer both a fixed
rate of return and a fixed principal value. Fixed income investing entails credit risks and interest rate risks. When interest rates rise, bond prices generally fall and the Fund’s
share prices can fall. Foreign investing has special risks, including currency fluctuations, foreign taxes and political and economic
factors. Commodities may be subject to greater volatility. Diversification does not assure a profit or protect against a loss.
Past performance does not guarantee future results. Due to ongoing market volatility, current performance may be more or less
than the results shown in this presentation. The performance information does not show the effects of income taxes on an individual’s
investment. Taxes may reduce your actual investment returns or any gains you may realize if you sell your investment. An investor’s
shares, when redeemed, may be worth more or less than the original cost.
AggressiveAggressive
$221,714$221,714
70%
30%
ConservativeConservative
$118,309$118,309
10%
5%
15%
70%
Stocks Bonds Foreign Stocks Commodities
ModerateModerate
10%
10%
45%
35%
$152,769$152,769
Asset Allocation At Work
Second Example: The Futility
of Market Timing
• If investor missed the top 10 trading
days of 1998, 1999, and 2000: -41.7%
return
• If investor stayed fully invested, return
was 41.4%
• Figures are based on S&P 500 stock
market index
• Moral: stay invested in both bull & bear
markets
1. Source of chart data: Ned Davis Research, 3/31/08. The chart shows the results of a $1,000 hypothetical investment in the S&P 500 Index on 3/31/88 held through
3/31/08 compared to similar hypothetical investments in stocks that were not invested on the days that were the market highs during the period. The S&P 500 Index is a broad-based
measure of domestic stock market performance that includes the reinvestment of dividends. The index is unmanaged and cannot be purchased directly by investors. Index performance
is shown for illustrative purposes only and does not predict or depict the performance of any investment. For comparison, an investment in bonds is shown, represented by the Lehman
Brothers Aggregate Bond Index. Indices are unmanaged and cannot be purchased directly by investors. This chart is for illustrative purposes only and does not predict or depict the
performance of any Oppenheimer fund. Past performance does not guarantee future results. Stocks and bonds have different risks, where bonds, if held to maturity, may offer
both a fixed rate of return and a fixed principal value.
Past performance does not guarantee future results. Due to ongoing market volatility, current performance may be more or less
than the results shown in this presentation. The performance information does not show the effects of income taxes on an individual’s
investment. Taxes may reduce your actual investment returns or any gains you may realize if you sell your investment. An investor’s
shares, when redeemed, may be worth more or less than the original cost.
Stay in the Market—Don’t Miss Your Window
of Opportunity
Hypothetical $1,000 investment over 20-year period
1
(3/31/88 – 3/31/08)
If You…
Missed the
Top 25
Days
Missed the
Top 5
Days
Stayed
Invested
Missed the
Top 15
Days
Bonds
Compound 10.9% 9.5% 7.3% 5.4%
Return
7.5%
$7,948
$6,146
$4,071
$2,836
$4,218
No one can accurately
predict market
performance. Trying
to do so by moving in
and out of the market
can be very costly.
Trying to Predict the Market?
The Importance of Asset Allocation
• Asset allocation is the MOST important
decision an investor makes (buying
some stock, NOT Coke versus Pepsi)
• Asset allocation determines about 90%
of the return variation between
portfolios
• This study has been repeated
numerous times,by different
researchers, with similar results.
Why Use Asset Allocation?
Increase Long Term Investment Results
• Scenario #1: $100,000 invested at
8% over 25 years grows to $684,848
• Scenario #2: $100,000 divided
equally among 5 investments (One
loses principal and other 4 earn 0%,
5%, 10%, and 15% average annual
returns).
• Diversified portfolio will grow to
$962,800 over the long term
The Investment Decision
• Top-down process with 3 steps:
1.Capital allocation between the risky portfolio
and risk-free asset
1.Risky portfolio is essentially anything not in insured
accounts or Treasury
2.Asset allocation across broad asset classes
3.Security selection of individual assets within
each asset class
Diversification and Portfolio Risk
• Market risk
– Systematic or non-diversifiable
• Firm-specific risk
– Diversifiable or nonsystematic
Key Terms
• Correlation Coefficient (Rho: ρ) – strength and
direction of relationship between 2 variables
• Beta: (β) (1= “the market”)
– Measure of risk based on systematic risk
• Standard Deviation (σ)
– Used as measure of total risk
The Asset Allocation Process
• Define goals and time horizon
• Assess your risk tolerance
• Identify asset mix of current portfolio
• Create target portfolio (asset model)
• Specific investment selection
• Review and rebalance portfolio
Principles
of Asset Allocation
Importance of Asset Allocation
Based on academic research conducted by Brinson, Beebower and Singer (Financial Analysts Journal,1986 and 1991).
Asset Allocation
91%
Security
Selection 5%
Market Timing
2%
Other Factors
2%
Portfolio Risk as a Function of the Number of
Stocks in the Portfolio
Portfolio Diversification
Three Components in
Determining Allocation of Assets
Component #1
Asset Class Rates of Return
Asset Class Relationships
Volatility
Specialty Stocks
Small Cap Stock
Mid Cap Stock
Foreign Stock
Large Cap Stock
Specialty Bonds
Corporate Bonds
Government Bonds
Foreign Bonds
Real Estate
Commodities
Specialty Stocks
Small Cap Stock
Mid Cap Stock
Foreign Stock
Large Cap Stock
Specialty Bonds
Corporate Bonds
Government Bonds
Foreign Bonds
Real Estate
Commodities
This is designed to show general long-term relationships, as opposed to specific results. Actual volatility achieved will likely vary.
Cumulative Long-term Returns (80+ Years)
Based on cumulative index total returns 1926-2011. Source: Ibbotson Associates, U.S. Bureau of Labor Statistics.
$0
$1
$10
$100
$1,000
$10,000
$100,000
1925 1930 1935 1940 1945 1950 1955 1960 1965 1970 1975 1980 1985 1990 1995 2000 2005 2010
Large Company Stocks Small Company Stocks Long-Term Government Bonds
Treasury Bills Inflation
$21
$119
$3,037
$15,534
$13
Stocks, commodities, real estate,
and goldYear-end 1985–2005
Ending
wealth
Average
return
2.3%
10.8%
11.9%
8.0%
10.0%
Gold
Real estate
U.S. stocks
Hypothetical value of $1 invested at year-end 1985. Assumes reinvestment of income and no transaction costs or taxes.
$7.83
$9.52
$6.72
$4.64
$1.57
$.10
$1
$10
$100
1985 1990 1995 2000 2005
Commodities
International stocks
Short-Term (1-Year) Returns (%)
-40
-30
-20
-10
0
10
20
30
40
50
60
1990 1992 1994 1996 1998 2000 2002 2004 2006 2008 2010
Large Cap Stocks Small Cap Stocks Bonds Treasury Bills Real Estate Commodities
Based on single year index total returns. Source: Ibbotson Associates, Morningstar.
Three Components in
Determining Allocation of Assets
Component #2
Asset Class Volatility
(“Standard Deviation”)
Distribution of Returns by Asset Class
Histograms show frequency distributions of returns by range, based on index annual returns 1926-2011. Source: Ibbotson
Associates, Morningstar.
Asset Class Average
Return
Volatility
(Std. Dev.)
Small Company
Stocks
11.9% 32.3%
Large Company
Stocks
9.8% 20.2%
Long-Term
Government
Bonds
5.7% 9.7%
U.S. Treasury Bills 3.6% 3.1%
Return Distribution -60% 80%0%
Reduction of Risk Over Time
One Year Holding Period Five Year Holding Period Ten Year Holding Period Twenty Year Holding Period
-75%
-50%
-25%
0%
25%
50%
75%
100%
125%
150%
Small Company Stocks Large Company Stocks Long-Term Government
Bonds
Treasury Bills
Ranges show historic highest and lowest return achieved based on index rolling return periods 1926-2011. Source: Ibbotson
Associates, Morningstar.
Three Components in
Determining Allocation of Assets
Component #3
Relative Volatility of the Asset Classes
(“Correlation”)
Covariance and Correlation
• Portfolio risk depends on the
correlation between the returns of the
assets in the portfolio
• Covariance and the correlation
coefficient provide a measure of the
way returns of two assets vary
Correlations
Positive Correlation Negative Correlation
Correlation refers to how closely the returns of two distinct assets move relative to each other. Positive correlation implies a strong linear
relationship, while negative correlation signifies weak one.
Correlations of Asset Classes
Bonds
Large Cap
Stocks
Small Cap
Stocks
Foreign
Stocks
Real Estate Commodities
Bonds 100%
Large Cap Stocks 28% 100%
Small Cap Stocks 13% 78% 100%
Foreign Stocks 8% 67% 54% 100%
Real Estate 16% 57% 42% 42% 100%
Commodities -16% -7% -14% 0% -4% 100%
Long-term correlations calculated based on annual index returns (1972-2011). Source: Ibbotson Associates, Morningstar.
Portfolio Expected Return as a Function of Investment
Proportions
Portfolio Standard Deviation as a Function
of Investment Proportions
The Minimum Variance Portfolio
• The minimum variance
portfolio is the portfolio
composed of the risky
assets that has the
smallest standard
deviation, the portfolio
with least risk.
• When correlation is
less than +1, the
portfolio standard
deviation may be
smaller than that of
either of the individual
component assets.
• When correlation is
-1, the standard
deviation of the
minimum variance
portfolio is zero.
Portfolio Expected Return as a Function of
Standard Deviation
• The amount of possible risk reduction
through diversification depends on the
correlation.
• The risk reduction potential increases as
the correlation approaches -1.
– If ρ = +1.0, no risk reduction is possible.
– If ρ = 0, σP may be less than the standard
deviation of either component asset.
– If ρ = -1.0, a riskless hedge is possible.
Correlation Effects
Putting It All Together
Minimize volatility by combining
different classes of assets
Diversifying Risk
Return
50% Stocks / 50% Bonds
25% Stocks / 75% Bonds
100% Bonds
100% Stocks
Risk
75% Stocks / 25% Bonds
Based on long-term index total returns and standard deviations (1926-2011). Source: Ibbotson Associates, Morningstar.
Diversifying Risk
Addition of Real Estate
and Commodities
Stocks and Bonds
Return
Risk
Based on long-term index total returns and standard deviations (1972-2011). Source: Ibbotson Associates, Morningstar.
Disclosures
Indexes used in analysis:
Stocks (broad asset class): Standard & Poor’s 500 Composite Index (1926-2011)
Bonds (broad asset class): Ibbotson Long-Term U.S. Government Bond Series (1926-1985), Barclays Capital U.S. Aggregate (1986-2011)
Long-Term Government Bonds: Ibbotson Long-Term U.S. Government Bond Series (1926-2011)
Long-Term Corporate Bonds: Ibbotson Long-Term U.S. Corporate Bond Series (1926-2011)
Large Cap Stocks: Standard & Poor’s 500 Composite Index (1926-2011)
Small Cap Stocks: Ibbotson Small Company Return Series/CRSP Deciles 6-10 (1926-2011)
International Stocks: Morgan Stanley Capital International – Europe, Australia & Far East Index (1972-2011)
International Bonds: Citi/Salomon Non-Dollar World Government Bond Index (1985-2011)
Real Estate: National Association of Real Estate Investment Trusts – Equity REIT Index (1972-2011)
Commodities: S&P/Goldman Sachs Commodities Index (1972-2011)
Inflation: Consumer Price Index for Urban Consumers (CPI-U) (1926-2011)
On the efficient frontier slides: ‘Return’ represents average annualized total returns of different combinations of market indexes (on the
vertical axis). These consist of monthly total returns that are chained geometrically, and include both price appreciation and dividends.
‘Risk’ is represented by annualized standard deviation of monthly returns of combined market index portfolios (and are displayed on the
horizontal axis).
Index performance is provided as a benchmark but is not illustrative of any particular investment. An investment cannot be made in an
index. Market indexes do not include expenses, which are deducted from fund returns. The performance data shown represents past
performance, which is not a guarantee of future results. Investment returns and principal value will fluctuate, so that investors' shares,
when sold, may be worth more or less than their original cost.
Factors To Consider
• Your investment objective (e.g.,
college savings for child)
• Your time horizon for a goal (e.g.,
life expectancy for retirement)
• Amount of $ you have to invest
• Your risk tolerance and experience
• Personal factors (e.g., retirement)
• Your age and net worth
Downside of Asset Allocation
• A diversified portfolio MAY generate a
lower rate of return when compared to a
single “hot” asset class (e.g., growth
stocks from 1995-99) BUT
• You never know the “hot” asset class in
advance
• Asset allocation attempts to reduce
volatility and provide a competitive rate
of return
Major Asset Classes
• Large company growth
stocks
• Large company value
stocks
• Small company growth
stocks
• Small company value
stocks
• Mid cap growth stocks
• Mid cap value stocks
• Foreign stocks
– Developed
– Emerging
• Bonds
– Domestic
– International
• Real estate (e.g.,
REITs)
• Cash assets (e.g., CDs,
Treasury bills)
Why Invest Internationally?
• Correlations among world markets are
low (e.g., U.S. and foreign stocks)
• World markets (especially small
companies) are driven by local
dynamics
• Investing in U.S. multinationals does not
deliver the same level of diversification
• The benefits of diversification outweigh
currency, market, & political risks
• U.S. accounts for less than 1/3 of the
world’s equity markets
Other Things to Know About
Asset Allocation
• Good results are generally achieved
over time
• Diversify holdings within each asset
category
– Stock: different industry sectors
– Bonds: different types and maturities
• Retirees: keep at least 5 year’s
expenses in cash in case market tanks
More Asset Allocation Tips
• Stick to your asset allocation model
unless personal circumstances change
• Rebalance when asset percentages
change by a certain amount (e.g., 2%)
• Any one stock shouldn’t be > 5% of
portfolio and one sector no > 10%- 30%
• Ignore outdated guidelines (100 - age)
• Monitor mutual funds’ “style drift”
The Smart Money Worksheet
• Tally Step 1 question scores, multiply
by 2 = equity allocation (e.g., 25 x 2 =
50%)
• Tally Step 2 question scores = % of
money NOT going into stocks that
should go into bonds
• Remainder goes into cash assets
• Step 3: convert results into fixed
percentages for each asset class
Asset Allocation Mutual Funds
• Include varying proportions of stocks,
bonds, and cash in ONE fund
• Less volatile than 100% stock funds
• Some keep fixed percentages in each
asset class; others change with market
conditions - read prospectus!
• Example: Vanguard STAR (60-70%
growth funds, 20-30% fixed-income
funds, 10-20% money market fund)
Basic Investment Guidelines
• If it’s too good to be true, it is
• If you don’t understand it, don’t buy it
• Diversify, diversify, diversify
• Be patient
• Past performance does not guarantee
future results
Please comment in the chat
box
What is the role of information in making
investment decisions?
• Maurice Kendall (1953) found no
predictable pattern in stock prices.
• Prices are as likely to go up as to go
down on any particular day.
• How do we explain random stock price
changes?
Efficient Market Hypothesis (EMH)
• EMH says stock prices already reflect
all available information
• A forecast about favorable future
performance leads to favorable current
performance, as market participants
rush to trade on new information.
– Result: Prices change until expected
returns are exactly commensurate with
risk.
Efficient Market Hypothesis (EMH)
• New information is unpredictable; if it
could be predicted, then the prediction
would be part of today’s information.
• Stock prices that change in response to
new (unpredictable) information also
must move unpredictably.
• Stock price changes follow a random
walk.
• Information: The most precious commodity
on Wall Street
– Strong competition assures prices reflect
information.
– Information-gathering is motivated by
desire for higher investment returns.
– The marginal return on research activity
may be so small that only managers of
the largest portfolios will find them worth
pursuing.
EMH and Competition
Stock Market Analysts
• Some analysts may add value, but:
– Difficult to separate effects of new
information from changes in investor
demand
– Findings may lead to investing
strategies that are too expensive to
exploit
Mutual Fund Performance
• The conventional performance benchmark today
is a four-factor model, which employs:
– the three Fama-French factors (the return on
the market index, and returns to portfolios
based on size and book-to-market ratio)
– plus a momentum factor (a portfolio
constructed based on prior-year stock return).
Estimates of Individual Mutual Fund
Alphas, 1993 - 2007
• Consistency, the “hot hands”
phenomenon
– Carhart – weak evidence of persistency
– Bollen and Busse – support for
performance persistence over short time
horizons
– Berk and Green – skilled managers will
attract new funds until the costs of
managing those extra funds drive alphas
down to zero.
Mutual Fund Performance
Risk-adjusted performance in ranking
quarter and following quarter
So, Are Markets Efficient?
• The performance of professional
managers is broadly consistent with
market efficiency.
• Most managers do not do better than the
passive strategy.
• There are, however, some notable
superstars:
– Peter Lynch, Warren Buffett, John Templeton,
George Soros
What do military Service Men,
Women, and Their families
need to know about asset
allocation?
Please type your thoughts into the chat box
In addition to how one might build
mutual funds in an IRA for a
spouse…
What might this look like for
the TSP?
L: Income
Who Should Invest
For participants who are currently
withdrawing their TSP accounts in
monthly payments or who plan to begin
withdrawing before 2015.
Objective
To achieve a low level of growth with a
high emphasis on preservation of
assets.
Asset Allocations:
Unlike the other four L Funds, the L
Income Fund's asset allocation does
not change quarterly. However, like the
other funds, it is rebalanced daily to
maintain its target investment mix.
L: 2020
Who Should Invest
For participants who will withdraw their
money beginning 2015 through 2024.
Objective
To achieve a moderate level of growth with
a moderate emphasis on preservation of
assets.
Asset Allocations:
The Fund's allocation in the G, F, C, S, and
I Funds is adjusted quarterly. To see how
this works, use the slide bar below the pie
chart. L 2020 will roll into the L Income
Fund automatically in July 2020 when its
allocation becomes the same as the
allocation of the L Income Fund.
L: 2030
Who Should Invest
For participants who will withdraw their
money beginning 2025 through 2034.
Objective
To achieve a moderate to high level of
growth with a low emphasis on
preservation of assets.
Asset Allocations:
The Fund's allocation in the G, F, C, S, and
I Funds is adjusted quarterly. To see how
this works, use the slide bar below the pie
chart. L 2030 will roll into the L Income
Fund automatically in July 2030 when its
allocation becomes the same as the
allocation of the L Income Fund.
L: 2040
Who Should Invest
For participants who will withdraw their
money beginning 2035 through 2044.
Objective
To achieve a high level of growth with a low
emphasis on preservation of assets.
Asset Allocations:
The Fund's allocation in the G, F, C, S, and
I Funds is adjusted quarterly. To see how
this works, use the slide bar below the pie
chart. L 2040 will roll into the L Income
Fund automatically in July 2040 when its
allocation becomes the same as the
allocation of the L Income Fund.
L: 2050
Who Should Invest
For participants who will begin to withdraw
their money in 2045 or later.
Objective
To achieve a high level of growth with a
very low emphasis on preservation of
assets.
Asset Allocations:
The Fund's allocation in the G, F, C, S, and
I Funds is adjusted quarterly. To see how
this works, use the slide bar below the pie
chart. L 2050 will roll into the L Income
Fund automatically in July 2050 when its
allocation becomes the same as the
allocation of the L Income Fund.
So which should someone
choose?
• That as we know is a tough question.
• However one does need to consider
rebalancing investments as time moves
on.
– Not to chase returns
– But to match up to investment needs
Outside the TSP
• Likely build using mutual funds which
you can learn more about from our
recent web conference: How to Read a
Mutual Fund Prospectus
– https://www.youtube.com/watch?
v=VePjFK-IQRg
Key Take-Aways
• Market timing is not a prudent method for
building wealth
• Asset allocation is an important part of
Diversification
• Different allocations for different objectives,
e.g growth, income, balance, etc.
• The timing of one’s goals and their Risk
tolerance are important influences
Key Take-Away Applications
• The need for asset allocation in making
decisions regarding TSP or other
account types
• Families should consider the entire
portfolio as well as each account
• Help families understand the basic fund
choices as well as the lifestyle funds
and their role in managing asset
allocation
Any Questions?
Evaluation & CEU Process
AFC-credentialed participants can earn 1.5 CEUs by participating in
this 90-minute webinar and following these instructions:
1. GO TO:
https://vte.co1.qualtrics.com/SE/?SID=SV_7WXasu3Yqa5YBx3
2. Complete the evaluation. Then, to receive CEUs, click on the
link given at the end of the evaluation.
3. Be sure to enter the passwords and your email address by January
16, 2014 at 6 pm ET to receive a Certificate of Completion. Certificates
of Completion will be emailed from fsawebinars@gmail.com on Friday,
January 23, 2014.
4. Use this Certificate to obtain your CEUs from AFCPE.
Next Personal Finance
Webinar
Calculating What to Save for
Retirement
Tuesday, February 3, 11 a.m. ET
• https://learn.extension.org/events/1716
• Speaker: Dr. Barbara O’Neill
• 1.5 CEUs for AFC-credentialed participants
Military Families Learning
Network
This material is based upon work supported by the National Institute of Food and Agriculture, U.S. Department of Agriculture,
and the Office of Family Policy, Children and Youth, U.S. Department of Defense under Award Numbers 2010-48869-20685 and 2012-48755-20306.
Family Development
Military Caregiving
Personal Finance
Network Literacy
Find all upcoming and recorded webinars covering:
http://www.extension.org/62581

Developing an Asset Allocation Strategy and the Military Family

  • 1.
    Sign up forwebinar email notifications http://bit.ly/MFLN-Notify Provide feedback and earn CEU Credit with one link: We will provide this link at the end of the webinar Welcome to the Military Families Learning Network Webinar This material is based upon work supported by the National Institute of Food and Agriculture, U.S. Department of Agriculture, and the Office of Family Policy, Children and Youth, U.S. Department of Defense under Award Numbers 2010-48869-20685 and 2012-48755-20306. Asset Allocation and the Military Family
  • 2.
    This material isbased upon work supported by the National Institute of Food and Agriculture, U.S. Department of Agriculture, and the Office of Family Policy, Children and Youth, U.S. Department of Defense under Award Numbers 2010-48869-20685 and 2012-48755-20306. Research and evidenced-based professional development through engaged online communities. eXtension.org/militaryfamilies Welcome to the Military Families Learning Network
  • 3.
    POLL How would youbest describe your current employer?
  • 4.
    Connect with thePersonal Finance Team Facebook: PersonalFinance4PFMs Twitter: #MFLNPF blogs.extension.org/militaryfamilies/personal-finance/
  • 5.
    Evaluation & CEUProcess AFC-credentialed participants can earn 1.5 CEUs by participating in this 90-minute webinar and following these instructions: 1. Write down the passwords given during this presentation. 2. Click on the link at the end of the presentation. • Complete the evaluation. Then, to receive CEUs, click on the link given at the end of the evaluation. 3. Be sure to enter the passwords and your email address by January 16, 2014 at 6 pm ET to receive a Certificate of Completion. Certificates of Completion will be emailed from fsawebinars@gmail.com on Friday, January 23, 2014. 4. Use this Certificate to obtain your CEUs from AFCPE.
  • 6.
  • 7.
    Today’s Speaker •Michael Gutter,Ph.D. is an Associate Professor, Interim Family and Consumer Sciences State Program Leader, and Financial Management State Specialist for the Department of Family, Youth, and Community Sciences, in the Institute for Food and Agricultural at the University of Florida. His BS is in Family Financial Management and his PhD is in Family Resource Management from The Ohio State University with a specialization in Finance. Gutter currently explores how financial education and financial socialization are related to financial capability. His Extension Programming includes the Florida Master Money Mentor Volunteer Program, Florida Saves, and Fresh$tart Florida. He recently won Outstanding Conference Paper Award for the 2010 Association for Financial Counseling and Planning Education. The common theme that connects Dr. Gutter’s Research, Teaching and Outreach is helping households achieve financial security. His projects focus on enabling access to resources and services as well as improving people’s knowledge and understanding about family resource management. These projects have had funding from the Consumer Federation of America and Bank of America
  • 8.
    Asset Allocation and theMilitary Family Michael S. Gutter, Ph.D. University of Florida IFAS Extension msgutter@ufl.edu @mikegutter
  • 9.
    Workshop Objectives 1. Whatis an asset allocation? 2. Asset allocation vs. market timing 3. Importance of asset allocation 4. Diversification 5. Investing for the long run 6. How is risk measured? 7. How do we build a portfolio? 8. Factors influencing asset allocation 9. How do we apply this in TSP decisions?
  • 10.
    What is AssetAllocation? Share your thoughts in the chat box.
  • 11.
    What Is AssetAllocation? • Process of diversifying portfolio investments among several investment categories to reduce investment risk • Example: 50% stock, 30% bonds, 20% cash assets (e.g., Treasury bills) • Objective: lower investment risk by reducing portfolio volatility • Loss in one investment may be offset by gains in another
  • 12.
    The Callan PeriodicTable of Investment Returns • Illustrates the need for asset allocation • Shows how various asset classes performed during the last 20 years • Best performing asset class changes (e.g., large company growth stocks: 1995-99 versus 2000) • One year’s “winner” can be next year’s “loser” so you invest in them all • https://www.callan.com/research/files/757.pdf
  • 13.
    Please comment inthe chat box What have you heard about market timing?
  • 14.
    Please comment inthe chat box What tricks or tips have you heard of?
  • 15.
    Why Asset Allocation?Because Market Timing is Futile • Value of $100 invested from June 1980 to June 2000: – $2,456 in large company stocks (S&P 500 index) – $613 in large company stocks minus the best 15 months • Biggest market gains are often concentrated in short periods (can’t afford to miss)
  • 16.
    Growth of $10,000over 25 Years 1 (3/31/83 – 3/31/08) 1. Source of chart data: FactSet 3/31/08. These asset allocation models are for illustrative purposes only and are not intended as investment advice or recommendations. Results are for $10,000 hypothetical investments allocated to the percentages shown in each model from 3/31/83 – 3/31/08. Stocks are represented by the S&P 500 Index, a broad-based measure of domestic stocks performance; bonds by the Lehman Brothers Aggregate Bond Index; foreign stocks by the Morgan Stanley Capital International (MSCI) EAFE Index, a broad-based measure of foreign stock performance; commodities by the S&P GSCI, a composite index of commodity sector returns re presenting an unleveraged, long-only investment in commodity futures that is broadly diversified across the spectrum of commodities. Indices include reinvested income, but not transaction costs or taxes, are unmanaged and cannot be purchased directly by investors. This chart is for illustrative purposes only and does not predict or depict the performance of any investment. Past performance does not guarantee future results. Stocks, commodities and bonds are subject to different risks. Stocks and commodities are also different from bonds, where bonds, if held to maturity, may offer both a fixed rate of return and a fixed principal value. Fixed income investing entails credit risks and interest rate risks. When interest rates rise, bond prices generally fall and the Fund’s share prices can fall. Foreign investing has special risks, including currency fluctuations, foreign taxes and political and economic factors. Commodities may be subject to greater volatility. Diversification does not assure a profit or protect against a loss. Past performance does not guarantee future results. Due to ongoing market volatility, current performance may be more or less than the results shown in this presentation. The performance information does not show the effects of income taxes on an individual’s investment. Taxes may reduce your actual investment returns or any gains you may realize if you sell your investment. An investor’s shares, when redeemed, may be worth more or less than the original cost. AggressiveAggressive $221,714$221,714 70% 30% ConservativeConservative $118,309$118,309 10% 5% 15% 70% Stocks Bonds Foreign Stocks Commodities ModerateModerate 10% 10% 45% 35% $152,769$152,769 Asset Allocation At Work
  • 17.
    Second Example: TheFutility of Market Timing • If investor missed the top 10 trading days of 1998, 1999, and 2000: -41.7% return • If investor stayed fully invested, return was 41.4% • Figures are based on S&P 500 stock market index • Moral: stay invested in both bull & bear markets
  • 18.
    1. Source ofchart data: Ned Davis Research, 3/31/08. The chart shows the results of a $1,000 hypothetical investment in the S&P 500 Index on 3/31/88 held through 3/31/08 compared to similar hypothetical investments in stocks that were not invested on the days that were the market highs during the period. The S&P 500 Index is a broad-based measure of domestic stock market performance that includes the reinvestment of dividends. The index is unmanaged and cannot be purchased directly by investors. Index performance is shown for illustrative purposes only and does not predict or depict the performance of any investment. For comparison, an investment in bonds is shown, represented by the Lehman Brothers Aggregate Bond Index. Indices are unmanaged and cannot be purchased directly by investors. This chart is for illustrative purposes only and does not predict or depict the performance of any Oppenheimer fund. Past performance does not guarantee future results. Stocks and bonds have different risks, where bonds, if held to maturity, may offer both a fixed rate of return and a fixed principal value. Past performance does not guarantee future results. Due to ongoing market volatility, current performance may be more or less than the results shown in this presentation. The performance information does not show the effects of income taxes on an individual’s investment. Taxes may reduce your actual investment returns or any gains you may realize if you sell your investment. An investor’s shares, when redeemed, may be worth more or less than the original cost. Stay in the Market—Don’t Miss Your Window of Opportunity Hypothetical $1,000 investment over 20-year period 1 (3/31/88 – 3/31/08) If You… Missed the Top 25 Days Missed the Top 5 Days Stayed Invested Missed the Top 15 Days Bonds Compound 10.9% 9.5% 7.3% 5.4% Return 7.5% $7,948 $6,146 $4,071 $2,836 $4,218 No one can accurately predict market performance. Trying to do so by moving in and out of the market can be very costly. Trying to Predict the Market?
  • 19.
    The Importance ofAsset Allocation • Asset allocation is the MOST important decision an investor makes (buying some stock, NOT Coke versus Pepsi) • Asset allocation determines about 90% of the return variation between portfolios • This study has been repeated numerous times,by different researchers, with similar results.
  • 20.
    Why Use AssetAllocation? Increase Long Term Investment Results • Scenario #1: $100,000 invested at 8% over 25 years grows to $684,848 • Scenario #2: $100,000 divided equally among 5 investments (One loses principal and other 4 earn 0%, 5%, 10%, and 15% average annual returns). • Diversified portfolio will grow to $962,800 over the long term
  • 21.
    The Investment Decision •Top-down process with 3 steps: 1.Capital allocation between the risky portfolio and risk-free asset 1.Risky portfolio is essentially anything not in insured accounts or Treasury 2.Asset allocation across broad asset classes 3.Security selection of individual assets within each asset class
  • 22.
    Diversification and PortfolioRisk • Market risk – Systematic or non-diversifiable • Firm-specific risk – Diversifiable or nonsystematic
  • 23.
    Key Terms • CorrelationCoefficient (Rho: ρ) – strength and direction of relationship between 2 variables • Beta: (β) (1= “the market”) – Measure of risk based on systematic risk • Standard Deviation (σ) – Used as measure of total risk
  • 24.
    The Asset AllocationProcess • Define goals and time horizon • Assess your risk tolerance • Identify asset mix of current portfolio • Create target portfolio (asset model) • Specific investment selection • Review and rebalance portfolio
  • 25.
  • 26.
    Importance of AssetAllocation Based on academic research conducted by Brinson, Beebower and Singer (Financial Analysts Journal,1986 and 1991). Asset Allocation 91% Security Selection 5% Market Timing 2% Other Factors 2%
  • 27.
    Portfolio Risk asa Function of the Number of Stocks in the Portfolio
  • 28.
  • 29.
    Three Components in DeterminingAllocation of Assets Component #1 Asset Class Rates of Return
  • 30.
    Asset Class Relationships Volatility SpecialtyStocks Small Cap Stock Mid Cap Stock Foreign Stock Large Cap Stock Specialty Bonds Corporate Bonds Government Bonds Foreign Bonds Real Estate Commodities Specialty Stocks Small Cap Stock Mid Cap Stock Foreign Stock Large Cap Stock Specialty Bonds Corporate Bonds Government Bonds Foreign Bonds Real Estate Commodities This is designed to show general long-term relationships, as opposed to specific results. Actual volatility achieved will likely vary.
  • 31.
    Cumulative Long-term Returns(80+ Years) Based on cumulative index total returns 1926-2011. Source: Ibbotson Associates, U.S. Bureau of Labor Statistics. $0 $1 $10 $100 $1,000 $10,000 $100,000 1925 1930 1935 1940 1945 1950 1955 1960 1965 1970 1975 1980 1985 1990 1995 2000 2005 2010 Large Company Stocks Small Company Stocks Long-Term Government Bonds Treasury Bills Inflation $21 $119 $3,037 $15,534 $13
  • 32.
    Stocks, commodities, realestate, and goldYear-end 1985–2005 Ending wealth Average return 2.3% 10.8% 11.9% 8.0% 10.0% Gold Real estate U.S. stocks Hypothetical value of $1 invested at year-end 1985. Assumes reinvestment of income and no transaction costs or taxes. $7.83 $9.52 $6.72 $4.64 $1.57 $.10 $1 $10 $100 1985 1990 1995 2000 2005 Commodities International stocks
  • 33.
    Short-Term (1-Year) Returns(%) -40 -30 -20 -10 0 10 20 30 40 50 60 1990 1992 1994 1996 1998 2000 2002 2004 2006 2008 2010 Large Cap Stocks Small Cap Stocks Bonds Treasury Bills Real Estate Commodities Based on single year index total returns. Source: Ibbotson Associates, Morningstar.
  • 34.
    Three Components in DeterminingAllocation of Assets Component #2 Asset Class Volatility (“Standard Deviation”)
  • 35.
    Distribution of Returnsby Asset Class Histograms show frequency distributions of returns by range, based on index annual returns 1926-2011. Source: Ibbotson Associates, Morningstar. Asset Class Average Return Volatility (Std. Dev.) Small Company Stocks 11.9% 32.3% Large Company Stocks 9.8% 20.2% Long-Term Government Bonds 5.7% 9.7% U.S. Treasury Bills 3.6% 3.1% Return Distribution -60% 80%0%
  • 36.
    Reduction of RiskOver Time One Year Holding Period Five Year Holding Period Ten Year Holding Period Twenty Year Holding Period -75% -50% -25% 0% 25% 50% 75% 100% 125% 150% Small Company Stocks Large Company Stocks Long-Term Government Bonds Treasury Bills Ranges show historic highest and lowest return achieved based on index rolling return periods 1926-2011. Source: Ibbotson Associates, Morningstar.
  • 37.
    Three Components in DeterminingAllocation of Assets Component #3 Relative Volatility of the Asset Classes (“Correlation”)
  • 38.
    Covariance and Correlation •Portfolio risk depends on the correlation between the returns of the assets in the portfolio • Covariance and the correlation coefficient provide a measure of the way returns of two assets vary
  • 39.
    Correlations Positive Correlation NegativeCorrelation Correlation refers to how closely the returns of two distinct assets move relative to each other. Positive correlation implies a strong linear relationship, while negative correlation signifies weak one.
  • 40.
    Correlations of AssetClasses Bonds Large Cap Stocks Small Cap Stocks Foreign Stocks Real Estate Commodities Bonds 100% Large Cap Stocks 28% 100% Small Cap Stocks 13% 78% 100% Foreign Stocks 8% 67% 54% 100% Real Estate 16% 57% 42% 42% 100% Commodities -16% -7% -14% 0% -4% 100% Long-term correlations calculated based on annual index returns (1972-2011). Source: Ibbotson Associates, Morningstar.
  • 41.
    Portfolio Expected Returnas a Function of Investment Proportions
  • 42.
    Portfolio Standard Deviationas a Function of Investment Proportions
  • 43.
    The Minimum VariancePortfolio • The minimum variance portfolio is the portfolio composed of the risky assets that has the smallest standard deviation, the portfolio with least risk. • When correlation is less than +1, the portfolio standard deviation may be smaller than that of either of the individual component assets. • When correlation is -1, the standard deviation of the minimum variance portfolio is zero.
  • 44.
    Portfolio Expected Returnas a Function of Standard Deviation
  • 45.
    • The amountof possible risk reduction through diversification depends on the correlation. • The risk reduction potential increases as the correlation approaches -1. – If ρ = +1.0, no risk reduction is possible. – If ρ = 0, σP may be less than the standard deviation of either component asset. – If ρ = -1.0, a riskless hedge is possible. Correlation Effects
  • 46.
    Putting It AllTogether Minimize volatility by combining different classes of assets
  • 47.
    Diversifying Risk Return 50% Stocks/ 50% Bonds 25% Stocks / 75% Bonds 100% Bonds 100% Stocks Risk 75% Stocks / 25% Bonds Based on long-term index total returns and standard deviations (1926-2011). Source: Ibbotson Associates, Morningstar.
  • 48.
    Diversifying Risk Addition ofReal Estate and Commodities Stocks and Bonds Return Risk Based on long-term index total returns and standard deviations (1972-2011). Source: Ibbotson Associates, Morningstar.
  • 49.
    Disclosures Indexes used inanalysis: Stocks (broad asset class): Standard & Poor’s 500 Composite Index (1926-2011) Bonds (broad asset class): Ibbotson Long-Term U.S. Government Bond Series (1926-1985), Barclays Capital U.S. Aggregate (1986-2011) Long-Term Government Bonds: Ibbotson Long-Term U.S. Government Bond Series (1926-2011) Long-Term Corporate Bonds: Ibbotson Long-Term U.S. Corporate Bond Series (1926-2011) Large Cap Stocks: Standard & Poor’s 500 Composite Index (1926-2011) Small Cap Stocks: Ibbotson Small Company Return Series/CRSP Deciles 6-10 (1926-2011) International Stocks: Morgan Stanley Capital International – Europe, Australia & Far East Index (1972-2011) International Bonds: Citi/Salomon Non-Dollar World Government Bond Index (1985-2011) Real Estate: National Association of Real Estate Investment Trusts – Equity REIT Index (1972-2011) Commodities: S&P/Goldman Sachs Commodities Index (1972-2011) Inflation: Consumer Price Index for Urban Consumers (CPI-U) (1926-2011) On the efficient frontier slides: ‘Return’ represents average annualized total returns of different combinations of market indexes (on the vertical axis). These consist of monthly total returns that are chained geometrically, and include both price appreciation and dividends. ‘Risk’ is represented by annualized standard deviation of monthly returns of combined market index portfolios (and are displayed on the horizontal axis). Index performance is provided as a benchmark but is not illustrative of any particular investment. An investment cannot be made in an index. Market indexes do not include expenses, which are deducted from fund returns. The performance data shown represents past performance, which is not a guarantee of future results. Investment returns and principal value will fluctuate, so that investors' shares, when sold, may be worth more or less than their original cost.
  • 50.
    Factors To Consider •Your investment objective (e.g., college savings for child) • Your time horizon for a goal (e.g., life expectancy for retirement) • Amount of $ you have to invest • Your risk tolerance and experience • Personal factors (e.g., retirement) • Your age and net worth
  • 51.
    Downside of AssetAllocation • A diversified portfolio MAY generate a lower rate of return when compared to a single “hot” asset class (e.g., growth stocks from 1995-99) BUT • You never know the “hot” asset class in advance • Asset allocation attempts to reduce volatility and provide a competitive rate of return
  • 52.
    Major Asset Classes •Large company growth stocks • Large company value stocks • Small company growth stocks • Small company value stocks • Mid cap growth stocks • Mid cap value stocks • Foreign stocks – Developed – Emerging • Bonds – Domestic – International • Real estate (e.g., REITs) • Cash assets (e.g., CDs, Treasury bills)
  • 53.
    Why Invest Internationally? •Correlations among world markets are low (e.g., U.S. and foreign stocks) • World markets (especially small companies) are driven by local dynamics • Investing in U.S. multinationals does not deliver the same level of diversification • The benefits of diversification outweigh currency, market, & political risks • U.S. accounts for less than 1/3 of the world’s equity markets
  • 54.
    Other Things toKnow About Asset Allocation • Good results are generally achieved over time • Diversify holdings within each asset category – Stock: different industry sectors – Bonds: different types and maturities • Retirees: keep at least 5 year’s expenses in cash in case market tanks
  • 55.
    More Asset AllocationTips • Stick to your asset allocation model unless personal circumstances change • Rebalance when asset percentages change by a certain amount (e.g., 2%) • Any one stock shouldn’t be > 5% of portfolio and one sector no > 10%- 30% • Ignore outdated guidelines (100 - age) • Monitor mutual funds’ “style drift”
  • 56.
    The Smart MoneyWorksheet • Tally Step 1 question scores, multiply by 2 = equity allocation (e.g., 25 x 2 = 50%) • Tally Step 2 question scores = % of money NOT going into stocks that should go into bonds • Remainder goes into cash assets • Step 3: convert results into fixed percentages for each asset class
  • 57.
    Asset Allocation MutualFunds • Include varying proportions of stocks, bonds, and cash in ONE fund • Less volatile than 100% stock funds • Some keep fixed percentages in each asset class; others change with market conditions - read prospectus! • Example: Vanguard STAR (60-70% growth funds, 20-30% fixed-income funds, 10-20% money market fund)
  • 58.
    Basic Investment Guidelines •If it’s too good to be true, it is • If you don’t understand it, don’t buy it • Diversify, diversify, diversify • Be patient • Past performance does not guarantee future results
  • 59.
    Please comment inthe chat box What is the role of information in making investment decisions?
  • 60.
    • Maurice Kendall(1953) found no predictable pattern in stock prices. • Prices are as likely to go up as to go down on any particular day. • How do we explain random stock price changes? Efficient Market Hypothesis (EMH)
  • 61.
    Efficient Market Hypothesis(EMH) • EMH says stock prices already reflect all available information • A forecast about favorable future performance leads to favorable current performance, as market participants rush to trade on new information. – Result: Prices change until expected returns are exactly commensurate with risk.
  • 62.
    Efficient Market Hypothesis(EMH) • New information is unpredictable; if it could be predicted, then the prediction would be part of today’s information. • Stock prices that change in response to new (unpredictable) information also must move unpredictably. • Stock price changes follow a random walk.
  • 65.
    • Information: Themost precious commodity on Wall Street – Strong competition assures prices reflect information. – Information-gathering is motivated by desire for higher investment returns. – The marginal return on research activity may be so small that only managers of the largest portfolios will find them worth pursuing. EMH and Competition
  • 66.
    Stock Market Analysts •Some analysts may add value, but: – Difficult to separate effects of new information from changes in investor demand – Findings may lead to investing strategies that are too expensive to exploit
  • 67.
    Mutual Fund Performance •The conventional performance benchmark today is a four-factor model, which employs: – the three Fama-French factors (the return on the market index, and returns to portfolios based on size and book-to-market ratio) – plus a momentum factor (a portfolio constructed based on prior-year stock return).
  • 68.
    Estimates of IndividualMutual Fund Alphas, 1993 - 2007
  • 69.
    • Consistency, the“hot hands” phenomenon – Carhart – weak evidence of persistency – Bollen and Busse – support for performance persistence over short time horizons – Berk and Green – skilled managers will attract new funds until the costs of managing those extra funds drive alphas down to zero. Mutual Fund Performance
  • 70.
    Risk-adjusted performance inranking quarter and following quarter
  • 71.
    So, Are MarketsEfficient? • The performance of professional managers is broadly consistent with market efficiency. • Most managers do not do better than the passive strategy. • There are, however, some notable superstars: – Peter Lynch, Warren Buffett, John Templeton, George Soros
  • 72.
    What do militaryService Men, Women, and Their families need to know about asset allocation? Please type your thoughts into the chat box
  • 73.
    In addition tohow one might build mutual funds in an IRA for a spouse… What might this look like for the TSP?
  • 75.
    L: Income Who ShouldInvest For participants who are currently withdrawing their TSP accounts in monthly payments or who plan to begin withdrawing before 2015. Objective To achieve a low level of growth with a high emphasis on preservation of assets. Asset Allocations: Unlike the other four L Funds, the L Income Fund's asset allocation does not change quarterly. However, like the other funds, it is rebalanced daily to maintain its target investment mix.
  • 76.
    L: 2020 Who ShouldInvest For participants who will withdraw their money beginning 2015 through 2024. Objective To achieve a moderate level of growth with a moderate emphasis on preservation of assets. Asset Allocations: The Fund's allocation in the G, F, C, S, and I Funds is adjusted quarterly. To see how this works, use the slide bar below the pie chart. L 2020 will roll into the L Income Fund automatically in July 2020 when its allocation becomes the same as the allocation of the L Income Fund.
  • 77.
    L: 2030 Who ShouldInvest For participants who will withdraw their money beginning 2025 through 2034. Objective To achieve a moderate to high level of growth with a low emphasis on preservation of assets. Asset Allocations: The Fund's allocation in the G, F, C, S, and I Funds is adjusted quarterly. To see how this works, use the slide bar below the pie chart. L 2030 will roll into the L Income Fund automatically in July 2030 when its allocation becomes the same as the allocation of the L Income Fund.
  • 78.
    L: 2040 Who ShouldInvest For participants who will withdraw their money beginning 2035 through 2044. Objective To achieve a high level of growth with a low emphasis on preservation of assets. Asset Allocations: The Fund's allocation in the G, F, C, S, and I Funds is adjusted quarterly. To see how this works, use the slide bar below the pie chart. L 2040 will roll into the L Income Fund automatically in July 2040 when its allocation becomes the same as the allocation of the L Income Fund.
  • 79.
    L: 2050 Who ShouldInvest For participants who will begin to withdraw their money in 2045 or later. Objective To achieve a high level of growth with a very low emphasis on preservation of assets. Asset Allocations: The Fund's allocation in the G, F, C, S, and I Funds is adjusted quarterly. To see how this works, use the slide bar below the pie chart. L 2050 will roll into the L Income Fund automatically in July 2050 when its allocation becomes the same as the allocation of the L Income Fund.
  • 80.
    So which shouldsomeone choose? • That as we know is a tough question. • However one does need to consider rebalancing investments as time moves on. – Not to chase returns – But to match up to investment needs
  • 81.
    Outside the TSP •Likely build using mutual funds which you can learn more about from our recent web conference: How to Read a Mutual Fund Prospectus – https://www.youtube.com/watch? v=VePjFK-IQRg
  • 82.
    Key Take-Aways • Markettiming is not a prudent method for building wealth • Asset allocation is an important part of Diversification • Different allocations for different objectives, e.g growth, income, balance, etc. • The timing of one’s goals and their Risk tolerance are important influences
  • 83.
    Key Take-Away Applications •The need for asset allocation in making decisions regarding TSP or other account types • Families should consider the entire portfolio as well as each account • Help families understand the basic fund choices as well as the lifestyle funds and their role in managing asset allocation
  • 84.
  • 85.
    Evaluation & CEUProcess AFC-credentialed participants can earn 1.5 CEUs by participating in this 90-minute webinar and following these instructions: 1. GO TO: https://vte.co1.qualtrics.com/SE/?SID=SV_7WXasu3Yqa5YBx3 2. Complete the evaluation. Then, to receive CEUs, click on the link given at the end of the evaluation. 3. Be sure to enter the passwords and your email address by January 16, 2014 at 6 pm ET to receive a Certificate of Completion. Certificates of Completion will be emailed from fsawebinars@gmail.com on Friday, January 23, 2014. 4. Use this Certificate to obtain your CEUs from AFCPE.
  • 86.
    Next Personal Finance Webinar CalculatingWhat to Save for Retirement Tuesday, February 3, 11 a.m. ET • https://learn.extension.org/events/1716 • Speaker: Dr. Barbara O’Neill • 1.5 CEUs for AFC-credentialed participants
  • 87.
    Military Families Learning Network Thismaterial is based upon work supported by the National Institute of Food and Agriculture, U.S. Department of Agriculture, and the Office of Family Policy, Children and Youth, U.S. Department of Defense under Award Numbers 2010-48869-20685 and 2012-48755-20306. Family Development Military Caregiving Personal Finance Network Literacy Find all upcoming and recorded webinars covering: http://www.extension.org/62581

Editor's Notes

  • #6 Here is the link to the evaulation, at the end of the evaulation you will be given directions for receiving your certificate of completion. There is only 1 link
  • #17 Asset Allocation at Work Asset allocation could help you reach your goals. A good financial advisor can tailor a portfolio designed to meet your financial needs and risk tolerance. •You can see from the chart that, in general, a more aggressive portfolio historically performed better over the long term •Don’t forget about risk tolerance when allocating your portfolio. You need to find the blend of asset classes you are comfortable with after considering your goals and financial situation •Keep in mind that stocks, commodities and bonds are subject to different risks. Stocks and commodities are also different from bonds, in that bonds, if held to maturity, may offer both a fixed rate of return and fixed principal value. Foreign investing has special risks, including currency fluctuations, foreign taxes, political and economic factors and possible delays in settlements. Commodities may be subject to greater volatility. Fixed income investing entails credit risks and interest rate risks. When interest rates rise, bond prices generally fall and a fund’s share price can fall As of 3/31/08, the average annual return over 25 years for these investments are: Conservative 10.3%; Moderate 11.3%; Aggressive 12.9%
  • #75 * The F, C, S, and I Funds also have earnings from securities lending income and from temporary investments in G Fund securities. These amounts represent a very small portion of total earnings. ** Each of the L Funds is invested in the individual TSP funds (G, F, C, S, and I). The proportion of your L Fund balance invested in each of the individual TSP funds depends on the L Fund you choose. For 2013, the net expense ratios for L Income and L 2020 were 0.028%. The 2013 net expense ratios for L 2030, L 2040, and L 2050 were 0.029%. *** Income from interest and dividends is included in the share price calculation. It is not paid directly to participants' accounts. **** Net expenses are offset by the forfeitures of Agency Automatic (1%) contributions of FERS employees who leave Federal Service before they are vested, other forfeitures, and loan fees.
  • #86 Here is the link to the evaulation, at the end of the evaulation you will be given directions for receiving your certificate of completion. There is only 1 link