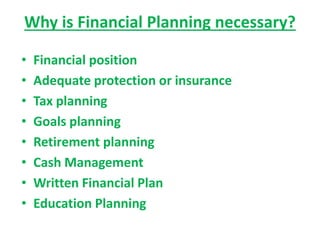
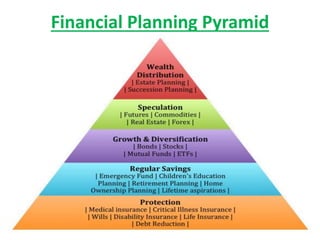
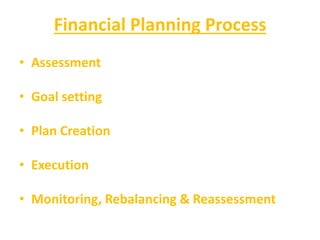
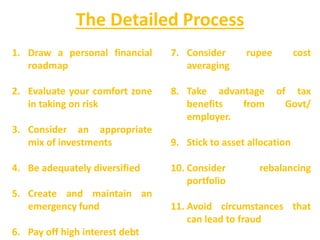
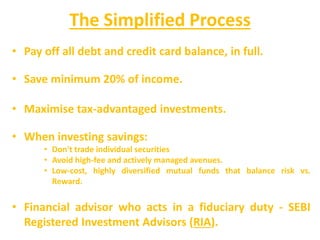
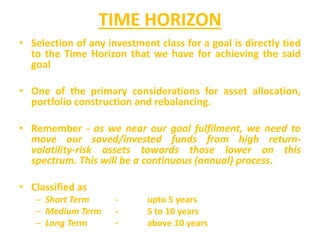
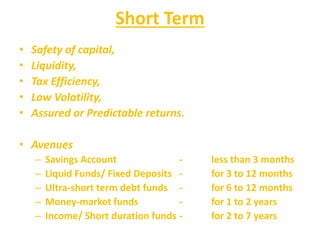
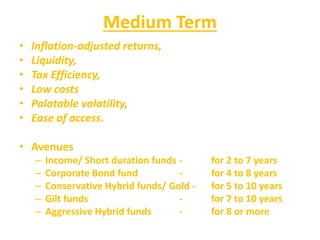
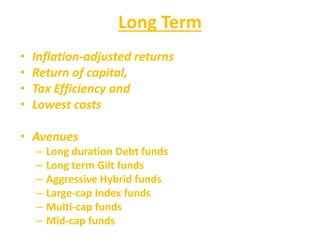
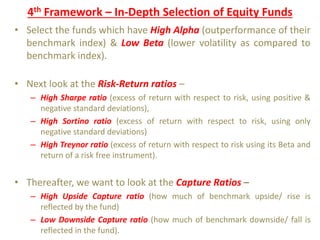
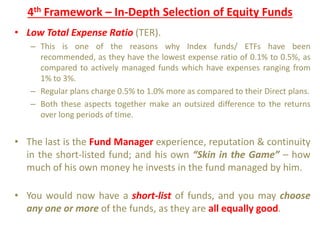
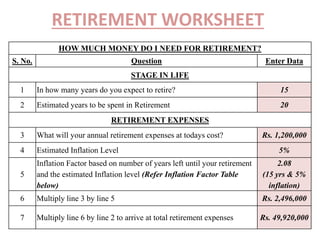
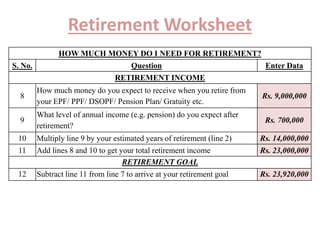
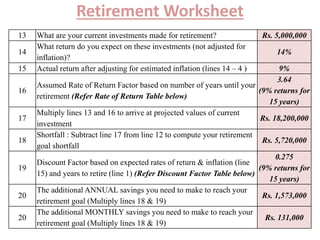
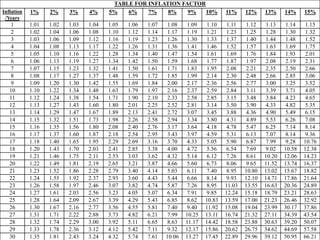
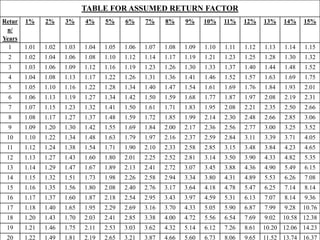
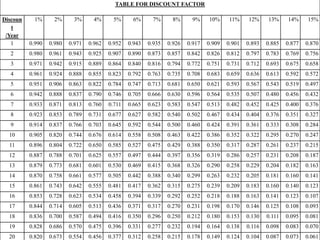
FINANCIAL PLANNING
FOR DO-IT-YOURSELF (DIY) INVESTORS
Raakesh Thayyil
SCHEMA
• Basics of Financial Planning
• Planning Considerations
• Risk Assessment
• Asset Allocation
• Portfolio Management
• Investment Framework
FINANCIAL PLANNING BASICS
• Personal financial planning is the process of
– evaluating one’s budgets, financial commitments
and goals,
– to determine their fund requirements,
– performance of investment avenues and,
– suitability for their own situation.
• Why?
• How?
Why is Financial Planning necessary?
• Financial position
• Adequate protection or insurance
• Tax planning
• Goals planning
• Retirement planning
• Cash Management
• Written Financial Plan
• Education Planning
Financial Planning Pyramid
Financial Planning Process
• Assessment
• Goal setting
• Plan Creation
• Execution
• Monitoring, Rebalancing & Reassessment
The Detailed Process
1. Draw a personal financial
roadmap
2. Evaluate your comfort zone
in taking on risk
3. Consider an appropriate
mix of investments
4. Be adequately diversified
5. Create and maintain an
emergency fund
6. Pay off high interest debt
7. Consider rupee cost
averaging
8. Take advantage of tax
benefits from Govt/
employer.
9. Stick to asset allocation
10. Consider rebalancing
portfolio
11. Avoid circumstances that
can lead to fraud
The Simplified Process
• Pay off all debt and credit card balance, in full.
• Save minimum 20% of income.
• Maximise tax-advantaged investments.
• When investing savings:
• Don't trade individual securities
• Avoid high-fee and actively managed avenues.
• Low-cost, highly diversified mutual funds that balance risk vs.
Reward.
• Financial advisor who acts in a fiduciary duty - SEBI
Registered Investment Advisors (RIA).
PLANNING CONSIDERATIONS
• Individual Needs
• Risk, Reward & Inflation
• Investment Avenues
Why people choose an investment
Perceived safe investment options
Investment Preference
(Guaranteed Safety Of Capital)
How would you invest in equity?
Risk & Reward
• RISK
– Risk is the uncertainty associated with any
investment.
– It is NOT the volatility inherent in an investment.
• REWARD or RETURN
– Money made or lost on an investment.
– In finance, return is a profit or loss on an investment.
Inflation
• Rate at which level of prices for goods and services is
rising; consequently, purchasing power is falling.
• Think of it as NEGATIVE INTEREST.
• Inflation-adjusted return, also called the real rate of
return, reveals the return on an investment after
removing the effects of inflation.
• Central banks attempt to limit inflation — and avoid
deflation; by managing the INTEREST RATES.
Time Value of Money
• Investments generate returns to compensate the
investor for the time value of money.
• Reflected in interest rate that banks offers for
deposit accounts, and in the interest rate
charged for a loan.
• Longer time period, will require higher return.
• The higher the risk, the higher the return reqd.
Inflation & Interest Rates
Investment Avenues
• Equity
• Debt & Bonds
• Mutual Funds (MF)
• Insurance
• Small Savings Schemes
• Gold
• Real Estate
The particular choice & mix of these asset classes
is Asset Allocation
Equity Returns
Debt MF Returns
Fixed Deposits
10 year tenure
9% Interest
30% Tax rate
8% Inflation
FD vs Debt MF
Debt MF are better than FD’s if held for longer than 3 years.
RISK ASSESSMENT
Risk Profile
• A risk profile is the evaluation of an individual’s
willingness to take risks, as well the likely threats to
which they’re exposed.
• Important for determining a proper investment
asset allocation for a portfolio.
• Procurement of appropriate & adequate insurance.
• Assessed using a Risk Profile Survey or
Questionnaire, based on which Asset Allocation is
decided.
Risk Profile & Allocation
Total score Risk Profile Suggested Asset Allocation
0-7 Risk Averse 100% in Government Securities
8 - 15 Low Risk 100% in Bonds
16 - 22
Moderate
Risk
80% in Bonds and maximum 20 in
Equities
23 - 31 Balanced
50% in Bonds in maximum 50% in
Equities
32 - 39
Moderately
Aggressive
20% in Bonds and maximum 80%
in Equities
40 - 47 Aggressive 100% in Equities
ASSET ALLOCATION
Asset Allocation
Asset Allocation
• Implementation of investment strategy, attempts to balance
risk versus reward.
• Adjusting the percentage of each asset as per risk tolerance,
goals, investment time frame.
• Asset classes have different levels of risk and return, so each
will behave differently over time.
• Seeks to Optimise, Not to Maximise the risk/return profile.
• Investors with an aggressive profile, can weight their portfolio
toward more volatile investments. Those with a conservative
profile, can weight their portfolio toward more stable
investments.
Rule of Thumb
• Stocks are recommended for five years or longer; Cash
equivalents for less than a year; with Bonds in between.
• A rule of thumb is, subtracting an investor's age from 100 to
determine how much should be invested in stocks.
– A 40-year old would be 60% invested in stocks.
• Variations of the rule are subtracting age from 110 or 120 for
aggressive investors. Or subtracting from 80 or 90 for
conservative investors.
• As individuals approach retirement age, portfolios should be
more conservative to help protect assets that have already
been accumulated.
Problems
• Investor behaviour, not sticking to the asset
allocation plan – Fear or Greed.
• Security selection within asset classes will not
necessarily produce a risk profile equal to the asset
class.
• The long-term behaviour of asset classes does not
guarantee their shorter-term behaviour.
• Risk-return trade-off.
Risk-Return Trade-Off
Projected 10-year Cumulative return after 2000-2002 (till 2012)
Bear Market after inflation (stock return 8% yearly, bond return
4.5% yearly, inflation 3% yearly)
80% stock / 20% bond 52%
70% stock / 30% bond 47%
60% stock / 40% bond 42%
50% stock / 50% bond 38%
40% stock / 60% bond 33%
30% stock / 70% bond 29%
20% stock / 80% bond 24%
Risk-Return Trade-Off
Cumulative return (not annualised) after inflation during the
2000-to-2002 bear market
80% stock / 20% bond −34.35%
70% stock / 30% bond −25.81%
60% stock / 40% bond −19.99%
50% stock / 50% bond −13.87%
40% stock / 60% bond −7.46%
30% stock / 70% bond −0.74%
20% stock / 80% bond +6.29%
PORTFOLIO MANAGEMENT
• Portfolio & its Construction
• Portfolio Management
• Portfolio Monitoring & Rebalancing
Portfolio Construction
• Portfolio is a combination of securities such as stocks,
bonds, mutual funds, gold and money market
instruments.
• Portfolio Construction - the blending together asset
classes to generate optimum return with minimum
risk.
• Two important considerations
– Asset allocation,
– Investment selection,
– Medium to long term, asset allocation has larger impact
on the variability of a portfolio’s return.
Portfolio Management
• Making decisions
– investment mix and policy,
– matching investments to objectives,
– asset allocation,
– balancing risk against performance,
– in the attempt to maximize return at a given appetite
for risk.
• Key to portfolio management
– asset allocation,
– diversification
– portfolio rebalancing.
Portfolio Monitoring & Rebalancing
• To maximise investment performance & ensure meeting of
goals, Monitoring on an on-going basis is a key ingredient.
• Rebalancing realigns the weightings of different asset classes in
a portfolio. Rebalancing gives investors the opportunity to sell
high and buy low.
• Involves periodically buying or selling assets to maintain original
desired asset allocation.
• It is important for retaining the asset mix that best reflects an
investor’s risk/return profile.
• Monitor & rebalance allocations at least once a year.
INVESTMENT FRAMEWORK
• Insurance
• Mutual Funds
• Time Horizon
• Investment Framework
• Retirement Worksheet
INSURANCE
• Should only be used a means of Protection, and
not for investment.
• Hence, Term Insurance Policy recommended,
preferably purchased online.
• Pure risk cover for a specified period of time,
with no element of savings or investment.
• This means that the sum assured is payable only
if the policyholder dies within the policy term.
He forfeits the amount if he outlives the period
of the policy.
MUTUAL FUNDS
• Regulated by SEBI & AMFI.
• Managed by Asset Managed Companies (AMC).
• Open-ended & Close-ended funds.
• Regular & Direct plans.
• Growth, Dividend & Dividend Reinvestment schemes.
• 36 categories of funds.
TIME HORIZON
• Selection of any investment class for a goal is directly tied
to the Time Horizon that we have for achieving the said
goal
• One of the primary considerations for asset allocation,
portfolio construction and rebalancing.
• Remember - as we near our goal fulfilment, we need to
move our saved/invested funds from high return-
volatility-risk assets towards those lower on this
spectrum. This will be a continuous (annual) process.
• Classified as
– Short Term - upto 5 years
– Medium Term - 5 to 10 years
– Long Term - above 10 years
Short Term
• Safety of capital,
• Liquidity,
• Tax Efficiency,
• Low Volatility,
• Assured or Predictable returns.
• Avenues
– Savings Account - less than 3 months
– Liquid Funds/ Fixed Deposits - for 3 to 12 months
– Ultra-short term debt funds - for 6 to 12 months
– Money-market funds - for 1 to 2 years
– Income/ Short duration funds - for 2 to 7 years
Medium Term
• Inflation-adjusted returns,
• Liquidity,
• Tax Efficiency,
• Low costs
• Palatable volatility,
• Ease of access.
• Avenues
– Income/ Short duration funds - for 2 to 7 years
– Corporate Bond fund - for 4 to 8 years
– Conservative Hybrid funds/ Gold - for 5 to 10 years
– Gilt funds - for 7 to 10 years
– Aggressive Hybrid funds - for 8 or more
Long Term
• Inflation-adjusted returns
• Return of capital,
• Tax Efficiency and
• Lowest costs
• Avenues
– Long duration Debt funds
– Long term Gilt funds
– Aggressive Hybrid funds
– Large-cap Index funds
– Multi-cap funds
– Mid-cap funds
Debt MF - Holding Period vs Risk
INVESTMENT FRAMEWORK
• Risk Assessment
• Asset Allocation
• Investment Selection
– we shall only cover Mutual Funds here
• Portfolio Management
Investment Pyramid
Drilling Down
• 36 Categories of MF – confusing. All one needs are : -
• Five Equity fund types in Order of Preference-
– Large Cap Index funds
– Large Cap funds
– Aggressive Hybrid funds
– Multi Cap funds (if required)
– Mid Cap funds (if really required)
• Five Debt fund types in Order of Preference: -
– Liquid
– Money Market
– Ultra Short Bond (if required)
– Gilt funds (if really required)
– Conservative Hybrid funds (if really required)
1st Framework – Selecting Debt Funds
• For debt funds, when choosing amongst Overnight, Liquid, Ultra Short
Term, Low Duration and Money Market fund categories,
• Select funds
– from larger AMCs,
– having a reasonable corpus,
– which stick to their investment mandate,
– have lower expense ratios and,
– whose credit quality of holdings is higher.
• The returns are likely to be similar & aforementioned aspects will
take care of the risks.
• The other debt fund categories are too diverse, with each category
having its own analysis & selection criteria.
2nd Framework - A Simple & Simplified Method
• The goal of actively managed fund is to beat its
chosen benchmark by a healthy margin.
• Any fund which consistently outperforms the
benchmark by an adequate margin is acceptable.
• I say the following is adequate for most needs: -
– One passive Index fund combined with,
– One Debt fund and,
– One Liquid/ Money-market fund,
– For the sake of diversification, at most one multi-cap
fund,
– Or one hybrid equity fund can be added on, though it
is not a necessity.
3rd Framework - A (Slightly) Evolved Method
• For investors who realise and are able to accept the simplicity, but still want a
little bit more, there is another method, but mainly as a way to feel that they
have done their best in selecting their funds.
• For them, the any of following five options will suffice: -
– Option 1–A: Using a combination of passively managed Nifty 50 & Nifty
Next 50 index funds/ ETFs or only one Nifty 100 index fund.
– Option 1–B: If one wants actively managed funds, one large-cap & one
mid-cap fund.
– Option 2: One equity-oriented balanced fund (aggressive hybrid fund).
Market cap will vary, reasonable spread and downside protection.
– Option 3: Single multi-cap fund, market cap up to the fund manager.
– Option 4: Single large and mid-cap fund with minimum 35% large cap
and 35% mid-cap and rest 30% up to the fund manager‘s discretion.
4th Framework – In-Depth Selection of Equity Funds
• For those who would prefer to carry out a detailed study of the
entire mutual fund universe, whittle down their list to a few
funds and then make their choice, this is a decision-making
sequence
• The full details of all Greeks & Ratios & all other fund
characteristic are easily accessed at morningstar.com &
valueresearchonline.com.
• First select the Fund category.
• Sort the funds as per their Mean Return over the last 5, 7 & 10
years.
4th Framework – In-Depth Selection of Equity Funds
• Select the funds which have High Alpha (outperformance of their
benchmark index) & Low Beta (lower volatility as compared to
benchmark index).
• Next look at the Risk-Return ratios –
– High Sharpe ratio (excess of return with respect to risk, using positive &
negative standard deviations),
– High Sortino ratio (excess of return with respect to risk, using only
negative standard deviations)
– High Treynor ratio (excess of return with respect to risk using its Beta and
return of a risk free instrument).
• Thereafter, we want to look at the Capture Ratios –
– High Upside Capture ratio (how much of benchmark upside/ rise is
reflected by the fund)
– Low Downside Capture ratio (how much of benchmark downside/ fall is
reflected in the fund).
4th Framework – In-Depth Selection of Equity Funds
• Low Total Expense Ratio (TER).
– This is one of the reasons why Index funds/ ETFs have been
recommended, as they have the lowest expense ratio of 0.1% to 0.5%, as
compared to actively managed funds which have expenses ranging from
1% to 3%.
– Regular plans charge 0.5% to 1.0% more as compared to their Direct plans.
– Both these aspects together make an outsized difference to the returns
over long periods of time.
• The last is the Fund Manager experience, reputation & continuity
in the short-listed fund; and his own “Skin in the Game” – how
much of his own money he invests in the fund managed by him.
• You would now have a short-list of funds, and you may choose
any one or more of the funds, as they are all equally good.
RETIREMENT WORKSHEET
HOW MUCH MONEY DO I NEED FOR RETIREMENT?
S. No. Question Enter Data
STAGE IN LIFE
1 In how many years do you expect to retire? 15
2 Estimated years to be spent in Retirement 20
RETIREMENT EXPENSES
3 What will your annual retirement expenses at todays cost? Rs. 1,200,000
4 Estimated Inflation Level 5%
5
Inflation Factor based on number of years left until your retirement
and the estimated Inflation level (Refer Inflation Factor Table
below)
2.08
(15 yrs & 5%
inflation)
6 Multiply line 3 by line 5 Rs. 2,496,000
7 Multiply line 6 by line 2 to arrive at total retirement expenses Rs. 49,920,000
Retirement Worksheet
HOW MUCH MONEY DO I NEED FOR RETIREMENT?
S. No. Question Enter Data
RETIREMENT INCOME
8
How much money do you expect to receive when you retire from
your EPF/ PPF/ DSOPF/ Pension Plan/ Gratuity etc.
Rs. 9,000,000
9
What level of annual income (e.g. pension) do you expect after
retirement?
Rs. 700,000
10 Multiply line 9 by your estimated years of retirement (line 2) Rs. 14,000,000
11 Add lines 8 and 10 to get your total retirement income Rs. 23,000,000
RETIREMENT GOAL
12 Subtract line 11 from line 7 to arrive at your retirement goal Rs. 23,920,000
Retirement Worksheet
13 What are your current investments made for retirement? Rs. 5,000,000
14
What return do you expect on these investments (not adjusted for
inflation)?
14%
15 Actual return after adjusting for estimated inflation (lines 14 – 4 ) 9%
16
Assumed Rate of Return Factor based on number of years until your
retirement (Refer Rate of Return Table below)
3.64
(9% returns for
15 years)
17
Multiply lines 13 and 16 to arrive at projected values of current
investment
Rs. 18,200,000
18
Shortfall : Subtract line 17 from line 12 to compute your retirement
goal shortfall
Rs. 5,720,000
19
Discount Factor based on expected rates of return & inflation (line
15) and years to retire (line 1) (Refer Discount Factor Table below)
0.275
(9% returns for
15 years)
20
The additional ANNUAL savings you need to make to reach your
retirement goal (Multiply lines 18 & 19)
Rs. 1,573,000
20
The additional MONTHLY savings you need to make to reach your
retirement goal (Multiply lines 18 & 19)
Rs. 131,000
QUERIES?
TABLE FOR INFLATION FACTOR
Inflation
/Years
1% 2% 3% 4% 5% 6% 7% 8% 9% 10% 11% 12% 13% 14% 15%
1 1.01 1.02 1.03 1.04 1.05 1.06 1.07 1.08 1.09 1.10 1.11 1.12 1.13 1.14 1.15
2 1.02 1.04 1.06 1.08 1.10 1.12 1.14 1.17 1.19 1.21 1.23 1.25 1.28 1.30 1.32
3 1.03 1.06 1.09 1.12 1.16 1.19 1.23 1.26 1.30 1.33 1.37 1.40 1.44 1.48 1.52
4 1.04 1.08 1.13 1.17 1.22 1.26 1.31 1.36 1.41 1.46 1.52 1.57 1.63 1.69 1.75
5 1.05 1.10 1.16 1.22 1.28 1.34 1.40 1.47 1.54 1.61 1.69 1.76 1.84 1.93 2.01
6 1.06 1.13 1.19 1.27 1.34 1.42 1.50 1.59 1.68 1.77 1.87 1.97 2.08 2.19 2.31
7 1.07 1.15 1.23 1.32 1.41 1.50 1.61 1.71 1.83 1.95 2.08 2.21 2.35 2.50 2.66
8 1.08 1.17 1.27 1.37 1.48 1.59 1.72 1.85 1.99 2.14 2.30 2.48 2.66 2.85 3.06
9 1.09 1.20 1.30 1.42 1.55 1.69 1.84 2.00 2.17 2.36 2.56 2.77 3.00 3.25 3.52
10 1.10 1.22 1.34 1.48 1.63 1.79 1.97 2.16 2.37 2.59 2.84 3.11 3.39 3.71 4.05
11 1.12 1.24 1.38 1.54 1.71 1.90 2.10 2.33 2.58 2.85 3.15 3.48 3.84 4.23 4.65
12 1.13 1.27 1.43 1.60 1.80 2.01 2.25 2.52 2.81 3.14 3.50 3.90 4.33 4.82 5.35
13 1.14 1.29 1.47 1.67 1.89 2.13 2.41 2.72 3.07 3.45 3.88 4.36 4.90 5.49 6.15
14 1.15 1.32 1.51 1.73 1.98 2.26 2.58 2.94 3.34 3.80 4.31 4.89 5.53 6.26 7.08
15 1.16 1.35 1.56 1.80 2.08 2.40 2.76 3.17 3.64 4.18 4.78 5.47 6.25 7.14 8.14
16 1.17 1.37 1.60 1.87 2.18 2.54 2.95 3.43 3.97 4.59 5.31 6.13 7.07 8.14 9.36
17 1.18 1.40 1.65 1.95 2.29 2.69 3.16 3.70 4.33 5.05 5.90 6.87 7.99 9.28 10.76
18 1.20 1.43 1.70 2.03 2.41 2.85 3.38 4.00 4.72 5.56 6.54 7.69 9.02 10.58 12.38
19 1.21 1.46 1.75 2.11 2.53 3.03 3.62 4.32 5.14 6.12 7.26 8.61 10.20 12.06 14.23
20 1.22 1.49 1.81 2.19 2.65 3.21 3.87 4.66 5.60 6.73 8.06 9.65 11.52 13.74 16.37
21 1.23 1.52 1.86 2.28 2.79 3.40 4.14 5.03 6.11 7.40 8.95 10.80 13.02 15.67 18.82
22 1.24 1.55 1.92 2.37 2.93 3.60 4.43 5.44 6.66 8.14 9.93 12.10 14.71 17.86 21.64
23 1.26 1.58 1.97 2.46 3.07 3.82 4.74 5.87 7.26 8.95 11.03 13.55 16.63 20.36 24.89
24 1.27 1.61 2.03 2.56 3.23 4.05 5.07 6.34 7.91 9.85 12.24 15.18 18.79 23.21 28.63
25 1.28 1.64 2.09 2.67 3.39 4.29 5.43 6.85 8.62 10.83 13.59 17.00 21.23 26.46 32.92
26 1.30 1.67 2.16 2.77 3.56 4.55 5.81 7.40 9.40 11.92 15.08 19.04 23.99 30.17 37.86
27 1.31 1.71 2.22 2.88 3.73 4.82 6.21 7.99 10.25 13.11 16.74 21.32 27.11 34.39 43.54
28 1.32 1.74 2.29 3.00 3.92 5.11 6.65 8.63 11.17 14.42 18.58 23.88 30.63 39.20 50.07
29 1.33 1.78 2.36 3.12 4.12 5.42 7.11 9.32 12.17 15.86 20.62 26.75 34.62 44.69 57.58
30 1.35 1.81 2.43 3.24 4.32 5.74 7.61 10.06 13.27 17.45 22.89 29.96 39.12 50.95 66.21
TABLE FOR ASSUMED RETURN FACTOR
Retur
n/
Years
1% 2% 3% 4% 5% 6% 7% 8% 9% 10% 11% 12% 13% 14% 15%
1 1.01 1.02 1.03 1.04 1.05 1.06 1.07 1.08 1.09 1.10 1.11 1.12 1.13 1.14 1.15
2 1.02 1.04 1.06 1.08 1.10 1.12 1.14 1.17 1.19 1.21 1.23 1.25 1.28 1.30 1.32
3 1.03 1.06 1.09 1.12 1.16 1.19 1.23 1.26 1.30 1.33 1.37 1.40 1.44 1.48 1.52
4 1.04 1.08 1.13 1.17 1.22 1.26 1.31 1.36 1.41 1.46 1.52 1.57 1.63 1.69 1.75
5 1.05 1.10 1.16 1.22 1.28 1.34 1.40 1.47 1.54 1.61 1.69 1.76 1.84 1.93 2.01
6 1.06 1.13 1.19 1.27 1.34 1.42 1.50 1.59 1.68 1.77 1.87 1.97 2.08 2.19 2.31
7 1.07 1.15 1.23 1.32 1.41 1.50 1.61 1.71 1.83 1.95 2.08 2.21 2.35 2.50 2.66
8 1.08 1.17 1.27 1.37 1.48 1.59 1.72 1.85 1.99 2.14 2.30 2.48 2.66 2.85 3.06
9 1.09 1.20 1.30 1.42 1.55 1.69 1.84 2.00 2.17 2.36 2.56 2.77 3.00 3.25 3.52
10 1.10 1.22 1.34 1.48 1.63 1.79 1.97 2.16 2.37 2.59 2.84 3.11 3.39 3.71 4.05
11 1.12 1.24 1.38 1.54 1.71 1.90 2.10 2.33 2.58 2.85 3.15 3.48 3.84 4.23 4.65
12 1.13 1.27 1.43 1.60 1.80 2.01 2.25 2.52 2.81 3.14 3.50 3.90 4.33 4.82 5.35
13 1.14 1.29 1.47 1.67 1.89 2.13 2.41 2.72 3.07 3.45 3.88 4.36 4.90 5.49 6.15
14 1.15 1.32 1.51 1.73 1.98 2.26 2.58 2.94 3.34 3.80 4.31 4.89 5.53 6.26 7.08
15 1.16 1.35 1.56 1.80 2.08 2.40 2.76 3.17 3.64 4.18 4.78 5.47 6.25 7.14 8.14
16 1.17 1.37 1.60 1.87 2.18 2.54 2.95 3.43 3.97 4.59 5.31 6.13 7.07 8.14 9.36
17 1.18 1.40 1.65 1.95 2.29 2.69 3.16 3.70 4.33 5.05 5.90 6.87 7.99 9.28 10.76
18 1.20 1.43 1.70 2.03 2.41 2.85 3.38 4.00 4.72 5.56 6.54 7.69 9.02 10.58 12.38
19 1.21 1.46 1.75 2.11 2.53 3.03 3.62 4.32 5.14 6.12 7.26 8.61 10.20 12.06 14.23
20 1.22 1.49 1.81 2.19 2.65 3.21 3.87 4.66 5.60 6.73 8.06 9.65 11.52 13.74 16.37
TABLE FOR DISCOUNT FACTOR
Discoun
t
/Year
1% 2% 3% 4% 5% 6% 7% 8% 9% 10% 11% 12% 13% 14% 15%
1 0.990 0.980 0.971 0.962 0.952 0.943 0.935 0.926 0.917 0.909 0.901 0.893 0.885 0.877 0.870
2 0.980 0.961 0.943 0.925 0.907 0.890 0.873 0.857 0.842 0.826 0.812 0.797 0.783 0.769 0.756
3 0.971 0.942 0.915 0.889 0.864 0.840 0.816 0.794 0.772 0.751 0.731 0.712 0.693 0.675 0.658
4 0.961 0.924 0.888 0.855 0.823 0.792 0.763 0.735 0.708 0.683 0.659 0.636 0.613 0.592 0.572
5 0.951 0.906 0.863 0.822 0.784 0.747 0.713 0.681 0.650 0.621 0.593 0.567 0.543 0.519 0.497
6 0.942 0.888 0.837 0.790 0.746 0.705 0.666 0.630 0.596 0.564 0.535 0.507 0.480 0.456 0.432
7 0.933 0.871 0.813 0.760 0.711 0.665 0.623 0.583 0.547 0.513 0.482 0.452 0.425 0.400 0.376
8 0.923 0.853 0.789 0.731 0.677 0.627 0.582 0.540 0.502 0.467 0.434 0.404 0.376 0.351 0.327
9 0.914 0.837 0.766 0.703 0.645 0.592 0.544 0.500 0.460 0.424 0.391 0.361 0.333 0.308 0.284
10 0.905 0.820 0.744 0.676 0.614 0.558 0.508 0.463 0.422 0.386 0.352 0.322 0.295 0.270 0.247
11 0.896 0.804 0.722 0.650 0.585 0.527 0.475 0.429 0.388 0.350 0.317 0.287 0.261 0.237 0.215
12 0.887 0.788 0.701 0.625 0.557 0.497 0.444 0.397 0.356 0.319 0.286 0.257 0.231 0.208 0.187
13 0.879 0.773 0.681 0.601 0.530 0.469 0.415 0.368 0.326 0.290 0.258 0.229 0.204 0.182 0.163
14 0.870 0.758 0.661 0.577 0.505 0.442 0.388 0.340 0.299 0.263 0.232 0.205 0.181 0.160 0.141
15 0.861 0.743 0.642 0.555 0.481 0.417 0.362 0.315 0.275 0.239 0.209 0.183 0.160 0.140 0.123
16 0.853 0.728 0.623 0.534 0.458 0.394 0.339 0.292 0.252 0.218 0.188 0.163 0.141 0.123 0.107
17 0.844 0.714 0.605 0.513 0.436 0.371 0.317 0.270 0.231 0.198 0.170 0.146 0.125 0.108 0.093
18 0.836 0.700 0.587 0.494 0.416 0.350 0.296 0.250 0.212 0.180 0.153 0.130 0.111 0.095 0.081
19 0.828 0.686 0.570 0.475 0.396 0.331 0.277 0.232 0.194 0.164 0.138 0.116 0.098 0.083 0.070
20 0.820 0.673 0.554 0.456 0.377 0.312 0.258 0.215 0.178 0.149 0.124 0.104 0.087 0.073 0.061

Financial Planning Guide

  • 1.
    FINANCIAL PLANNING FOR DO-IT-YOURSELF(DIY) INVESTORS Raakesh Thayyil
  • 2.
    SCHEMA • Basics ofFinancial Planning • Planning Considerations • Risk Assessment • Asset Allocation • Portfolio Management • Investment Framework
  • 3.
  • 4.
    FINANCIAL PLANNING BASICS •Personal financial planning is the process of – evaluating one’s budgets, financial commitments and goals, – to determine their fund requirements, – performance of investment avenues and, – suitability for their own situation. • Why? • How?
  • 5.
    Why is FinancialPlanning necessary? • Financial position • Adequate protection or insurance • Tax planning • Goals planning • Retirement planning • Cash Management • Written Financial Plan • Education Planning
  • 6.
  • 7.
    Financial Planning Process •Assessment • Goal setting • Plan Creation • Execution • Monitoring, Rebalancing & Reassessment
  • 8.
    The Detailed Process 1.Draw a personal financial roadmap 2. Evaluate your comfort zone in taking on risk 3. Consider an appropriate mix of investments 4. Be adequately diversified 5. Create and maintain an emergency fund 6. Pay off high interest debt 7. Consider rupee cost averaging 8. Take advantage of tax benefits from Govt/ employer. 9. Stick to asset allocation 10. Consider rebalancing portfolio 11. Avoid circumstances that can lead to fraud
  • 9.
    The Simplified Process •Pay off all debt and credit card balance, in full. • Save minimum 20% of income. • Maximise tax-advantaged investments. • When investing savings: • Don't trade individual securities • Avoid high-fee and actively managed avenues. • Low-cost, highly diversified mutual funds that balance risk vs. Reward. • Financial advisor who acts in a fiduciary duty - SEBI Registered Investment Advisors (RIA).
  • 10.
  • 11.
    PLANNING CONSIDERATIONS • IndividualNeeds • Risk, Reward & Inflation • Investment Avenues
  • 12.
    Why people choosean investment
  • 13.
  • 14.
  • 15.
  • 16.
    How would youinvest in equity?
  • 17.
    Risk & Reward •RISK – Risk is the uncertainty associated with any investment. – It is NOT the volatility inherent in an investment. • REWARD or RETURN – Money made or lost on an investment. – In finance, return is a profit or loss on an investment.
  • 19.
    Inflation • Rate atwhich level of prices for goods and services is rising; consequently, purchasing power is falling. • Think of it as NEGATIVE INTEREST. • Inflation-adjusted return, also called the real rate of return, reveals the return on an investment after removing the effects of inflation. • Central banks attempt to limit inflation — and avoid deflation; by managing the INTEREST RATES.
  • 20.
    Time Value ofMoney • Investments generate returns to compensate the investor for the time value of money. • Reflected in interest rate that banks offers for deposit accounts, and in the interest rate charged for a loan. • Longer time period, will require higher return. • The higher the risk, the higher the return reqd.
  • 21.
  • 22.
    Investment Avenues • Equity •Debt & Bonds • Mutual Funds (MF) • Insurance • Small Savings Schemes • Gold • Real Estate The particular choice & mix of these asset classes is Asset Allocation
  • 23.
  • 24.
  • 25.
    Fixed Deposits 10 yeartenure 9% Interest 30% Tax rate 8% Inflation
  • 26.
    FD vs DebtMF Debt MF are better than FD’s if held for longer than 3 years.
  • 27.
  • 28.
    Risk Profile • Arisk profile is the evaluation of an individual’s willingness to take risks, as well the likely threats to which they’re exposed. • Important for determining a proper investment asset allocation for a portfolio. • Procurement of appropriate & adequate insurance. • Assessed using a Risk Profile Survey or Questionnaire, based on which Asset Allocation is decided.
  • 29.
    Risk Profile &Allocation Total score Risk Profile Suggested Asset Allocation 0-7 Risk Averse 100% in Government Securities 8 - 15 Low Risk 100% in Bonds 16 - 22 Moderate Risk 80% in Bonds and maximum 20 in Equities 23 - 31 Balanced 50% in Bonds in maximum 50% in Equities 32 - 39 Moderately Aggressive 20% in Bonds and maximum 80% in Equities 40 - 47 Aggressive 100% in Equities
  • 30.
  • 31.
  • 32.
    Asset Allocation • Implementationof investment strategy, attempts to balance risk versus reward. • Adjusting the percentage of each asset as per risk tolerance, goals, investment time frame. • Asset classes have different levels of risk and return, so each will behave differently over time. • Seeks to Optimise, Not to Maximise the risk/return profile. • Investors with an aggressive profile, can weight their portfolio toward more volatile investments. Those with a conservative profile, can weight their portfolio toward more stable investments.
  • 33.
    Rule of Thumb •Stocks are recommended for five years or longer; Cash equivalents for less than a year; with Bonds in between. • A rule of thumb is, subtracting an investor's age from 100 to determine how much should be invested in stocks. – A 40-year old would be 60% invested in stocks. • Variations of the rule are subtracting age from 110 or 120 for aggressive investors. Or subtracting from 80 or 90 for conservative investors. • As individuals approach retirement age, portfolios should be more conservative to help protect assets that have already been accumulated.
  • 34.
    Problems • Investor behaviour,not sticking to the asset allocation plan – Fear or Greed. • Security selection within asset classes will not necessarily produce a risk profile equal to the asset class. • The long-term behaviour of asset classes does not guarantee their shorter-term behaviour. • Risk-return trade-off.
  • 35.
    Risk-Return Trade-Off Projected 10-yearCumulative return after 2000-2002 (till 2012) Bear Market after inflation (stock return 8% yearly, bond return 4.5% yearly, inflation 3% yearly) 80% stock / 20% bond 52% 70% stock / 30% bond 47% 60% stock / 40% bond 42% 50% stock / 50% bond 38% 40% stock / 60% bond 33% 30% stock / 70% bond 29% 20% stock / 80% bond 24%
  • 36.
    Risk-Return Trade-Off Cumulative return(not annualised) after inflation during the 2000-to-2002 bear market 80% stock / 20% bond −34.35% 70% stock / 30% bond −25.81% 60% stock / 40% bond −19.99% 50% stock / 50% bond −13.87% 40% stock / 60% bond −7.46% 30% stock / 70% bond −0.74% 20% stock / 80% bond +6.29%
  • 37.
  • 38.
    PORTFOLIO MANAGEMENT • Portfolio& its Construction • Portfolio Management • Portfolio Monitoring & Rebalancing
  • 39.
    Portfolio Construction • Portfoliois a combination of securities such as stocks, bonds, mutual funds, gold and money market instruments. • Portfolio Construction - the blending together asset classes to generate optimum return with minimum risk. • Two important considerations – Asset allocation, – Investment selection, – Medium to long term, asset allocation has larger impact on the variability of a portfolio’s return.
  • 40.
    Portfolio Management • Makingdecisions – investment mix and policy, – matching investments to objectives, – asset allocation, – balancing risk against performance, – in the attempt to maximize return at a given appetite for risk. • Key to portfolio management – asset allocation, – diversification – portfolio rebalancing.
  • 41.
    Portfolio Monitoring &Rebalancing • To maximise investment performance & ensure meeting of goals, Monitoring on an on-going basis is a key ingredient. • Rebalancing realigns the weightings of different asset classes in a portfolio. Rebalancing gives investors the opportunity to sell high and buy low. • Involves periodically buying or selling assets to maintain original desired asset allocation. • It is important for retaining the asset mix that best reflects an investor’s risk/return profile. • Monitor & rebalance allocations at least once a year.
  • 42.
  • 43.
    INVESTMENT FRAMEWORK • Insurance •Mutual Funds • Time Horizon • Investment Framework • Retirement Worksheet
  • 44.
    INSURANCE • Should onlybe used a means of Protection, and not for investment. • Hence, Term Insurance Policy recommended, preferably purchased online. • Pure risk cover for a specified period of time, with no element of savings or investment. • This means that the sum assured is payable only if the policyholder dies within the policy term. He forfeits the amount if he outlives the period of the policy.
  • 45.
    MUTUAL FUNDS • Regulatedby SEBI & AMFI. • Managed by Asset Managed Companies (AMC). • Open-ended & Close-ended funds. • Regular & Direct plans. • Growth, Dividend & Dividend Reinvestment schemes. • 36 categories of funds.
  • 50.
    TIME HORIZON • Selectionof any investment class for a goal is directly tied to the Time Horizon that we have for achieving the said goal • One of the primary considerations for asset allocation, portfolio construction and rebalancing. • Remember - as we near our goal fulfilment, we need to move our saved/invested funds from high return- volatility-risk assets towards those lower on this spectrum. This will be a continuous (annual) process. • Classified as – Short Term - upto 5 years – Medium Term - 5 to 10 years – Long Term - above 10 years
  • 51.
    Short Term • Safetyof capital, • Liquidity, • Tax Efficiency, • Low Volatility, • Assured or Predictable returns. • Avenues – Savings Account - less than 3 months – Liquid Funds/ Fixed Deposits - for 3 to 12 months – Ultra-short term debt funds - for 6 to 12 months – Money-market funds - for 1 to 2 years – Income/ Short duration funds - for 2 to 7 years
  • 52.
    Medium Term • Inflation-adjustedreturns, • Liquidity, • Tax Efficiency, • Low costs • Palatable volatility, • Ease of access. • Avenues – Income/ Short duration funds - for 2 to 7 years – Corporate Bond fund - for 4 to 8 years – Conservative Hybrid funds/ Gold - for 5 to 10 years – Gilt funds - for 7 to 10 years – Aggressive Hybrid funds - for 8 or more
  • 53.
    Long Term • Inflation-adjustedreturns • Return of capital, • Tax Efficiency and • Lowest costs • Avenues – Long duration Debt funds – Long term Gilt funds – Aggressive Hybrid funds – Large-cap Index funds – Multi-cap funds – Mid-cap funds
  • 54.
    Debt MF -Holding Period vs Risk
  • 55.
    INVESTMENT FRAMEWORK • RiskAssessment • Asset Allocation • Investment Selection – we shall only cover Mutual Funds here • Portfolio Management
  • 56.
  • 57.
    Drilling Down • 36Categories of MF – confusing. All one needs are : - • Five Equity fund types in Order of Preference- – Large Cap Index funds – Large Cap funds – Aggressive Hybrid funds – Multi Cap funds (if required) – Mid Cap funds (if really required) • Five Debt fund types in Order of Preference: - – Liquid – Money Market – Ultra Short Bond (if required) – Gilt funds (if really required) – Conservative Hybrid funds (if really required)
  • 58.
    1st Framework –Selecting Debt Funds • For debt funds, when choosing amongst Overnight, Liquid, Ultra Short Term, Low Duration and Money Market fund categories, • Select funds – from larger AMCs, – having a reasonable corpus, – which stick to their investment mandate, – have lower expense ratios and, – whose credit quality of holdings is higher. • The returns are likely to be similar & aforementioned aspects will take care of the risks. • The other debt fund categories are too diverse, with each category having its own analysis & selection criteria.
  • 59.
    2nd Framework -A Simple & Simplified Method • The goal of actively managed fund is to beat its chosen benchmark by a healthy margin. • Any fund which consistently outperforms the benchmark by an adequate margin is acceptable. • I say the following is adequate for most needs: - – One passive Index fund combined with, – One Debt fund and, – One Liquid/ Money-market fund, – For the sake of diversification, at most one multi-cap fund, – Or one hybrid equity fund can be added on, though it is not a necessity.
  • 60.
    3rd Framework -A (Slightly) Evolved Method • For investors who realise and are able to accept the simplicity, but still want a little bit more, there is another method, but mainly as a way to feel that they have done their best in selecting their funds. • For them, the any of following five options will suffice: - – Option 1–A: Using a combination of passively managed Nifty 50 & Nifty Next 50 index funds/ ETFs or only one Nifty 100 index fund. – Option 1–B: If one wants actively managed funds, one large-cap & one mid-cap fund. – Option 2: One equity-oriented balanced fund (aggressive hybrid fund). Market cap will vary, reasonable spread and downside protection. – Option 3: Single multi-cap fund, market cap up to the fund manager. – Option 4: Single large and mid-cap fund with minimum 35% large cap and 35% mid-cap and rest 30% up to the fund manager‘s discretion.
  • 61.
    4th Framework –In-Depth Selection of Equity Funds • For those who would prefer to carry out a detailed study of the entire mutual fund universe, whittle down their list to a few funds and then make their choice, this is a decision-making sequence • The full details of all Greeks & Ratios & all other fund characteristic are easily accessed at morningstar.com & valueresearchonline.com. • First select the Fund category. • Sort the funds as per their Mean Return over the last 5, 7 & 10 years.
  • 62.
    4th Framework –In-Depth Selection of Equity Funds • Select the funds which have High Alpha (outperformance of their benchmark index) & Low Beta (lower volatility as compared to benchmark index). • Next look at the Risk-Return ratios – – High Sharpe ratio (excess of return with respect to risk, using positive & negative standard deviations), – High Sortino ratio (excess of return with respect to risk, using only negative standard deviations) – High Treynor ratio (excess of return with respect to risk using its Beta and return of a risk free instrument). • Thereafter, we want to look at the Capture Ratios – – High Upside Capture ratio (how much of benchmark upside/ rise is reflected by the fund) – Low Downside Capture ratio (how much of benchmark downside/ fall is reflected in the fund).
  • 63.
    4th Framework –In-Depth Selection of Equity Funds • Low Total Expense Ratio (TER). – This is one of the reasons why Index funds/ ETFs have been recommended, as they have the lowest expense ratio of 0.1% to 0.5%, as compared to actively managed funds which have expenses ranging from 1% to 3%. – Regular plans charge 0.5% to 1.0% more as compared to their Direct plans. – Both these aspects together make an outsized difference to the returns over long periods of time. • The last is the Fund Manager experience, reputation & continuity in the short-listed fund; and his own “Skin in the Game” – how much of his own money he invests in the fund managed by him. • You would now have a short-list of funds, and you may choose any one or more of the funds, as they are all equally good.
  • 64.
    RETIREMENT WORKSHEET HOW MUCHMONEY DO I NEED FOR RETIREMENT? S. No. Question Enter Data STAGE IN LIFE 1 In how many years do you expect to retire? 15 2 Estimated years to be spent in Retirement 20 RETIREMENT EXPENSES 3 What will your annual retirement expenses at todays cost? Rs. 1,200,000 4 Estimated Inflation Level 5% 5 Inflation Factor based on number of years left until your retirement and the estimated Inflation level (Refer Inflation Factor Table below) 2.08 (15 yrs & 5% inflation) 6 Multiply line 3 by line 5 Rs. 2,496,000 7 Multiply line 6 by line 2 to arrive at total retirement expenses Rs. 49,920,000
  • 65.
    Retirement Worksheet HOW MUCHMONEY DO I NEED FOR RETIREMENT? S. No. Question Enter Data RETIREMENT INCOME 8 How much money do you expect to receive when you retire from your EPF/ PPF/ DSOPF/ Pension Plan/ Gratuity etc. Rs. 9,000,000 9 What level of annual income (e.g. pension) do you expect after retirement? Rs. 700,000 10 Multiply line 9 by your estimated years of retirement (line 2) Rs. 14,000,000 11 Add lines 8 and 10 to get your total retirement income Rs. 23,000,000 RETIREMENT GOAL 12 Subtract line 11 from line 7 to arrive at your retirement goal Rs. 23,920,000
  • 66.
    Retirement Worksheet 13 Whatare your current investments made for retirement? Rs. 5,000,000 14 What return do you expect on these investments (not adjusted for inflation)? 14% 15 Actual return after adjusting for estimated inflation (lines 14 – 4 ) 9% 16 Assumed Rate of Return Factor based on number of years until your retirement (Refer Rate of Return Table below) 3.64 (9% returns for 15 years) 17 Multiply lines 13 and 16 to arrive at projected values of current investment Rs. 18,200,000 18 Shortfall : Subtract line 17 from line 12 to compute your retirement goal shortfall Rs. 5,720,000 19 Discount Factor based on expected rates of return & inflation (line 15) and years to retire (line 1) (Refer Discount Factor Table below) 0.275 (9% returns for 15 years) 20 The additional ANNUAL savings you need to make to reach your retirement goal (Multiply lines 18 & 19) Rs. 1,573,000 20 The additional MONTHLY savings you need to make to reach your retirement goal (Multiply lines 18 & 19) Rs. 131,000
  • 67.
  • 68.
    TABLE FOR INFLATIONFACTOR Inflation /Years 1% 2% 3% 4% 5% 6% 7% 8% 9% 10% 11% 12% 13% 14% 15% 1 1.01 1.02 1.03 1.04 1.05 1.06 1.07 1.08 1.09 1.10 1.11 1.12 1.13 1.14 1.15 2 1.02 1.04 1.06 1.08 1.10 1.12 1.14 1.17 1.19 1.21 1.23 1.25 1.28 1.30 1.32 3 1.03 1.06 1.09 1.12 1.16 1.19 1.23 1.26 1.30 1.33 1.37 1.40 1.44 1.48 1.52 4 1.04 1.08 1.13 1.17 1.22 1.26 1.31 1.36 1.41 1.46 1.52 1.57 1.63 1.69 1.75 5 1.05 1.10 1.16 1.22 1.28 1.34 1.40 1.47 1.54 1.61 1.69 1.76 1.84 1.93 2.01 6 1.06 1.13 1.19 1.27 1.34 1.42 1.50 1.59 1.68 1.77 1.87 1.97 2.08 2.19 2.31 7 1.07 1.15 1.23 1.32 1.41 1.50 1.61 1.71 1.83 1.95 2.08 2.21 2.35 2.50 2.66 8 1.08 1.17 1.27 1.37 1.48 1.59 1.72 1.85 1.99 2.14 2.30 2.48 2.66 2.85 3.06 9 1.09 1.20 1.30 1.42 1.55 1.69 1.84 2.00 2.17 2.36 2.56 2.77 3.00 3.25 3.52 10 1.10 1.22 1.34 1.48 1.63 1.79 1.97 2.16 2.37 2.59 2.84 3.11 3.39 3.71 4.05 11 1.12 1.24 1.38 1.54 1.71 1.90 2.10 2.33 2.58 2.85 3.15 3.48 3.84 4.23 4.65 12 1.13 1.27 1.43 1.60 1.80 2.01 2.25 2.52 2.81 3.14 3.50 3.90 4.33 4.82 5.35 13 1.14 1.29 1.47 1.67 1.89 2.13 2.41 2.72 3.07 3.45 3.88 4.36 4.90 5.49 6.15 14 1.15 1.32 1.51 1.73 1.98 2.26 2.58 2.94 3.34 3.80 4.31 4.89 5.53 6.26 7.08 15 1.16 1.35 1.56 1.80 2.08 2.40 2.76 3.17 3.64 4.18 4.78 5.47 6.25 7.14 8.14 16 1.17 1.37 1.60 1.87 2.18 2.54 2.95 3.43 3.97 4.59 5.31 6.13 7.07 8.14 9.36 17 1.18 1.40 1.65 1.95 2.29 2.69 3.16 3.70 4.33 5.05 5.90 6.87 7.99 9.28 10.76 18 1.20 1.43 1.70 2.03 2.41 2.85 3.38 4.00 4.72 5.56 6.54 7.69 9.02 10.58 12.38 19 1.21 1.46 1.75 2.11 2.53 3.03 3.62 4.32 5.14 6.12 7.26 8.61 10.20 12.06 14.23 20 1.22 1.49 1.81 2.19 2.65 3.21 3.87 4.66 5.60 6.73 8.06 9.65 11.52 13.74 16.37 21 1.23 1.52 1.86 2.28 2.79 3.40 4.14 5.03 6.11 7.40 8.95 10.80 13.02 15.67 18.82 22 1.24 1.55 1.92 2.37 2.93 3.60 4.43 5.44 6.66 8.14 9.93 12.10 14.71 17.86 21.64 23 1.26 1.58 1.97 2.46 3.07 3.82 4.74 5.87 7.26 8.95 11.03 13.55 16.63 20.36 24.89 24 1.27 1.61 2.03 2.56 3.23 4.05 5.07 6.34 7.91 9.85 12.24 15.18 18.79 23.21 28.63 25 1.28 1.64 2.09 2.67 3.39 4.29 5.43 6.85 8.62 10.83 13.59 17.00 21.23 26.46 32.92 26 1.30 1.67 2.16 2.77 3.56 4.55 5.81 7.40 9.40 11.92 15.08 19.04 23.99 30.17 37.86 27 1.31 1.71 2.22 2.88 3.73 4.82 6.21 7.99 10.25 13.11 16.74 21.32 27.11 34.39 43.54 28 1.32 1.74 2.29 3.00 3.92 5.11 6.65 8.63 11.17 14.42 18.58 23.88 30.63 39.20 50.07 29 1.33 1.78 2.36 3.12 4.12 5.42 7.11 9.32 12.17 15.86 20.62 26.75 34.62 44.69 57.58 30 1.35 1.81 2.43 3.24 4.32 5.74 7.61 10.06 13.27 17.45 22.89 29.96 39.12 50.95 66.21
  • 69.
    TABLE FOR ASSUMEDRETURN FACTOR Retur n/ Years 1% 2% 3% 4% 5% 6% 7% 8% 9% 10% 11% 12% 13% 14% 15% 1 1.01 1.02 1.03 1.04 1.05 1.06 1.07 1.08 1.09 1.10 1.11 1.12 1.13 1.14 1.15 2 1.02 1.04 1.06 1.08 1.10 1.12 1.14 1.17 1.19 1.21 1.23 1.25 1.28 1.30 1.32 3 1.03 1.06 1.09 1.12 1.16 1.19 1.23 1.26 1.30 1.33 1.37 1.40 1.44 1.48 1.52 4 1.04 1.08 1.13 1.17 1.22 1.26 1.31 1.36 1.41 1.46 1.52 1.57 1.63 1.69 1.75 5 1.05 1.10 1.16 1.22 1.28 1.34 1.40 1.47 1.54 1.61 1.69 1.76 1.84 1.93 2.01 6 1.06 1.13 1.19 1.27 1.34 1.42 1.50 1.59 1.68 1.77 1.87 1.97 2.08 2.19 2.31 7 1.07 1.15 1.23 1.32 1.41 1.50 1.61 1.71 1.83 1.95 2.08 2.21 2.35 2.50 2.66 8 1.08 1.17 1.27 1.37 1.48 1.59 1.72 1.85 1.99 2.14 2.30 2.48 2.66 2.85 3.06 9 1.09 1.20 1.30 1.42 1.55 1.69 1.84 2.00 2.17 2.36 2.56 2.77 3.00 3.25 3.52 10 1.10 1.22 1.34 1.48 1.63 1.79 1.97 2.16 2.37 2.59 2.84 3.11 3.39 3.71 4.05 11 1.12 1.24 1.38 1.54 1.71 1.90 2.10 2.33 2.58 2.85 3.15 3.48 3.84 4.23 4.65 12 1.13 1.27 1.43 1.60 1.80 2.01 2.25 2.52 2.81 3.14 3.50 3.90 4.33 4.82 5.35 13 1.14 1.29 1.47 1.67 1.89 2.13 2.41 2.72 3.07 3.45 3.88 4.36 4.90 5.49 6.15 14 1.15 1.32 1.51 1.73 1.98 2.26 2.58 2.94 3.34 3.80 4.31 4.89 5.53 6.26 7.08 15 1.16 1.35 1.56 1.80 2.08 2.40 2.76 3.17 3.64 4.18 4.78 5.47 6.25 7.14 8.14 16 1.17 1.37 1.60 1.87 2.18 2.54 2.95 3.43 3.97 4.59 5.31 6.13 7.07 8.14 9.36 17 1.18 1.40 1.65 1.95 2.29 2.69 3.16 3.70 4.33 5.05 5.90 6.87 7.99 9.28 10.76 18 1.20 1.43 1.70 2.03 2.41 2.85 3.38 4.00 4.72 5.56 6.54 7.69 9.02 10.58 12.38 19 1.21 1.46 1.75 2.11 2.53 3.03 3.62 4.32 5.14 6.12 7.26 8.61 10.20 12.06 14.23 20 1.22 1.49 1.81 2.19 2.65 3.21 3.87 4.66 5.60 6.73 8.06 9.65 11.52 13.74 16.37
  • 70.
    TABLE FOR DISCOUNTFACTOR Discoun t /Year 1% 2% 3% 4% 5% 6% 7% 8% 9% 10% 11% 12% 13% 14% 15% 1 0.990 0.980 0.971 0.962 0.952 0.943 0.935 0.926 0.917 0.909 0.901 0.893 0.885 0.877 0.870 2 0.980 0.961 0.943 0.925 0.907 0.890 0.873 0.857 0.842 0.826 0.812 0.797 0.783 0.769 0.756 3 0.971 0.942 0.915 0.889 0.864 0.840 0.816 0.794 0.772 0.751 0.731 0.712 0.693 0.675 0.658 4 0.961 0.924 0.888 0.855 0.823 0.792 0.763 0.735 0.708 0.683 0.659 0.636 0.613 0.592 0.572 5 0.951 0.906 0.863 0.822 0.784 0.747 0.713 0.681 0.650 0.621 0.593 0.567 0.543 0.519 0.497 6 0.942 0.888 0.837 0.790 0.746 0.705 0.666 0.630 0.596 0.564 0.535 0.507 0.480 0.456 0.432 7 0.933 0.871 0.813 0.760 0.711 0.665 0.623 0.583 0.547 0.513 0.482 0.452 0.425 0.400 0.376 8 0.923 0.853 0.789 0.731 0.677 0.627 0.582 0.540 0.502 0.467 0.434 0.404 0.376 0.351 0.327 9 0.914 0.837 0.766 0.703 0.645 0.592 0.544 0.500 0.460 0.424 0.391 0.361 0.333 0.308 0.284 10 0.905 0.820 0.744 0.676 0.614 0.558 0.508 0.463 0.422 0.386 0.352 0.322 0.295 0.270 0.247 11 0.896 0.804 0.722 0.650 0.585 0.527 0.475 0.429 0.388 0.350 0.317 0.287 0.261 0.237 0.215 12 0.887 0.788 0.701 0.625 0.557 0.497 0.444 0.397 0.356 0.319 0.286 0.257 0.231 0.208 0.187 13 0.879 0.773 0.681 0.601 0.530 0.469 0.415 0.368 0.326 0.290 0.258 0.229 0.204 0.182 0.163 14 0.870 0.758 0.661 0.577 0.505 0.442 0.388 0.340 0.299 0.263 0.232 0.205 0.181 0.160 0.141 15 0.861 0.743 0.642 0.555 0.481 0.417 0.362 0.315 0.275 0.239 0.209 0.183 0.160 0.140 0.123 16 0.853 0.728 0.623 0.534 0.458 0.394 0.339 0.292 0.252 0.218 0.188 0.163 0.141 0.123 0.107 17 0.844 0.714 0.605 0.513 0.436 0.371 0.317 0.270 0.231 0.198 0.170 0.146 0.125 0.108 0.093 18 0.836 0.700 0.587 0.494 0.416 0.350 0.296 0.250 0.212 0.180 0.153 0.130 0.111 0.095 0.081 19 0.828 0.686 0.570 0.475 0.396 0.331 0.277 0.232 0.194 0.164 0.138 0.116 0.098 0.083 0.070 20 0.820 0.673 0.554 0.456 0.377 0.312 0.258 0.215 0.178 0.149 0.124 0.104 0.087 0.073 0.061