Download to read offline


![Mercator Ocean Quarterly Newsletter #24– January 2007 – Page 16
Within the GMES and towards the Marine Core Service at Mercator Ocean
AMPLIFYING FRONTAL EDDIES
LOOP
WITH FILAMENTS
CURRENT
CYCLONES or CYCLONIC
LOOP INTRUSIONS
OLDER
CURRENTEDDY
MEANDERS or SMALL
FRONTAL EDDIES
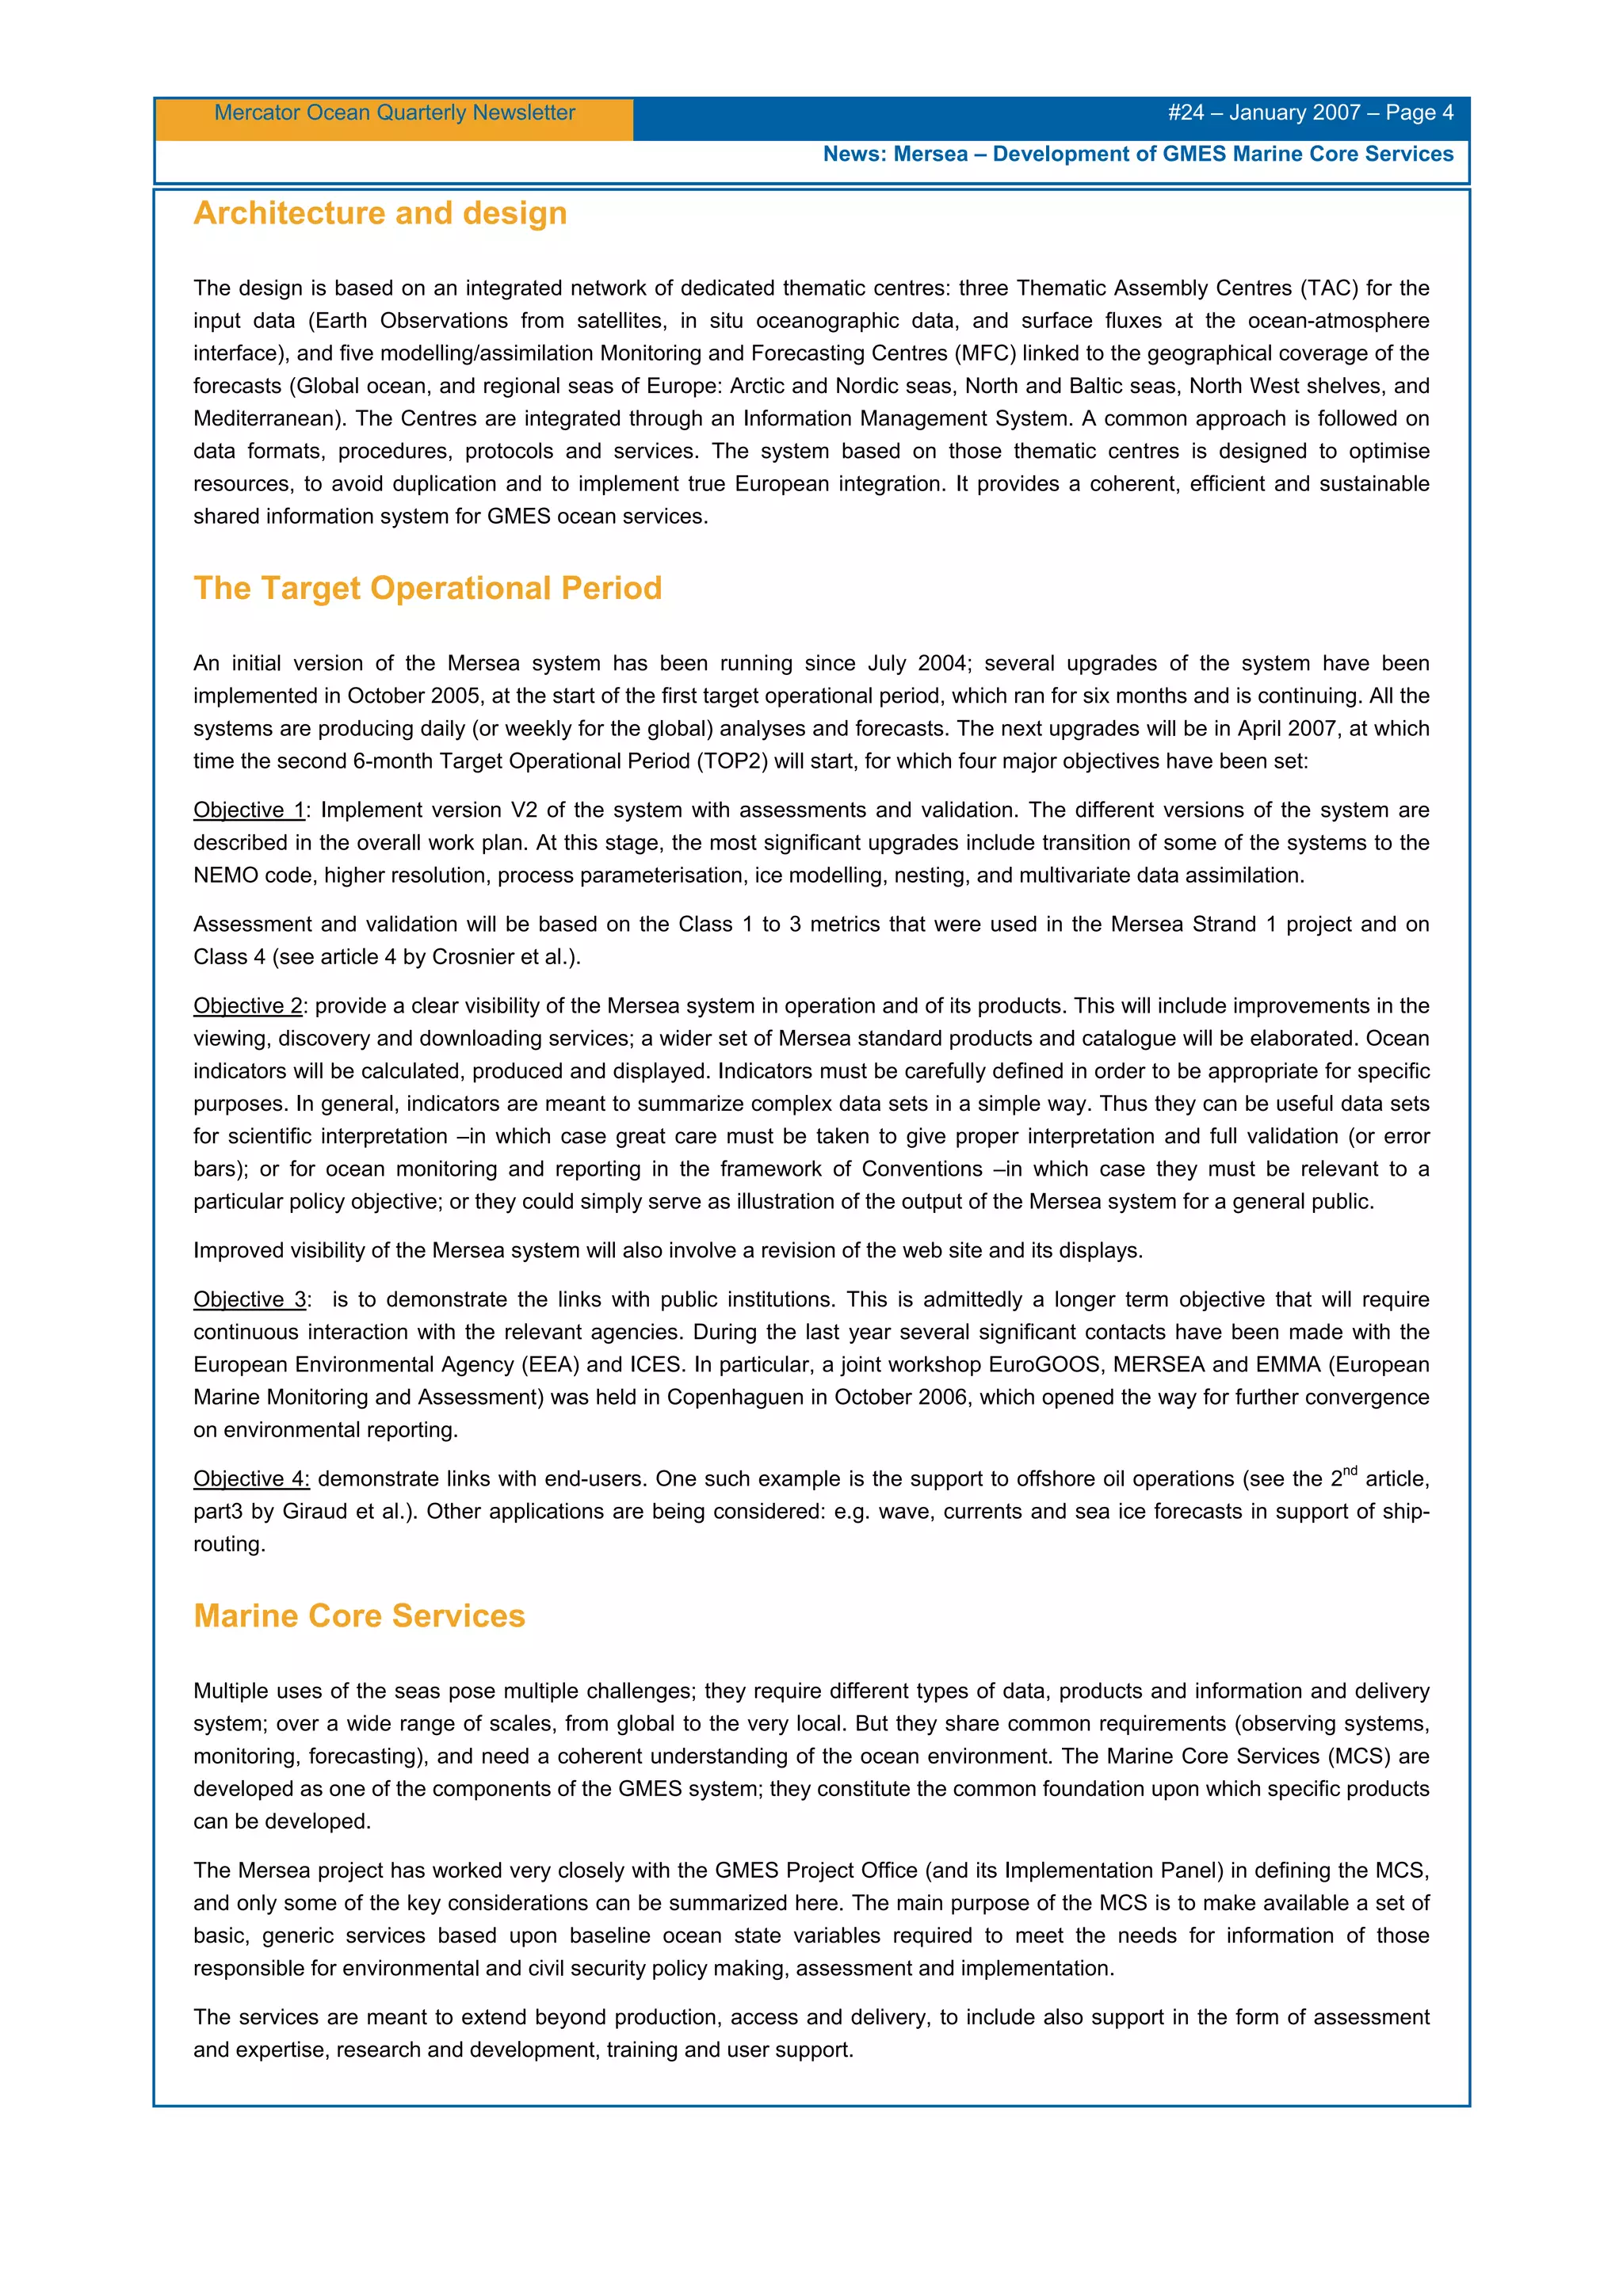
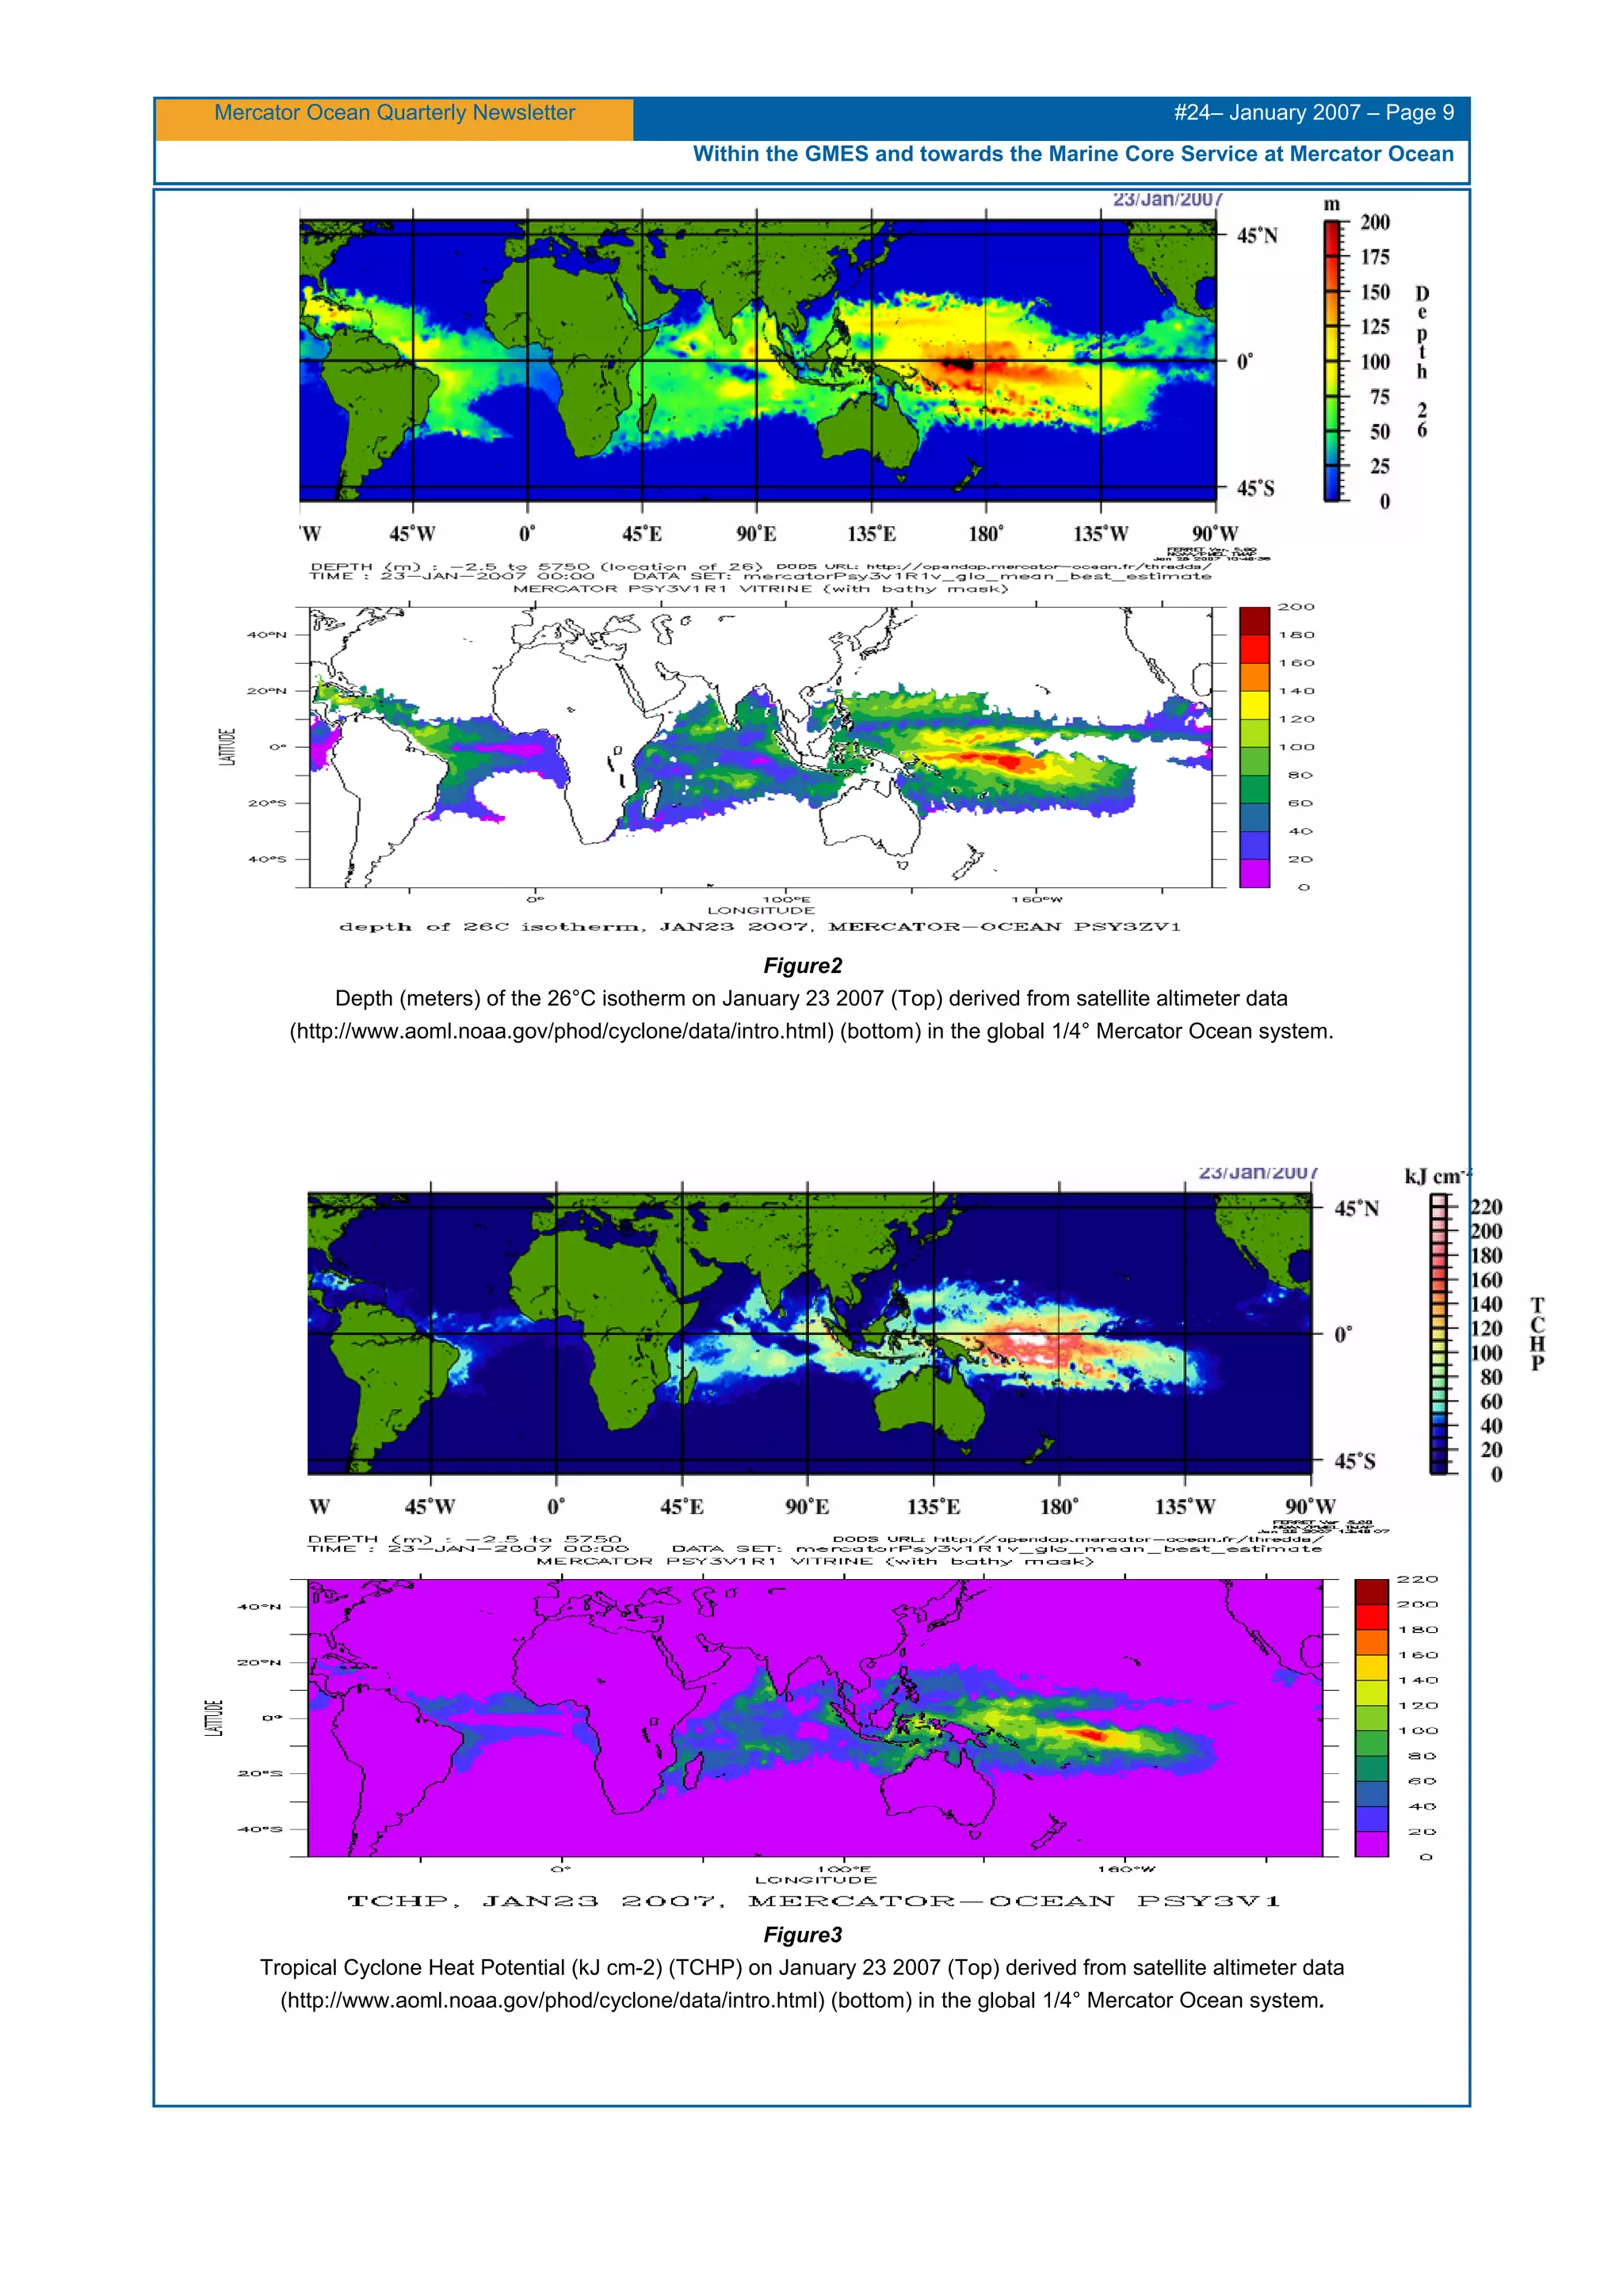
Figure 2
Frontal charts for day 03/30/2005 (end of re-attachment process): Crosses : selected Offshore sites, Black dotted line : Earth
Observations daily front (Along-track SLA, high resolution Ocean Color & SST), Red line : Automatic front detected on Mercator
Ocean Best Estimate, Blue line : 18°C isotherm at 200 depth Best Estimate, Green line : 18°C isotherm at 200 depth 7-day
forecast, Yellow line : 18°C isotherm at 200 depth 14-day forecast
Deriving performance metrics at every stage of the product elaboration: Quality Control, Hindcast and
Forecast quality assessment
The perception of “how good the model outputs are” is closely connected to the issue of the definition of metrics in the region of
interest. In that case, we found necessary to compute new user-specific metrics in addition to the generalist “standards” defined
in MERSEA Strand 1 exercise [Crosnier and Le Provost, 2005]. An associate objective is to monitor the forecast skill at the
regional scale of the specific event. This can be achieved by computing these metrics as a function of the forecast length. This
is one of the areas where experience-sharing between Mercator Ocean, Ocean Numerics and the offshore operators, is the
most critical.
Indeed, both Mercator Ocean and Ocean Numerics went further than delivering ocean products/derivating fronts for offshore
end users. Both are aiming at delivering quality-controlled products and need to monitor the performance of their systems in a
complementary way. This was achieved in the forecast bulletin that was issued on a weekly basis during the real-time
experiment in 2006 in which overall indices of quality are stated by ocean forecasters at Mercator Ocean. For example,
monitoring of Caribbean Eddies passage through the Yucatan Strait was found very useful for the interpretation of the model
outputs in the perspective of the forecasting of the evolution of the Loop Current. We found more difficult to interpret the cyclonic
frontal eddies generation and growing strength around the Loop Current: Mercator Ocean system is not yet performing well
enough for that.
On a routine and automated basis, the service is also based on systematic «verification metrics » that express the model’s skill
at forecasting the « frontal occurrence at given platform locations » (PERFORMANCE) and that compute the accuracy of these
forecasts as a function of forecast length (ACCURACY). These tables express the way these statistics are computed for
offshore operators and are a valuable feedback for Mercator Ocean scientific teams.
MARS Oil Platform](https://image.slidesharecdn.com/lettre24en-150622093441-lva1-app6892/75/Mercator-Ocean-newsletter-24-16-2048.jpg)
![Mercator Ocean Quarterly Newsletter #24– January 2007 – Page 17
Within the GMES and towards the Marine Core Service at Mercator Ocean
We compute three “user-specific” metrics:
• The shortest distance to front metric as a function of forecast ranges, measured from a specific ocean platform. Statistics
are computed on the difference between dmn and d0n as shown in Figure 3 at 11 sites over 17 weeks following a similar
methodology as in PROFS Deepstar Shootout Evaluation Study [Oey et al., 2005]. Results for Mars Offshore platform are
shown in Figure 4 for the hindcast study. For the real-time products, an evaluation study conducted by Woods Hole consulting
for BP and SHELL showed that Ocean Focus frontal charts show similar statistical performance metrics in terms of shortest
distance to front than the major competitor on the place (HMI/AEF).
• The forecast verification tables for decision-aid support and forecast skill assessment of the Loop Current Eddy detachment
event (Figure 5).
• Analysis and Forecast Quality metrics were also derived against proprietary (non assimilated) data. This relates to in situ
horizontal velocities time-series at depth from Rig-based ADCPs, Vessel-mounted ADCPs, MMS ADCP measurement sites
(public since 01/01/05) BP, SHELL private ADCP measurements. Horizontal velocities time series are located at 28, 124, 220,
316, 508 m. Model/data comparisons were computed as a function of the forecast length at selected locations where good
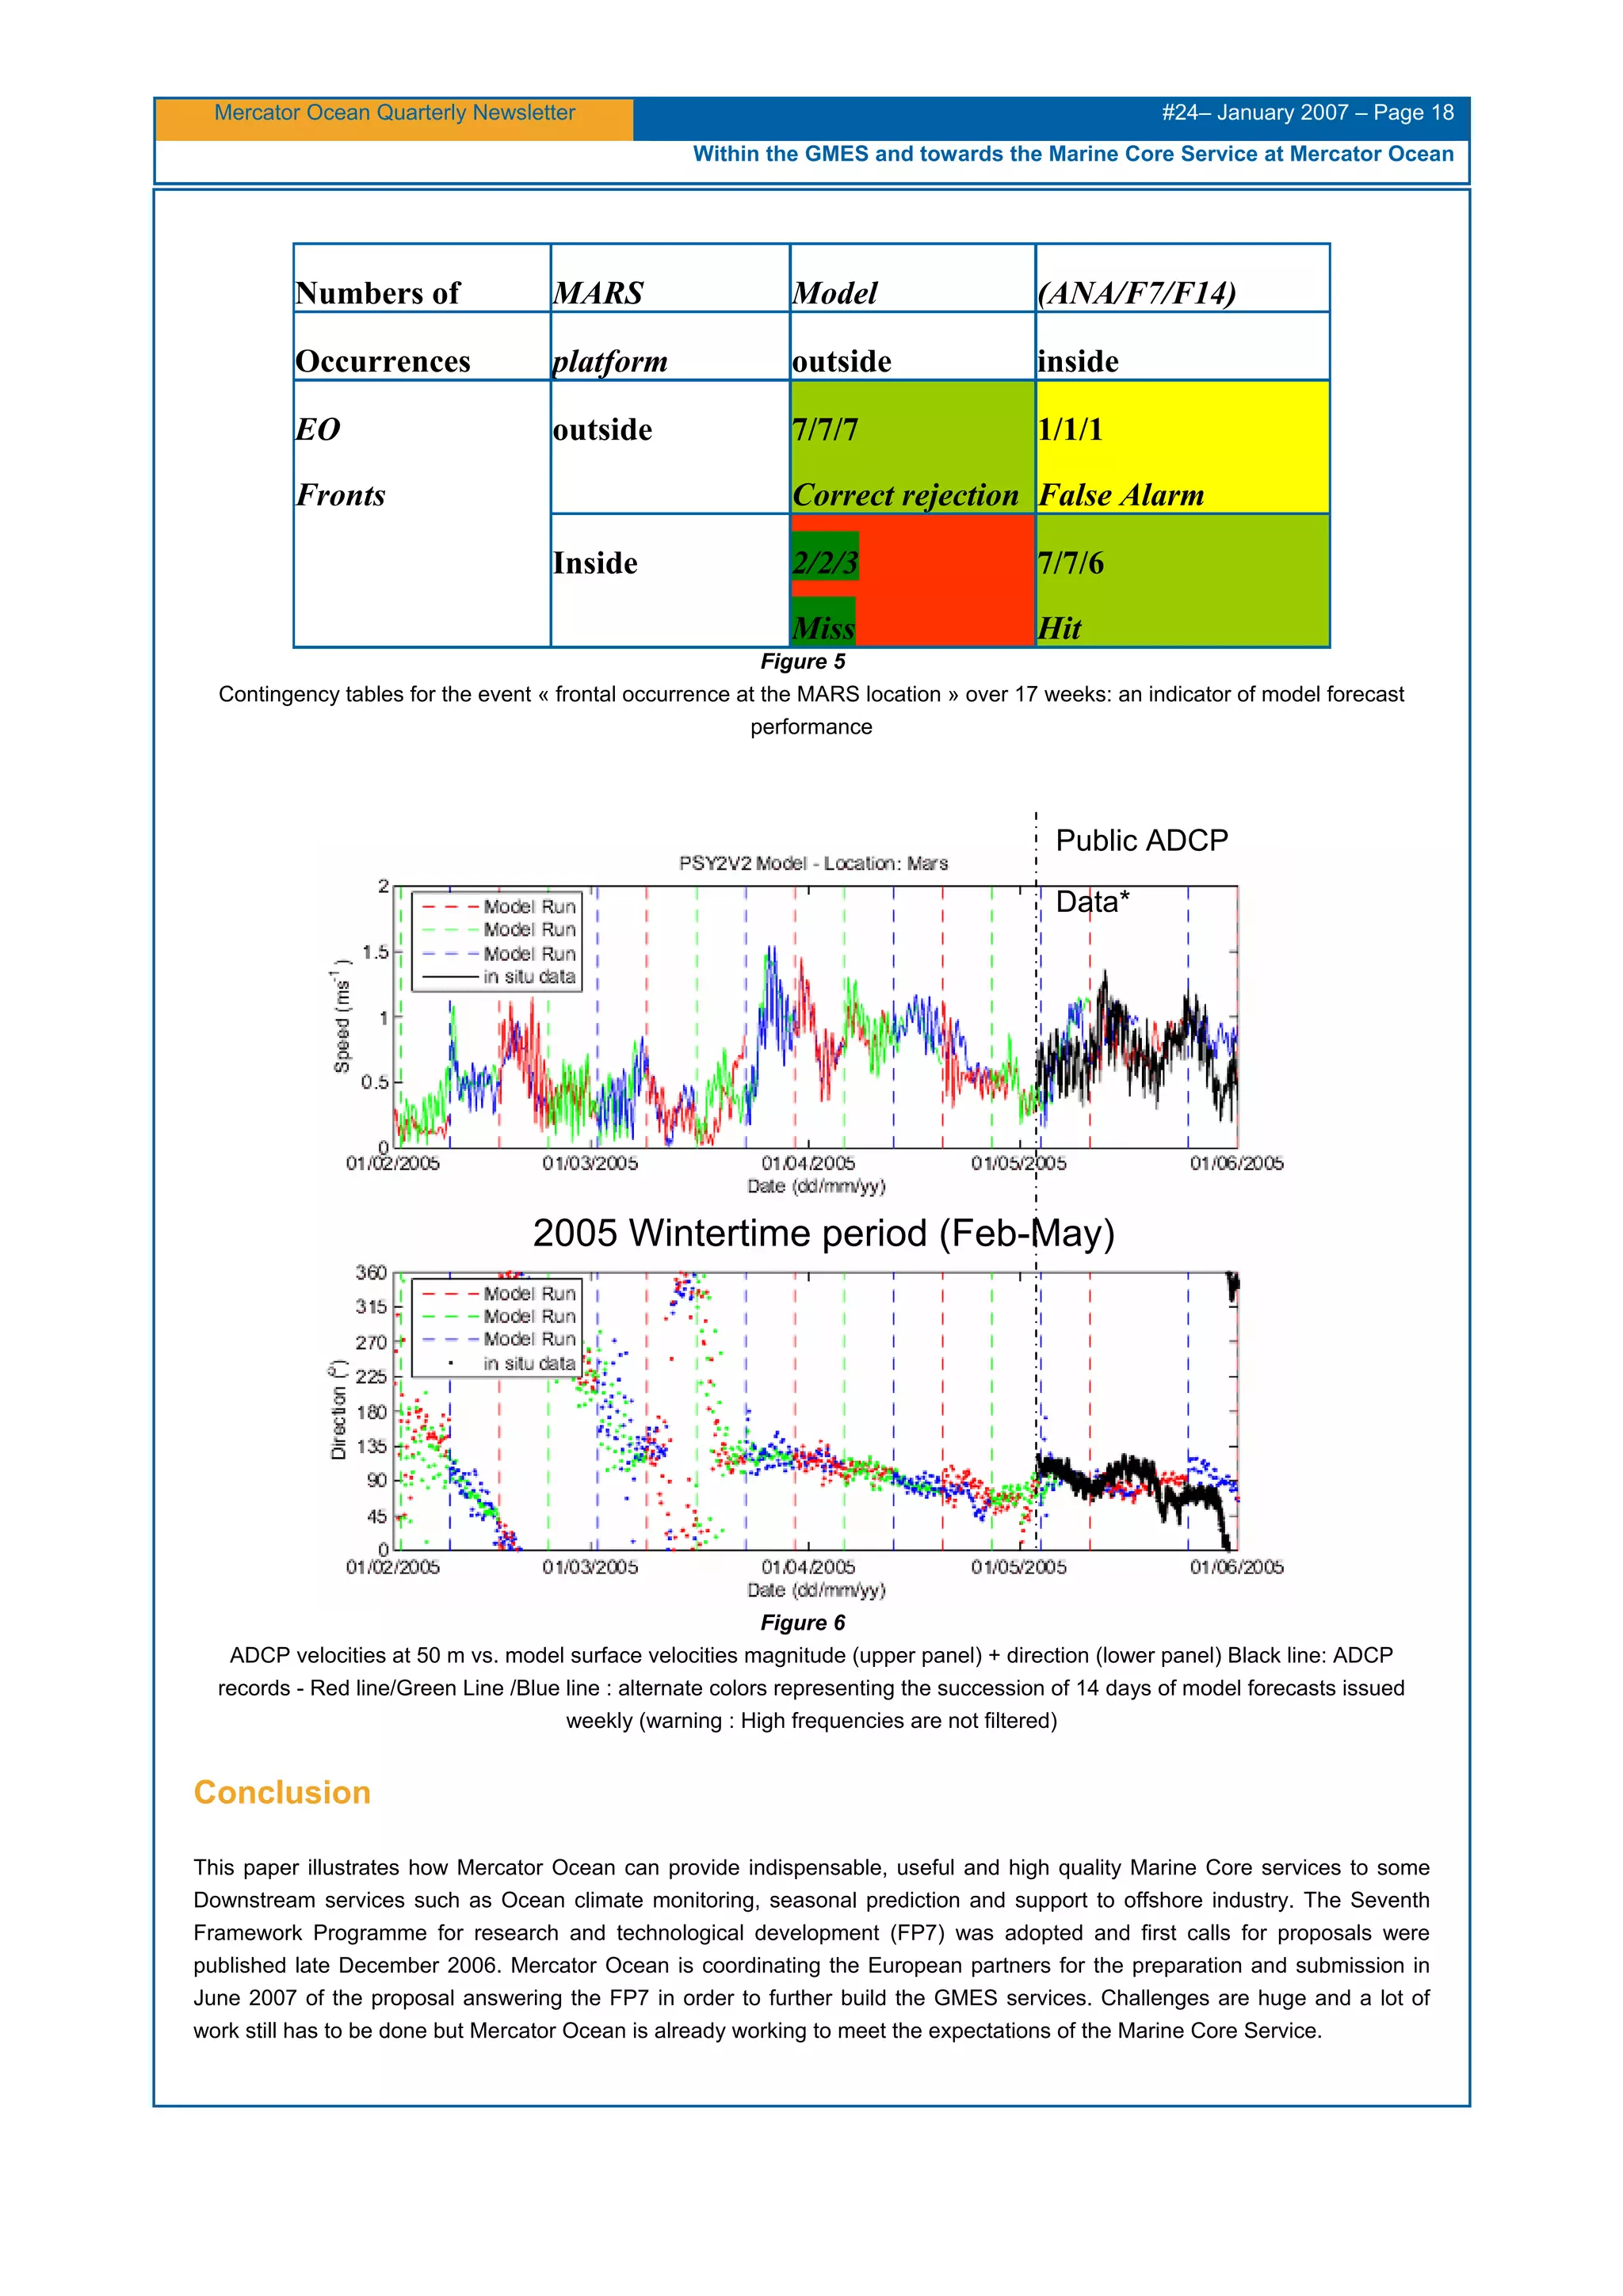
quality measurements are available and where velocities extrema have been observed: «ground-truth » observations. Figure 6
is an example of the feedback that can provide offshore operators for model validation. There is still much work going on to
further evaluates model performance in the operational context. These are very useful results for Mercator Ocean scientific
teams that will help in continuously improving the modelling and the data assimilation methods used for the prototypes. The
comparison to the current meter data shows a very good accordance in the magnitude as well as in the direction of the near-
surface velocity at this location when located in the Loop Current. Also the different forecast horizons give similar results
compared to the Analysis. But in every case, hindcast model gives an optimistic view of model performances compared to
nowcast model.
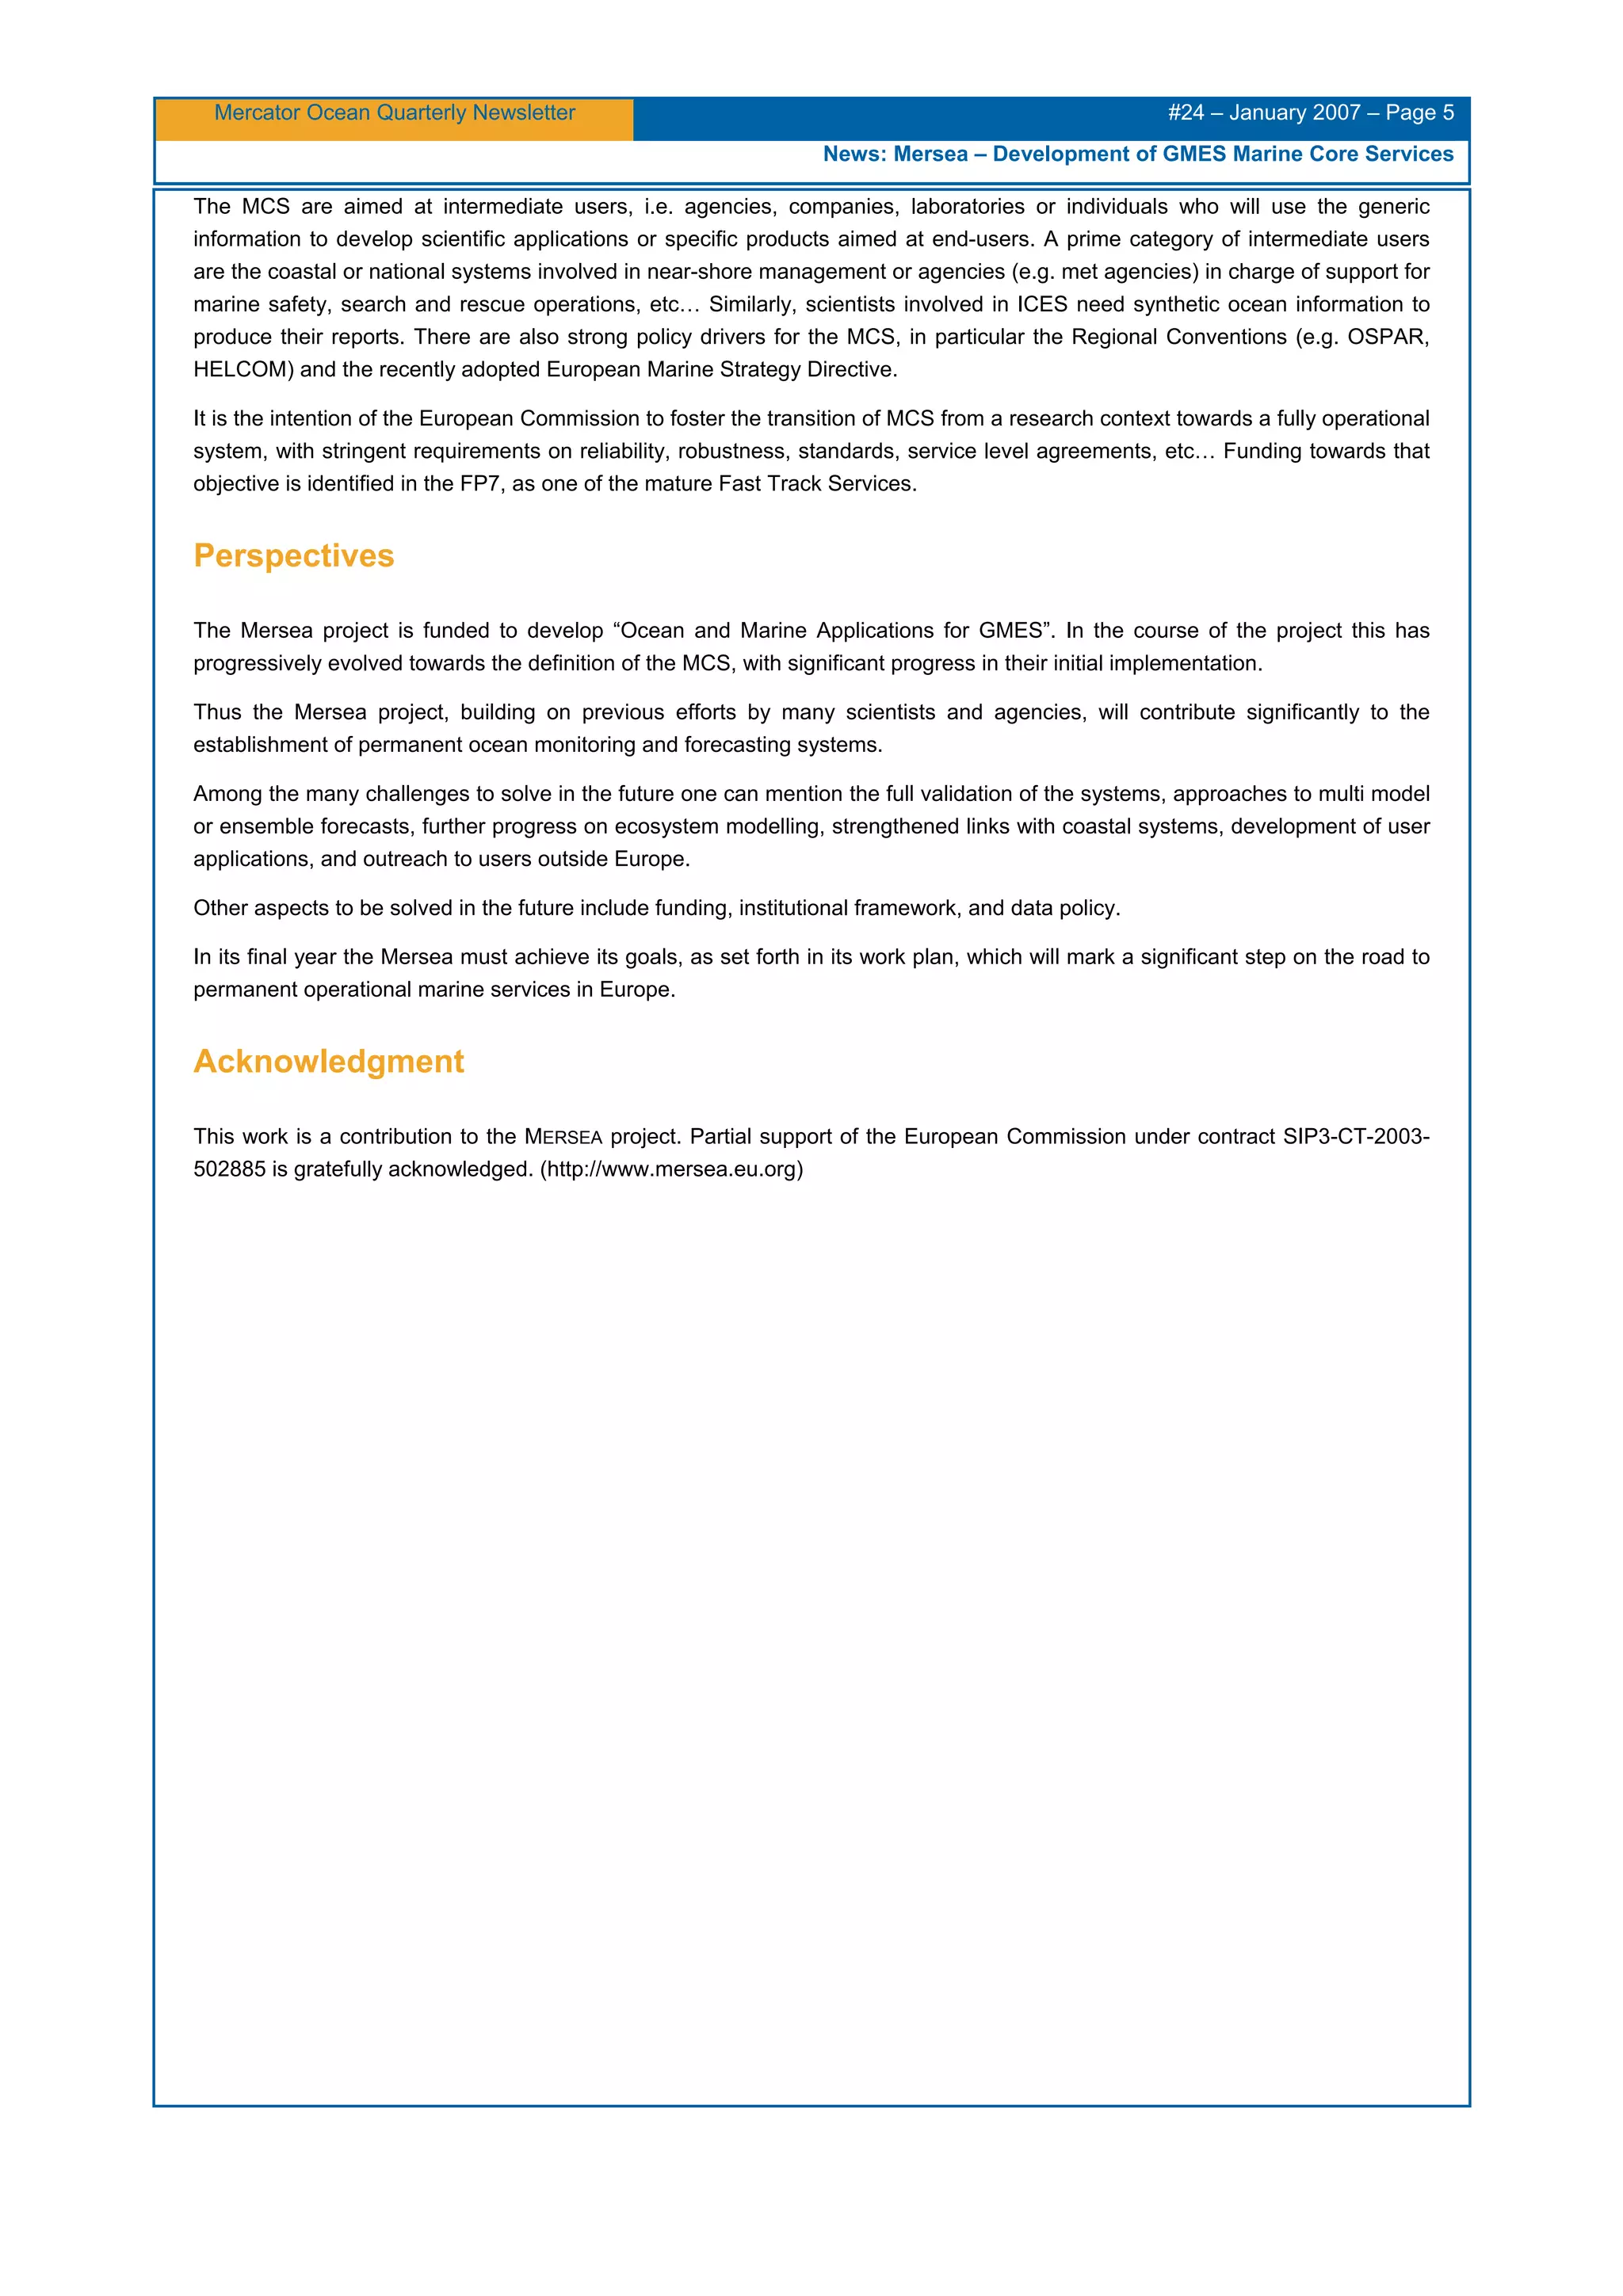
Figure 3
definition of the shortest distance to front metric and of the error
0
50
100
150
08/01/2005 28/01/2005 17/02/2005 09/03/2005 29/03/2005 18/04/2005 08/05/2005 28/05/2005 17/06/2005
Fronts
ANA
PRE J+7
PRE J+13
Distance to front at MARS Platform (km)
Figure 4
« absolute » value of distances to front as a function of time: an indicator of model forecast accuracy - MARS platform is located
near the front during 2005 wintertime (Feb-May) (less than 50 km on average). The rate of frontal occurrence at this location
amounts to 53% in the EO dataset represented by the frontal delineation maps. This location is representative of the overall
statistics over the 11 platforms.](https://image.slidesharecdn.com/lettre24en-150622093441-lva1-app6892/75/Mercator-Ocean-newsletter-24-17-2048.jpg)

![Mercator Ocean Quarterly Newsletter #24– January 2007 – Page 20
BLUElink>delivers first ocean forecasts
BLUElink> delivers first ocean forecasts
By Gary B. Brassington1
, Andreas Schiller2
, Peter R. Oke2
, Tim. Pugh1
and Graham Warren1
1
Bureau of Meteorology – BMRC, GPO Box 1289K. Melbourne, Victoria 3001 (Australie)
2
CSIRO Marine and Atmosperic Research – Castray Esplanade, GPO Box 1538. Hobart, TAS 7001 (Australie)
The first global ocean forecasts from the BLUElink> ocean prediction system were delivered in January 2007. Establishing
routine ocean forecasts is the concluding stage of a three and a half year research and development project, initiated by the
Australian government in 2003. The project was conducted through a collaboration between the Australian Commonwealth
Bureau of Meteorology, the Commonwealth Scientific and Industrial Research Organisation and the Royal Australian Navy. The
operational prediction system will be delivered through the Bureau of Meteorology to service the Royal Australian Navy, CSIRO
and the broader Australian marine user community as a public service. In addition, the prediction system will contribute to the
Global Ocean Data Assimilation Experiment including inter-comparisons with Mercator Ocean.
Introduction
The primary goal of the BLUElink project is to deliver operational short-range ocean forecasts for the Asian-Australian region.
The BLUElink project was undertaken by a team of scientists, technicians and naval officers drawn from the Australian
Commonwealth Bureau of Meteorology (CBoM), the Commonwealth Scientific and Industrial Research Organisation (CSIRO)
and the Royal Australian Navy (RAN). The project included research and development for a comprehensive range of ocean
related activities including: (1) an ocean observational data management systems, (2) product visualisation, (3) internet data
access services, (4) high resolution regional climatology, (5) high resolution regional analyses, (6) high resolution sea surface
temperature analyses, (7) surface wind verification, (8) global OGCM with eddy resolving resolution in the region, (9) data
assimilation system for an eddy-permitting OGCM, (10) a 15 year ocean reanalysis, (11) an intermediate global model, (12) an
experimental regional ocean and coupled model, (13) a real-time quality control system, (14) an operational forecast system
and (15) a relocatable ocean model. Only a subset of these components is discussed further in this article. For more
introductory information on the BLUElink project please refer to [12].
BLUElink> is a partner to the Global Ocean Data Assimilation Experiment (GODAE,[13]) a project designed to encourage and
support the development of data assimilating ocean prediction systems around the world. GODAE has promoted the sharing of
data, the standardising of forecast metrics, the use of common data formats and protocols for data servicing. The BLUElink>
operational forecast system as a partner has been able to establish “operational” real-time observational data streams and
develop data services based on GODAE and IOOS conventions.
The operational ocean forecast system comprises several software components including (a) the Ocean Forecast Australia
Model (OFAM), (b) the BLUElink> Ocean Data Assimilation System (BODAS;[1]), (c) an in situ observational data processing
system and (d) a atmospheric flux processing and regridding system. The system relies on several high quality input data
products including real-time observations, operational atmospheric forecasts, ocean climatologies and bathymetry products. The
system has been configured to run at the CBoM taking advantage of operational infrastructure including high performance
computing systems, real-time communications systems and data management and archival systems. This article will briefly
outline the specific software, data products and infrastructure used in the Ocean Model, Analysis and Prediction System
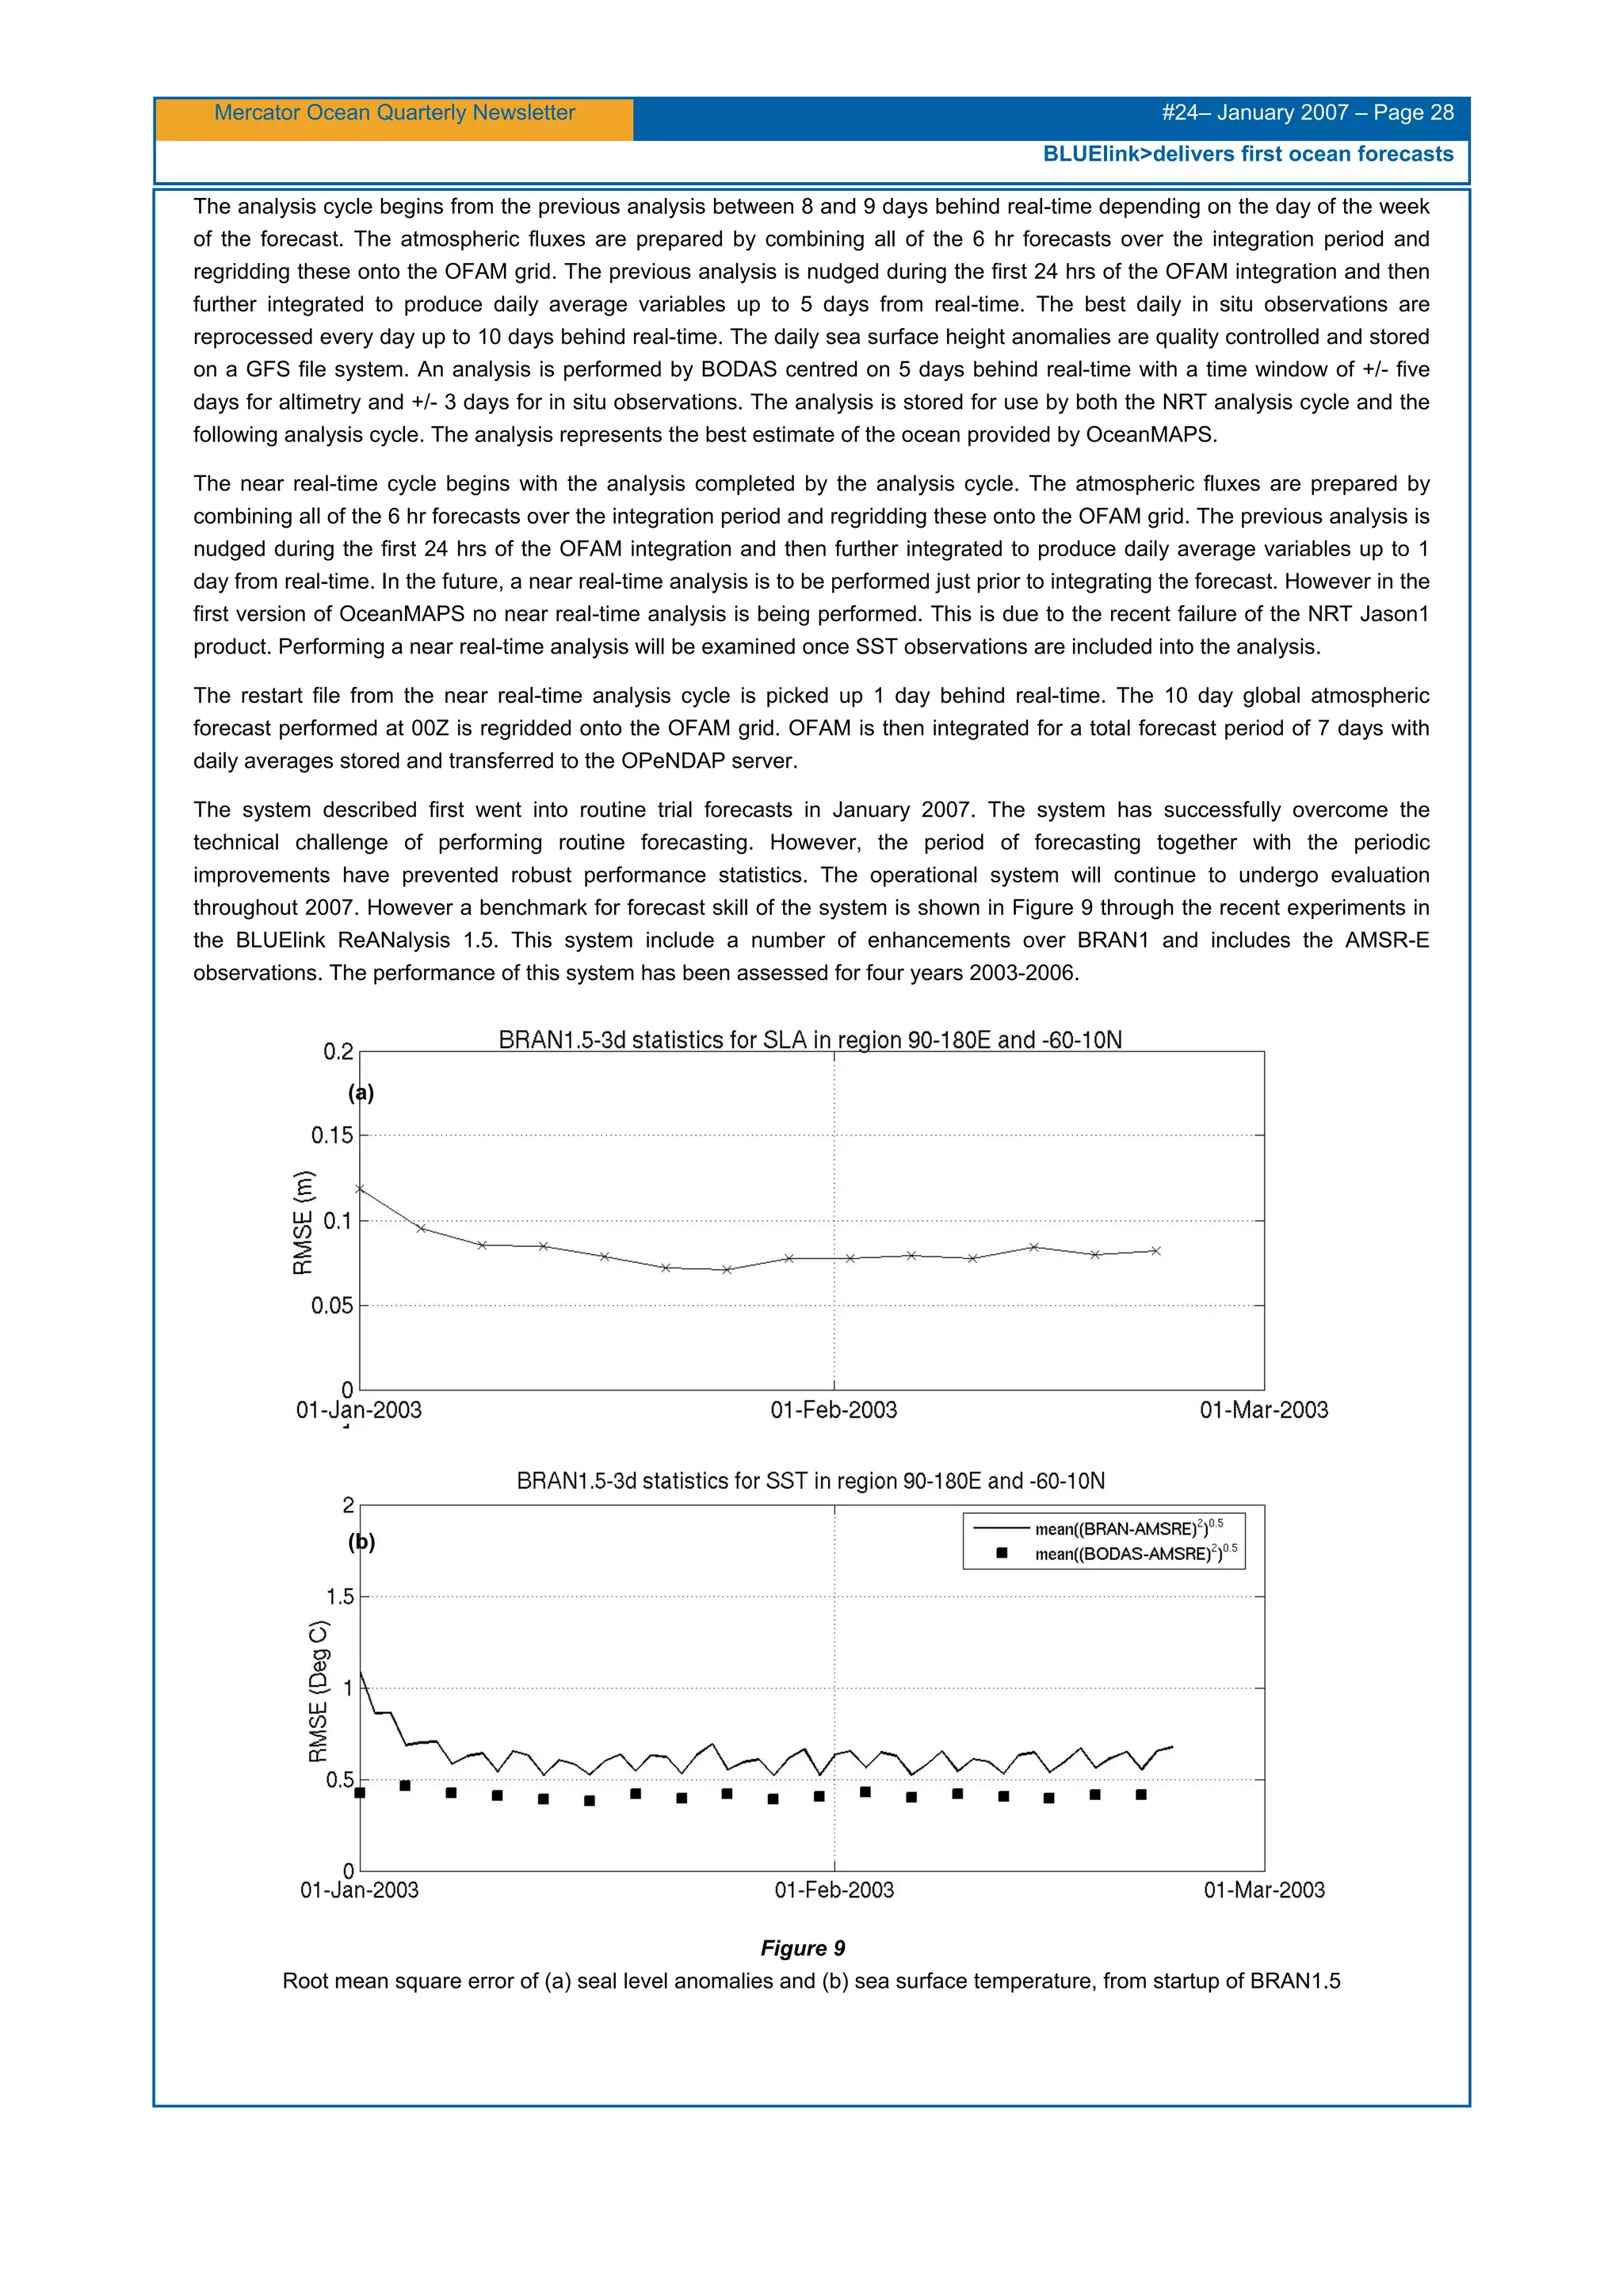
(OceanMAPS;[2]) together with some measures of performance.
Software components
Ocean Forecast Australia Model (OFAM)
BLUElink> have implemented the GFDL Modular Ocean Model version 4 p0d (MOM4) [8] with specific enhancements for mixed
layer physics [9] and the algorithm for calculating penetrative solar radiation. In addition, the software includes some
enhancements to vectorise routines for use on the NEC SX6 high performance computing facility. OFAM uses a global grid with
a horizontal resolution of 0.1°×0.1° in the Australian region defined by 90E-180E and 75S-16N which is designed to resolve
mesoscale ocean dynamics. Outside this region the grid is stretched up to a resolution of 0.9° in the Indian Ocean and South
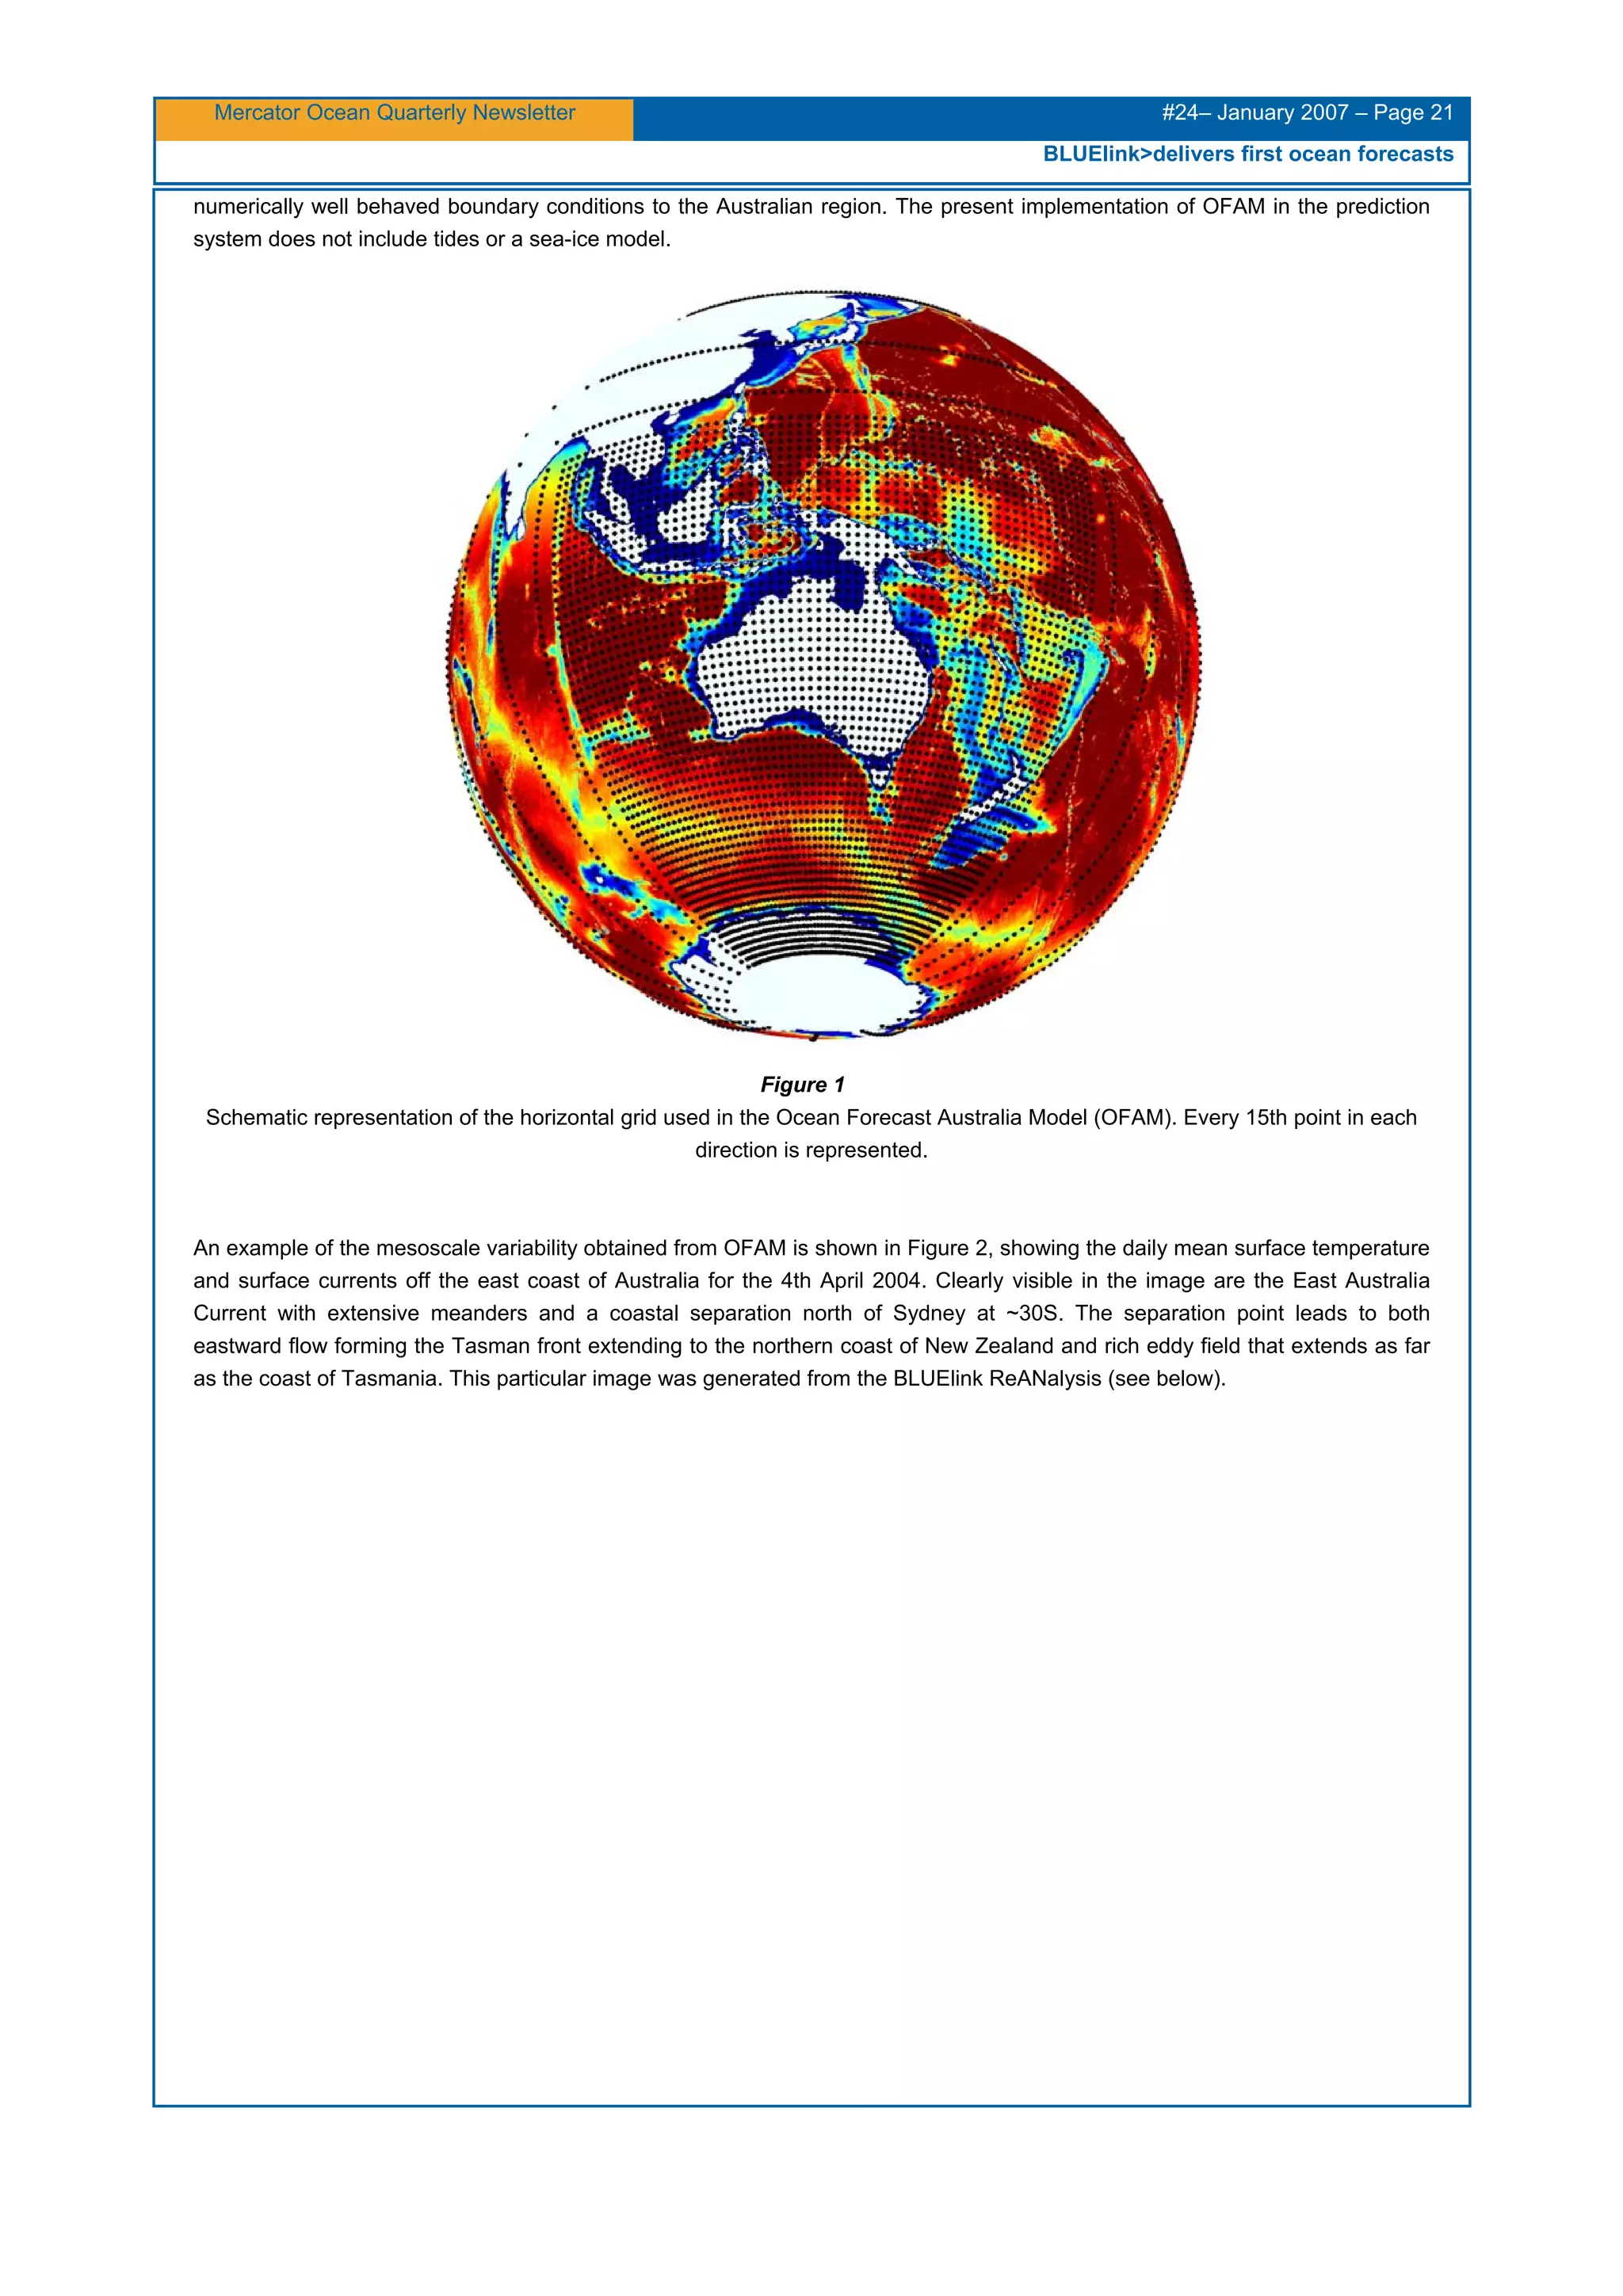
Pacific Ocean and tropical North Pacific. Beyond this domain the resolution in the North Atlantic is 2°×2°. A schematic
representation of the horizontal grid that illustrates the concentration of grid points in the Australian region is shown in Figure.1.
OFAM has 47 vertical levels with the top 20 levels uniformly distributed at 10m resolution. Below 200m, the vertical grid spacing
is increased to bottom cell spacing of 962m and a total depth of 5000m. This configuration has 71% of the total grid points within
the Australian region and 72% of all model grid points are water cells. The OFAM grid provides dynamically consistent and](https://image.slidesharecdn.com/lettre24en-150622093441-lva1-app6892/75/Mercator-Ocean-newsletter-24-20-2048.jpg)
![Mercator Ocean Quarterly Newsletter #24– January 2007 – Page 22
BLUElink>delivers first ocean forecasts
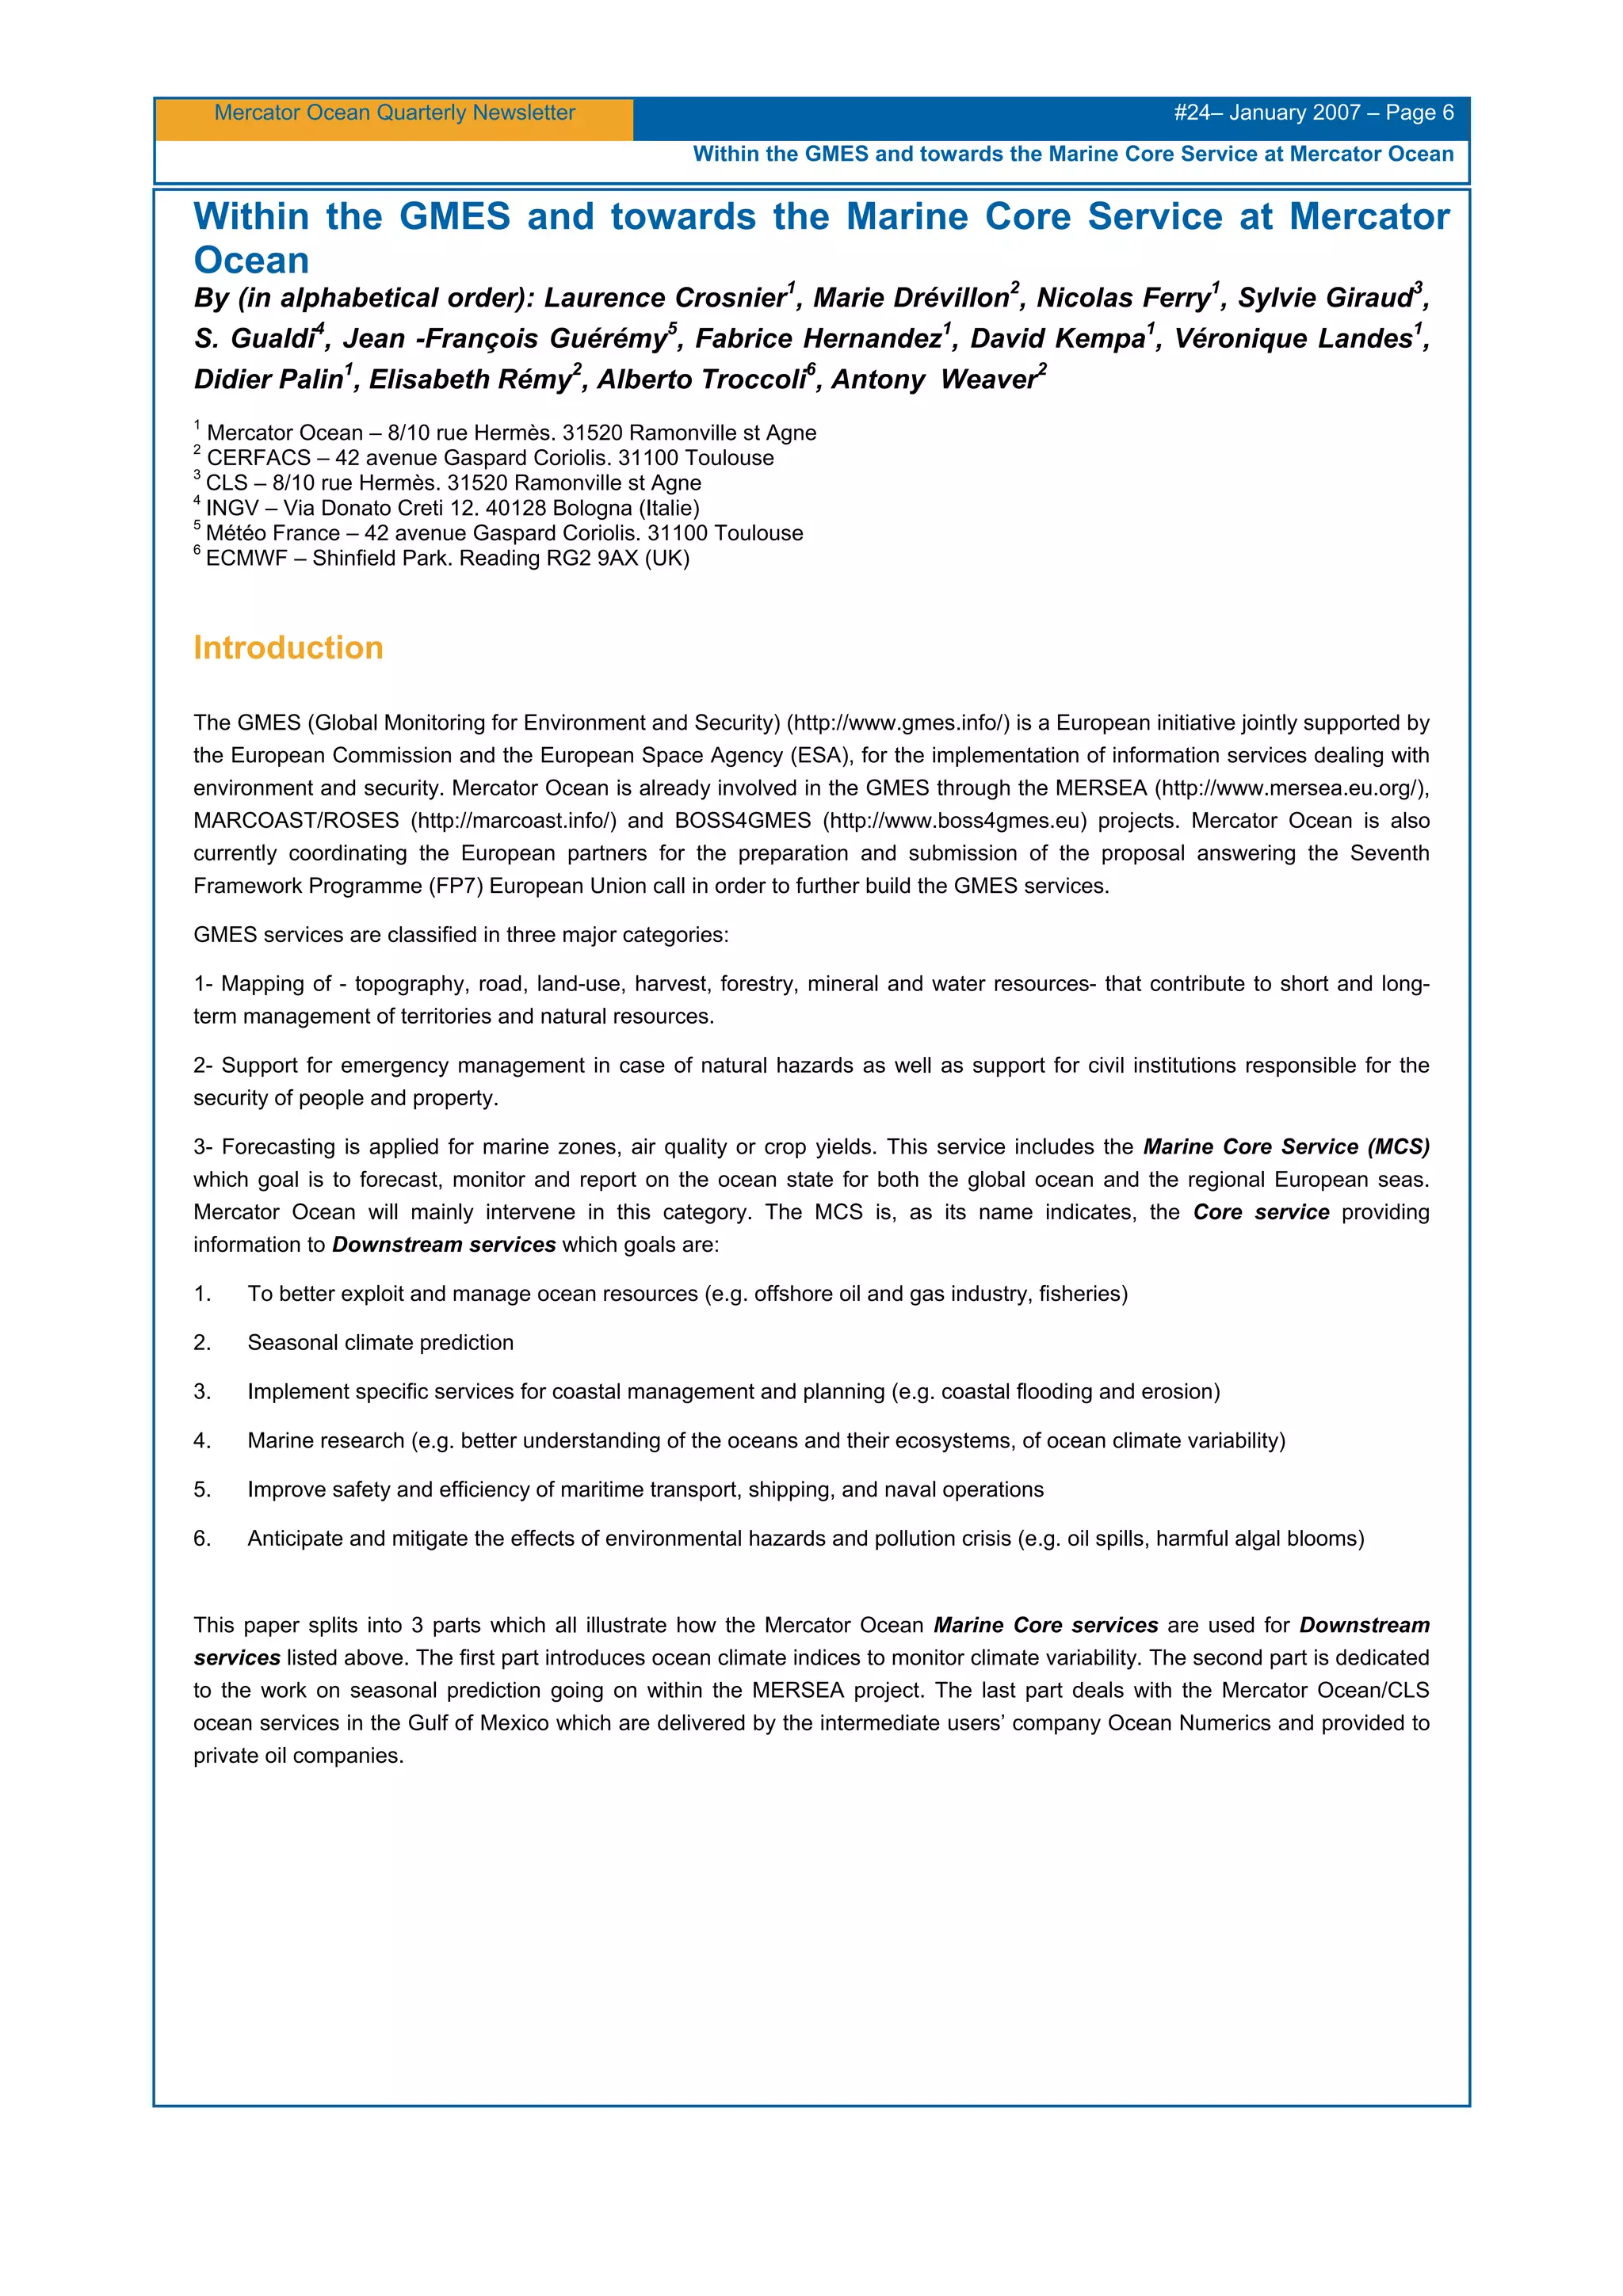
Figure 2
BLUElink ReANalysis daily mean surface temperature and surface currents for the 4th April 2004 over the Tasman Sea off the
east coast of Australia
The OFAM model has been integrated over the period 1991-2004 using a combination of ERA40 [7] and ECMWF forecast
fluxes to assess the model performance and derive covariance statistics for the data assimilation system (see below). The
mixed layer depth from the spinup simulations has been compared against the CSIRO Atlas of Regional Seas climatology [10]
as shown in Figure 3 and 4. The results for OFAM are based on the period 1998-2004 which is beyond the CARS climatology
so that a portion of variation will be attributable to inter-annual variability. The broad features of shallow mixed layers over much
of the central domain; deeper mixed layers in the equatorial and high latitude region show good correspondence. OFAM shows
evidence of deeper mixed layers over the tropics indicating stronger westerlies and La Nina like conditions. There is also
evidence of significant penetration of SEC into the Coral Sea compared with CARS. The high latitudes in OFAM are
characterised by very distinct narrow filaments that retain this characteristic after averaging. This could be a realistic feature
determined by bathymetric steering.](https://image.slidesharecdn.com/lettre24en-150622093441-lva1-app6892/75/Mercator-Ocean-newsletter-24-22-2048.jpg)
![Mercator Ocean Quarterly Newsletter #24– January 2007 – Page 23
BLUElink>delivers first ocean forecasts
Figure 3
Depth of the temperature that is 1.0°C cooler than the surface. (a) mean January from CARS, (b) mean January from OFAM
based on 1998-2004
Figure 4
Depth of the temperature that is 1.0°C cooler than the surface. (a) mean July from CARS, (b) mean July from OFAM based on
1998-2004
BLUElink> Ocean Data Assimilation System (BODAS)
BLUElink> has developed a new software to perform ocean data assimilation which uses an ensemble based, multi-variate
optimal interpolation scheme [1]. A specific feature of the scheme is the use of an ensemble of anomalies from the seasonal
cycle generated from a spinup integration of OFAM to estimate the background error covariances. The first comprehensive
examination of this scheme was through a 15 year (1992-2004) BLUElink ReANalysis (BRAN) which used a 72 member
ensemble. In general, the undersampling of the covariance statistics can contain large values far from the point of interest.
These were assumed to be unrealistic features for mesoscale variability and were controlled through localisation. It is critical to
this scheme that the free ocean model driven by surface fluxes is able to maintain both a realistic mean ocean state and a
realistic distribution of ocean variability. A complete analysis of OFAM is a significant on-going task.](https://image.slidesharecdn.com/lettre24en-150622093441-lva1-app6892/75/Mercator-Ocean-newsletter-24-23-2048.jpg)
![Mercator Ocean Quarterly Newsletter #24– January 2007 – Page 24
BLUElink>delivers first ocean forecasts
A comparison of the statistics of the model anomalies with the statistics found in satellite altimetry observations is shown in
Figure 5. The correlation between modelled sea surface height anomalies at Thevenard (133.65E, 32.15S) in Southern
Australia with sea surface height anomalies in the surrounding region is shown in Figure 5a. The region of high correlation is
confined to the continental shelf (<200m) and elongated along the coastline. Also shown in Figure 5a are the correlations of sea
surface height anomalies from the available coastal tide gauge (ctg) network with the ctg located at Thevenard. The ctg time
series have been filtered for tides and the seasonal cycle and the correlations show good agreement with those of OFAM. In
Figure 5b, the sea surface height anomalies of Topex-Poseidon are correlated with those of the ctg at Thevenard. Again the
region of high correlation is confined to the continental shelf and elongated along the coastline in good agreement with the
statistics represented by the model. This pattern is consistent for both Jason1 and GFO (not shown). This analysis indicates that
(1) OFAM is reproducing observed variability of sea level height anomalies, (2) the statistics of sea surface height anomalies
change in character across the 200m isobath, (3) there is signal in both the ctg’s and the satellite altimetry in the coastal zone
and (4) the strategy of using model based covariances from OFAM will separate the influence of coastal and open ocean
innovations consistent with observations. Indeed, the use of covariances that do not account for the anisotropic scales in this
region will lead to poor quality analyses in the cross shelf region. The common alternative practice is to reject observations
within the 200m isobath. The region of Thevenard is a particularly good example because it is characterised by a large
continental shelf but a relatively modest tidal signal. Both the North West Shelf and the continental shelf off Queensland do not
exhibit the same level of correlation and are characterised by significant tidal signals. However strong relationships are found for
all tide gauges on the Australian coast that have a weak tidal signal. Further research is being conducted into region where the
tidal signal is larger.
Figure 5
(a) Correlation of OFAM seasonal anomalies of sea surface height at Thevenard with anomalies in the Australian region. The
circles correspond to correlations of observed seasonal sea surface height anomalies from coastal tide gauges to that of
Thevenard. (b) correlation of seasonal filtered sea surface height anomalies from the Thevenard coastal tide gauge and the
surrounding seasonally filtered sea surface height anomalies observed by Topex-Poseidon
In situ observation processing system
The GTS is the primary operational communication for in situ ocean observations received by the CBoM. Both the BATHY and
TESAC messages are reformatted to an Argo netCDF format. A priority for BLUElink> has been to ensure the maximum
number of Argo retrievals available in real-time. The Argo observations are distributed in real-time through the GTS without
quality control and subsequently distributed through two global data assembly centres (USGODAE and Coriolis) with automatic
quality control. Processing of the three sources Argo files has consistently revealed that none of these sources contain a
complete superset of all the real-time observations. In order to maximise the quantity of Argo observations a duplicate checker
was developed to locate all duplicates and form a single file containing the best copy (the highest level of quality control)
amongst the duplicates for each day.
The best daily observation files preserve all of the available quality control messages from the automatic QC performed at the
DAC’s. Each best daily observation file is further processed using an internal set of quality control checks including standard
checks for monotonicity, stability as well as some of the checks from [11] plus comparisons with climatology.
Flux regridder
A regridding software was developed to provide a conservative regridding with a new approach introduced to remap
atmospheric features aligned with the coastline on a coarse grid with the coastline of a higher resolution target grid. This was
(a) (b)](https://image.slidesharecdn.com/lettre24en-150622093441-lva1-app6892/75/Mercator-Ocean-newsletter-24-24-2048.jpg)

![Mercator Ocean Quarterly Newsletter #24– January 2007 – Page 26
BLUElink>delivers first ocean forecasts
Data products
Observation products
The Bureau of Meteorology receives BATHY and TESAC messages via the GTS which are composed of XBT, Moored CTD’s
and Argo without quality control. These observations are close to real-time with 90% observing the ocean with the past 3 days.
The Bureau also retrieves Argo data products from the two GDAC’s USGODAE and Coriolis via ftp. These products contain
Argo observations that have undergone automated quality control. Both GDACs contain observations that span a larger
number of days but typically 90% within the past 7 days.
At present there are two satellite altimeters available for operational oceanography, Jason and Envisat. OceanMAPS does not
process the raw satellite altimetry observations but instead retrieves processed sea surface height anomaly products from JPL
and ESA. The quality of these products is impacted by the algorithm used to compute the Geophysical Data Record. The faster
algorithms required for the near real-time delivery impact the quality of the products. Sensitivity of analyses to real-time ssha
products has not been assessed.
Each of the sources of sea level anomaly products are obtained in a unique way. Jason is obtained via OCEANIDS and ftp push
service provided by PO.DAAC. ENVISAT is obtained via an ftp push from ESA. Each data stream has its own unique file format
which is processed at the Bureau and passed through a series of quality control checks and reformatted to BUFR for storage
and netCDF for use in the analysis.
Surface products
The Bureau maintain a set of operational NWP forecast systems including: GASP [3] a global assimilation and prediction
system based on a spectral model and LAPS [4] a limited area prediction system for the Australian region. GASP has a
maximum horizontal resolution of 0.75°×0.75° resolution in the tropics and uses a gaussian grid in high latitudes and has 33
sigma levels. The analysis uses a generalised multi-variate statistical interpolation scheme (GenSI) which has been recently
upgraded to include scatterometer observations from QuikSCAT. The analysis for GASP is performed on a 6 hourly cycle with
10day forecasts issued every 12 hours at 06Z and 18Z. Analyses have demonstrated modest improvements in bias and skill in
forecast winds [5, 6]. GASP fluxes are retrieved from the operational disk storage and regridded to the OFAM grid.
The Bureau of Meteorology has also recently upgraded its regional sea surface temperature analysis system to a twice daily,
high resolution (1/12 by 1/12) operational product. The analysis system developed under BLUElink makes use of available
AVHRR, AATSR and AMSR-E satellite retrievals calibrated to a common foundation using a GHRSST strategy. The prediction
system at present applies a 30 day relaxation to the sea surface temperature analyses.
Other datasets
High resolution, accurate bathymetry for OFAM was produced by combining global products of the US Navy with the regional
products of Geoscience Australia for the Australian region. In addition, the system makes use of both the CARS2005 and
WOA2005 climatological datasets for quality control and for deep restoring.
Operational infrastructure
The Bureau maintains communications with a variety of networks including GTS, Internet, Grangenet, AARNet2 to support NRT
observation retrievals and data distribution. The majority of ocean profile observations are obtained from the GTS. Satellite
observations such as sea surface anomalies from JASON-1 are available between 5-7hrs behind real-time either on GODAE
servers in a pull mode or for operational centres such the Bureau in a push mode. Topex-Poseidon is also available from
OCEANIDS but is available approximately 18hrs behind real-time. Recent observations are collected into over-written files in
local memory and later archived.
The Bureau has recently implemented the Meteorological Archival and Retrieval System (MARS) to serve as the primary
meteorological database. This system was developed by ECMWF and was designed for storage of NWP output. The system
supports two file formats Gridded Binary (GRIB) and Binary Universal Form for the Representation of meteorological data
(BUFR) which are specific formats developed by ECMWF for the meteorological community that provide good compression.
However, neither of these two formats are widely used or supported outside this community by other centres or software
developers. For example, OPeNDAP does not provide support for reading these file formats and there are no plans from the
OPeNDAP developers to include this format in future. The Bureau has developed code to convert between file formats such as
NetCDF and GRIB and BUFR.](https://image.slidesharecdn.com/lettre24en-150622093441-lva1-app6892/75/Mercator-Ocean-newsletter-24-26-2048.jpg)


![Mercator Ocean Quarterly Newsletter #24– January 2007 – Page 31
GODAE at work in the Indian Ocean and Australian Area
GODAE at work in the Indian Ocean and Australian Area: Metrics
definition and intercomparison of the BLUELink and Mercator
systems.
By: Laurence Crosnier
1
, Garry B. Brassington
2
, Marie Drevillon
3
, Edmée Durand
1
and Fabrice Hernandez
1
1
Mercator Ocean - 8-10 rue Hermes, Parc technologique du Canal. 31526 Ramonville St Agne
2
BLUELink, Bureau of Meteorology – BMRC, GPO Box 1289K. Melbourne, Victoria 3001 (Australie)
3
Mercator Ocean (Cerfacs) - 8-10 rue Hermes, Parc technologique du Canal. 31526 Ramonville St Agne
Introduction
The methodology to achieve a real time inter-comparison of operational forecast systems for the Indian Ocean within the
GODAE framework is presented. The main objective of the inter-comparison exercise is to show the strengths and weaknesses
of each system according to the specificity and strategy adopted, as well as to provide guidance for improving future operational
systems. A standard set of diagnostics called metrics, first developed within the MERSEA European framework, has been
adopted by the international GODAE community. Such metric definitions aim to systematically assess the quality, consistency
and performance of each system (Le Provost, 2002), whereby:
•
•
•
•
‘Consistency’ means that operational systems outputs have to be consistent with the current knowledge of the ocean
circulation and climatologies.
‘Quality’ means that operational systems outputs have to be in agreement with independent observations (i.e. not
assimilated).
‘Performance’ means that metrics should quantify the capacity of each system to provide accurate short term forecast.
For MFS (Mediterranean Ocean Forecasting System) assessment, [Pinardi and Tonani, 2005] proposed a fourth principle, to
verify and take into account the interest/relevance for the customer, and catch intermediate- or end-users feedbacks:
‘Benefit’: user assessment of which quality level has to be reached before the product is useful for an application.
For the last two years, the Mercator Ocean team in charge of the Global forecasting system within the MERSEA framework
have been discussing with Japanese [Kamachi, 2004] and Australian [Oke and Brassington, 2005] groups, in order to define the
Pacific and Indian Ocean metrics respectively. This paper is describing the Indian Ocean and Australian Region metrics defined
collectively by the French Mercator Ocean (Crosnier and Hernandez, 2006) and Australian BLUElink [Oke and Brassington,
2005] teams. We are also showing some preliminary results for the inter-comparison exercise of the Mercator Ocean and
BLUELink systems.
The Mercator Ocean and BLUELink systems
The French Mercator Ocean global system ¼° PSY3V1 used in this study has been described in a previous issue (issue N°19 of
the Newsletter) in October 2005. The Australian BLUElink system is described in this issue in a companion paper.
Metrics in the Indian Ocean
The Class 1, 2 and 3 metrics for the Indian Ocean and Australian Area are listed in Table 1 and illustrated in Figure 1.](https://image.slidesharecdn.com/lettre24en-150622093441-lva1-app6892/75/Mercator-Ocean-newsletter-24-31-2048.jpg)


![Mercator Ocean Quarterly Newsletter #24– January 2007 – Page 35
GODAE at work in the Indian Ocean and Australian Area
Levitus
Figure 2
Potential temperature (°C) (left column) and salinity (psu) (right column) along the 95°E meridional section in the Indian Ocean
a) in WOCE Sections I08S and I09N (January 1994 to March 1995), b) in BLUELink Reanalysis in October 2005, c) in
Mercator Global PSY3V1 in October 2006, d) in Levitus in October.
Second, we show preliminary results from the comparison of the Indian Ocean TAO observations with the Mercator Ocean and
BLUElink systems. An Indian Ocean TAO Mooring observatory (http://www.pmel.noaa.gov/tao/disdel/disdel.html) will soon allow
monitoring the observed depth of the thermocline in the equatorial Indian Ocean, as it is already the case in the Pacific Ocean
(http://www.pmel.noaa.gov/tao/jsdisplay/ ). In the Indian Ocean, moorings are already available along 80.5°E and 90°E (Figure
3).
We compare the Mercator Ocean Sea Surface Temperature (SST) and Sea Surface Salinity (SSS) to the TAO Moorings SST
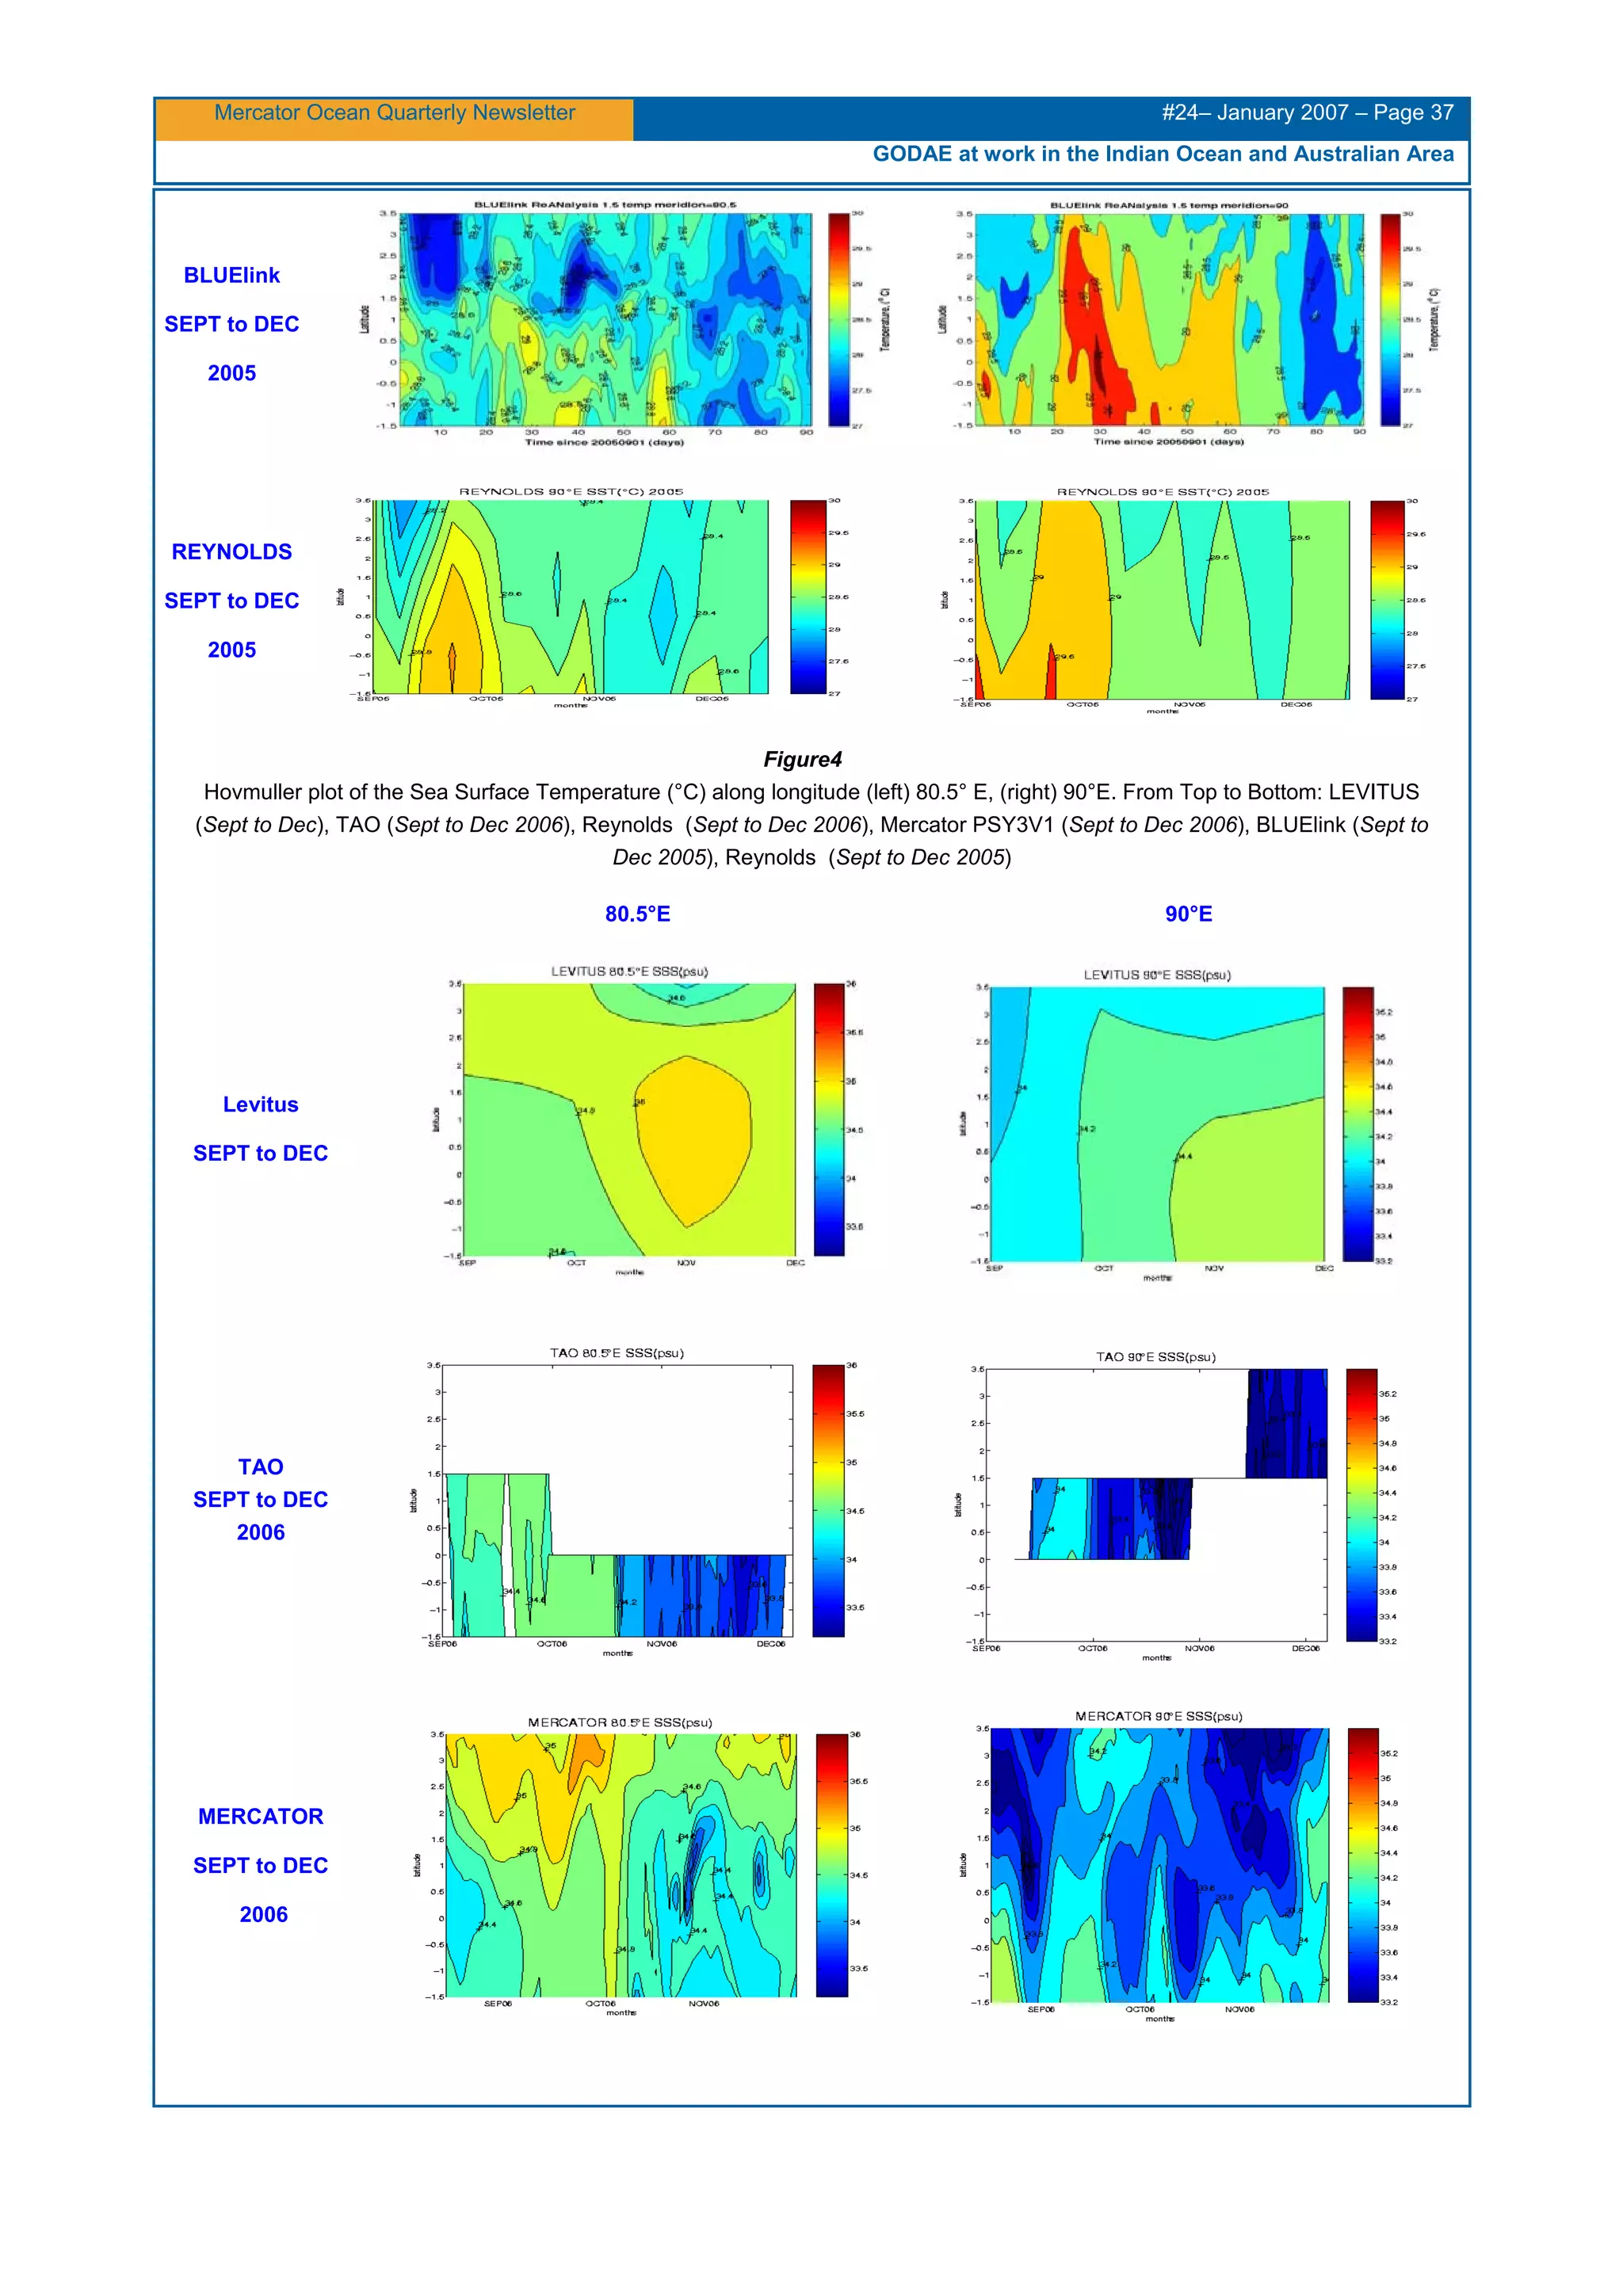
and SSS along 80.5°E and 90°E (Figures 4 and 5), from September to early December 2006. Reynolds weekly analyzed SST
(Reynolds et al. 2002) as well as Levitus SST (Levitus, 1998) are also shown for the same time period. BLUElink SST and SSS
are not shown for the time period September to early December 2006, but September to early December 2005, as the
reanalysis is not yet available for the end of 2006. They can be compared to the Reynolds weekly analyzed SST for the period
September to early December 2005. Further comparison of the 3 fields (Mercator Ocean, BLUElink, TAO observations) for the
same time period will take place when all 3 available for synchronous time period.
Figures 4 and 5 show that the SST and SSS at 80.5°E in the Mercator Ocean system is up to 1°C colder and 0.6 psu saltier
than observations (TAO and Reynolds). Such bias should be solved in the next version soon to be released of the global
Mercator Ocean system where Coriolis temperature and salinity profiles and Sea Surface Temperature will be assimilated, and
where Bulk formula fluxes will be applied with a GPCP
1
correction of the ECMWF precipitation fluxes. At 90°E however, SST
and SSS in the Mercator Ocean system are in very good agreement with observations. The BLUElink SSTs are in good
agreement with the Reynolds weekly analyses. Note that the BLUElink system, as explained in a companion paper (this issue),
does assimilate temperature and salinity profiles as well as satellite SST from AMSR-E. There are no data presented here to
compare the BLUElink SSS with. These comparisons highlight the large interannual variability in this region and particularly that
2006 was an anomalous year for both SST and SSS compared with 2005.
Third, we compare zonal velocities in the top 200 meters along the equator at 80.5°E from both Mercator Ocean and BLUElink
systems. Figure 6 shows hovmuller diagram of the zonal velocities in the top 200 meters along (0°N, 80.5°E) in observations for
the time period July 1993 to September 1994 [Reppin et al., 1999] and in the Mercator Ocean and BLUElink systems for the
time period January to May 2006. We note, in agreement with the observations, an alternation of surface Wyrtki Jets (WJ)
[Wyrtki, 1973] as a function of the seasons, reaching very similar amplitude of -0.8 m.s
-1
in February 2006, and reversing to 1.4
m.s
-1
in April-May 2006 in both Mercator Ocean and BLUElink systems. Further at depth, the Equatorial Under Current (EUC)
which is considered as an equatorial wave phenomenon rather than a current, located around the equatorial upper thermocline,
flows in the opposite direction than the surface WJ and can be westward or eastward. Between June 1993 and August 1994
[Reppin et al., 1999] (Figure 6, top panel), the monthly-mean zonal current shows an EUC between 50 and 150m from February
to May 1994 that disappeared, as expected, in June and reappeared in August at a shallower depth and weaker. Westward flow
was observed at the same time during summer 1993. In the Mercator Ocean and BLUElink systems (Figure 6, middle and
bottom panels), the EUC is located at a realistic depth (~100-120m). It reaches larger amplitude in the BLUElink (1 m.s
-1
in
March-April 2006) than in the Mercator Ocean system (0.6 m.s
-1
in March 2006).
1
Global Precipitation Climatology Project](https://image.slidesharecdn.com/lettre24en-150622093441-lva1-app6892/75/Mercator-Ocean-newsletter-24-35-2048.jpg)

![Mercator Ocean Quarterly Newsletter #24– January 2007 – Page 38
GODAE at work in the Indian Ocean and Australian Area
BLUElink
SEPT to DEC
2005
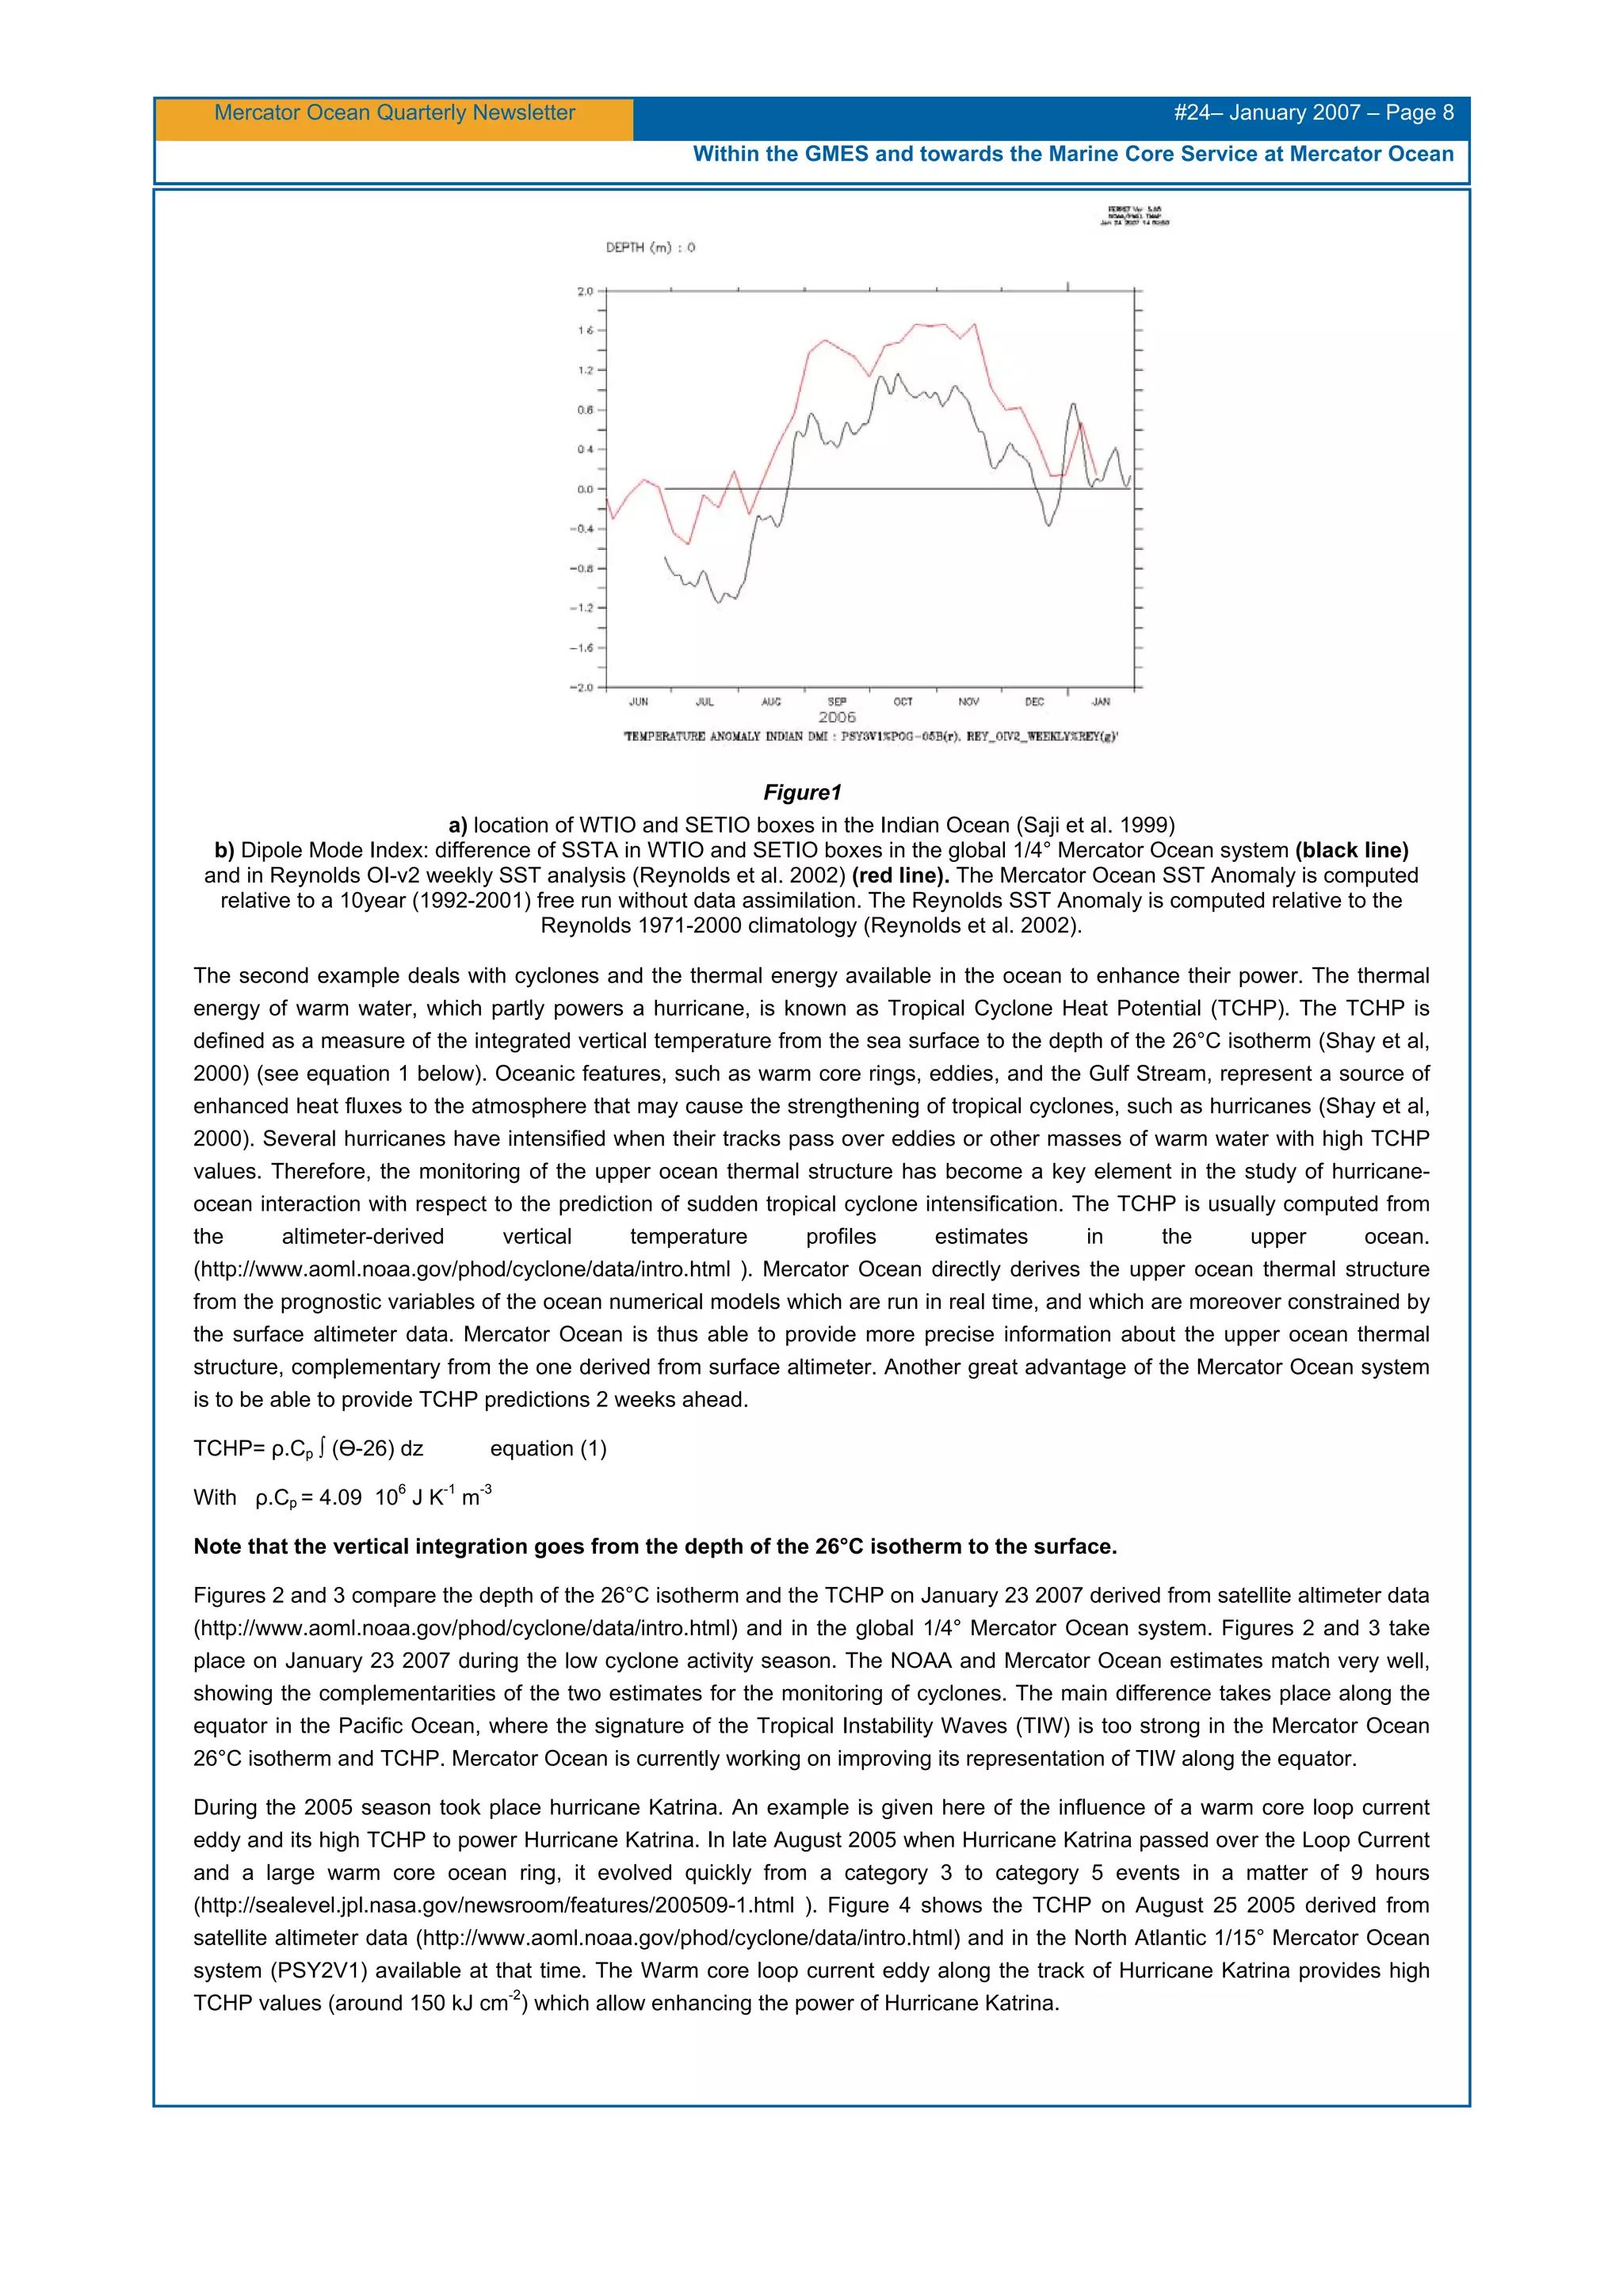
Figure5
Hovmuller plot of the Sea Surface Salinity (psu) (left) 80.5° E, (right) 90°E. From Top to Bottom: LEVITUS (Sept to Dec), TAO
(Sept to Dec 2006), MERCATOR PSY3V1 (Sept to Dec 2006), BLUElink (Sept to Dec 2005).
Figure 6
Time series: a) monthly-mean zonal current component (cm/s) in the upper 150m at 80.5°E in the Indian Ocean at the Equator,
measured by upward-looking ADCP [Reppin et al., 1999] from July 1993 to September 1994. b) Zonal current component (m/s)
in the upper 200m at 80.5°E in the Indian Ocean at the Equator, in Mercator Global PSY3V1 from January to July 2006. c)
Zonal current component (m/s) in the upper 200m at 80.5°E in the Indian Ocean at the Equator, in BLUElink system from
January to May 2006.](https://image.slidesharecdn.com/lettre24en-150622093441-lva1-app6892/75/Mercator-Ocean-newsletter-24-38-2048.jpg)


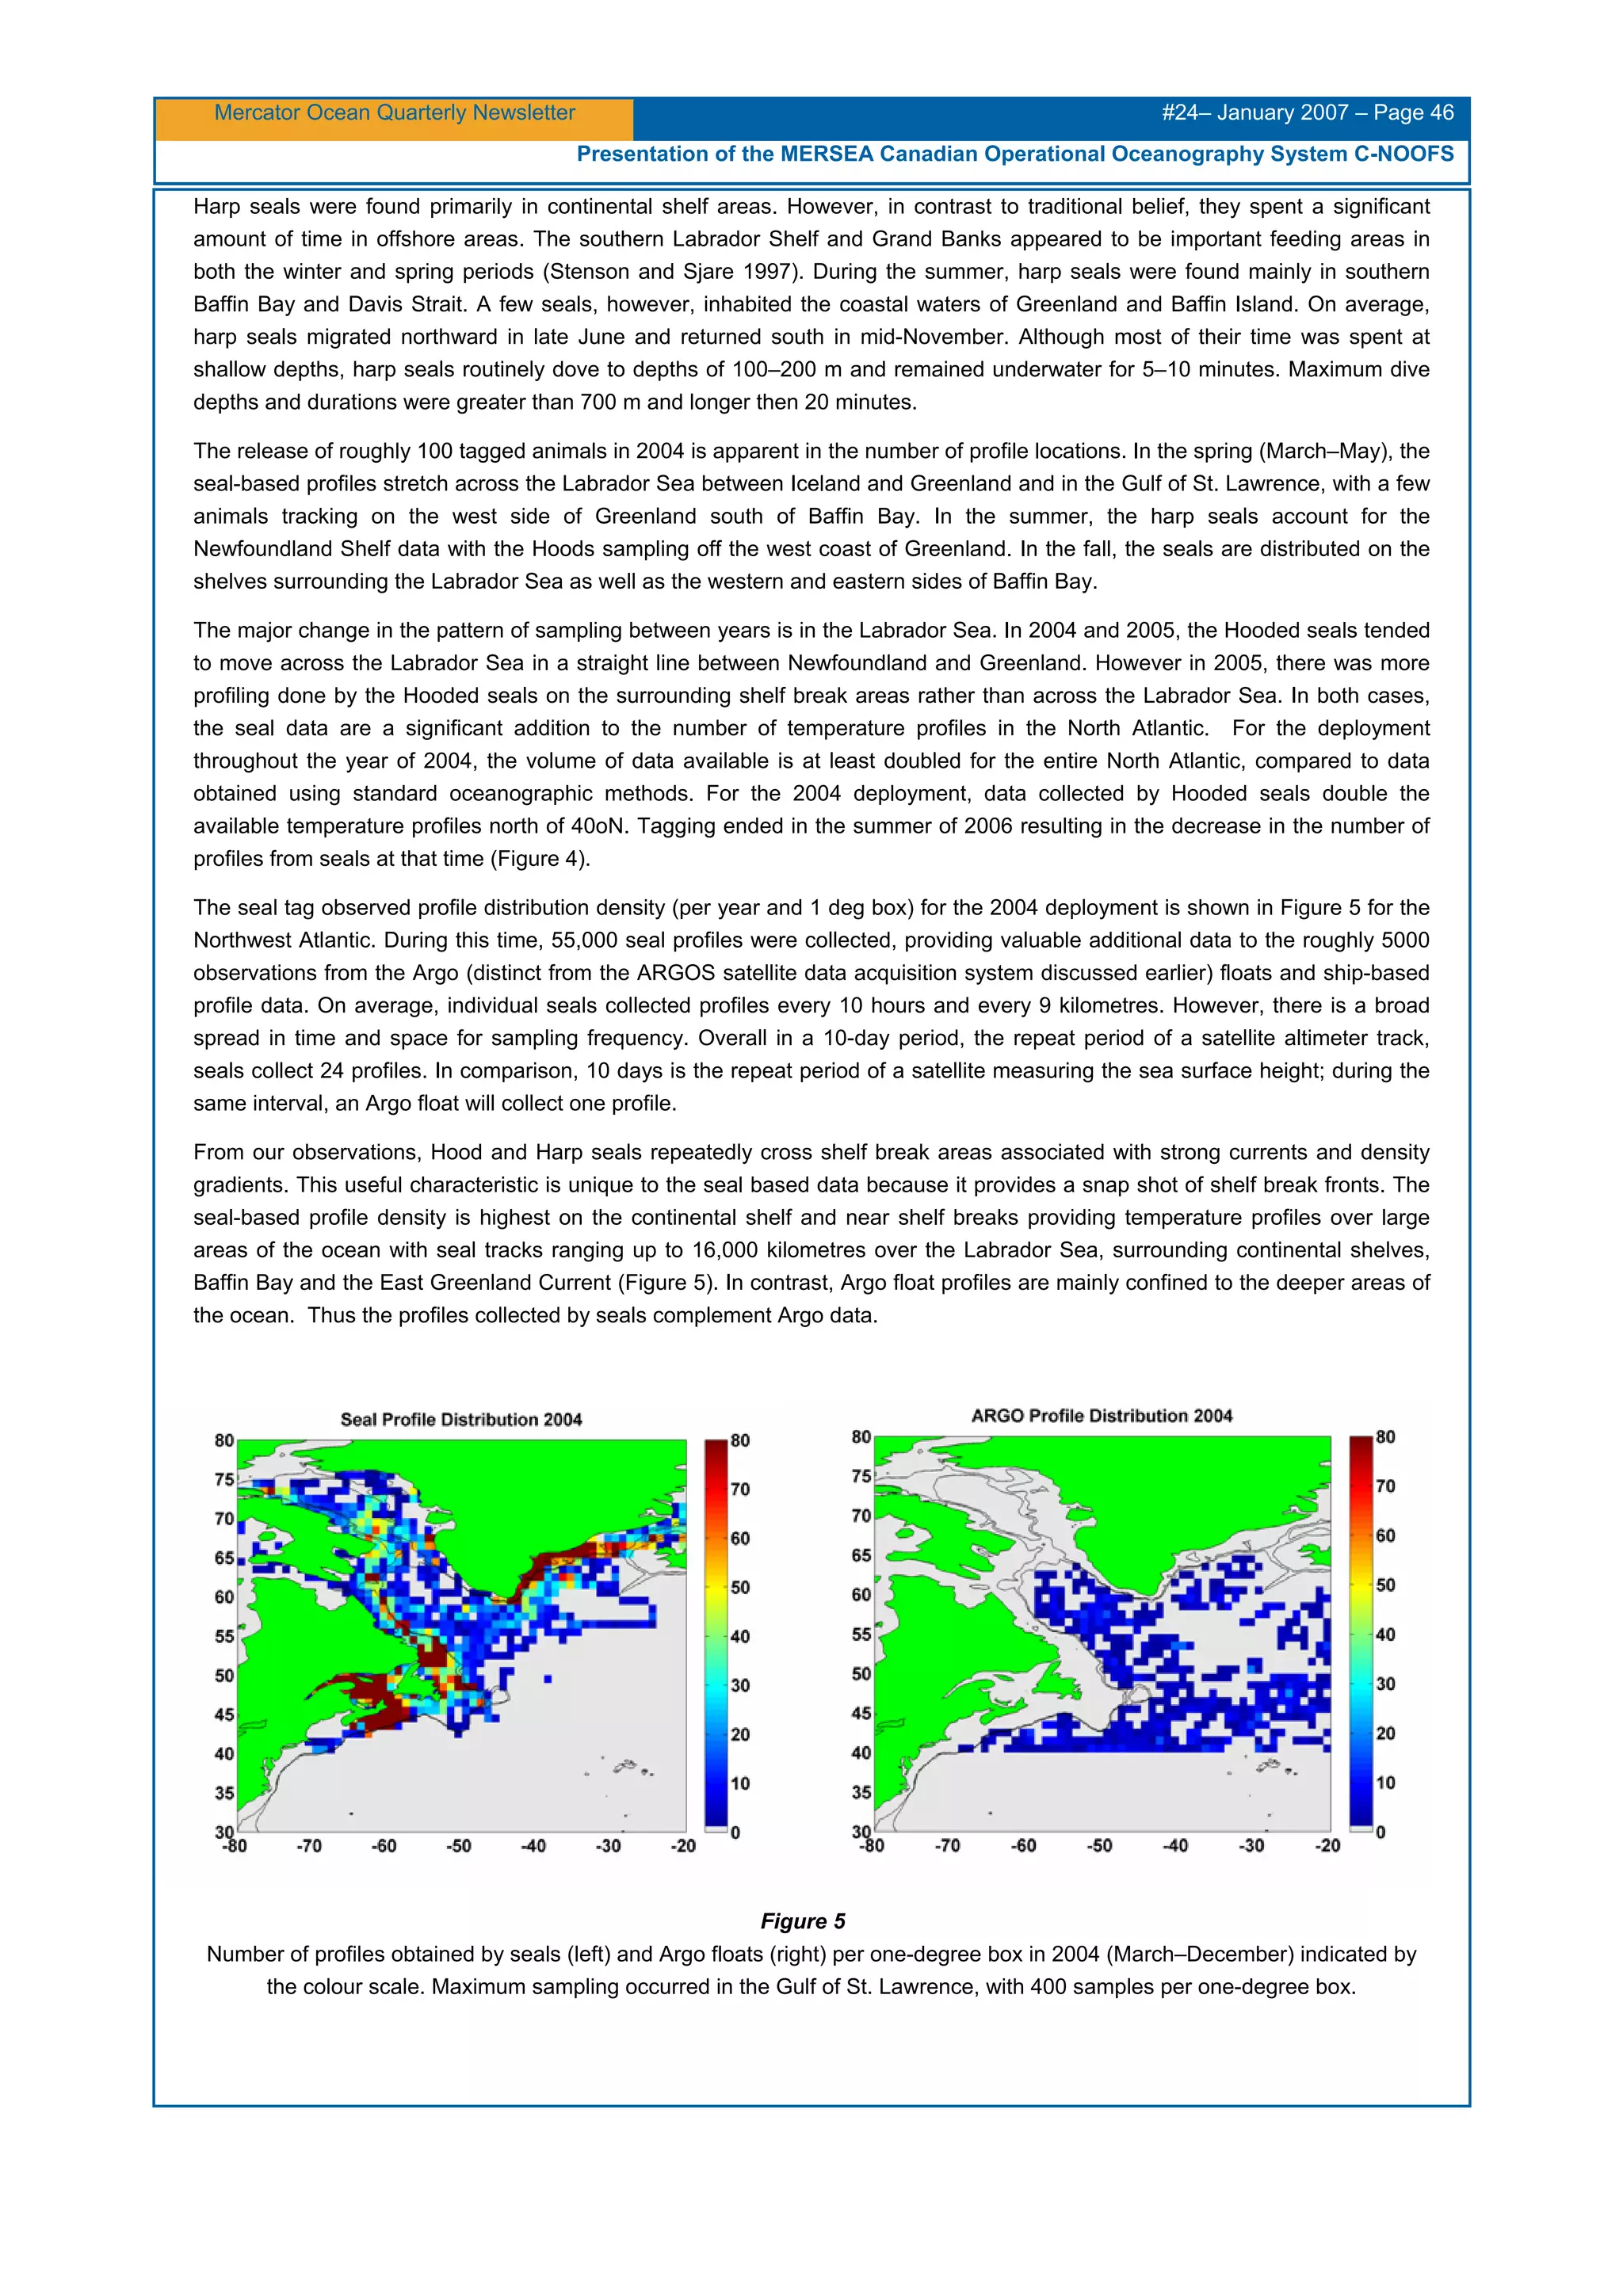


The January 2007 issue of the Mercator Ocean Quarterly Newsletter focuses on operational oceanography initiatives, particularly the European MERSEA and international GODAE programs as part of the GMES project. It features articles discussing advancements in ocean climate monitoring, forecasting systems, and marine core services, emphasizing collaboration among various oceanographic institutions and the importance of integrating data for improved ocean forecasting. The newsletter also outlines objectives for enhancing the MERSEA system's visibility and effectiveness in supporting various domains, from environmental management to offshore industries.


