SlideShare a Scribd company logo
1 of 50
Download to read offline
1
While most Argo floats are deployed by research vessels, some are also deployed by the sailing community, through ship-
based non-governmental organization or trans-oceanic races. It allows poorly sampled areas with no regular shipping to be
sampled. Sailors got also involved in oceanographic science activities. An example of float deployment is given here (see Poffa
et al., this issue) in the case of the 2015 Barcelona World Race where eight floats were successfully deployed in the Atlantic
Ocean between 24° and 44° south.
Credits: © Barcelona World Race
#52
Newsletter
QUARTERLY
Editorial – May 2015 – Special Issue jointly coordinated by
Mercator Ocean and Coriolis focusing on Ocean Observations
2#52-May 2015 -
Editorial – May 2015 – Special Issue jointly coordinated by Mercator
Ocean and Coriolis focusing on Ocean Observations
Greetings all,
Once a year in April, the Mercator Ocean Forecasting Center in Toulouse and the Coriolis Infrastructure in Brest publish a common newsletter. Papers
are dedicated to observations only.
• The first paper introducing this issue is presenting the Coriolis 2014-2020 framework which was renewed in 2014 in order to go on integrating in-situ
ocean observation infrastructure for operational oceanography and ocean/climate research.
• Next paper by Poffa et al. describes how some Argo floats are deployed by the sailing community, through ship-based non-governmental organiza-
tion or trans-oceanic races. It allows Argo floats to be deployed in poorly sampled areas where there is no regular shipping. Sailors got also involved
in oceanographic science activities. An example of float deployment is given in the case of the Barcelona World Race.
• Next paper by Pouliquen et al. describes the EURO-ARGO ERIC infrastructure which is now officially set-up since May 2014. The objective of the
Euro-Argo ERIC is to organize a long term European contribution to the international Argo array of profiling floats.
• Le Traon et al. are then presenting how the assessment of the impact of ARGO in Ocean models and satellite validation is conducted in the context
of E-AIMS (Euro-Argo improvements for the GMES/Copernicus Marine Service) FP7 project. Observing System Evaluations and Observing System
Simulation Experiments have been conducted to quantify the contribution of Argo to constrain global and regional monitoring and forecasting centers
and validate satellite observations. Recommendations for the new phase of Argo are also elaborated.
• Kolodziejczyk et al. follow with the presentation of the complementarity of ARGO and SMOS Sea Surface Salinity (SSS) observations to help moni-
toring SSS variability from basin to meso scale. Using a 4-year time-series of SMOS SSS data and the global Argo array of in situ measurements, a
statistical approach and an optimal interpolation method are used to characterize biases and reduce noises. Results are promising and show strong
complementarity between SMOS and Argo data.
• Herbert et al. then describe Shipboard Acoustic Doppler Current Profilers (SADCP) observations which are carried out in the Tropical Atlantic during
yearly cruises in the framework of the PIRATA program. The present note displays the SADCP data processing methodology applied for 8 PIRATA
cruises by using CASCADE software.
• Cravatte et al. follow with a paper presenting the new international TPOS2020 project (2014-2020). The project objective is to build a renewed,
integrated, internationally-coordinated and sustainable observing system in the Tropical Pacific, meeting both the needs of climate research and
operational forecasting systems and learning lessons from the great success-and finally partial collapse- of the TAO/TRITON array.
• Saout-Grit et al. next present an updated procedure for CTD-oxygen calibration along with new data processing that was applied to hydrographic
cruise “BIFURCATION” (September 2012) in the Coral Sea. They describe the content and acquisition models of hydrological and chemical data that
are used for the calibration, the post-cruise calibration method and the calibration results.
• Dussurget et al. is showing the recent improvement in surface current estimation from satellite altimetry, contributing to a better understanding of
the Sea Surface Salinity processes in the Subtropical North Atlantic in the context of the SPURS experiment.
• Finally, Mortier et al. are presenting the GROOM project and the Glider European Research Infrastructure. During the last three years, the GROOM
community has studied the feasibility and advantages of a European Research Infrastructure for gliders. The design study has proposed operational
contours for a future distributed Glider (dedicated) European Research Infrastructure (GERI).
We will meet again soon with an issue dedicated to the various achievements of the MyOcean projects now handing over to the EU Copernicus Marine
Service. Moreover, we will meet again next year in April 2016 for a new jointly coordinated Newsletter between Mercator Ocean and Coriolis. We wish
you a pleasant reading,
Laurence Crosnier and Sylvie Pouliquen, Editors.
Mercator Ocean—Coriolis Quarterly Newsletter - Special Issue
Mercator Ocean – Corolis Special Issue
3#52-May 2015 -
Contents:
1.CORIOLIS 2014-2020: AN INTEGRATED IN-SITU OBSERVATION INFRASTRUCTURE FOR OPERATIONAL
OCEANOGRAPHY AND OCEAN/CLIMATE RESEARCH ................................................................................................................. 4
By P-Y. Le Traon
2. DEPLOYING ARGO FLOATS IN THE BARCELONA WORLD RACE ...................................................................................... 5
By N. Poffa , N. Lebreton , M. Kramp.
3. THE EURO-ARGO ERIC OFFICIALLY SET UP ......................................................................................................................... 8
By S. Pouliquen, P-Y. Le Traon and Euro-Argo Members and Observers
4. ASSESSESMENT OF THE IMPACT OF ARGO IN OCEAN MODELS AND SATELLITE
VALIDATION FROM E-AIMS PROJECT ...................................................................................................................................... 11
By P.Y. Le Traon, E. Remy, J. Ballabrera-Poy
5. ARGO AND SMOS SSS COMBINATION HELPS MONITORING SSS VARIABILITY
FROM BASIN SCALE TO MESOSCALE ..................................................................................................................................... 16
By . N. Kolodziejczyk, J. Boutin,
O. Hernandez, A. Sommer, G. Reverdin, S. Marchand, N. Martin,J.-L. Vergely, and X. Yin
6. FRENCH PIRATA CRUISES S-ADCP DATA PROCESSING ................................................................................................... 22
By G. Herbert, C. Kermabon, J. Grelet, B. Bourlès
7. TPOS2020: TROPICAL PACIFIC OBSERVING SYSTEM FOR 2020 ..................................................................................... 27
By S. Cravatte, A. Ganachaud, B. Dewitte, F. Hernandez
8. CALIBRATION OF CTD OXYGEN DATA COLLECTED IN THE CORAL SEA
DURING THE 2012 BIFURCATION CRUISE ............................................................................................................................... 34
By Carole Saout-Grit, Alexandre Ganachaud,
Christophe Maes, Luc Finot, Léocadie Jamet, François Baurand and Jacques Grelet
9. SURFACE CURRENT FIELD IMPROVEMENTS- REGIONAL ALTIMETRY FOR SPURS ..................................................... 39
By R. Dussurget, S. Mulet, M-I. Pujol, A. Sommer, N. Kolodziejczyk, G. Reverdin, M.-H. Rio
10. THE GROOM PROJECT AND THE GLIDER EUROPEAN RESEARCH INFRASTRUCTURE ............................................ 45
By Laurent Mortier, Pierre Testor, Victor Turpin
Notebook ....................................................................................................................................................................................... 50
Mercator Ocean—Coriolis Quarterly Newsletter - Special Issue
Coriolis 2014-2020: an integrated in-situ ocean observation
infrastructure for operational oceanography and ocean/climate research
4#52-May 2015 -
CORIOLIS 2014-2020: AN INTEGRATED IN-SITU OCEAN OBSERVA-
TION INFRASTRUCTURE FOR OPERATIONAL OCEANOGRAPHY AND
OCEAN/CLIMATE RESEARCH
P.Y. Le Traon, Ifremer and Mercator Océan
Executive Secretary of the Coriolis 2014-2020 governing board
The Coriolis structure gathers efforts of seven French institutes (CNES, CNRS,
IFREMER, IPEV, IRD, Météo-France, SHOM) to organize the in-situ compo-
nent of the French operational oceanography infrastructure. The objective is
to organize the data acquisition and real-time/delayed mode data processing
of in-situ measurements required for operational oceanography and ocean/
climate research. Coriolis is focused on a limited number of physical and bio-
geochemical parameters that are acquired systematically and in real time or
slightly delayed mode. Coriolis follows a fully open data policy.
The framework of collaboration for Coriolis was renewed in 2014 and now cov-
ers the time period of 2014 up to 2020. By signing this new agreement, the sev-
en directors of French institutes have clearly stated their willingness to sustain
and consolidate further the Coriolis in-situ infrastructure. The new framework
agreement strengthens the links between research and operational oceanog-
raphy. The scope is also extended to integrate the main French contributions
to the global and regional in-situ observing systems: Argo, gliders, research
vessels, ship of opportunities, drifting buoys, marine mammals, tidal networks and
high frequency coastal observatories. These networks are organized by the different institutes with a pooling of resources for at sea operation, data
processing and data dissemination and RD activities. This new framework agreement provides a better integration of the French contributions to the
Global Ocean Observing System (GOOS/JCOMM). It also confirms and extends the European mission of Coriolis, in particular, in the framework of
Euro-Argo, Emodnet and the Copernicus Marine Service.
Coriolis 2014-2020 also features a strengthened organization and governance. A Steering Committee with representatives of all networks and of the
three transverse components (at sea operation, data center, RD) is in charge of the scientific and technical management. It reports to a Governing
Board (directors of institutes). A Scientific Council (shared with Mercator Ocean) provides the required scientific guidance, in particular, for issues
related to the integration with modelling and data assimilation.
Mercator Ocean—Coriolis Quarterly Newsletter - Special Issue
Deploying ARGO floats in the Barcelona World Race
5#52-May 2015 -
DEPLOYING ARGO FLOATS IN THE BARCELONA WORLD RACE
By N. Poffa (1)
, N. Lebreton (2)
, M. Kramp (3)
1
IFREMER, Brest, France
2
SHOM, Brest, France
3
JCOMMOPS, Brest, France
Abstract
While most Argo floats are naturally deployed by research vessels, a growing number of float operations has been allocated to the sailing community,
through ship-based non-governmental organization NGOs or trans-oceanic races in the last few years. The aim is to establish win-win partnerships,
with Argo floats being deployed in poorly sampled areas without regular shipping, and to get sailors genuinely involved in oceanographic science
activities. In the case of big events, it is also an opportunity for Argo to benefit from broad media coverage, and for the organizers, a chance to display
a scientific impact of their projects. Thanks to joint forces of The Coriolis Deployment Team and the IOC-UNESCO/WMO support centre JCOMMOPS,
both hosted by Ifremer in Brest, the beginning of 2015 saw probably the so far largest event of that kind, with the deployment of one Argo float by all of
the eight crews participating in the Barcelona World Race. In coordination with Coriolis and JCOMMOPS, the race management gave the green light
for “Argo day” on the 23rd
of January, and eight floats were successfully deployed in the Atlantic Ocean between 24° and 44° south.
Meeting the challenges of float deployments in a round-the-world race
The history of Coriolis Argo floats with sailing races goes back to 2011-2012 when Stève Ravussin and Michel Desjoyeaux deployed Argo floats from their
racing yachts on the way to the departure of the Krys Ocean Race from New York to Brest. Four floats were also deployed the same year by a racing yacht
between the Caribbean and Europe. It has now however been a world’s first with all participants of the 2015 Barcelona World Race taking a float onboard
per official racing instructions, with a strong cooperation put into place between the race organizer (Barcelona Foundation for Ocean Sailing, FNOB)
and IOC-UNESCO/JCOMMOPS, supported by a number of scientific research institutions. It is a very strong commitment from the race and hopefully
marks a milestone in “sailing and science” partnerships. Beyond operational needs, it offers the Argo program also an unprecedented outreach potential.
After first successful onboard tests, the project was presented at an international press conference at United Nations UN headquarters in New York in
summer 2014, and training was given to the skippers in Barcelona before the departure in December 2014. Most sailors were happy to contribute to
an oceanographic science program, but they were less keen to embark almost 20kg of additional weight on their yachts; for fair conditions in terms of
competition, it was thus agreed to deploy all floats on a carefully chosen “Argo day” (instead of giving a deployment area), allowing for deployments in
data sparse areas of the South Atlantic.
Apart from one yacht which dismasted after 15 days, abandoned the race and released the float therefore earlier (as per agreement for such a scenario),
the other competitors were given the go-ahead 23 days after the departure from Barcelona, when the weather conditions allowed a safe launch and the
leading boats were hitting the 40°S latitude. During those 23 days, the floats (as the crews!) were exposed to some intense sailing, meaning a quite rough
treatment in terms of shocks and vibrations. The deployment itself was also challenging for some instruments and skippers, who did not reduce the boat
speed to the recommended 2 knots to put the floats at sea and instead deployed at impressive 16 knots of boat speed. Despite all that, all floats have
entered the operational mode shortly after the deployment and at the time of writing, the eight floats, all of the NKE Arvor Light type, have successfully
accomplished at least eight 10-day cycles and performed eight 2000m CTD profiles.
	
  
Figure 1: Boat and float positions at Argo day (courtesy of Geovoile and www.barcelonaworldrace.org)
Mercator Ocean—Coriolis Quarterly Newsletter - Special Issue
Deploying ARGO floats in the Barcelona World Race
6#52-May 2015 -
Argo visibility through supportive projects
As global climate change has become a vastly discussed topic, public awareness has led to a significant interest in the ways of climate monitoring
related systems such as Argo floats. The sailing community being at the forefront of anything that has to do with meteorology and ocean is usually
very concerned about research and applied science in those fields. Both sailors and followers of an event such as a round-the-world race are thus
a very appreciative audience for a science program linked with the sportive event. Conrad Colman, skipper on Spirit of Hungary put it that way: “As
sailors we are naturally hugely affected by the changes in the weather so it feels great to be able to contribute to its greater understanding during our
race”, and Anna Corbella, skipper of GAES Centros Auditivos with Gerard Marín, added that “it means a lot to us both to do what we can to help the
scientific community while we are sailing this race. [...] It makes us happy to help. We will make a little ceremony to throw the beacon in the water”.
The crews did good jobs by posting pictures, videos and comments of their float launch shortly after the operation.
Apart from Argo, Coriolis, UNESCO and race websites, the related press release was largely quoted and dozens of articles were published following
Argo day, not only in the sailing and the science related press, but also in mainstream media and social networks. It is probably appropriate to state
that such a level of communication on Argo, including explanation of the program, the network and the floats themselves was never achieved in such
a short period of time. This is largely due to the characteristics of modern ocean racing, where communication is part of the challenge, and where
skippers have almost become public relations PR professionals, being able to deliver quality images or video footage as well as live comments in real
time. The race website has also proven to be particularly efficient, providing a lot of quality material for the press and the public. As part of the Argo
project in the 2015 Barcelona World Race, a partnership between JCOMMOPS and the provider of the mapping tool, Geovoile, was set up in order
to display the latest information on these particular Argo floats directly on the race-tracker, together with the yachts (Fig. 1). A simple click on a float
gives the user direct access to the corresponding float information from the JCOMMOPS web portal. On the other hand, a special page was set up
on the Coriolis Data Center website to follow the floats deployed during the race and to access data. All those efforts coordinated at different levels
(Skippers, Coriolis Deployment Team and Data Center, JCOMMOPS, Race Management, Euro Argo...) allowed for a successful operation that will be
repeated, and also represents an interesting link to the next edition in 4 years. Follow-up operations have already started, and the Volvo Ocean Race
has in March also deployed autonomous oceanographic instruments on the difficult Cape Horn leg from all participating yachts, showing the potential
of such partnerships across different ocean observing programs.
Figure 2: Floats deployments on Argo day onboard (from left to right) One Planet,One Ocean/Pharmaton, GAES Centros Auditivos and Spirit Of Hungary
Mercator Ocean—Coriolis Quarterly Newsletter - Special Issue
Deploying ARGO floats in the Barcelona World Race
7#52-May 2015 -
Beside the racing community, JCOMMOPS and Coriolis also
organize deployments with other sailing ships operating in un-
dersampled zones, including traditional tall ships and expedi-
tion vessels, but also smaller pleasure yachts if they are or-
ganized in NGOs. Without such a NGO framework, efforts for
logistics mostly exceed human resources on the science side.
Those collaborations help informing the broader public on
operational oceanography in general, and on Argo in particu-
lar. In this perspective, the Barcelona World Race was also
a perfect way to kick off an educational project with 9-year
old children from a school in Brest, who met the local skipper
Bernard Stamm together with coordinators from Coriolis and
JCOMMOPS before his departure to Barcelona. The children
then “adopted” his float, and a relationship was maintained
during the entire race and beyond in a one year long “sailing
and science” project, including a visit of the Ifremer center in
Brest during a week of Argo qualification tests, and a meeting
with Bernard Stamm back from winning the 2015 edition.
Conclusion
The deployment of Argo floats in the 2015 Barcelona World Race was challenging in terms of technical constraints on the instrumentation side, but
also in terms of logistics for the coordinators, and eventually the deployment operation itself for the skippers, who at the same time participated in a
90 days nonstop -and only double-handed- circumnavigation. It proved to be very successful in all aspects; all floats were deployed and work cor-
rectly, and in addition to the operational point of view, it was also an outstanding way for Argo to send a message to the outside world. The feedback
from the involved crews is very positive. Given that in many data sparse areas, in particular in the Southern Ocean, racing yachts are often the only
available and recurrent volunteer ships, a sound partnership with this community is considered to be of high value and thus continuously enhanced
by the operational teams on the scientific side.
	
  
Figure 4: Bernard Stamm and Jean Le Cam with their Argo
float signed by pupils from Jacques Prévert School in Brest
(photo left: Yvon Jezequel / right: Team Poujoulat)
	
  
Figure 3: One Planet,One Ocean/Pharmaton skipped by Spaniards Aleix Gelabert
and Didac Costa in BWR 2015
	
  
Mercator Ocean—Coriolis Quarterly Newsletter - Special Issue
The EURO-ARGO ERIC officially set up
8#52-May 2015 -
THE EURO-ARGO ERIC OFFICIALLY SET UP
By S. Pouliquen(1)
, P-Y. Le Traon(2)
and Euro-Argo Members and Observers(3)
,
1
Euro-Argo ERIC, Plouzané, France
2
IFREMER, Plouzané, France
3
http://www.euro-argo.eu/About-us/The-Partners
Abstract
In May 2014, the Euro-Argo research infrastructure became a new European legal entity (Euro-Argo ERIC). The objective of the Euro-Argo ERIC is
to organize a long term European contribution to the international Argo array of profiling floats. Argo is now the most important global in-situ observing
system required to observe and understand the role of the ocean on the earth climate. Euro-Argo is also an essential component of the in-situ infra-
structure required for the Copernicus Marine Environmental Monitoring Service (operational oceanography). Euro-Argo will thus develop European
contribution to the Global Ocean Observing System (GOOS) and the Global Climate Observing System (GCOS).
INTRODUCTION
The Argo system (Freeland et al. 2010) is based on an array of profiling floats which measure every 10 days temperature and salinity throughout the
deep global oceans, down to 2,000 meters and deliver data both in real time for operational users and, after careful scientific quality control, for climate
change research and monitoring. Argo data policy is fully open and guarantees a free access of the data to all interested users. Argo is now the major,
and only systematic, source of information and data over the ocean’s interior. Argo aims to establish a global array of in-situ measurements integrated
with other elements of the climate observing system (in particular satellite observations) to:
• detect climate variability from seasonal to decadal scales and provide long-term observations of climate change in the oceans.
• provide data to constrain global and regional ocean analysis and forecasting models
• provide data to initialize seasonal and decadal forecasting ocean/atmosphere coupled models and to validate climate models.
• provide information necessary for the calibration and validation of satellite data.
The EURO-ARGO ERIC
The Euro-Argo research infrastructure organizes and federates European contribution to Argo (www.euro-argo.eu); it is part of the European ESFRI
roadmap on large research infrastructures. Euro-Argo carried out from January 2008 to June 2011 a preparatory phase project, funded through the
EU 7th
Framework Research Program, whose main outcome was to agree on the legal and governance framework (Euro-Argo ERIC) under which
to establish the research infrastructure. Ministries from 9 European countries (Finland, France, Germany, Italy, Netherlands, Greece, UK, Norway,
Poland) have agreed to form this new legal European entity to organize a long-term European contribution to Argo. It was set up by the Commission
Implementing Decision (2014/261/EU) of May 5, 2014.
The Euro-Argo Research Infrastructure (RI) is a distributed facility (see http://
www.euro-argo.eu). The Euro-Argo infrastructure is made up of a central infra-
structure (C-RI) based in France (Ifremer, Brest) which is owned and controlled by
the Euro-Argo ERIC and distributed national facilities. The Euro-Argo ERIC and
its governance structure (Council, Management Board and Science and Techno-
logical Advisory Group) was set up at the creation of the ERIC. It was inaugurated
on the 17th
July in Brussels, hosted by the French Permanent Representation in
Brussels, in presence of representatives of the European Commission and the
Ministries of the signatory nations as well as the European institutes involved in
Argo.
The distributed national facilities operate with direct national re-
sources. As part of the Euro-Argo research infrastructure, they
agree to a multi-annual commitment of resources (in particular
in terms of floats to be deployed and for the data system), and
to coordinate their activities through the Euro-Argo ERIC. The
Euro Argo ERIC may subcontract some of its activities to the na-
tional facilities who have the relevant expertise (e.g. data man-
agement and quality control, float deployment), and according
to their areas of responsibility.
Figure 1: The EURO-ARGO distributed Research Infrastructure
Figure 2: Inauguration
Mercator Ocean—Coriolis Quarterly Newsletter - Special Issue
The EURO-ARGO ERIC officially set up
9#52-May 2015 -
EURO-ARGO ERIC role and development
The Euro-Argo ERIC priorities are first to maintain and consolidate the global array and regional coverage for European seas by increasing European
contribution from 150-200 floats to 250 floats/year and consolidating the data processing system. Secondly the Euro-Argo ERIC will prepare the
evolution of Argo to address new scientific and operational challenges and in particular start implementing the new phase of Argo (biogeochemistry,
deep ocean, Arctic).
The overall objectives of the Euro-Argo ERIC are:
• to provide, deploy and operate an array of around 800 floats contributing to the global array (a European contribution of ¼ of the global array);
• to provide enhanced coverage in the European regional seas;
• to provide quality controlled data and access to the data sets and data products to the research (climate and oceanography) and operational
oceanography (e.g. Copernicus Marine Environmental Monitoring Service (CMEMS)) communities;
• to prepare the next phase of Argo with an extension to biogeochemical variables, to the deep ocean and the polar regions.
These data will be made freely available as a European contribution to the international Argo program. The Euro-Argo ERIC will organize interfaces
with operational users and, in particular, with the Copernicus Marine Environmental Monitoring Service and with the ocean and climate change re-
search communities.
The Euro-Argo ERIC is developing in two phases. In the ramping up phase (2014-mid 2015) the central entity (i.e. the Euro-Argo ERIC) works with
a reduced budget funded by the Members and Observers. This budget allows to fund a programme manager a project assistant at 25% and one full
time position (project scientist), and to provide basic support to the Euro-Argo RI (e.g. organization of workshops, maintenance of WWW sites includ-
ing educational WWW site).
In the second phase (mid-2015-onwards) we expect a significant development of the Euro-Argo ERIC up to five persons. In line with the European
nature of the infrastructure, a direct EU funding will be set up through the EMFF (European Maritime and Fisheries Fund) to complement national
contributions and to ensure that Euro-Argo fulfils its objectives: deploying 250 floats/year (i.e. 25% of the overall international effort), providing high
quality observations for ocean and climate research and the Copernicus Marine Environmental Monitoring Service, preparing the European contribu-
tion to the next phase of Argo.
Benefit for the European community
Thanks to a stronger European coordination of float deploy-
ments EURO-ARGO ERIC will ensure that certain areas are
not overpopulated at the expense of other regions or the global
array. Euro-Argo will deliver a stronger and more coherent Eu-
ropean contribution to float technology development, with par-
ticular emphasis on European needs (e.g. sampling under ice,
bio-geochemical sensors) leading to improved capability, perfor-
mance and lifetime.
The two European Argo data processing centres (Coriolis and BODC) will be strengthen to (i) ensure they are able to process all European floats and
deliver the data to users, and (ii) ensure that Europe is able to fulfil its data processing commitments to the global programme (Coriolis GDAC, North
Atlantic and Southern Ocean Regional Centres).
Euro-Argo will provide a mechanism for developing consistent
inputs and a more concerted European voice into the interna-
tional Argo programme, resulting in a stronger European influ-
ence on how Argo develops in the future. It will also provide the
means to sustain important outreach activities (web-site, bro-
chures, educational materials etc.) needed to explain to school
children and the general public the importance of observations
from the oceans towards dealing with climate change and other
environmental issues.


Figure 3:
In blue: Euro-Argo RI contribution
to Argo (Jan 2015)
Figure 4: About one hundred scientists met at Centre Ifremer
Bretagne from 16th to 20th March 2015 for an “Argo week”.
Mercator Ocean—Coriolis Quarterly Newsletter - Special Issue
The EURO-ARGO ERIC officially set up
10#52-May 2015 -
Dual Use: Research and Operational Oceanography
The oceans have a fundamental influence on our climate and weather, both of which are affected by changes in the currents and heat content of the
ocean. Argo is a unique system to monitor heat and salt transport and storage, ocean circulation and global overturning changes and to understand
the ability of the ocean to absorb excess CO2 from the atmosphere. Long term, global and high quality ocean observations are needed to understand
the role of the ocean on the earth’s climate and to predict the evolution of our weather and climate. Concerns about the lack of observations of the
key factors that influence the earth’s climate led governments to form the Global Earth Observation System of Systems (GEOSS) and, in Europe, the
Earth observation program Copernicus and the European Marine Observation and Data Network (EMODnet) marine data initiative.
Argo is the first-ever global, in-situ ocean-observing network in the history of oceanography, providing an essential complement to satellite systems.
Argo is a unique system to monitor heat and salt transport and storage, ocean circulation and global overturning changes and to understand the ability
of the ocean to absorb excess heat from the atmosphere. One of Argo’s most important contributions so far is a huge improvement in the estimation of
heat stored by the oceans - a key factor to gauge global warming and gain a better understanding of the mechanisms behind rising sea level. Argo will
be critical for developing reliable seasonal to decadal climate predictions. Argo has brought remarkable advances in ocean forecasting capability and
is the single most important in-situ observing system for the Copernicus Marine Environmental Monitoring Service. It provides essential data in near
real time to constrain global and regional CMEMS monitoring and forecasting centers. Without Argo, these centers will not be sufficiently constrained
and will not be able to serve several key applications.
The development of the Euro-Argo ERIC, we will strengthen European contribution to Argo and contribute to a better coverage of the Global Ocean,
Atlantic Ocean and European Seas. Argo float deployed and processed by Euro-Argo will directly feed the EMODnet data portals, the Copernicus
Marine Environment Monitoring Service and their users. Thanks to the EU funding, the Euro-Argo ERIC jointly with its partners will be able to dem-
onstrate that it:
• is able to manage a European Contribution to Argo and coordinate its implementation in coherence with the Euro-Argo and international partners.
This It will ensure that certain areas are not overpopulated at the expense of others or the global array,
• provides a central capability for float testing and preparation (e.g. mission programming, installation of lithium batteries) and storage,
• provides enhanced at sea monitoring of the European fleet that will lead to an improvement of the fleet behavior with earlier detection of anomalies,
• strengthens the European Argo data processing centers so that they are (i) able to process all European floats and ensure the data are delivered
to users, and (ii) ensure that Europe is able to fulfil its data processing commitments to the global program,
• improves the data management system and in particular the delayed mode data for research community,
• provides the means to outreach activities (web-site, brochures) needed to explain the importance of observations from the oceans towards dealing
with climate change and other environmental issues,
• is able to extend float coverage into the marginal seas such as Mediterranean and Black Seas and also Nordic Seas and Arctic Ocean, regions
which have a significant impact on the Atlantic circulation and climate change impacting Western Europe.
Maintaining observations in international waters over the long term is challenging. Frequently monitoring begins as part of a research project but once
the concept is proven it can no longer be considered as research and be supported by national or EU research budgets. Furthermore, it is difficult to
justify one Member State bearing the costs of an infrastructure that does not principally benefit its own citizens but rather serves the interests of all
Member States. The Euro-Argo ERIC will demonstrate in the coming years that it is able to manage a direct EU contribution to the international Argo.
Future extensions
Finally, Euro-Argo has set up the following priorities for the next five years
• Contribute to the global array and sampling of European regional seas. and Improve European coordination.
• Work with DG MARE, Copernicus and Emodnet to set up a long term (7-year) EU funding for Euro-Argo
• Maximise the relevant knowledge of the Seas and Oceans, e.g. their role in a changing climate (towards deeper measurements).
• Continue working with the user communities Develop /extend the user base. Education and outreach
• Maintain strong links with Copernicus and Emodnet.
• Prepare high quality delayed mode data sets required by ocean and climate change research.
• Improving float technology (e.g. extend life time, new sensors) and interactions with float manufacturers.
• Prepare the implementation of the new phase of Argo at European level:
deep ocean, biogeochemistry and Arctic.
Pilot projects, evolution of national roadmaps and new agreements at European level.
• Integration of Euro-Argo with other marine research infrastructures: towards an European Ocean Observing
References
Freeland, H.  Co-Authors (2010). “Argo - A Decade of Progress” in Proceedings of OceanObs’09: (http://dx.doi.org/10.5270/OceanObs09.cwp.32)
Mercator Ocean—Coriolis Quarterly Newsletter - Special Issue
Assessesment of the impact of ARGO in ocean models and satellite validation from E-AIMS project
11#52-May 2015 -
ASSESSESMENT OF THE IMPACT OF ARGO IN OCEAN MODELS
AND SATELLITE VALIDATION FROM E-AIMS PROJECT
By P.Y. Le Traon (1)
, E. Remy (2),
J. Ballabrera-Poy (3)
,
1
Ifremer and Mercator Ocean, Ramonville St. Agne, France
2
Mercator Océan, Ramonville St. Agne, France
3
ICM/CSIC, Barcelona
Abstract
The main objective of the E-AIMS (Euro-Argo improvements for the GMES/Copernicus Marine Service) FP7 project is to conduct RD activities on
Argo float technology, Argo data centers and the design of the new phase of Argo (improved coverage, deep ocean, biogeochemical sensors, polar re-
gions) to better answer existing and future needs of the Copernicus Marine Service. Observing System Evaluations and Observing System Simulation
Experiments have been, in particular, conducted to quantify the contribution of Argo to constrain global and regional monitoring and forecasting cent-
ers and validate satellite observations. Recommendations for the new phase of Argo are also elaborated. A summary of these results is provided here.
Context: the Copernicus Marine Service, Argo and Euro-Argo
The Copernicus Marine Service through its MyOcean projects has set up a pan-European service for ocean monitoring and forecasting over the global
ocean and European seas. In-situ and satellite observations are routinely assimilated in ocean models to provide in real time or in delayed mode (re-
analyses) integrated descriptions and short-term forecasts of the ocean physical and biogeochemical state. These core products serve a wide range
of applications and users. The delivery of the Copernicus Marine Service strongly relies on the timely provision of both satellite and in-situ observa-
tions. While satellites provide a global view of the surface of the oceans, in-situ systems provide complementary data primarily by monitoring their
interior. In the context of the Copernicus Marine Service, global to regional scale in-situ observations are required to constrain the models at depth 
provide calibration and verification data. The Marine Service has thus a very high dependency on in-situ observations.
The international Argo programme is a major element of the global in-situ ocean observing system. More than 3500 floats are now globally measur-
ing temperature and salinity throughout the deep global oceans, down to 2,000 metres and delivering data both in real time for operational users and
after careful scientific quality control for climate change research and monitoring. Argo is the single most important in-situ observing system for the
Copernicus Marine Service. It provides essential/critical data in near real time to constrain global and regional data monitoring and forecasting cent-
ers and to validate satellite observations. Techniques are also mature and fully demonstrated. Float technology will also evolve in the coming years
to include new sensors (e.g. oxygen, biology) and new capabilities (e.g. deep ocean, under ice measurements) that are essential for climate change
research and for the Copernicus Marine Service.
The Euro-Argo research infrastructure organizes and federates European contribution to Argo (www.euro-argo.eu); it is part of the European ESFRI
roadmap on large research infrastructures. Euro-Argo carried out a preparatory phase project, funded through the EU 7th Framework Research
Programme, whose main outcome was to agree on the legal and governance framework (Euro-Argo ERIC) under which to establish the research
infrastructure. The Euro-Argo ERIC was set up in May 2014; it will allow European countries to consolidate and improve their contribution to Argo
international. The main challenges for Argo and Euro-Argo are 1/ to maintain the global array and ensure its long term sustainability and 2/ prepare the
next phase of Argo with an extension towards biogeochemistry, the polar oceans, the marginal seas and the deep ocean. Meeting such challenges is
essential for the long term sustainability and evolution of the Copernicus Marine Service. This requires major improvements in Argo float technology.
New floats with improved capabilities are or will be soon available from float manufacturers. They require, however, extensive testing at sea before
they can be used for operational monitoring. The Euro-Argo data centres need also to be upgraded so that they can handle these new floats.
The FP7 E-AIMS project
E-AIMS (Euro-Argo Improvements for the GMES/Copernicus Marine Service) is an FP7 Space RD project dealing with the in-situ component of
Copernicus (see www.euro-argo.eu/E-AIMS). E-AIMS is led by Ifremer and gathers 16 institutions from 9 different countries. E-AIMS will organize an
end-to-end evaluation of new Argo floats (from float design down to the use by GMES/Copernicus). Observing System Evaluations and Sensitivity
Experiments will also be conducted to provide robust recommendations for the next phase of Argo that take into account GMES/Copernicus Marine
Service, seasonal/decadal climate forecasting and satellite validation requirements. E-AIMS will thus demonstrate the capability of the Euro-Argo
infrastructure to conduct RD driven by GMES/Copernicus needs and demonstrate that procurement, deployment and processing of floats for GMES/
Copernicus can be organized at European level. These are key aspects for the long term sustainability of GMES/Copernicus in-situ component. At the
end of E-AIMS, Euro-Argo should agree on and start implementing the new phase of Argo. This requires demonstrating feasibility and utility which is
the very objective of E-AIMS.
• Ifremer, France, UKMO, U.K OGS, Italy, NERC/BODC, U.K. KNMI, Netherlands, IEO, Spain, IMR, Norway, USOF, Bulgaria, IOPAS, Poland, Geomar,
Germany, Mercator Océan, France, INGV, Italy, CLS, France, ACRI-ST, France, CSIC, Spain, IOBAS, Bulgaria.


Mercator Ocean—Coriolis Quarterly Newsletter - Special Issue
Assessesment of the impact of ARGO in ocean models and satellite validation from E-AIMS project
12#52-May 2015 -
WP17, 8: Management, Coordination and Communication
WP2: RD on float technology. The objective of WP2 is to test several
new Argo floats which have been recently developed. These new mod-
els of floats require intensive testing before they can be used for opera-
tional monitoring. WP2 will organize an end-to-end test of the following
new floats: floats with oxygen and biogeochemical sensors, deep floats,
floats with improved communication capabilities, Arctic floats.
	
  
WP3: Impact and design studies from Copernicus Marine Service and
seasonal/decadal modeling and forecasting. The main objective is to
perform Observing System Experiments and Observing System Simula-
tion Experiment with the Copernicus Marine Service assimilative sys-
tems to assess the potential of Argo and its extensions.
	
  
WP4: Impact for the validation of satellite observations. WP4 will ana-
lyze the use of Argo float data to calibrate, validate and monitor the long
term stability of satellite observations. Present and future requirements
for satellite Cal/Val activities will be given.
	
  
WP5: RD on Euro-Argo data system and interfaces with Copernicus
Marine Service. The objective is to improve the Euro-Argo data system
to better serve the Copernicus Marine Service and adapt it to the future
generation of Argo profiling floats.
	
  
WP6: Real time processing, impact and final assessment. The objec-
tive is to demonstrate that Euro-Argo data centers can process in real
time the new floats developed and tested in WP2, distribute them to
MyOcean modeling and forecasting centers and satellite Cal/Val teams
as well as to show that these teams can effectively use these new data
sets.
	
  
An overview of main results from WP3 and WP4 is given in the next
sections focusing on aspects directly relevant to the Copernicus Marine
Service. Main recommendations are also given in the final section.
The project started in January 2013 and will end in December 2015. It is organized along the following work packages:
Mercator Ocean—Coriolis Quarterly Newsletter - Special Issue
Assessesment of the impact of ARGO in ocean models and satellite validation from E-AIMS project
13#52-May 2015 -
Impact and design studies for Copernicus Marine Service monitoring and forecasting centers
Several impact and design studies were carried out as part of E-AIMS. Main results related to the Copernicus Marine Service monitoring and forecast-
ing centers are given here. Impact of Argo floats have been assessed both at global and regional scales.
Global ocean
1-year Observing System Evaluations (OSEs) were carried out with the Mercator Ocean ¼° global data assimilation system. A reference run where
all data (satellite altimetry, sea surface temperature, Argo and other in-situ observations) are assimilated is compared to a run without Argo data as-
similation or with only half of the Argo data assimilated. A strong impact of Argo data assimilation is identified on temperature and salinity estimates at
all depths, linked with an observation minus model forecast error (innovation) reduction both in term of variability and bias. Through Argo assimilation
the differences between observation and forecasted fields is thus reduced by about 20% in the 0-300 m depth and from 20% to 65% in the 700-2000 m
layers depth (Figure 1). Argo floats are thus crucial in the system to control the model forecasted water properties, from the surface down to 2000m.
Not all regions are equally impacted by the Argo observations. The performance of the system is also degraded if only half of the array is assimilated.
Time series of the anomaly of heat and salt content for different depth ranges (not shown here) also reveal a strong sensitivity to the density of the
Argo array.
ARMOR3D Copernicus Multi Observations system developed by CLS
has also been used to assess the impact of Argo observations to map
temperature and salinity fields together with satellite observations us-
ing Degree of Freedom of Signal (DFS) diagnostics. Results show that
most of the information comes from the Argo observing system, with al-
most no redundancy, then from the satellite dataset (altimetry and SST)
and then from the other in-situ instruments (e.g. moorings, XBTs). This
demonstrates, once again, the major role played by the Argo observing
system.
The denial of Argo observations from the Met Office coupled global data
assimilation system caused a similar large degradation in ocean tem-
perature and salinity innovation statistics. The greatest differences in the
upper ocean built slowly over 6 to 12 months and future OSEs investigat-
ing the impact of Argo and other ocean observing systems should be run
for between 6-months and 1-year. (Figure 2). Case study forecasts with
the Met Office ocean/atmosphere coupled system of Hurricane Sandy
highlighted that the assimilation of Argo profiles has an impact on the
analyzed position of the Gulf Stream, with consequent impacts on fore-
casts. However, no systematic improvements of the atmospheric state
can be determined without further case studies. A crucial aspect of the
coupled model which is expected to influence forecast skill is the diurnal
cycle of SST, and high vertical resolution near-surface data will be useful
for the assessment of this aspect of the model. A number of Argo profiles
already make this data available, and the extension of this to the whole
array would be very useful for coupled forecasting, particularly as the
cost of the additional measurements is minimal. High vertical resolution
near-surface temperature data from all Argo floats would be required for
such an application.
Observing System Simulation Experiments, where observations are
simulated from a fully known ocean simulation, were also carried out to
simulate extension of the future deep Argo network and its impact on
the Mercator Ocean global ocean data assimilation system. The analy-
sis quality at depth greatly benefits from observations deeper than 2000
m, even with a sparser spatial coverage than the surface layers. Deep
ocean bias could then be corrected for (Figure 3). The oceans deeper
than 2000 m are mainly unobserved as of today and they represent more
than 50% of the total ocean volume. Given the role of the deep ocean on
the earth climate it is essential to set up a global, long term monitoring
system for depths deeper than 2000 m. E-AIMS results show that such
deep measurements will be crucial to validate and constrain Copernicus
Marine Service models at depth.


Figure 1: OSEs carried out with the Mercator Ocean global data
assimilation system. Vertical structure of RMS of temperature
innovations (left) and normalized RMS temperature innovations
(right) from 0-2000m for Run-Ref (blue) (all observations
assimilated), Run-Argo2 (yellow) (half of the Argo data assimilated),
Run-NoArgo (green) (no Argo data assimilated) and Free Run (red).
Innovations are defined as observation minus model forecast fields.
Figure 2: OSEs carried out with the Met Office ocean/atmosphere
coupled system. Upper-ocean heat content difference
(J, of top 300m) between the control analyses and the no-Argo
analyses averaged over October 2012 (control minus no-Argo)
global data assimilation system.
	
  
Mercator Ocean—Coriolis Quarterly Newsletter - Special Issue
Assessesment of the impact of ARGO in ocean models and satellite validation from E-AIMS project
14#52-May 2015 -
Mediterranean Sea
INGV studied the impact of the Argo horizontal and vertical/time sampling scheme through both OSEs and OSSEs on the quality of the MyOcean
Monitoring and Forecasting Center analyses and forecasts. Argo observations produce a reduction of 30% on RMS of the analysis residual (obser-
vation minus model background) for temperature and salinity with respect to the free model simulation. If we use only half the Argo fleet, the mean
analysis residual in salinity increases by 30% and the RMS error by 10% in the thermocline. OSSEs evidenced that the Argo sampling scheme
could be modified to further improve the operational analyses quality. A positive impact has been found when probes have a drifting time of 3 days
(as compared to 5 days) and vertical continuous sampling (every meter for Argo) with respect to vertical subsampling as presently done. Full profile
transmission could also be considered as a major improvement for the MyOcean Mediterranean analyses. Results from OGS modelling experiments
indicate that the assimilation of floats has a small but positive impact on the biological compartment as well. The improvements are located mainly
in specific area (e.g. north western region of Mediterranean Sea) and specific period of the year (e.g. winter) when the vertical mixing is relevant for
biogeochemical dynamics.
Black Sea
Experiments with different deployment strategies demonstrated that increasing the amount of Argo floats performs better than increasing the fre-
quency of surfacing. Without Argo data, estimates in the upper mixed layer suffer from large errors. Profiling float measurements are very important
for depths below the seasonal thermocline because the transition from thermo-to-haline-dominated stratification shows only short spatial covariance
length. Another major conclusion from this research is that the present number of Argo floats operating in the Black Sea of about 10 seems optimal for
operational purposes. Further increase of this number could be beneficial when addressing specific research questions.
Use of Argo for satellite validation
The satellite validation studies carried out in E-AIMS have been focused on sea level from satellite altimetry, ocean colour, sea surface temperature
and sea surface salinity. It must be noticed that the development stage and maturity of the corresponding satellite missions differ from one to the other.
All these satellite missions require, however, to be validated with in-situ measurements and Argo provides unique observations for such a validation.
Analyses carried out as part of E-AIMS confirm the high potential of Argo observations for the validation of satellite observations. For some missions
(e.g. SSS) they already are the main source of information to validate and monitor the quality of satellite observations. Main findings and results are
summarized here:
• Satellite altimetry and Argo are quite complementary. Sea Level Anomalies (SLA) from altimeter measurements and dynamic height anomalies (DHA)
calculated from the temperature and salinity profiles of the Argo network are strongly correlated and thus, their comparison can be used to detect drifts,
anomalies or jumps in altimeter measurements, assess improvements due to altimetry data process standards, or to detect errors in the Argo float time
series. Results indicate that the altimeter drift detection and the global statistics of the differences between altimetry and Argo data are only slightly af-
fected by a reduction of the number of Argo floats and a reduced spatial coverage of the in-situ network while a reduced temporal sampling of the floats
(10 days) could prevent appropriate assessment of the impact of new altimeter standards. Detection of the altimeter drift and the quality assessment
of new altimeter standards or products are, however, sensitive to the Reference Depth and would benefit from deeper Argo observations.
• Ocean colour remote sensing data (Chlorophyll-a concentration, Chl-a, and diffuse attenu-
ation coefficient, Kd) and data derived from bio-profilers (i.e., Chl-a and Kd) are indirect
measurements relying on semi-empirical models of the backscattered light at the sea sur-
face (remote sensing) and fluorescence (bio-profilers). Direct comparison of two “indirect”
sources of observation might therefore allow identifying weakness (or strengths) of both
the measurement technology and their semi-empirical transformation. The development
of bio-Argo profilers is timely to the calibration/validation of the future Ocean and Land
Colour Instrument (OLCI) on board Sentinel 3 planned to launch late in 2015. The ability
of bio-Argo floats for the verification of future ocean colour remote sensing missions has
been demonstrated through matchups between Chl-a from remote sensing and Chl-a
integrated over the upper layer measured by existing bio-Argo floats (Figure 4).


Figure 3: OSSE carried out with the Mercator Ocean global data assimilation model to analyze the sensitivity of results
to the assimilation of deep (4000 m) Argo floats. Three month mean temperature difference between the analyzed and
the simulated “truth” in the 2000m-4000m layer: on the left without any float diving below 2000 m and on the right with one
third of the floats diving up to 4000 m every three 10-day cycle (colour scale between -1 and 1°C).
	
  
Figure 4: Matchup between bio-Argo and remotely
sensed Chl-a estimates.
Mercator Ocean—Coriolis Quarterly Newsletter - Special Issue
Assessesment of the impact of ARGO in ocean models and satellite validation from E-AIMS project
15#52-May 2015 -
• Satellite sea surface temperature observations (SST) are obtained from infra-red and microwave sensors. They are generally validated with precise in-situ
surface observations (in particular from surface drifters). The global coverage of Argo is now providing a very complementary mean for the validation of
satellite SST measurements. Argo observations between 3-5 m have been shown to provide a good estimate of SST when compared to the OSTIA (Op-
erational SST and Ice Analysis) gridded SST (http://ghrsst-pp.metoffice.com/). The sampling error associated with the monthly mean difference between
the OSTIA analysis and near-surface Argo observations has been investigated. The monthly total number of near-surface Argo observations is suitable for
a sampling error of 0.03 K for most major ocean regions. Some exceptions are western boundary current regions (0.082 K) and the Polar regions (0.2
K). The monthly total number of near-surface Argo observations currently available is sufficient to identify a statistically significant difference in standard
deviation between two analyses where large differences have been found. The Pacific has enough observations to demonstrate statistical differences
between the analyses. However, more floats are needed in the North and South Atlantic. Routine monthly validation of OSTIA and GMPE SST products
using quality-controlled Argo observations from the EN4 database 2 has now been set up. Time series of global and regional statistics (using the MyOcean
region definitions) are freely available on the web: http://ghrsst-pp.metoffice.com/pages/latest_analysis/sst_monitor/argo.
• Remotely sensed estimates of sea surface salinity (SSS) can be derived from microwave radiometry at L-band. The Soil Moisture and Ocean Salin-
ity (SMOS) and the Aquarius missions have been the first ones designed to provide operational estimates of the global SSS fields. They have been
launched in 2009 and 2011 respectively. As of today, the Argo array is the only observing system able to provide global measurements of salinity, al-
lowing validation of the retrieval algorithms in different geophysical scenarios (sea surface temperature, surface wind speed and distance to the coast).
Comparison of Argo near surface salinity data with satellite SSS products generated by the SMOS Barcelona Expert Centre (http://cp34-bec.cmima.
csic.es) have demonstrated this high potential of Argo. It has been noticed that the number of available Delayed Mode profiles has been decreasing
during the validation period (2011-2013). If in January 2011 more than 6000 Argo salinity profiles are available, by December 2013, less than 1000
Argo salinity profiles are available (Figure 5). This is due to the time required for the Argo data delayed mode quality control but it would be very im-
portant to reduce this time delay and/or to produce intermediate data sets where surface observations are validated. The results indicate that robust
estimates of the difference between SMOS and Delayed Argo have been found. The standard deviation of the differences are of the order of 0.29 and
0.23 (in the practical salinity scale) depending if the comparison is done in the latitudinal band of 60S-60N or 30S-30N respectively.
Conclusions and recommendations
Analyses carried out as part of E-AIMS confirm the very strong impact of Argo observations to constrain global and regional ocean models. The exist-
ing Argo observing system should thus be as much as possible stabilized with its actual spatial and temporal coverage and should continue to equally
sample the entire world ocean (a decrease of the number of profiles will immediately lead to a degradation of the ocean analyses and forecasts).
There is a strong need of deep Argo profiles (coarse resolution) for model validation and data assimilation. Deep observations are mandatory to moni-
tor and estimate error on forced and assimilative models at large depths.The assimilation of simulated deep Argo floats shows that deep model bias
could be corrected for even if the float sampling is coarse. For the upper ocean and for ocean/atmosphere coupled systems, there is a need of higher
resolution close to the surface. Other requirements include the continued production of delayed-mode high quality processing of Argo data with mini-
mal time delay (to be used for ocean reanalyses). Optimal drifting time and parking depth are still under investigation and will depend on the regions.
In parallel, work should be carried out to improve data assimilation schemes to better use the present Argo profile observations and the future deep/
high vertical resolution observations. Although this was not evaluated per se as part of WP3, Bio-Argo data will also be essential to validate Coperni-
cus Marine Service global and regional biogeochemical models and, if the sampling is sufficient, to constrain them through data assimilation. There is
now a critical lack of biogeochemical observations and this strongly limits our ability to validate Copernicus Marine Service biogeochemical models.
The results of the satellite validation activities suggest that current spatial and temporal coverage of Argo array is suited for validation activities of
sea level, SST, Ocean Colour and SSS (especially for monthly validation). However, further improvements that will help to improve the robustness of
these validations are: 1) Speeding up the scientific validation of Argo data; 2) increase the depth of the vertical sampling; 3) increase the number of
measurements in the upper four meters of the ocean; 4) increase sampling in regions of high variability; 5) network coverage should be enlarged in
the Atlantic Ocean and at high latitudes. Bio-Argo profilers are already a unique source of observations for the validation of ocean colour satellites.
Development of this new capability will require on the longer run to: 1) Optimize the match-up strategy; 2) program high-frequency profile cycles when
located in a biologically stable area; 3) Make use of additional recoverable profilers at launch and recovery times.
Acknowledgements
The authors wish to thank all the participants of the WP3 and WP4 of the FP7-SPACE E-AIMS project (grant agreement 312642). J. Ballabrera-Poy
has also been founded by the Spanish Ministry of Economy through the National RD Plan by means of MIDAS-7 project AYA2012–39356-C05-03.
	
  
Figure 5: Number of available
profiles from January 2011 to
December 2013: Shown are
the total number
of profiles, the delayed mode
profiles, and the number
of delayed mode profiles
with salinity.
Mercator Ocean—Coriolis Quarterly Newsletter - Special Issue
ARGO and SMOS SSS combination helps monitoring SSS variability from basin scale to mesoscale
16#52-May 2015 -
ARGO AND SMOS SSS COMBINATION HELPS MONITORING SSS
VARIABILITY FROM BASIN SCALE TO MESOSCALE
By N. Kolodziejczyk(1)
, J. Boutin(1)
, O. Hernandez(1,2)
, A. Sommer(1)
, G. Reverdin(1)
, S. Marchand(1)
, N. Martin(1)
,
J.-L. Vergely(1)
, and X. Yin(1)
1
Sorbonne University/LOCEAN, Paris, France
2
LEGOS/OMP, Toulouse, France
Abstract
The Soil Moisture and Ocean Salinity (SMOS) mission (European Space Agency) launched in November 2009 provides with measurements of Sea
Surface Salinity (SSS) over the global ocean at 45 km resolution every 3 to 5 days. For the first time, the SMOS SSS products are used to monitor
and address the distribution of mesoscale feature of the SSS (larger than 50-100km, with 10 day to monthly averages). However, SMOS SSS still
experience large biases and noise on various time and space scales which are not yet fully understood. Using a 4-year time-series of SMOS SSS data
(mid-2010 to mid-2014) and the global Argo array of in situ measurements as reference data base, a statistical approach and Optimal Interpolation are
used to characterize and to correct a large part of the biases and reduce the noise. The results are promising and it shows the strong complementarity
between SMOS and Argo data.
Introduction
Changes to the global water cycle are anticipated as a consequence of the climate change. Actually, precipitation and evaporation fluxes are very dif-
ficult to monitor accurately over the global ocean. Measuring ocean salinity has been shown to be a good proxy to monitor the evolution of the water
cycle (Terray et al., 2012; Durack and Wijffels, 2010). During last 50 years, the global change in the freshwater balance is responsible for a positive
trend in Sea Surface Salinity (SSS) in the Subtropical Atlantic (Curry et al., 2003; Durack and Wijffels, 2010). However, SSS is controlled by various
processes and is forced on all scales by: evaporation and precipitation; continental freshwater input (e.g. Dai and Trenberth, 2002); vertical mixing
with subsurface water masses (e.g. Kolodziejczyk et al., 2015a); and horizontal advection of salinity at large to submesoscale (e.g. Reul et al., 2014;
Kolodziejczyk et al., 2015b,c; Reverdin et al., 2015). These processes need to be well assessed to accurately monitor the freshwater flux from SSS
variability.
Since the 2000’s, the international Argo Program provides an unprecedented spatial and seasonal coverage of temperature and salinity in situ meas-
urements (Gould et al., 2006) with more than 3500 active autonomous profiler floats (https//www.coriolis.eu.org) over the global ocean in 2014. The
Argo floats provide profiles of temperature and salinity from 2000 m to the surface (~5 m) every 10 days, i.e. on the order of one SSS measurement
every 10 days and every 3°x3°. Derived monthly gridded products such as ISAS (Gaillard et al., 2009) provide an objective mapping at spatial resolu-
tion of 300-500 km (depending on the sampling). However, this resolution is still too coarse to assess temporal and spatial mesoscale variability over
which SSS is known to vary significantly.
SSS at higher spatio-temporal resolution is provided by the Soil Moisture and Ocean Salinity (SMOS) satellite mission (European Space Agency’s
water mission) since the beginning of 2010 (Mecklenburg et al., 2012). The targeted accuracy for averages over GODAE (Global Ocean Data As-
similation Experiment) scale (100x100 km2) is 0.1 pss. Quality assessment of the SMOS products over 100 x 100 km2 and 10 days revealed an
accuracy of 0.3-0.4 pss in the tropical and subtropical regions and of 0.5 pss in the more poleward regions (Boutin et al., 2013; Reul et al., 2013). At
mesoscales, the additional information brought by SMOS SSS with respect to other existing in situ networks has been locally demonstrated (Reul et
al., 2014; Maes et al., 2014; Hernandez et al., 2014; and Kolodziejczyk et al., 2015b).
Nevertheless, in some regions, SMOS data are strongly affected by Radio Frequency Interferences (RFI) (Oliva et al., 2012), and suffer from large
biases up to several hundreds of kilometers from coastlines (Reul et al. 2013; Boutin et al., 2013). There are also seasonal and latitudinal biases likely
due to imperfect corrections of geophysical signals such as galactic noise scattered by the sea surface and antenna sun heating (Kainulainen et al.,
2012). Latitudinal dependency of the satellite microwave SSS accuracy is mainly due to the change of SMOS brightness temperature sensitivity to
salinity with sea surface temperature. The latter reaches a maximum in warm Sea Surface Temperature (SST) waters (0.7 K for a SSS variation of 1
at SST of 30°C) and strongly decreases in cold waters (0.2 K for a SSS variation of 1 at SST of 0°C) (Klein and Swift, 1977).
Two major goals for SMOS SSS have been identified and are tackled in this newsletter: The first one is to reduce the systematic discrepancies be-
tween SMOS and in situ SSS which results from various sources (coastal contamination, solar and galactic noise signals imperfect antenna) and
which might be systematic at seasonal and large scale. The second goal is to maximize the signal to noise ratio at mesoscale.
Retrieving SSS mesoscale features from SMOS
Reul et al. (2014) and Kolodziejczyk et al., (2015b) have respectively shown the SMOS capability at detecting 2D mesoscale SSS features in the
region of Gulf Stream and the Azores Front/Current in the North Atlantic. Here, we further present the results of Kolodziejczyk et al. (2015b) in the
region of the eastward Azores Current. This region located at the northern edge of the Subtropical North Atlantic SSS maximum (Fig. 1) presents a
meridional front which separates salty and oligotrophic, poor in organic matter like chlorophyll-a, water to the south from fresher and eutrophic water
masses to the north (Fig. 1). Furthermore, the Azores frontal current is baroclinicaly instable creating mesoscale frontal eddies and meanders of
hundred kilometers scales with propagation velocities of about 2.5 cm.s-1 (Alves and Colin de Verdière, 1999).
Mercator Ocean—Coriolis Quarterly Newsletter - Special Issue
ARGO and SMOS SSS combination helps monitoring SSS variability from basin scale to mesoscale
17#52-May 2015 -
The monthly situation of July 2011 is presented (Fig. 1). The Azores front is still identified with a significant gain of details from SMOS SSS over
ISAS. It is not identified from satellite SST (Fig. 1a-d; black and magenta curve), as a result of the summer heating of the ocean surface. In order
to further illustrate the SMOS mesoscale features, the high resolution monthly ocean color data have been considered (Fig. 1e). The meandering
front and associated eddies seen on altimetric currents and salinity are consistently seen from the ocean color data. The current advection appears
to shape mesoscale features of tracers (SSS, Chlorophyll-a). In particular, west of 30°W, a series of high (low) salinity and low (high) chlorophyll-a
signed anticyclonic (cyclonic) eddies are observed (Fig. 1a,e). They characterize the intrusion of surface waters masses at mesoscale from the both
part of the Azores front.
	
  
Figure 1: July 2011 monthly mean surface salinity from (a) monthly SMOS L3 and (b) ISAS, surface temperature in °C
from (c) TMI and (d) ISAS, (e) MODIS sea surface Chlorophyll-a concentration in log(kg.m-3). Arrows are the monthly
mean geostrophic surface velocities from AVISO Ssalto-DUACS product (in m.s-1
). The thick black contour corresponding to
the 8 10-5
s-5
vorticity isoline identifies the Azores Front/Current (vort = f+ξ; where f is the planetary vorticity and ξ is the
relative vorticity computed as ξ=∂v/∂x-∂u/∂y). The thick magenta (blue) contours corresponding to the 36.6 isohaline (19 °C
isotherm) identify the thermohaline front associated with the Azores front. Colored circles are at the Argo float position and
the corresponding near-surface (~5 m depth) salinity and temperature values . The figures correspond to the black square
region on the lower corner map (after Kolodziejczyk et al., 2015b)
The mesoscale resolution of SMOS SSS data helps interpreting individual Argo measurements (see for instance Argo SSS within an anticyclonic eddy
around 36°N-35°W) (Fig. 1a). From Argo measurements, this eddy is suggested by two slightly saltier SSS measurements surrounded by fresher
ones (Fig. 1b). This eddy probably detached from the Azores Current front, as suggested by its positive relative vorticity signature, higher salinity and
higher chlorophyll-a than the surrounding environment (Fig. 1e). On the other hand, during boreal summer the surface heating of the upper ocean
totally masks the frontal and eddy signatures in SST fields. This feature is of course not resolved by the smoothed interpolated ISAS Argo product.
Mercator Ocean—Coriolis Quarterly Newsletter - Special Issue
ARGO and SMOS SSS combination helps monitoring SSS variability from basin scale to mesoscale
18#52-May 2015 -
Although the SSS monthly mesoscale features seen by SMOS qualitatively compare well with in situ and ancillary satellite data sources, the quantita-
tive agreements are often poor. For example, the previously documented AC is about 0.1-0.2 pss saltier than the in situ measurement (Fig. 1a). In
spite of the different nature of in situ (instantaneous at ~5 m depth) and satellite measurements (averaged over 100km, one month? and in the top
centimeter) which may introduce discrepancies sensitive to upper stratification and intermittent precipitations, Hernandez et al. (2014), have shown in
the Subtropical North Atlantic that SMOS measurement are subject to strong seasonal and large scale biases up to as large as 0.5 pss during winter
months. Furthermore, SMOS SSS individual retrievals at 43 km resolution present small signal over noise ratio (much smaller than 1) which can be
minimized only by spatial and temporal averages. Thus, the accuracy of 0.15 pss could only be obtained on SMOS SSS retrieved with ESA version
5 processing at the price of a 100x100 km2
spatial filtering and monthly averaging far from coastal regions where biases are dramatically large (±1.5
pss) (Hernandez et al., 2014).
SMOS mapping using Argo data
We have chosen a statistical approach to tackle these issues taking advantage of the 4 years of available SMOS data. The SMOS SSS data from ESA
L2 version 5 processing has been preliminarily processed following three main steps: i) Estimation and removal of systematic bias near the coast and
from some RFI sources. ii) Estimation and removal of large scale and seasonal biases. iii) Smoothing and mapping of corrected SMOS data at mes-
oscale. The first step uses a statistical approach to estimate climatological SMOS SSS bias based on an internal consistency check between SMOS
SSS measured at various locations within the SMOS swath and an absolute bias correction taken from a 4 year mean of Argo climatology (ISAS),
while both the second an third steps use optimal mapping methods, with monthly ISAS products as first guess. As done in Hernandez et al. (2014)
and Kolodziejczyk et al. (2015b) independent thermosalinograph (TSG) data from ships of opportunity – not included in the ISAS analysis – are used
to validate and assess the L2 SMOS SSS corrections.
	
  
Figure 2: a) Monthly ISAS SSS interpolated on 7 October 2012. b) 10 days L3 SMOS SSS from CEC-LOCEAN
over the period 1-10 October 2012. c) Weekly SMOS OI SSS over the period 4-10 October 2012 (in pss) and M.S.
‘Santa-Cruz’ route between 8-15 October 2012 (dashed black). Corresponding weekly AVISO surface currents are overlaid
(in m.s-1
).
Mercator Ocean—Coriolis Quarterly Newsletter - Special Issue
ARGO and SMOS SSS combination helps monitoring SSS variability from basin scale to mesoscale
19#52-May 2015 -
• Systematic bias corrections (coastal bias and some RFIs)
As shown between 1-11 October 2012 (Fig. 2), large discrepancies are observed in the coastal regions between 10 days L3 CATDS CEC-LOCEAN
gridded products (100x100km2
; Fig. 2b) and monthly ISAS climatology (Fig. 2a). They can exhibit amplitudes larger than ±1.5 pss and produce large
scale salinity artifacts up to several hundred kilometers (800 km) from the coasts (Reul et al. 2014; Boutin et al., 2013) which are especially well defined
along the Western African coast.
The coastal biases has been shown on brightness temperatures to come from a shadowing of the continent (Reul et al. 2012; Boutin et al., 2013; pola-
rimetry validation report available on http://smosp.acri.fr/docs/vr.pdf; section 3.2.2). SSS is retrieved from about 100 brightness temperatures measured
in various parts of the SMOS field of view at various incidence angles so that the contamination by the land on these Tbs depend on the orientation of the
cost line and on the emissivity of land. Hence, in our method we estimate a contamination in SSS for each pixel as a function of the location within the
swath. The 4 years of SMOS data and Argo climatology (mid-2010-mid-2014) have allowed characterizing systematic near coastal discrepancies. The
bias correction is eventually applied at each individual L2 SMOS SSS retrieval.
• Large scale and seasonal orbit biases corrections
In the Subtropical North Atlantic, Hernandez et al., (2014) have applied a raw seasonal correction for the large scale biases. They estimate the biases for
each month by comparing the monthly ISAS products and SMOS products averaged in their study area, i.e. they basically use in situ measurements to
adjust the mean SMOS measurement over the Subtropical North Atlantic SSS maximum.
As a preliminary noise reduction, we first selected a low pass filtered (2 pixels half window running mean) along dwell lines the L2 SMOS SSS data
over a 10 day period for both ascending and descending orbits. Then, ascending and descending orbit data are first mapped separately with an optimal
interpolation scheme at large scale (500 km) with a Gaussian shaped correlation function. The seasonal and large scale biases are deduced from the
comparison of ascending and descending large scale maps and monthly ISAS SSS product. Then, these estimated seasonal and large scale biases are
removed from the L2 SMOS data set. This approach is analog to Reynolds (1988), who used available in situ data measurements to correct large scale
retrieved SST from infrared radiometer satellite daytime and nighttime measurements which had been contaminated by the volcanic aerosols from Mont
Pinatubo eruption during the 1991-92 years.
• Reduction of noise and optimal mapping
The last step is a noise reduction and mapping every 7 days using optimal interpolation with a Gaussian correlation function scaled to 75 km over a
window of 10 days of L2 SMOS SSS data centered on the day of mapping, using the corresponding monthly ISAS SSS fields as first guess. Remaining
biases between different dwell lines of different orbits have been corrected (for more details see Le Traon et al., 1998). At mesoscale, it is hypothesized
that SSS features are also strongly constrained by mesoscale current advection. Therefore, an additional correlation scale is included in Gaussian cor-
relation function involving a larger correlation along-stream-lines computed from AVISO Ssalto-DUACS altimetric products (Nardelli, 2012). This improved
mapping method allows recovering spatial scales slightly smaller than 75 km and improves the geometry of the synoptic features (Fig. 2c). Figure 2c
shows preliminary results for the weekly SMOS OI field compared with the L3 SMOS CEC-LOCEAN products between 4-10 October 2012. As hoped
for, the coastal and large scale biases appear to be absent. This is confirmed by direct comparison along independent TSG SSS transects which exhibit
a much improved agreement especially along the coast and in the tropical region of Inter-Tropical Convergence Zone where strong SSS meridional
gradients are present (Fig. 3).
Preliminary comparisons with independent TSG data – not included in ISAS
product - provide an estimate of the improvement in biases, RMSD (Root
Mean Square Difference) and correlation between 10 day L3 LOCEAN
products and SMOS OI (Fig. 2 and 4). This mapping procedure strongly
reduces the biases (0.2 pss; Fig. 4b) of weekly SSS fields. The RMSD
from TSG measurements is on the average improved from 0.53 pss to 0.38
pss over the whole set of valid TSG transects (Fig. 4b). Note that, in re-
gions of low SSS variance (far from the rivers run off), such as in the SSS
maximum region, the RMSD is less than 0.2 pss (not shown). In the ITCZ
area (0-15°N), the SSS gradients are also well reproduced with RMSE on
the order of 0.2 pss (Fig. 3 and 4b). This is better than previously expected
from 10 days L3 SMOS SSS retrievals (Fig. 4b). Along the TSG sections,
the TSG-SMOS OI correlation is also improved (Fig. 4d). This has been
possible only because mesoscale features are resolved in SMOS SSS data
(Reul et al., 2014; Hernandez et al., 2014; Kolodziejczyk et al., 2015b), but is
strongly improved by bias corrections and noise filtering. It is however worth
commenting that bias corrections and mapping methods perform better in
region where raw L2 SMOS SSS data are less affected by noise and bias
contaminations. Many artifacts and unexplained contaminations are left that
deserve further work.
	
  
Figure 3: a) SSS colocated along M.S. ‘Santa-Cruz’ route
(see Fig. 2c) from thermosalinograph (red), ascending (magenta)
and descending (cyan) SMOS orbits corrected from coastal bias,
SMOS OI SSS (black) and monthly ISAS climatology (blue). b)
Comparison between TSG SSS and SMOS SSS. The color code
is the same as in Fig. 3a.
Mercator Ocean—Coriolis Quarterly Newsletter - Special Issue
ARGO and SMOS SSS combination helps monitoring SSS variability from basin scale to mesoscale
20#52-May 2015 -
	
  
Conclusion
This preliminary work shows a very high complementarity between SMOS and Argo data. SMOS SSS measurements provide for the first time mesoscale
resolution maps with an unprecedented coverage in regions poorly sampled by Argo array. Argo provides high quality data at large scales which greatly
helps L2 SMOS SSS calibration. Ongoing work is to better quantify the accuracy of the new SSS products and improve the mapping methods. While the
present work focuses on a bias correction method applied onto retrieved SSS, it is worth noticing that these biases originate from systematic biases on
Tbs. In parallel to these efforts in correcting SSS biases, the reduction of biases at Tb level is under study by other SMOS teams.
Acknowledgements
N.K. was supported by a CNES post-doctoral grant. O.H. was supported by SMOS+SOS project. A. S. was supported by a CNES doctoral grant. SMOS
data are from ESA level 2 version 5 products. Argo float data were collected and made freely available by the International Argo Program and the national
programs that contribute to it. The Argo Program is part of the Global Ocean Observing System. TSG SSS data are made freely available by SO SSS at
LEGOS (www.legos.obs-mip.fr/observations/sss) and from UK Voluntary Observing Ship Program from SOCAT archives. ISAS Argo interpolated prod-
ucts are provided by Fabienne Gaillard at SO Argo (wwz.ifremer.fr/lpo/SO-Argo/Products/ISAS-T-S-fields). Satellite altimetry and surface current data
are produced and made freely available by AVISO (www.aviso.altimetry.fr). SST TMI data are provided by Remote Sensing Systems (www.remss.com/
missions/tmi). MODIS ocean color data (chlorophyll-a) are provided by NASA (oceancolor.gsfc.nasa.gov/cms/).
Figure 4: In situ and SMOS SSS comparison (0.25°-10 day) statistics along the available TSG transects between
2011-2013 (a): Bias (b); Root Mean Square Difference (c); and correlation (d) for 10 days L3 SMOS LOCEAN prod-
ucts (gray crosses) and SMOS OI (circle). Differences between SMOS L3 and SMOS OI is identified by a gray vertical
segment. The color of the circle refers to the merchant ship (Black: M.S. Colibri; red: M.S. Toucan, blue: M.S. Santa-Cruz;
green: UK VOS)
Mercator Ocean—Coriolis Quarterly Newsletter - Special Issue
ARGO and SMOS SSS combination helps monitoring SSS variability from basin scale to mesoscale
21#52-May 2015 -
References
Alves J. L.G. R., and A. Colin de Verdière (1999), Instability Dynamics of a Subtropical Jet and Applications to the Azores Front Current System: Eddy-
Driven Mean Flow, J. Phys. Oceanogr., 29, 832-864.
Boutin, J., N. Martin , G. Reverdin , X. Yin , and F. Gaillard (2013), Sea surface freshening inferred from SMOS and ARGO salinity: impact of rain, Ocean
Sci., 9, 183–192 , doi:10.5194/os-9-183-2013.
Curry, R., B. Dickson, and I. Yashayaev (2003), A change in the freshwater balance of the atlantic ocean over the past four decades, Nature, 426 (6968),
826-829.
Dai, A., and K. E. Trenberth (2002), Estimates of freshwater disharge from continents: Latitudinal and seasonal variations, Journal of Hydrometeorology,
3(6), 660-687.
Durack, P. J., and S. E. Wijffels, (2010), Fifity-Years Trens in Global Ocean Salinities and Their Relationship to Broad-Scale Warming, J. Clim., 23, 4342-
4362.
Gaillard, F., E. Autret, V. Thierry, P. Galaup, C. Coatanoan, and T. Loubrieu (2009), Quality Control of Large Argo Datasets, J. Atmos. And Oceanic Tech.,
26, 337-351.
Gould, W. J., J. Turton, (2006), Argo- Sounding the oceans, Weather, 61(1), 17-21.
Hernandez, O., J. Boutin, N. Kolodziejczyk, G. Reverdin, N. Martin, F. Gaillard, N. Reul, and J.-L. Vergely, (2014), SMOS salinity in the subtropical north
Atlantic salinity maximum. Part I: Comparison with Aquarius and in situ salinity, J. Geophys. Res., in press, doi: 10.1002/2013JC009610.
Kainulainen, J., Colliander, A., Closa, J., Martin-Neira, M., Oliva, R., Buenadicha, G., Rubiales Alcaine, P., Hakkarainen, A., and Hallikainen, M. T. (2012),
Radiometric Performance of the SMOS Reference Radiometers – Assessment After One Year of Operation, IEEE Trans. Geosci. Remote Sens., 50,
1367–1383, doi:10.1109/tgrs.2011.2177273.
Klein, L., and C. Swift (1977), An improved model for the dielectric constant of sea water at microwave frequencies, Oceanic Engineering, IEEE Journal
of, 2(1), 104-111, doi:10.1109/TAP.1977.1141539.
Kolodziejczyk, N., G. Reverdin, and A. Lazar, 2015a: Interannual variability of the mixed layer winter convection and spiciness generation in the Eastern
Subtropical North Atlantic, Journal of Physical Oceanography, 45(2), 504-525. doi:10.1175/JPO-D-14-0042.1
Kolodziejczyk, N., O. Hernandez, J. Boutin, and G. Reverdin, 2015b: SMOS salinity in the subtropical north Atlantic salinity maximum: 2. Bi-dimensional
horizontal thermohaline variability, Journal of Geophysical Research, SMOS/Aquarius Special issue, doi: 10.1002/2014JC010103
Kolodziejczyk, N., G. Reverdin, J. Boutin, and O. Hernandez, 2015c: Observation of the surface horizontal thermohaline variability at meso- to sub-
mesoscales in the North-Eastern Subtropical Atlantic Ocean. Journal of Geophysical Research. doi: 10.1002/2014JC010455
Le Traon, P. Y., F. Nadal, and N. Ducet, 1998: An Improved Mapping Method of Multisatellite Altimeter Data, Journal of Atmospheric and Oceanic Technol-
ogy, 15, 522-534.
Maes C., N. Reul, D. Behringer, and T. O’Kane, 2014: The salinity signature of the equatorial Pacific cold tongue as revealed by the satellite SMOS mis-
sion, Geoscience Letters, 1(1), 1-17, doi:10.1186/s40562-014-0017-5
Mecklenburg, S., et al. (2012), ESA’s soil moisture and ocean salinity mission: mission preformance and operations, IEEE Transactions on Geoscience
and Remote Sensing. 50(5), 1354-1366, doi:10.1109/TSGRS. 2012.2187666.
Nardelli, B. B., (2012), A Novel Appreach for the High-Resolution Interpolation of In Situ Sea Surface Salinity, J. Atm. Oc. Tech., 29,867-879.
Oliva, R., E. Daganzo-Eusebio, Y. H. Kerr, S. Mecklenburg, S. Nieto, P. Rchaume, and C. Gruhier (2012), SMOS Radio Frequency Interference scenario:
Status and actions taken to improve the RFI environment in the 1400-1427-MHz passive band, IEEE Trans. Geos. Remote Sens., 30, 5, 1427-1439.
Reul, N., B. Chapron, T. Lee, C. Donlon , J. Boutin and G. Alory , 2014: Sea Surface Salinity structure of the meandering Gulf Stream revealed by SMOS
sensor, Geophys. Res. Lett., doi:10.1002/2014GRL059215
Reul, N., S. Fournier, J. Boutin, O. Hernandez, B. Chapron, G. Alory, Y. Quilfen, J. Tenerelli, S. Morriset, Y. Kerr, S. Mecklenburg, and S. Delwart,2013,
Sea Surface Salinity Observations from Space with the SMOS Satellite: A New Means to Monitor the Marine Branch of the Water Cycle, Surveys of
Geophys, 1-42, doi:10.007/s10712-013-9244-0.
Reverdin, G, S. Morisset, L. Marié, D. Bourras, G. Sutherland, B. Ward, J. Salvador, J. Font, Y. Cuypers, L. Centurioni, V. Hormann, N. Kolodziejczyk,
J. Boutin, F. D’Ovidio, F. Nencioli, N. Martin, F. Diverres, G. Alory, and R. Lumpkin, 2015: Meso-scales, fronts and mixing in the stratified surface ocean
during the STRASSE/SPURS summer 2012 cruises, Oceanorgraphy, 28(1):84–93, doi:10.5670/oceanog.2015.09.
Reynolds, R. W., (1988), A Real-Time Global Sea Surface Temperature Analysis, J. Clim., 1, 75-86.
Terray, L., L. Corre, S. Cravatte, T. Delcroix, G. Reverdin and A. Ribes (2012), Near-Surface Salinity as Natrue’s Rain Gauge to Detect Human Influence
on the Tropical Water Cycle, J. Clim, 25, 958-977, doi:http://dx.doi.org/10.1175/JLCLI-D-10-05025.1
Mercator Ocean—Coriolis Quarterly Newsletter - Special Issue
French PIRATA cruises S-ADCP data processing
22#52-May 2015 -
FRENCH PIRATA CRUISES S-ADCP DATA PROCESSING
By G. Herbert(1)
, C. Kermabon(2)
, J. Grelet(1)
, B. Bourlès(1)
1
IRD, Brest, France
2
IFREMER, Brest, France
Abstract
In the framework of the PIRATA program, several types of observations are carried out in the Tropical Atlantic during yearly cruises, including Shipboard
Acoustic Doppler Current Profilers (SADCP) data. The present note is a brief review of the SADCP data processing methodology applied for 8 PIRATA
cruises by using CASCADE software. To illustrate the processing steps and demonstrate the CASCADE software capabilities, an example of SADCP
data processing obtained from PIRATA-FR24 cruise has been shown. This data set is made available on the PIRATA website and will also be used in the
framework of the EU PREFACE program (see http://preface.b.uib.no/).
Introduction
The PIRATA (Prediction and Research Moored Array in the Tropical Atlantic) observing network is a contribution to the GOOS (Global Ocean Observing
System), GCOS (Global Climate Observing System), and the GEOSS (Global Earth Observing System of Systems), endorsed by the international pro-
gram CLIVAR (CLImate VARiability and predictability). Launched in 1997 thanks to a multinational cooperation between France (IRD and Météo-France),
Brazil (INPE) and USA (NOAA), PIRATA mostly maintains 18 meteo-oceanographic buoys (ATLAS system; see www.pmel.noaa.gov/tao/ for detail)
by carrying out yearly cruises for their servicing (Bourlès et al., 2008). In France, PIRATA is recognized as a National Observatory (“Service National
d’Observation”), and yearly cruises also allow, in addition to ATLAS buoys servicing, to carry out different opportunity operations (e.g. ARGO autonomous
profilers deployments) and to get several types of observations along repeated track lines, including oceanic currents from Ship mounted Acoustic Dop-
pler Current Profiler (SADCP; see http://www.brest.ird.fr/pirata/index_fr.php). After a brief reminder of ADCP principle and a description of main character-
istics of SADCP instrument onboard different research vessels used for PIRATA cruises, we present the SADCP data processing that has been applied
for 8 PIRATA cruises carried out from 2007 to 2014, by using the CASCADE (Chaîne Automatisée de Suivi des Courantomètres Acoustiques Doppler
Embarqués) software (Le Bot et al., 2011). An example of SADCP data processing obtained from one PIRATA cruise is also shown.
Shipboard Acoustic Doppler Current Profilers (SADCP)
2.1 Principle
We recall here the principle of the ADCP measurements, in order to better understand the data processing steps detailed afterwards.
ADCP estimates horizontal and vertical velocity of flowing water with sound, using the principle of Doppler Effect. It does so by emitting « pings» of
acoustic signal at a known and constant frequency into the water. The acoustic pulses ricochet off small particles suspended in the moving water
(plankton, sediments, or other solid particles) and reflect back to the transducer with a slightly changed frequency. The ADCP uses the Doppler
frequency shift of this backscattered signal measured by the transducer to measure the fluid velocity along the beam path. For measuring the three
velocity components of the current, ADCP usually uses four beams inclined from the vertical plane at an angle θ (called ‘beam angle’) and pointing
in different directions. In this configuration, ADCP estimates horizontal and vertical velocities and also an error used to qualify the data. The deter-
mination of the Doppler frequency is made by considering the ensemble of signal in time windows, which define cells or ‘bins’. The accuracy of the
measure, the vertical resolution and the acoustic noise, depends on the ADCP‘s type (Broadband or Narrowband) and on the frequency of the SADCP
instrument (typically: 38, 75, 150, 300, 600 or 1200 kHz). Low frequency systems provide long range and low resolution measurements, while high
frequency systems have shorter ranges with much higher resolution.
2.2 ADCP onboard PIRATA research vessels
Table 1 below presents the summary of the 8 cruises carried out from 2007 to 2014 in the framework of the PIRATA program, and the frequency of
ship-mounted SADCP instrument used for each cruise. For the 4 first cruises onboard the R/V L’Antéa, an Ocean Surveyor 75 kHz system was used
while it was a broad-band 150 kHz system for the 4 last cruises onboard the R/V Le Suroit. The 75 kHz ADCP are suited for a range about twice as
deep as the 150 kHz (about 600 meters in broad-band mode). The standard deviation of velocity data obtained using broad-band ADCPs are signifi-
cantly lower than that for narrow-band ADCPs, but the range is shallower. For all these PIRATA cruises, the vertical profiling resolution was nominally
8 m (= bin size) for the 150 and 75 kHz ADCPs. For additional background and references on the oceanographic application of shipboard ADCPs,
see e.g. Firing and Hummon (2010).
Greenland Month Year Latitudinal Range Research Vessel SADCP (KHz)
PIRATA-FR16 5 - 6 2007 0° - 15°N L’Antéa OS75
PIRATA-FR17 6 - 7 2007 10°S - 5°N L’Antéa OS75
PIRATA-FR18 9 - 10 2008 10°S - 15°N L’Antéa OS75
PIRATA-FR20 9 - 10 2010 10°S - 15°N L’Antéa OS75
PIRATA-FR21 5 - 6 2011 10°S - 15°N Le Suroit BB150
PIRATA-FR22 3 - 5 2012 10°S - 15°N Le Suroit BB150
PIRATA-FR23 5 - 6 2013 10°S - 15°N Le Suroit BB150
PIRATA-FR24 4 - 5 2014 10°S - 15°N Le Suroit BB150
Table1: Summary of the 2007-2014 PIRATA oceanographic cruises and frequency used by SADCP for each cruise
Mercator Ocean—Coriolis Quarterly Newsletter - Special Issue
French PIRATA cruises S-ADCP data processing
23#52-May 2015 -
To estimate the absolute current velocity in earth coordinates, one needs to remove the ship movement using the best navigation data available
(position, speed, tilt, heading). This information is provided by specific instruments that depend upon the ship. During the PIRATA cruises addressed
here, the ship’s position, pitch, roll and heading onboard the R/V Le Suroit are measured by an inertial navigation system based on fiber-optic gyro-
scope technology which integrated GPS information, whereas they are provided by an optical gyrocompass and motion sensor parted from a high
precision GPS system onboard the R/V L’Antéa. The transformation from beam ADCP to earth coordinates is performed using the Vessel-Mounted
Data Acquisition System (VmDAS). VmDAS is the constructor’s software (RDI’s software) used for RDI ADCP acquisition. It generates files contain-
ing averages mono-ping ADCP data and best navigation data available. The ADCP velocities recorded are relative to the ship, in earth coordinates
and averaged in time: FILE.STA files for ‘Short Term Average’ with 2 minutes averages and FILE.LTA files for ‘Long Term Average’ with 10 minutes
averages, for instance. These files are then processed and analyzed by the Matlab CASCADE software (“Chaîne Automatisée de Suivi des Couran-
tomètres Acoustiques Doppler Embarqués”). The following section presents the CASCADE software and gives a brief review of the basic post-cruise
processing steps realized after the cruise.
Processing and quality checks of SADCP data
The data processing software: CASCADE
CASCADE is a Matlab software developed by the Laboratory of Physical Oceanography (Le Bot et al., 2011) in order to process Vessel-mounted
ADCP data collected along vessel transects. The programs have been specifically tested for Windows and Linux and can be downloaded from: http://
wwz.ifremer.fr/lpo/Le-Laboratoire/Actualites/CASCADE-V6.2. It is used in different research organisms and has been implemented in operational
mode by the data center SISMER (“Systèmes d’Informations Scientifiques pour la MER”) at IFREMER. Regular updates of the software are made in
order to take into account the users feedbacks and the suggestions of improvements.
The CASCADE inputs files are the binary FILE.STA/FILE.LTA files obtained from the acquisition software VmDAS. In our case, we used the version
6.2 of CASCADE to analyze and process the SADCP data collected during 8 PIRATA cruises carried out between 2007 and 2014 in the eastern tropi-
cal Atlantic (see table 1). In the following section, we describe briefly the main processing steps of CASCADE software.
Overview of ADCP data cleaning stages in CASCADE
Complete cleaning of ADCP data requires several steps. CASCADE first converts the FILE.STA/FILE.LTA files generated by VmDAS software into a
single NetCDF file containing all the information but also the absolute current velocities in earth coordinates calculated from the relative and ship ve-
locities. From this NetCDF file, the user can add important external ancillary data (like estimations of bathymetry and barotropic tide for example), flag
the velocity data according to adjustable parameters, estimate and apply rotations of the ADCP coordinate system to realign it with the ship system,
and, finally, smooth the data in time and/or depth. At the end of the cleaning stage, the three components of the absolute current velocity (U, V, W) are
flagged 1 (good), 2 (dubious) or 3 to 9 (bad). The cleaning and correction are an iterative process. Automatic and visual quality checks of the data help
the user to choose the best cleaning parameters and the best ADCP correction (misalignment/amplitude) if needed. It is also possible to flag suspect
data manually between two dates or two ensembles. When the current data are supposed to be the best, the user can create section and/or station
files. These files contain the absolute current velocities re-averaged in space (for the section file) or time (for the station file). From these averaged
section/station files, user can plot the absolute velocities as vectors or contouring plots.
Example of processed SADCP data obtained from PIRATA-FR24 cruise.
In this section, an example of PIRATA SADCP data processed with CASCADE software is presented, i.e. the data collected during the leg1 of the
PIRATA-FR24 cruise from April 9 to May 22, 2014 aboard the R/V Le Suroit from Dakar (Senegal) to Abidjan (Ivory Coast) (figure 1). The velocity and
direction of the currents were measured along the route by a BB150 SADCP (table 1), able to investigate the current field down to nearly 250 m. For
this cruise, data were acquired with a blanking interval of 4m and vertical bin size of 8m and were preliminary processed onboard with the VmDAS
software. Only the data processed after the cruise by CASCADE software (version 6.2) from VmDAS FILE.STA files (pings averaged in two minutes
ensembles) are presented.
	
  
Figure 1: Track of the leg1 of PIRATA-FR24 cruise.
Mercator Ocean—Coriolis Quarterly Newsletter - Special Issue
French PIRATA cruises S-ADCP data processing
24#52-May 2015 -
	
  
Figure 2: Mean Echo Intensity (upper plot) and percentage of good data (lower plot).
Some controls about the quality of the data can be made before the processing. The Percent Good variable plotted on figure 2 represents the percent-
age of pings using the four beams for each two-minute average ensemble. Data are considered as acceptable data when the percentage is  10 %.
The percentage of good data is highest for the bins near the surface and rapidly falls below 50 % at some depth. This feature is the basic profile usually
observed and indicates that the ADCP data quality for this cruise is rather good. Nevertheless, a decrease of the percentage of good data happens
locally for shallow cells (around the ensembles 6000 and 12500), associated to a low echo intensity, indicating that the signal-to-noise for these water
cells is also low, maybe due to the presence of passive backscatters. The CASCADE cleaning data step gives the following result:
Flag Meaning Percent on the whole ensembles
1 Good data 55.86 %
2 Doubtful data 0.89 %
3 Bad data: median filter over 20 ensembles beyond 3
standard deviations.
0 %
4 Vertical shear  0.2 s-1
0 %
5 Vertical current speed  100 cm/s
PGOOD_ADCP  10%
0 %
6 Horizontal current speed component  4 m/s 0 %
7 Missing data 43.25 %
8 Data under the bottom (bottom ping) 0 %
9 Manual invalidation between 2 ensembles 0 %
Table 2: Flags attributed to the PIRATA-FR24 SADCP data (leg1 only) using CASCADE software.
Mercator Ocean newsletter 52

More Related Content

What's hot

Derivation of flow rating-curves in data-scarce environments
Derivation of flow rating-curves in data-scarce environments Derivation of flow rating-curves in data-scarce environments
Derivation of flow rating-curves in data-scarce environments Salvatore Manfreda
 
Assessing the ability of SWAT as a water quality model in the Lake Victoria b...
Assessing the ability of SWAT as a water quality model in the Lake Victoria b...Assessing the ability of SWAT as a water quality model in the Lake Victoria b...
Assessing the ability of SWAT as a water quality model in the Lake Victoria b...Timo Brussée
 
Hydrography documents
Hydrography documentsHydrography documents
Hydrography documentsHafez Ahmad
 
Wave Characterization for the Diagnosis of Semi-Submerged Structures
Wave Characterization for the Diagnosis of Semi-Submerged StructuresWave Characterization for the Diagnosis of Semi-Submerged Structures
Wave Characterization for the Diagnosis of Semi-Submerged StructuresCláudio Carneiro
 
Effectiveness Analysis of Agriculture BMPs by SWAT Model for Apropriate Contr...
Effectiveness Analysis of Agriculture BMPs by SWAT Model for Apropriate Contr...Effectiveness Analysis of Agriculture BMPs by SWAT Model for Apropriate Contr...
Effectiveness Analysis of Agriculture BMPs by SWAT Model for Apropriate Contr...Stankovic G
 
C1.02: The activities and Work Plan of the GOOS Physics and Climate Panel (OO...
C1.02: The activities and Work Plan of the GOOS Physics and Climate Panel (OO...C1.02: The activities and Work Plan of the GOOS Physics and Climate Panel (OO...
C1.02: The activities and Work Plan of the GOOS Physics and Climate Panel (OO...Blue Planet Symposium
 
Research tools in oceanography 313
Research tools in oceanography 313Research tools in oceanography 313
Research tools in oceanography 313Hafez Ahmad
 
Ocean Dynamics and Sediment Transport Measuring Acoustic and Optical Instruments
Ocean Dynamics and Sediment Transport Measuring Acoustic and Optical InstrumentsOcean Dynamics and Sediment Transport Measuring Acoustic and Optical Instruments
Ocean Dynamics and Sediment Transport Measuring Acoustic and Optical InstrumentsIRJET Journal
 
On the Oceanography of Brazil’s Equatorial Margin: Hazardous Offshore Current...
On the Oceanography of Brazil’s Equatorial Margin: Hazardous Offshore Current...On the Oceanography of Brazil’s Equatorial Margin: Hazardous Offshore Current...
On the Oceanography of Brazil’s Equatorial Margin: Hazardous Offshore Current...David Fratantoni
 
Biancamaria_etal_IGARSS2011_22Jul2011.ppt
Biancamaria_etal_IGARSS2011_22Jul2011.pptBiancamaria_etal_IGARSS2011_22Jul2011.ppt
Biancamaria_etal_IGARSS2011_22Jul2011.pptgrssieee
 
Fundamentals remote sensing land used
Fundamentals remote sensing land usedFundamentals remote sensing land used
Fundamentals remote sensing land usedHidraulica Tymanzo
 
SWaRMA_IRBM_Module2_#5, Role of hydrometeorological monitoring for IRBM in Ne...
SWaRMA_IRBM_Module2_#5, Role of hydrometeorological monitoring for IRBM in Ne...SWaRMA_IRBM_Module2_#5, Role of hydrometeorological monitoring for IRBM in Ne...
SWaRMA_IRBM_Module2_#5, Role of hydrometeorological monitoring for IRBM in Ne...ICIMOD
 
LARGE SCALE FLOOD MAPPING USING GEOMORPHIC METHODS
LARGE SCALE FLOOD MAPPING USING GEOMORPHIC METHODSLARGE SCALE FLOOD MAPPING USING GEOMORPHIC METHODS
LARGE SCALE FLOOD MAPPING USING GEOMORPHIC METHODSSalvatore Manfreda
 
Hydrography Midterm Reviewer
Hydrography Midterm ReviewerHydrography Midterm Reviewer
Hydrography Midterm Reviewersorbi
 
Download-manuals-surface water-manual-sw-volume5designmanualsediment
 Download-manuals-surface water-manual-sw-volume5designmanualsediment Download-manuals-surface water-manual-sw-volume5designmanualsediment
Download-manuals-surface water-manual-sw-volume5designmanualsedimenthydrologywebsite1
 

What's hot (20)

Derivation of flow rating-curves in data-scarce environments
Derivation of flow rating-curves in data-scarce environments Derivation of flow rating-curves in data-scarce environments
Derivation of flow rating-curves in data-scarce environments
 
Assessing the ability of SWAT as a water quality model in the Lake Victoria b...
Assessing the ability of SWAT as a water quality model in the Lake Victoria b...Assessing the ability of SWAT as a water quality model in the Lake Victoria b...
Assessing the ability of SWAT as a water quality model in the Lake Victoria b...
 
Hydrography documents
Hydrography documentsHydrography documents
Hydrography documents
 
Littoral2014 minelli
Littoral2014 minelliLittoral2014 minelli
Littoral2014 minelli
 
Wave Characterization for the Diagnosis of Semi-Submerged Structures
Wave Characterization for the Diagnosis of Semi-Submerged StructuresWave Characterization for the Diagnosis of Semi-Submerged Structures
Wave Characterization for the Diagnosis of Semi-Submerged Structures
 
A coastal and river basin
A coastal and river basinA coastal and river basin
A coastal and river basin
 
Erosion and runoff evaluation
Erosion and runoff evaluationErosion and runoff evaluation
Erosion and runoff evaluation
 
Effectiveness Analysis of Agriculture BMPs by SWAT Model for Apropriate Contr...
Effectiveness Analysis of Agriculture BMPs by SWAT Model for Apropriate Contr...Effectiveness Analysis of Agriculture BMPs by SWAT Model for Apropriate Contr...
Effectiveness Analysis of Agriculture BMPs by SWAT Model for Apropriate Contr...
 
C1.02: The activities and Work Plan of the GOOS Physics and Climate Panel (OO...
C1.02: The activities and Work Plan of the GOOS Physics and Climate Panel (OO...C1.02: The activities and Work Plan of the GOOS Physics and Climate Panel (OO...
C1.02: The activities and Work Plan of the GOOS Physics and Climate Panel (OO...
 
Research tools in oceanography 313
Research tools in oceanography 313Research tools in oceanography 313
Research tools in oceanography 313
 
Millet Sess5 102709
Millet Sess5 102709Millet Sess5 102709
Millet Sess5 102709
 
Ocean Dynamics and Sediment Transport Measuring Acoustic and Optical Instruments
Ocean Dynamics and Sediment Transport Measuring Acoustic and Optical InstrumentsOcean Dynamics and Sediment Transport Measuring Acoustic and Optical Instruments
Ocean Dynamics and Sediment Transport Measuring Acoustic and Optical Instruments
 
On the Oceanography of Brazil’s Equatorial Margin: Hazardous Offshore Current...
On the Oceanography of Brazil’s Equatorial Margin: Hazardous Offshore Current...On the Oceanography of Brazil’s Equatorial Margin: Hazardous Offshore Current...
On the Oceanography of Brazil’s Equatorial Margin: Hazardous Offshore Current...
 
Biancamaria_etal_IGARSS2011_22Jul2011.ppt
Biancamaria_etal_IGARSS2011_22Jul2011.pptBiancamaria_etal_IGARSS2011_22Jul2011.ppt
Biancamaria_etal_IGARSS2011_22Jul2011.ppt
 
Fundamentals remote sensing land used
Fundamentals remote sensing land usedFundamentals remote sensing land used
Fundamentals remote sensing land used
 
SWaRMA_IRBM_Module2_#5, Role of hydrometeorological monitoring for IRBM in Ne...
SWaRMA_IRBM_Module2_#5, Role of hydrometeorological monitoring for IRBM in Ne...SWaRMA_IRBM_Module2_#5, Role of hydrometeorological monitoring for IRBM in Ne...
SWaRMA_IRBM_Module2_#5, Role of hydrometeorological monitoring for IRBM in Ne...
 
D3602026041
D3602026041D3602026041
D3602026041
 
LARGE SCALE FLOOD MAPPING USING GEOMORPHIC METHODS
LARGE SCALE FLOOD MAPPING USING GEOMORPHIC METHODSLARGE SCALE FLOOD MAPPING USING GEOMORPHIC METHODS
LARGE SCALE FLOOD MAPPING USING GEOMORPHIC METHODS
 
Hydrography Midterm Reviewer
Hydrography Midterm ReviewerHydrography Midterm Reviewer
Hydrography Midterm Reviewer
 
Download-manuals-surface water-manual-sw-volume5designmanualsediment
 Download-manuals-surface water-manual-sw-volume5designmanualsediment Download-manuals-surface water-manual-sw-volume5designmanualsediment
Download-manuals-surface water-manual-sw-volume5designmanualsediment
 

Similar to Mercator Ocean newsletter 52

Mercator Ocean Journal 53 - Special 20th anniversary issue
Mercator Ocean Journal 53 - Special 20th anniversary issueMercator Ocean Journal 53 - Special 20th anniversary issue
Mercator Ocean Journal 53 - Special 20th anniversary issueMercator Ocean International
 
C0.3: Blue Planet Overview - Sophie Seeyave
C0.3: Blue Planet Overview - Sophie SeeyaveC0.3: Blue Planet Overview - Sophie Seeyave
C0.3: Blue Planet Overview - Sophie SeeyaveBlue Planet Symposium
 
Spatial planning: towards a new approach in fisheries management
Spatial planning: towards a new approach in fisheries managementSpatial planning: towards a new approach in fisheries management
Spatial planning: towards a new approach in fisheries managementTommaso Russo
 

Similar to Mercator Ocean newsletter 52 (20)

Mercator Ocean newsletter 41
Mercator Ocean newsletter 41Mercator Ocean newsletter 41
Mercator Ocean newsletter 41
 
Mercator Ocean newsletter 34
Mercator Ocean newsletter 34Mercator Ocean newsletter 34
Mercator Ocean newsletter 34
 
Mercator Ocean newsletter 35
Mercator Ocean newsletter 35Mercator Ocean newsletter 35
Mercator Ocean newsletter 35
 
Mercator Ocean newsletter 45
Mercator Ocean newsletter 45Mercator Ocean newsletter 45
Mercator Ocean newsletter 45
 
Mercator Ocean newsletter 48
Mercator Ocean newsletter 48Mercator Ocean newsletter 48
Mercator Ocean newsletter 48
 
Mercator Ocean newsletter 29
Mercator Ocean newsletter 29Mercator Ocean newsletter 29
Mercator Ocean newsletter 29
 
Mercator Ocean 2013 Annual Report
Mercator Ocean 2013 Annual ReportMercator Ocean 2013 Annual Report
Mercator Ocean 2013 Annual Report
 
Mercator Ocean newsletter 30
Mercator Ocean newsletter 30Mercator Ocean newsletter 30
Mercator Ocean newsletter 30
 
Mercator Ocean newsletter 31
Mercator Ocean newsletter 31Mercator Ocean newsletter 31
Mercator Ocean newsletter 31
 
Mercator Ocean Journal 53 - Special 20th anniversary issue
Mercator Ocean Journal 53 - Special 20th anniversary issueMercator Ocean Journal 53 - Special 20th anniversary issue
Mercator Ocean Journal 53 - Special 20th anniversary issue
 
Mercator Ocean newsletter 37
Mercator Ocean newsletter 37Mercator Ocean newsletter 37
Mercator Ocean newsletter 37
 
Mercator Ocean Newsletter 51
Mercator Ocean Newsletter 51Mercator Ocean Newsletter 51
Mercator Ocean Newsletter 51
 
Mercator Ocean newsletter 17
Mercator Ocean newsletter 17Mercator Ocean newsletter 17
Mercator Ocean newsletter 17
 
C0.3: Blue Planet Overview - Sophie Seeyave
C0.3: Blue Planet Overview - Sophie SeeyaveC0.3: Blue Planet Overview - Sophie Seeyave
C0.3: Blue Planet Overview - Sophie Seeyave
 
Mercator Ocean newsletter 24
Mercator Ocean newsletter 24Mercator Ocean newsletter 24
Mercator Ocean newsletter 24
 
Mercator Ocean 2014 Annual Report
Mercator Ocean 2014 Annual ReportMercator Ocean 2014 Annual Report
Mercator Ocean 2014 Annual Report
 
Mercator Ocean newsletter 44
Mercator Ocean newsletter 44Mercator Ocean newsletter 44
Mercator Ocean newsletter 44
 
Goos09talk
Goos09talkGoos09talk
Goos09talk
 
Mercator Ocean newsletter 47
Mercator Ocean newsletter 47Mercator Ocean newsletter 47
Mercator Ocean newsletter 47
 
Spatial planning: towards a new approach in fisheries management
Spatial planning: towards a new approach in fisheries managementSpatial planning: towards a new approach in fisheries management
Spatial planning: towards a new approach in fisheries management
 

More from Mercator Ocean International

More from Mercator Ocean International (20)

Product showcase nws_mfc_004
Product showcase nws_mfc_004Product showcase nws_mfc_004
Product showcase nws_mfc_004
 
Product showcase med_mfc
Product showcase med_mfcProduct showcase med_mfc
Product showcase med_mfc
 
Product showcase mfc_bs
Product showcase mfc_bsProduct showcase mfc_bs
Product showcase mfc_bs
 
Samuelsen arcmfc bgc_overview
Samuelsen arcmfc bgc_overviewSamuelsen arcmfc bgc_overview
Samuelsen arcmfc bgc_overview
 
Product showcase arc_mfc_002
Product showcase arc_mfc_002Product showcase arc_mfc_002
Product showcase arc_mfc_002
 
Zoombi cmems ga_se_h2020_slider
Zoombi cmems ga_se_h2020_sliderZoombi cmems ga_se_h2020_slider
Zoombi cmems ga_se_h2020_slider
 
Coastobs cmems ga_se_h2020_slider
Coastobs cmems ga_se_h2020_sliderCoastobs cmems ga_se_h2020_slider
Coastobs cmems ga_se_h2020_slider
 
Nemo fes cmems-ga_se_h2020_slider
Nemo fes cmems-ga_se_h2020_sliderNemo fes cmems-ga_se_h2020_slider
Nemo fes cmems-ga_se_h2020_slider
 
Wave flow cmems_ga_se_h2020_slider
Wave flow cmems_ga_se_h2020_sliderWave flow cmems_ga_se_h2020_slider
Wave flow cmems_ga_se_h2020_slider
 
Bioptimod massimili cmems-ga_se_h2020_slider
Bioptimod massimili cmems-ga_se_h2020_sliderBioptimod massimili cmems-ga_se_h2020_slider
Bioptimod massimili cmems-ga_se_h2020_slider
 
Optima cmems ga_se_h2020_slider
Optima cmems ga_se_h2020_sliderOptima cmems ga_se_h2020_slider
Optima cmems ga_se_h2020_slider
 
Combat cmems ga_se_h2020_slider
Combat cmems ga_se_h2020_sliderCombat cmems ga_se_h2020_slider
Combat cmems ga_se_h2020_slider
 
Curae cmems ga_se_h2020_slider
Curae cmems ga_se_h2020_sliderCurae cmems ga_se_h2020_slider
Curae cmems ga_se_h2020_slider
 
Lambda cmems ga_se_h2020_slider
Lambda cmems ga_se_h2020_sliderLambda cmems ga_se_h2020_slider
Lambda cmems ga_se_h2020_slider
 
Genoa cmems ga_se_h2020_slider
Genoa cmems ga_se_h2020_sliderGenoa cmems ga_se_h2020_slider
Genoa cmems ga_se_h2020_slider
 
Scrum2 cmems ga_se_h2020_slider
Scrum2 cmems ga_se_h2020_sliderScrum2 cmems ga_se_h2020_slider
Scrum2 cmems ga_se_h2020_slider
 
Hive cmems ga_se_h2020_slider
Hive cmems ga_se_h2020_sliderHive cmems ga_se_h2020_slider
Hive cmems ga_se_h2020_slider
 
Medsub cmems ga_se_h2020_slider
Medsub cmems ga_se_h2020_sliderMedsub cmems ga_se_h2020_slider
Medsub cmems ga_se_h2020_slider
 
Increase cmems ga_se_h2020_slider
Increase cmems ga_se_h2020_sliderIncrease cmems ga_se_h2020_slider
Increase cmems ga_se_h2020_slider
 
Product showcase tac_sst_010
Product showcase tac_sst_010Product showcase tac_sst_010
Product showcase tac_sst_010
 

Recently uploaded

原版定制copy澳洲詹姆斯库克大学毕业证JCU毕业证成绩单留信学历认证保障质量
原版定制copy澳洲詹姆斯库克大学毕业证JCU毕业证成绩单留信学历认证保障质量原版定制copy澳洲詹姆斯库克大学毕业证JCU毕业证成绩单留信学历认证保障质量
原版定制copy澳洲詹姆斯库克大学毕业证JCU毕业证成绩单留信学历认证保障质量sehgh15heh
 
Hi FI Call Girl Ahmedabad 7397865700 Independent Call Girls
Hi FI Call Girl Ahmedabad 7397865700 Independent Call GirlsHi FI Call Girl Ahmedabad 7397865700 Independent Call Girls
Hi FI Call Girl Ahmedabad 7397865700 Independent Call Girlsssuser7cb4ff
 
Russian Call Girls Nashik Anjali 7001305949 Independent Escort Service Nashik
Russian Call Girls Nashik Anjali 7001305949 Independent Escort Service NashikRussian Call Girls Nashik Anjali 7001305949 Independent Escort Service Nashik
Russian Call Girls Nashik Anjali 7001305949 Independent Escort Service Nashikranjana rawat
 
Poly-film-Prefab cover agricultural greenhouse-polyhouse structure.pptx
Poly-film-Prefab cover agricultural greenhouse-polyhouse structure.pptxPoly-film-Prefab cover agricultural greenhouse-polyhouse structure.pptx
Poly-film-Prefab cover agricultural greenhouse-polyhouse structure.pptxAgrodome projects LLP
 
Call Girls Ahmedabad 7397865700 Ridhima Hire Me Full Night
Call Girls Ahmedabad 7397865700 Ridhima Hire Me Full NightCall Girls Ahmedabad 7397865700 Ridhima Hire Me Full Night
Call Girls Ahmedabad 7397865700 Ridhima Hire Me Full Nightssuser7cb4ff
 
VIP Call Girls Service Bandlaguda Hyderabad Call +91-8250192130
VIP Call Girls Service Bandlaguda Hyderabad Call +91-8250192130VIP Call Girls Service Bandlaguda Hyderabad Call +91-8250192130
VIP Call Girls Service Bandlaguda Hyderabad Call +91-8250192130Suhani Kapoor
 
Air pollution soli pollution water pollution noise pollution land pollution
Air pollution soli pollution water pollution noise pollution land pollutionAir pollution soli pollution water pollution noise pollution land pollution
Air pollution soli pollution water pollution noise pollution land pollutionrgxv72jrgc
 
Freegle User Survey as visual display - BH
Freegle User Survey as visual display - BHFreegle User Survey as visual display - BH
Freegle User Survey as visual display - BHbill846304
 
Call Girls South Delhi Delhi reach out to us at ☎ 9711199012
Call Girls South Delhi Delhi reach out to us at ☎ 9711199012Call Girls South Delhi Delhi reach out to us at ☎ 9711199012
Call Girls South Delhi Delhi reach out to us at ☎ 9711199012sapnasaifi408
 
VIP Kolkata Call Girl Kalighat 👉 8250192130 Available With Room
VIP Kolkata Call Girl Kalighat 👉 8250192130  Available With RoomVIP Kolkata Call Girl Kalighat 👉 8250192130  Available With Room
VIP Kolkata Call Girl Kalighat 👉 8250192130 Available With Roomdivyansh0kumar0
 
Philippines-Native-Chicken.pptx file copy
Philippines-Native-Chicken.pptx file copyPhilippines-Native-Chicken.pptx file copy
Philippines-Native-Chicken.pptx file copyKristineRoseCorrales
 
ENVIRONMENTAL LAW ppt on laws of environmental law
ENVIRONMENTAL LAW ppt on laws of environmental lawENVIRONMENTAL LAW ppt on laws of environmental law
ENVIRONMENTAL LAW ppt on laws of environmental lawnitinraj1000000
 
(NANDITA) Hadapsar Call Girls Just Call 7001035870 [ Cash on Delivery ] Pune ...
(NANDITA) Hadapsar Call Girls Just Call 7001035870 [ Cash on Delivery ] Pune ...(NANDITA) Hadapsar Call Girls Just Call 7001035870 [ Cash on Delivery ] Pune ...
(NANDITA) Hadapsar Call Girls Just Call 7001035870 [ Cash on Delivery ] Pune ...ranjana rawat
 
885MTAMount DMU University Bachelor's Diploma in Education
885MTAMount DMU University Bachelor's Diploma in Education885MTAMount DMU University Bachelor's Diploma in Education
885MTAMount DMU University Bachelor's Diploma in Educationz xss
 
Joint GBIF Biodiversa+ symposium in Helsinki on 2024-04-16
Joint GBIF Biodiversa+ symposium in  Helsinki on 2024-04-16Joint GBIF Biodiversa+ symposium in  Helsinki on 2024-04-16
Joint GBIF Biodiversa+ symposium in Helsinki on 2024-04-16Dag Endresen
 
Along the Lakefront, "Menacing Unknown"s
Along the Lakefront, "Menacing Unknown"sAlong the Lakefront, "Menacing Unknown"s
Along the Lakefront, "Menacing Unknown"syalehistoricalreview
 

Recently uploaded (20)

原版定制copy澳洲詹姆斯库克大学毕业证JCU毕业证成绩单留信学历认证保障质量
原版定制copy澳洲詹姆斯库克大学毕业证JCU毕业证成绩单留信学历认证保障质量原版定制copy澳洲詹姆斯库克大学毕业证JCU毕业证成绩单留信学历认证保障质量
原版定制copy澳洲詹姆斯库克大学毕业证JCU毕业证成绩单留信学历认证保障质量
 
young call girls in Janakpuri🔝 9953056974 🔝 escort Service
young call girls in Janakpuri🔝 9953056974 🔝 escort Serviceyoung call girls in Janakpuri🔝 9953056974 🔝 escort Service
young call girls in Janakpuri🔝 9953056974 🔝 escort Service
 
Hi FI Call Girl Ahmedabad 7397865700 Independent Call Girls
Hi FI Call Girl Ahmedabad 7397865700 Independent Call GirlsHi FI Call Girl Ahmedabad 7397865700 Independent Call Girls
Hi FI Call Girl Ahmedabad 7397865700 Independent Call Girls
 
Call Girls In { Delhi } South Extension Whatsup 9873940964 Enjoy Unlimited Pl...
Call Girls In { Delhi } South Extension Whatsup 9873940964 Enjoy Unlimited Pl...Call Girls In { Delhi } South Extension Whatsup 9873940964 Enjoy Unlimited Pl...
Call Girls In { Delhi } South Extension Whatsup 9873940964 Enjoy Unlimited Pl...
 
Russian Call Girls Nashik Anjali 7001305949 Independent Escort Service Nashik
Russian Call Girls Nashik Anjali 7001305949 Independent Escort Service NashikRussian Call Girls Nashik Anjali 7001305949 Independent Escort Service Nashik
Russian Call Girls Nashik Anjali 7001305949 Independent Escort Service Nashik
 
Poly-film-Prefab cover agricultural greenhouse-polyhouse structure.pptx
Poly-film-Prefab cover agricultural greenhouse-polyhouse structure.pptxPoly-film-Prefab cover agricultural greenhouse-polyhouse structure.pptx
Poly-film-Prefab cover agricultural greenhouse-polyhouse structure.pptx
 
Sexy Call Girls Patel Nagar New Delhi +918448380779 Call Girls Service in Del...
Sexy Call Girls Patel Nagar New Delhi +918448380779 Call Girls Service in Del...Sexy Call Girls Patel Nagar New Delhi +918448380779 Call Girls Service in Del...
Sexy Call Girls Patel Nagar New Delhi +918448380779 Call Girls Service in Del...
 
Call Girls Ahmedabad 7397865700 Ridhima Hire Me Full Night
Call Girls Ahmedabad 7397865700 Ridhima Hire Me Full NightCall Girls Ahmedabad 7397865700 Ridhima Hire Me Full Night
Call Girls Ahmedabad 7397865700 Ridhima Hire Me Full Night
 
VIP Call Girls Service Bandlaguda Hyderabad Call +91-8250192130
VIP Call Girls Service Bandlaguda Hyderabad Call +91-8250192130VIP Call Girls Service Bandlaguda Hyderabad Call +91-8250192130
VIP Call Girls Service Bandlaguda Hyderabad Call +91-8250192130
 
Air pollution soli pollution water pollution noise pollution land pollution
Air pollution soli pollution water pollution noise pollution land pollutionAir pollution soli pollution water pollution noise pollution land pollution
Air pollution soli pollution water pollution noise pollution land pollution
 
Freegle User Survey as visual display - BH
Freegle User Survey as visual display - BHFreegle User Survey as visual display - BH
Freegle User Survey as visual display - BH
 
Call Girls South Delhi Delhi reach out to us at ☎ 9711199012
Call Girls South Delhi Delhi reach out to us at ☎ 9711199012Call Girls South Delhi Delhi reach out to us at ☎ 9711199012
Call Girls South Delhi Delhi reach out to us at ☎ 9711199012
 
VIP Kolkata Call Girl Kalighat 👉 8250192130 Available With Room
VIP Kolkata Call Girl Kalighat 👉 8250192130  Available With RoomVIP Kolkata Call Girl Kalighat 👉 8250192130  Available With Room
VIP Kolkata Call Girl Kalighat 👉 8250192130 Available With Room
 
Green Banking
Green Banking Green Banking
Green Banking
 
Philippines-Native-Chicken.pptx file copy
Philippines-Native-Chicken.pptx file copyPhilippines-Native-Chicken.pptx file copy
Philippines-Native-Chicken.pptx file copy
 
ENVIRONMENTAL LAW ppt on laws of environmental law
ENVIRONMENTAL LAW ppt on laws of environmental lawENVIRONMENTAL LAW ppt on laws of environmental law
ENVIRONMENTAL LAW ppt on laws of environmental law
 
(NANDITA) Hadapsar Call Girls Just Call 7001035870 [ Cash on Delivery ] Pune ...
(NANDITA) Hadapsar Call Girls Just Call 7001035870 [ Cash on Delivery ] Pune ...(NANDITA) Hadapsar Call Girls Just Call 7001035870 [ Cash on Delivery ] Pune ...
(NANDITA) Hadapsar Call Girls Just Call 7001035870 [ Cash on Delivery ] Pune ...
 
885MTAMount DMU University Bachelor's Diploma in Education
885MTAMount DMU University Bachelor's Diploma in Education885MTAMount DMU University Bachelor's Diploma in Education
885MTAMount DMU University Bachelor's Diploma in Education
 
Joint GBIF Biodiversa+ symposium in Helsinki on 2024-04-16
Joint GBIF Biodiversa+ symposium in  Helsinki on 2024-04-16Joint GBIF Biodiversa+ symposium in  Helsinki on 2024-04-16
Joint GBIF Biodiversa+ symposium in Helsinki on 2024-04-16
 
Along the Lakefront, "Menacing Unknown"s
Along the Lakefront, "Menacing Unknown"sAlong the Lakefront, "Menacing Unknown"s
Along the Lakefront, "Menacing Unknown"s
 

Mercator Ocean newsletter 52

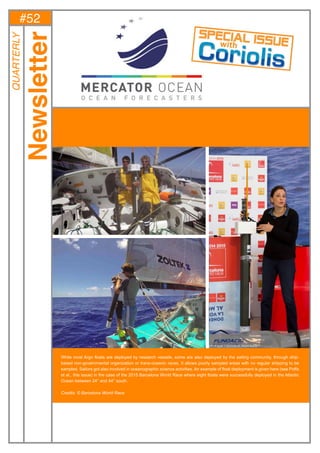
  • 1. 1 While most Argo floats are deployed by research vessels, some are also deployed by the sailing community, through ship- based non-governmental organization or trans-oceanic races. It allows poorly sampled areas with no regular shipping to be sampled. Sailors got also involved in oceanographic science activities. An example of float deployment is given here (see Poffa et al., this issue) in the case of the 2015 Barcelona World Race where eight floats were successfully deployed in the Atlantic Ocean between 24° and 44° south. Credits: © Barcelona World Race #52 Newsletter QUARTERLY
  • 2. Editorial – May 2015 – Special Issue jointly coordinated by Mercator Ocean and Coriolis focusing on Ocean Observations 2#52-May 2015 - Editorial – May 2015 – Special Issue jointly coordinated by Mercator Ocean and Coriolis focusing on Ocean Observations Greetings all, Once a year in April, the Mercator Ocean Forecasting Center in Toulouse and the Coriolis Infrastructure in Brest publish a common newsletter. Papers are dedicated to observations only. • The first paper introducing this issue is presenting the Coriolis 2014-2020 framework which was renewed in 2014 in order to go on integrating in-situ ocean observation infrastructure for operational oceanography and ocean/climate research. • Next paper by Poffa et al. describes how some Argo floats are deployed by the sailing community, through ship-based non-governmental organiza- tion or trans-oceanic races. It allows Argo floats to be deployed in poorly sampled areas where there is no regular shipping. Sailors got also involved in oceanographic science activities. An example of float deployment is given in the case of the Barcelona World Race. • Next paper by Pouliquen et al. describes the EURO-ARGO ERIC infrastructure which is now officially set-up since May 2014. The objective of the Euro-Argo ERIC is to organize a long term European contribution to the international Argo array of profiling floats. • Le Traon et al. are then presenting how the assessment of the impact of ARGO in Ocean models and satellite validation is conducted in the context of E-AIMS (Euro-Argo improvements for the GMES/Copernicus Marine Service) FP7 project. Observing System Evaluations and Observing System Simulation Experiments have been conducted to quantify the contribution of Argo to constrain global and regional monitoring and forecasting centers and validate satellite observations. Recommendations for the new phase of Argo are also elaborated. • Kolodziejczyk et al. follow with the presentation of the complementarity of ARGO and SMOS Sea Surface Salinity (SSS) observations to help moni- toring SSS variability from basin to meso scale. Using a 4-year time-series of SMOS SSS data and the global Argo array of in situ measurements, a statistical approach and an optimal interpolation method are used to characterize biases and reduce noises. Results are promising and show strong complementarity between SMOS and Argo data. • Herbert et al. then describe Shipboard Acoustic Doppler Current Profilers (SADCP) observations which are carried out in the Tropical Atlantic during yearly cruises in the framework of the PIRATA program. The present note displays the SADCP data processing methodology applied for 8 PIRATA cruises by using CASCADE software. • Cravatte et al. follow with a paper presenting the new international TPOS2020 project (2014-2020). The project objective is to build a renewed, integrated, internationally-coordinated and sustainable observing system in the Tropical Pacific, meeting both the needs of climate research and operational forecasting systems and learning lessons from the great success-and finally partial collapse- of the TAO/TRITON array. • Saout-Grit et al. next present an updated procedure for CTD-oxygen calibration along with new data processing that was applied to hydrographic cruise “BIFURCATION” (September 2012) in the Coral Sea. They describe the content and acquisition models of hydrological and chemical data that are used for the calibration, the post-cruise calibration method and the calibration results. • Dussurget et al. is showing the recent improvement in surface current estimation from satellite altimetry, contributing to a better understanding of the Sea Surface Salinity processes in the Subtropical North Atlantic in the context of the SPURS experiment. • Finally, Mortier et al. are presenting the GROOM project and the Glider European Research Infrastructure. During the last three years, the GROOM community has studied the feasibility and advantages of a European Research Infrastructure for gliders. The design study has proposed operational contours for a future distributed Glider (dedicated) European Research Infrastructure (GERI). We will meet again soon with an issue dedicated to the various achievements of the MyOcean projects now handing over to the EU Copernicus Marine Service. Moreover, we will meet again next year in April 2016 for a new jointly coordinated Newsletter between Mercator Ocean and Coriolis. We wish you a pleasant reading, Laurence Crosnier and Sylvie Pouliquen, Editors. Mercator Ocean—Coriolis Quarterly Newsletter - Special Issue
  • 3. Mercator Ocean – Corolis Special Issue 3#52-May 2015 - Contents: 1.CORIOLIS 2014-2020: AN INTEGRATED IN-SITU OBSERVATION INFRASTRUCTURE FOR OPERATIONAL OCEANOGRAPHY AND OCEAN/CLIMATE RESEARCH ................................................................................................................. 4 By P-Y. Le Traon 2. DEPLOYING ARGO FLOATS IN THE BARCELONA WORLD RACE ...................................................................................... 5 By N. Poffa , N. Lebreton , M. Kramp. 3. THE EURO-ARGO ERIC OFFICIALLY SET UP ......................................................................................................................... 8 By S. Pouliquen, P-Y. Le Traon and Euro-Argo Members and Observers 4. ASSESSESMENT OF THE IMPACT OF ARGO IN OCEAN MODELS AND SATELLITE VALIDATION FROM E-AIMS PROJECT ...................................................................................................................................... 11 By P.Y. Le Traon, E. Remy, J. Ballabrera-Poy 5. ARGO AND SMOS SSS COMBINATION HELPS MONITORING SSS VARIABILITY FROM BASIN SCALE TO MESOSCALE ..................................................................................................................................... 16 By . N. Kolodziejczyk, J. Boutin, O. Hernandez, A. Sommer, G. Reverdin, S. Marchand, N. Martin,J.-L. Vergely, and X. Yin 6. FRENCH PIRATA CRUISES S-ADCP DATA PROCESSING ................................................................................................... 22 By G. Herbert, C. Kermabon, J. Grelet, B. Bourlès 7. TPOS2020: TROPICAL PACIFIC OBSERVING SYSTEM FOR 2020 ..................................................................................... 27 By S. Cravatte, A. Ganachaud, B. Dewitte, F. Hernandez 8. CALIBRATION OF CTD OXYGEN DATA COLLECTED IN THE CORAL SEA DURING THE 2012 BIFURCATION CRUISE ............................................................................................................................... 34 By Carole Saout-Grit, Alexandre Ganachaud, Christophe Maes, Luc Finot, Léocadie Jamet, François Baurand and Jacques Grelet 9. SURFACE CURRENT FIELD IMPROVEMENTS- REGIONAL ALTIMETRY FOR SPURS ..................................................... 39 By R. Dussurget, S. Mulet, M-I. Pujol, A. Sommer, N. Kolodziejczyk, G. Reverdin, M.-H. Rio 10. THE GROOM PROJECT AND THE GLIDER EUROPEAN RESEARCH INFRASTRUCTURE ............................................ 45 By Laurent Mortier, Pierre Testor, Victor Turpin Notebook ....................................................................................................................................................................................... 50 Mercator Ocean—Coriolis Quarterly Newsletter - Special Issue
  • 4. Coriolis 2014-2020: an integrated in-situ ocean observation infrastructure for operational oceanography and ocean/climate research 4#52-May 2015 - CORIOLIS 2014-2020: AN INTEGRATED IN-SITU OCEAN OBSERVA- TION INFRASTRUCTURE FOR OPERATIONAL OCEANOGRAPHY AND OCEAN/CLIMATE RESEARCH P.Y. Le Traon, Ifremer and Mercator Océan Executive Secretary of the Coriolis 2014-2020 governing board The Coriolis structure gathers efforts of seven French institutes (CNES, CNRS, IFREMER, IPEV, IRD, Météo-France, SHOM) to organize the in-situ compo- nent of the French operational oceanography infrastructure. The objective is to organize the data acquisition and real-time/delayed mode data processing of in-situ measurements required for operational oceanography and ocean/ climate research. Coriolis is focused on a limited number of physical and bio- geochemical parameters that are acquired systematically and in real time or slightly delayed mode. Coriolis follows a fully open data policy. The framework of collaboration for Coriolis was renewed in 2014 and now cov- ers the time period of 2014 up to 2020. By signing this new agreement, the sev- en directors of French institutes have clearly stated their willingness to sustain and consolidate further the Coriolis in-situ infrastructure. The new framework agreement strengthens the links between research and operational oceanog- raphy. The scope is also extended to integrate the main French contributions to the global and regional in-situ observing systems: Argo, gliders, research vessels, ship of opportunities, drifting buoys, marine mammals, tidal networks and high frequency coastal observatories. These networks are organized by the different institutes with a pooling of resources for at sea operation, data processing and data dissemination and RD activities. This new framework agreement provides a better integration of the French contributions to the Global Ocean Observing System (GOOS/JCOMM). It also confirms and extends the European mission of Coriolis, in particular, in the framework of Euro-Argo, Emodnet and the Copernicus Marine Service. Coriolis 2014-2020 also features a strengthened organization and governance. A Steering Committee with representatives of all networks and of the three transverse components (at sea operation, data center, RD) is in charge of the scientific and technical management. It reports to a Governing Board (directors of institutes). A Scientific Council (shared with Mercator Ocean) provides the required scientific guidance, in particular, for issues related to the integration with modelling and data assimilation. Mercator Ocean—Coriolis Quarterly Newsletter - Special Issue
  • 5. Mercator Ocean—Coriolis Quarterly Newsletter - Special Issue Deploying ARGO floats in the Barcelona World Race 5#52-May 2015 - DEPLOYING ARGO FLOATS IN THE BARCELONA WORLD RACE By N. Poffa (1) , N. Lebreton (2) , M. Kramp (3) 1 IFREMER, Brest, France 2 SHOM, Brest, France 3 JCOMMOPS, Brest, France Abstract While most Argo floats are naturally deployed by research vessels, a growing number of float operations has been allocated to the sailing community, through ship-based non-governmental organization NGOs or trans-oceanic races in the last few years. The aim is to establish win-win partnerships, with Argo floats being deployed in poorly sampled areas without regular shipping, and to get sailors genuinely involved in oceanographic science activities. In the case of big events, it is also an opportunity for Argo to benefit from broad media coverage, and for the organizers, a chance to display a scientific impact of their projects. Thanks to joint forces of The Coriolis Deployment Team and the IOC-UNESCO/WMO support centre JCOMMOPS, both hosted by Ifremer in Brest, the beginning of 2015 saw probably the so far largest event of that kind, with the deployment of one Argo float by all of the eight crews participating in the Barcelona World Race. In coordination with Coriolis and JCOMMOPS, the race management gave the green light for “Argo day” on the 23rd of January, and eight floats were successfully deployed in the Atlantic Ocean between 24° and 44° south. Meeting the challenges of float deployments in a round-the-world race The history of Coriolis Argo floats with sailing races goes back to 2011-2012 when Stève Ravussin and Michel Desjoyeaux deployed Argo floats from their racing yachts on the way to the departure of the Krys Ocean Race from New York to Brest. Four floats were also deployed the same year by a racing yacht between the Caribbean and Europe. It has now however been a world’s first with all participants of the 2015 Barcelona World Race taking a float onboard per official racing instructions, with a strong cooperation put into place between the race organizer (Barcelona Foundation for Ocean Sailing, FNOB) and IOC-UNESCO/JCOMMOPS, supported by a number of scientific research institutions. It is a very strong commitment from the race and hopefully marks a milestone in “sailing and science” partnerships. Beyond operational needs, it offers the Argo program also an unprecedented outreach potential. After first successful onboard tests, the project was presented at an international press conference at United Nations UN headquarters in New York in summer 2014, and training was given to the skippers in Barcelona before the departure in December 2014. Most sailors were happy to contribute to an oceanographic science program, but they were less keen to embark almost 20kg of additional weight on their yachts; for fair conditions in terms of competition, it was thus agreed to deploy all floats on a carefully chosen “Argo day” (instead of giving a deployment area), allowing for deployments in data sparse areas of the South Atlantic. Apart from one yacht which dismasted after 15 days, abandoned the race and released the float therefore earlier (as per agreement for such a scenario), the other competitors were given the go-ahead 23 days after the departure from Barcelona, when the weather conditions allowed a safe launch and the leading boats were hitting the 40°S latitude. During those 23 days, the floats (as the crews!) were exposed to some intense sailing, meaning a quite rough treatment in terms of shocks and vibrations. The deployment itself was also challenging for some instruments and skippers, who did not reduce the boat speed to the recommended 2 knots to put the floats at sea and instead deployed at impressive 16 knots of boat speed. Despite all that, all floats have entered the operational mode shortly after the deployment and at the time of writing, the eight floats, all of the NKE Arvor Light type, have successfully accomplished at least eight 10-day cycles and performed eight 2000m CTD profiles.   Figure 1: Boat and float positions at Argo day (courtesy of Geovoile and www.barcelonaworldrace.org)
  • 6. Mercator Ocean—Coriolis Quarterly Newsletter - Special Issue Deploying ARGO floats in the Barcelona World Race 6#52-May 2015 - Argo visibility through supportive projects As global climate change has become a vastly discussed topic, public awareness has led to a significant interest in the ways of climate monitoring related systems such as Argo floats. The sailing community being at the forefront of anything that has to do with meteorology and ocean is usually very concerned about research and applied science in those fields. Both sailors and followers of an event such as a round-the-world race are thus a very appreciative audience for a science program linked with the sportive event. Conrad Colman, skipper on Spirit of Hungary put it that way: “As sailors we are naturally hugely affected by the changes in the weather so it feels great to be able to contribute to its greater understanding during our race”, and Anna Corbella, skipper of GAES Centros Auditivos with Gerard Marín, added that “it means a lot to us both to do what we can to help the scientific community while we are sailing this race. [...] It makes us happy to help. We will make a little ceremony to throw the beacon in the water”. The crews did good jobs by posting pictures, videos and comments of their float launch shortly after the operation. Apart from Argo, Coriolis, UNESCO and race websites, the related press release was largely quoted and dozens of articles were published following Argo day, not only in the sailing and the science related press, but also in mainstream media and social networks. It is probably appropriate to state that such a level of communication on Argo, including explanation of the program, the network and the floats themselves was never achieved in such a short period of time. This is largely due to the characteristics of modern ocean racing, where communication is part of the challenge, and where skippers have almost become public relations PR professionals, being able to deliver quality images or video footage as well as live comments in real time. The race website has also proven to be particularly efficient, providing a lot of quality material for the press and the public. As part of the Argo project in the 2015 Barcelona World Race, a partnership between JCOMMOPS and the provider of the mapping tool, Geovoile, was set up in order to display the latest information on these particular Argo floats directly on the race-tracker, together with the yachts (Fig. 1). A simple click on a float gives the user direct access to the corresponding float information from the JCOMMOPS web portal. On the other hand, a special page was set up on the Coriolis Data Center website to follow the floats deployed during the race and to access data. All those efforts coordinated at different levels (Skippers, Coriolis Deployment Team and Data Center, JCOMMOPS, Race Management, Euro Argo...) allowed for a successful operation that will be repeated, and also represents an interesting link to the next edition in 4 years. Follow-up operations have already started, and the Volvo Ocean Race has in March also deployed autonomous oceanographic instruments on the difficult Cape Horn leg from all participating yachts, showing the potential of such partnerships across different ocean observing programs. Figure 2: Floats deployments on Argo day onboard (from left to right) One Planet,One Ocean/Pharmaton, GAES Centros Auditivos and Spirit Of Hungary
  • 7. Mercator Ocean—Coriolis Quarterly Newsletter - Special Issue Deploying ARGO floats in the Barcelona World Race 7#52-May 2015 - Beside the racing community, JCOMMOPS and Coriolis also organize deployments with other sailing ships operating in un- dersampled zones, including traditional tall ships and expedi- tion vessels, but also smaller pleasure yachts if they are or- ganized in NGOs. Without such a NGO framework, efforts for logistics mostly exceed human resources on the science side. Those collaborations help informing the broader public on operational oceanography in general, and on Argo in particu- lar. In this perspective, the Barcelona World Race was also a perfect way to kick off an educational project with 9-year old children from a school in Brest, who met the local skipper Bernard Stamm together with coordinators from Coriolis and JCOMMOPS before his departure to Barcelona. The children then “adopted” his float, and a relationship was maintained during the entire race and beyond in a one year long “sailing and science” project, including a visit of the Ifremer center in Brest during a week of Argo qualification tests, and a meeting with Bernard Stamm back from winning the 2015 edition. Conclusion The deployment of Argo floats in the 2015 Barcelona World Race was challenging in terms of technical constraints on the instrumentation side, but also in terms of logistics for the coordinators, and eventually the deployment operation itself for the skippers, who at the same time participated in a 90 days nonstop -and only double-handed- circumnavigation. It proved to be very successful in all aspects; all floats were deployed and work cor- rectly, and in addition to the operational point of view, it was also an outstanding way for Argo to send a message to the outside world. The feedback from the involved crews is very positive. Given that in many data sparse areas, in particular in the Southern Ocean, racing yachts are often the only available and recurrent volunteer ships, a sound partnership with this community is considered to be of high value and thus continuously enhanced by the operational teams on the scientific side.   Figure 4: Bernard Stamm and Jean Le Cam with their Argo float signed by pupils from Jacques Prévert School in Brest (photo left: Yvon Jezequel / right: Team Poujoulat)   Figure 3: One Planet,One Ocean/Pharmaton skipped by Spaniards Aleix Gelabert and Didac Costa in BWR 2015  
  • 8. Mercator Ocean—Coriolis Quarterly Newsletter - Special Issue The EURO-ARGO ERIC officially set up 8#52-May 2015 - THE EURO-ARGO ERIC OFFICIALLY SET UP By S. Pouliquen(1) , P-Y. Le Traon(2) and Euro-Argo Members and Observers(3) , 1 Euro-Argo ERIC, Plouzané, France 2 IFREMER, Plouzané, France 3 http://www.euro-argo.eu/About-us/The-Partners Abstract In May 2014, the Euro-Argo research infrastructure became a new European legal entity (Euro-Argo ERIC). The objective of the Euro-Argo ERIC is to organize a long term European contribution to the international Argo array of profiling floats. Argo is now the most important global in-situ observing system required to observe and understand the role of the ocean on the earth climate. Euro-Argo is also an essential component of the in-situ infra- structure required for the Copernicus Marine Environmental Monitoring Service (operational oceanography). Euro-Argo will thus develop European contribution to the Global Ocean Observing System (GOOS) and the Global Climate Observing System (GCOS). INTRODUCTION The Argo system (Freeland et al. 2010) is based on an array of profiling floats which measure every 10 days temperature and salinity throughout the deep global oceans, down to 2,000 meters and deliver data both in real time for operational users and, after careful scientific quality control, for climate change research and monitoring. Argo data policy is fully open and guarantees a free access of the data to all interested users. Argo is now the major, and only systematic, source of information and data over the ocean’s interior. Argo aims to establish a global array of in-situ measurements integrated with other elements of the climate observing system (in particular satellite observations) to: • detect climate variability from seasonal to decadal scales and provide long-term observations of climate change in the oceans. • provide data to constrain global and regional ocean analysis and forecasting models • provide data to initialize seasonal and decadal forecasting ocean/atmosphere coupled models and to validate climate models. • provide information necessary for the calibration and validation of satellite data. The EURO-ARGO ERIC The Euro-Argo research infrastructure organizes and federates European contribution to Argo (www.euro-argo.eu); it is part of the European ESFRI roadmap on large research infrastructures. Euro-Argo carried out from January 2008 to June 2011 a preparatory phase project, funded through the EU 7th Framework Research Program, whose main outcome was to agree on the legal and governance framework (Euro-Argo ERIC) under which to establish the research infrastructure. Ministries from 9 European countries (Finland, France, Germany, Italy, Netherlands, Greece, UK, Norway, Poland) have agreed to form this new legal European entity to organize a long-term European contribution to Argo. It was set up by the Commission Implementing Decision (2014/261/EU) of May 5, 2014. The Euro-Argo Research Infrastructure (RI) is a distributed facility (see http:// www.euro-argo.eu). The Euro-Argo infrastructure is made up of a central infra- structure (C-RI) based in France (Ifremer, Brest) which is owned and controlled by the Euro-Argo ERIC and distributed national facilities. The Euro-Argo ERIC and its governance structure (Council, Management Board and Science and Techno- logical Advisory Group) was set up at the creation of the ERIC. It was inaugurated on the 17th July in Brussels, hosted by the French Permanent Representation in Brussels, in presence of representatives of the European Commission and the Ministries of the signatory nations as well as the European institutes involved in Argo. The distributed national facilities operate with direct national re- sources. As part of the Euro-Argo research infrastructure, they agree to a multi-annual commitment of resources (in particular in terms of floats to be deployed and for the data system), and to coordinate their activities through the Euro-Argo ERIC. The Euro Argo ERIC may subcontract some of its activities to the na- tional facilities who have the relevant expertise (e.g. data man- agement and quality control, float deployment), and according to their areas of responsibility. Figure 1: The EURO-ARGO distributed Research Infrastructure Figure 2: Inauguration
  • 9. Mercator Ocean—Coriolis Quarterly Newsletter - Special Issue The EURO-ARGO ERIC officially set up 9#52-May 2015 - EURO-ARGO ERIC role and development The Euro-Argo ERIC priorities are first to maintain and consolidate the global array and regional coverage for European seas by increasing European contribution from 150-200 floats to 250 floats/year and consolidating the data processing system. Secondly the Euro-Argo ERIC will prepare the evolution of Argo to address new scientific and operational challenges and in particular start implementing the new phase of Argo (biogeochemistry, deep ocean, Arctic). The overall objectives of the Euro-Argo ERIC are: • to provide, deploy and operate an array of around 800 floats contributing to the global array (a European contribution of ¼ of the global array); • to provide enhanced coverage in the European regional seas; • to provide quality controlled data and access to the data sets and data products to the research (climate and oceanography) and operational oceanography (e.g. Copernicus Marine Environmental Monitoring Service (CMEMS)) communities; • to prepare the next phase of Argo with an extension to biogeochemical variables, to the deep ocean and the polar regions. These data will be made freely available as a European contribution to the international Argo program. The Euro-Argo ERIC will organize interfaces with operational users and, in particular, with the Copernicus Marine Environmental Monitoring Service and with the ocean and climate change re- search communities. The Euro-Argo ERIC is developing in two phases. In the ramping up phase (2014-mid 2015) the central entity (i.e. the Euro-Argo ERIC) works with a reduced budget funded by the Members and Observers. This budget allows to fund a programme manager a project assistant at 25% and one full time position (project scientist), and to provide basic support to the Euro-Argo RI (e.g. organization of workshops, maintenance of WWW sites includ- ing educational WWW site). In the second phase (mid-2015-onwards) we expect a significant development of the Euro-Argo ERIC up to five persons. In line with the European nature of the infrastructure, a direct EU funding will be set up through the EMFF (European Maritime and Fisheries Fund) to complement national contributions and to ensure that Euro-Argo fulfils its objectives: deploying 250 floats/year (i.e. 25% of the overall international effort), providing high quality observations for ocean and climate research and the Copernicus Marine Environmental Monitoring Service, preparing the European contribu- tion to the next phase of Argo. Benefit for the European community Thanks to a stronger European coordination of float deploy- ments EURO-ARGO ERIC will ensure that certain areas are not overpopulated at the expense of other regions or the global array. Euro-Argo will deliver a stronger and more coherent Eu- ropean contribution to float technology development, with par- ticular emphasis on European needs (e.g. sampling under ice, bio-geochemical sensors) leading to improved capability, perfor- mance and lifetime. The two European Argo data processing centres (Coriolis and BODC) will be strengthen to (i) ensure they are able to process all European floats and deliver the data to users, and (ii) ensure that Europe is able to fulfil its data processing commitments to the global programme (Coriolis GDAC, North Atlantic and Southern Ocean Regional Centres). Euro-Argo will provide a mechanism for developing consistent inputs and a more concerted European voice into the interna- tional Argo programme, resulting in a stronger European influ- ence on how Argo develops in the future. It will also provide the means to sustain important outreach activities (web-site, bro- chures, educational materials etc.) needed to explain to school children and the general public the importance of observations from the oceans towards dealing with climate change and other environmental issues.     Figure 3: In blue: Euro-Argo RI contribution to Argo (Jan 2015) Figure 4: About one hundred scientists met at Centre Ifremer Bretagne from 16th to 20th March 2015 for an “Argo week”.
  • 10. Mercator Ocean—Coriolis Quarterly Newsletter - Special Issue The EURO-ARGO ERIC officially set up 10#52-May 2015 - Dual Use: Research and Operational Oceanography The oceans have a fundamental influence on our climate and weather, both of which are affected by changes in the currents and heat content of the ocean. Argo is a unique system to monitor heat and salt transport and storage, ocean circulation and global overturning changes and to understand the ability of the ocean to absorb excess CO2 from the atmosphere. Long term, global and high quality ocean observations are needed to understand the role of the ocean on the earth’s climate and to predict the evolution of our weather and climate. Concerns about the lack of observations of the key factors that influence the earth’s climate led governments to form the Global Earth Observation System of Systems (GEOSS) and, in Europe, the Earth observation program Copernicus and the European Marine Observation and Data Network (EMODnet) marine data initiative. Argo is the first-ever global, in-situ ocean-observing network in the history of oceanography, providing an essential complement to satellite systems. Argo is a unique system to monitor heat and salt transport and storage, ocean circulation and global overturning changes and to understand the ability of the ocean to absorb excess heat from the atmosphere. One of Argo’s most important contributions so far is a huge improvement in the estimation of heat stored by the oceans - a key factor to gauge global warming and gain a better understanding of the mechanisms behind rising sea level. Argo will be critical for developing reliable seasonal to decadal climate predictions. Argo has brought remarkable advances in ocean forecasting capability and is the single most important in-situ observing system for the Copernicus Marine Environmental Monitoring Service. It provides essential data in near real time to constrain global and regional CMEMS monitoring and forecasting centers. Without Argo, these centers will not be sufficiently constrained and will not be able to serve several key applications. The development of the Euro-Argo ERIC, we will strengthen European contribution to Argo and contribute to a better coverage of the Global Ocean, Atlantic Ocean and European Seas. Argo float deployed and processed by Euro-Argo will directly feed the EMODnet data portals, the Copernicus Marine Environment Monitoring Service and their users. Thanks to the EU funding, the Euro-Argo ERIC jointly with its partners will be able to dem- onstrate that it: • is able to manage a European Contribution to Argo and coordinate its implementation in coherence with the Euro-Argo and international partners. This It will ensure that certain areas are not overpopulated at the expense of others or the global array, • provides a central capability for float testing and preparation (e.g. mission programming, installation of lithium batteries) and storage, • provides enhanced at sea monitoring of the European fleet that will lead to an improvement of the fleet behavior with earlier detection of anomalies, • strengthens the European Argo data processing centers so that they are (i) able to process all European floats and ensure the data are delivered to users, and (ii) ensure that Europe is able to fulfil its data processing commitments to the global program, • improves the data management system and in particular the delayed mode data for research community, • provides the means to outreach activities (web-site, brochures) needed to explain the importance of observations from the oceans towards dealing with climate change and other environmental issues, • is able to extend float coverage into the marginal seas such as Mediterranean and Black Seas and also Nordic Seas and Arctic Ocean, regions which have a significant impact on the Atlantic circulation and climate change impacting Western Europe. Maintaining observations in international waters over the long term is challenging. Frequently monitoring begins as part of a research project but once the concept is proven it can no longer be considered as research and be supported by national or EU research budgets. Furthermore, it is difficult to justify one Member State bearing the costs of an infrastructure that does not principally benefit its own citizens but rather serves the interests of all Member States. The Euro-Argo ERIC will demonstrate in the coming years that it is able to manage a direct EU contribution to the international Argo. Future extensions Finally, Euro-Argo has set up the following priorities for the next five years • Contribute to the global array and sampling of European regional seas. and Improve European coordination. • Work with DG MARE, Copernicus and Emodnet to set up a long term (7-year) EU funding for Euro-Argo • Maximise the relevant knowledge of the Seas and Oceans, e.g. their role in a changing climate (towards deeper measurements). • Continue working with the user communities Develop /extend the user base. Education and outreach • Maintain strong links with Copernicus and Emodnet. • Prepare high quality delayed mode data sets required by ocean and climate change research. • Improving float technology (e.g. extend life time, new sensors) and interactions with float manufacturers. • Prepare the implementation of the new phase of Argo at European level: deep ocean, biogeochemistry and Arctic. Pilot projects, evolution of national roadmaps and new agreements at European level. • Integration of Euro-Argo with other marine research infrastructures: towards an European Ocean Observing References Freeland, H. Co-Authors (2010). “Argo - A Decade of Progress” in Proceedings of OceanObs’09: (http://dx.doi.org/10.5270/OceanObs09.cwp.32)
  • 11. Mercator Ocean—Coriolis Quarterly Newsletter - Special Issue Assessesment of the impact of ARGO in ocean models and satellite validation from E-AIMS project 11#52-May 2015 - ASSESSESMENT OF THE IMPACT OF ARGO IN OCEAN MODELS AND SATELLITE VALIDATION FROM E-AIMS PROJECT By P.Y. Le Traon (1) , E. Remy (2), J. Ballabrera-Poy (3) , 1 Ifremer and Mercator Ocean, Ramonville St. Agne, France 2 Mercator Océan, Ramonville St. Agne, France 3 ICM/CSIC, Barcelona Abstract The main objective of the E-AIMS (Euro-Argo improvements for the GMES/Copernicus Marine Service) FP7 project is to conduct RD activities on Argo float technology, Argo data centers and the design of the new phase of Argo (improved coverage, deep ocean, biogeochemical sensors, polar re- gions) to better answer existing and future needs of the Copernicus Marine Service. Observing System Evaluations and Observing System Simulation Experiments have been, in particular, conducted to quantify the contribution of Argo to constrain global and regional monitoring and forecasting cent- ers and validate satellite observations. Recommendations for the new phase of Argo are also elaborated. A summary of these results is provided here. Context: the Copernicus Marine Service, Argo and Euro-Argo The Copernicus Marine Service through its MyOcean projects has set up a pan-European service for ocean monitoring and forecasting over the global ocean and European seas. In-situ and satellite observations are routinely assimilated in ocean models to provide in real time or in delayed mode (re- analyses) integrated descriptions and short-term forecasts of the ocean physical and biogeochemical state. These core products serve a wide range of applications and users. The delivery of the Copernicus Marine Service strongly relies on the timely provision of both satellite and in-situ observa- tions. While satellites provide a global view of the surface of the oceans, in-situ systems provide complementary data primarily by monitoring their interior. In the context of the Copernicus Marine Service, global to regional scale in-situ observations are required to constrain the models at depth provide calibration and verification data. The Marine Service has thus a very high dependency on in-situ observations. The international Argo programme is a major element of the global in-situ ocean observing system. More than 3500 floats are now globally measur- ing temperature and salinity throughout the deep global oceans, down to 2,000 metres and delivering data both in real time for operational users and after careful scientific quality control for climate change research and monitoring. Argo is the single most important in-situ observing system for the Copernicus Marine Service. It provides essential/critical data in near real time to constrain global and regional data monitoring and forecasting cent- ers and to validate satellite observations. Techniques are also mature and fully demonstrated. Float technology will also evolve in the coming years to include new sensors (e.g. oxygen, biology) and new capabilities (e.g. deep ocean, under ice measurements) that are essential for climate change research and for the Copernicus Marine Service. The Euro-Argo research infrastructure organizes and federates European contribution to Argo (www.euro-argo.eu); it is part of the European ESFRI roadmap on large research infrastructures. Euro-Argo carried out a preparatory phase project, funded through the EU 7th Framework Research Programme, whose main outcome was to agree on the legal and governance framework (Euro-Argo ERIC) under which to establish the research infrastructure. The Euro-Argo ERIC was set up in May 2014; it will allow European countries to consolidate and improve their contribution to Argo international. The main challenges for Argo and Euro-Argo are 1/ to maintain the global array and ensure its long term sustainability and 2/ prepare the next phase of Argo with an extension towards biogeochemistry, the polar oceans, the marginal seas and the deep ocean. Meeting such challenges is essential for the long term sustainability and evolution of the Copernicus Marine Service. This requires major improvements in Argo float technology. New floats with improved capabilities are or will be soon available from float manufacturers. They require, however, extensive testing at sea before they can be used for operational monitoring. The Euro-Argo data centres need also to be upgraded so that they can handle these new floats. The FP7 E-AIMS project E-AIMS (Euro-Argo Improvements for the GMES/Copernicus Marine Service) is an FP7 Space RD project dealing with the in-situ component of Copernicus (see www.euro-argo.eu/E-AIMS). E-AIMS is led by Ifremer and gathers 16 institutions from 9 different countries. E-AIMS will organize an end-to-end evaluation of new Argo floats (from float design down to the use by GMES/Copernicus). Observing System Evaluations and Sensitivity Experiments will also be conducted to provide robust recommendations for the next phase of Argo that take into account GMES/Copernicus Marine Service, seasonal/decadal climate forecasting and satellite validation requirements. E-AIMS will thus demonstrate the capability of the Euro-Argo infrastructure to conduct RD driven by GMES/Copernicus needs and demonstrate that procurement, deployment and processing of floats for GMES/ Copernicus can be organized at European level. These are key aspects for the long term sustainability of GMES/Copernicus in-situ component. At the end of E-AIMS, Euro-Argo should agree on and start implementing the new phase of Argo. This requires demonstrating feasibility and utility which is the very objective of E-AIMS. • Ifremer, France, UKMO, U.K OGS, Italy, NERC/BODC, U.K. KNMI, Netherlands, IEO, Spain, IMR, Norway, USOF, Bulgaria, IOPAS, Poland, Geomar, Germany, Mercator Océan, France, INGV, Italy, CLS, France, ACRI-ST, France, CSIC, Spain, IOBAS, Bulgaria.    
  • 12. Mercator Ocean—Coriolis Quarterly Newsletter - Special Issue Assessesment of the impact of ARGO in ocean models and satellite validation from E-AIMS project 12#52-May 2015 - WP17, 8: Management, Coordination and Communication WP2: RD on float technology. The objective of WP2 is to test several new Argo floats which have been recently developed. These new mod- els of floats require intensive testing before they can be used for opera- tional monitoring. WP2 will organize an end-to-end test of the following new floats: floats with oxygen and biogeochemical sensors, deep floats, floats with improved communication capabilities, Arctic floats.   WP3: Impact and design studies from Copernicus Marine Service and seasonal/decadal modeling and forecasting. The main objective is to perform Observing System Experiments and Observing System Simula- tion Experiment with the Copernicus Marine Service assimilative sys- tems to assess the potential of Argo and its extensions.   WP4: Impact for the validation of satellite observations. WP4 will ana- lyze the use of Argo float data to calibrate, validate and monitor the long term stability of satellite observations. Present and future requirements for satellite Cal/Val activities will be given.   WP5: RD on Euro-Argo data system and interfaces with Copernicus Marine Service. The objective is to improve the Euro-Argo data system to better serve the Copernicus Marine Service and adapt it to the future generation of Argo profiling floats.   WP6: Real time processing, impact and final assessment. The objec- tive is to demonstrate that Euro-Argo data centers can process in real time the new floats developed and tested in WP2, distribute them to MyOcean modeling and forecasting centers and satellite Cal/Val teams as well as to show that these teams can effectively use these new data sets.   An overview of main results from WP3 and WP4 is given in the next sections focusing on aspects directly relevant to the Copernicus Marine Service. Main recommendations are also given in the final section. The project started in January 2013 and will end in December 2015. It is organized along the following work packages:
  • 13. Mercator Ocean—Coriolis Quarterly Newsletter - Special Issue Assessesment of the impact of ARGO in ocean models and satellite validation from E-AIMS project 13#52-May 2015 - Impact and design studies for Copernicus Marine Service monitoring and forecasting centers Several impact and design studies were carried out as part of E-AIMS. Main results related to the Copernicus Marine Service monitoring and forecast- ing centers are given here. Impact of Argo floats have been assessed both at global and regional scales. Global ocean 1-year Observing System Evaluations (OSEs) were carried out with the Mercator Ocean ¼° global data assimilation system. A reference run where all data (satellite altimetry, sea surface temperature, Argo and other in-situ observations) are assimilated is compared to a run without Argo data as- similation or with only half of the Argo data assimilated. A strong impact of Argo data assimilation is identified on temperature and salinity estimates at all depths, linked with an observation minus model forecast error (innovation) reduction both in term of variability and bias. Through Argo assimilation the differences between observation and forecasted fields is thus reduced by about 20% in the 0-300 m depth and from 20% to 65% in the 700-2000 m layers depth (Figure 1). Argo floats are thus crucial in the system to control the model forecasted water properties, from the surface down to 2000m. Not all regions are equally impacted by the Argo observations. The performance of the system is also degraded if only half of the array is assimilated. Time series of the anomaly of heat and salt content for different depth ranges (not shown here) also reveal a strong sensitivity to the density of the Argo array. ARMOR3D Copernicus Multi Observations system developed by CLS has also been used to assess the impact of Argo observations to map temperature and salinity fields together with satellite observations us- ing Degree of Freedom of Signal (DFS) diagnostics. Results show that most of the information comes from the Argo observing system, with al- most no redundancy, then from the satellite dataset (altimetry and SST) and then from the other in-situ instruments (e.g. moorings, XBTs). This demonstrates, once again, the major role played by the Argo observing system. The denial of Argo observations from the Met Office coupled global data assimilation system caused a similar large degradation in ocean tem- perature and salinity innovation statistics. The greatest differences in the upper ocean built slowly over 6 to 12 months and future OSEs investigat- ing the impact of Argo and other ocean observing systems should be run for between 6-months and 1-year. (Figure 2). Case study forecasts with the Met Office ocean/atmosphere coupled system of Hurricane Sandy highlighted that the assimilation of Argo profiles has an impact on the analyzed position of the Gulf Stream, with consequent impacts on fore- casts. However, no systematic improvements of the atmospheric state can be determined without further case studies. A crucial aspect of the coupled model which is expected to influence forecast skill is the diurnal cycle of SST, and high vertical resolution near-surface data will be useful for the assessment of this aspect of the model. A number of Argo profiles already make this data available, and the extension of this to the whole array would be very useful for coupled forecasting, particularly as the cost of the additional measurements is minimal. High vertical resolution near-surface temperature data from all Argo floats would be required for such an application. Observing System Simulation Experiments, where observations are simulated from a fully known ocean simulation, were also carried out to simulate extension of the future deep Argo network and its impact on the Mercator Ocean global ocean data assimilation system. The analy- sis quality at depth greatly benefits from observations deeper than 2000 m, even with a sparser spatial coverage than the surface layers. Deep ocean bias could then be corrected for (Figure 3). The oceans deeper than 2000 m are mainly unobserved as of today and they represent more than 50% of the total ocean volume. Given the role of the deep ocean on the earth climate it is essential to set up a global, long term monitoring system for depths deeper than 2000 m. E-AIMS results show that such deep measurements will be crucial to validate and constrain Copernicus Marine Service models at depth.     Figure 1: OSEs carried out with the Mercator Ocean global data assimilation system. Vertical structure of RMS of temperature innovations (left) and normalized RMS temperature innovations (right) from 0-2000m for Run-Ref (blue) (all observations assimilated), Run-Argo2 (yellow) (half of the Argo data assimilated), Run-NoArgo (green) (no Argo data assimilated) and Free Run (red). Innovations are defined as observation minus model forecast fields. Figure 2: OSEs carried out with the Met Office ocean/atmosphere coupled system. Upper-ocean heat content difference (J, of top 300m) between the control analyses and the no-Argo analyses averaged over October 2012 (control minus no-Argo) global data assimilation system.  
  • 14. Mercator Ocean—Coriolis Quarterly Newsletter - Special Issue Assessesment of the impact of ARGO in ocean models and satellite validation from E-AIMS project 14#52-May 2015 - Mediterranean Sea INGV studied the impact of the Argo horizontal and vertical/time sampling scheme through both OSEs and OSSEs on the quality of the MyOcean Monitoring and Forecasting Center analyses and forecasts. Argo observations produce a reduction of 30% on RMS of the analysis residual (obser- vation minus model background) for temperature and salinity with respect to the free model simulation. If we use only half the Argo fleet, the mean analysis residual in salinity increases by 30% and the RMS error by 10% in the thermocline. OSSEs evidenced that the Argo sampling scheme could be modified to further improve the operational analyses quality. A positive impact has been found when probes have a drifting time of 3 days (as compared to 5 days) and vertical continuous sampling (every meter for Argo) with respect to vertical subsampling as presently done. Full profile transmission could also be considered as a major improvement for the MyOcean Mediterranean analyses. Results from OGS modelling experiments indicate that the assimilation of floats has a small but positive impact on the biological compartment as well. The improvements are located mainly in specific area (e.g. north western region of Mediterranean Sea) and specific period of the year (e.g. winter) when the vertical mixing is relevant for biogeochemical dynamics. Black Sea Experiments with different deployment strategies demonstrated that increasing the amount of Argo floats performs better than increasing the fre- quency of surfacing. Without Argo data, estimates in the upper mixed layer suffer from large errors. Profiling float measurements are very important for depths below the seasonal thermocline because the transition from thermo-to-haline-dominated stratification shows only short spatial covariance length. Another major conclusion from this research is that the present number of Argo floats operating in the Black Sea of about 10 seems optimal for operational purposes. Further increase of this number could be beneficial when addressing specific research questions. Use of Argo for satellite validation The satellite validation studies carried out in E-AIMS have been focused on sea level from satellite altimetry, ocean colour, sea surface temperature and sea surface salinity. It must be noticed that the development stage and maturity of the corresponding satellite missions differ from one to the other. All these satellite missions require, however, to be validated with in-situ measurements and Argo provides unique observations for such a validation. Analyses carried out as part of E-AIMS confirm the high potential of Argo observations for the validation of satellite observations. For some missions (e.g. SSS) they already are the main source of information to validate and monitor the quality of satellite observations. Main findings and results are summarized here: • Satellite altimetry and Argo are quite complementary. Sea Level Anomalies (SLA) from altimeter measurements and dynamic height anomalies (DHA) calculated from the temperature and salinity profiles of the Argo network are strongly correlated and thus, their comparison can be used to detect drifts, anomalies or jumps in altimeter measurements, assess improvements due to altimetry data process standards, or to detect errors in the Argo float time series. Results indicate that the altimeter drift detection and the global statistics of the differences between altimetry and Argo data are only slightly af- fected by a reduction of the number of Argo floats and a reduced spatial coverage of the in-situ network while a reduced temporal sampling of the floats (10 days) could prevent appropriate assessment of the impact of new altimeter standards. Detection of the altimeter drift and the quality assessment of new altimeter standards or products are, however, sensitive to the Reference Depth and would benefit from deeper Argo observations. • Ocean colour remote sensing data (Chlorophyll-a concentration, Chl-a, and diffuse attenu- ation coefficient, Kd) and data derived from bio-profilers (i.e., Chl-a and Kd) are indirect measurements relying on semi-empirical models of the backscattered light at the sea sur- face (remote sensing) and fluorescence (bio-profilers). Direct comparison of two “indirect” sources of observation might therefore allow identifying weakness (or strengths) of both the measurement technology and their semi-empirical transformation. The development of bio-Argo profilers is timely to the calibration/validation of the future Ocean and Land Colour Instrument (OLCI) on board Sentinel 3 planned to launch late in 2015. The ability of bio-Argo floats for the verification of future ocean colour remote sensing missions has been demonstrated through matchups between Chl-a from remote sensing and Chl-a integrated over the upper layer measured by existing bio-Argo floats (Figure 4).     Figure 3: OSSE carried out with the Mercator Ocean global data assimilation model to analyze the sensitivity of results to the assimilation of deep (4000 m) Argo floats. Three month mean temperature difference between the analyzed and the simulated “truth” in the 2000m-4000m layer: on the left without any float diving below 2000 m and on the right with one third of the floats diving up to 4000 m every three 10-day cycle (colour scale between -1 and 1°C).   Figure 4: Matchup between bio-Argo and remotely sensed Chl-a estimates.
  • 15. Mercator Ocean—Coriolis Quarterly Newsletter - Special Issue Assessesment of the impact of ARGO in ocean models and satellite validation from E-AIMS project 15#52-May 2015 - • Satellite sea surface temperature observations (SST) are obtained from infra-red and microwave sensors. They are generally validated with precise in-situ surface observations (in particular from surface drifters). The global coverage of Argo is now providing a very complementary mean for the validation of satellite SST measurements. Argo observations between 3-5 m have been shown to provide a good estimate of SST when compared to the OSTIA (Op- erational SST and Ice Analysis) gridded SST (http://ghrsst-pp.metoffice.com/). The sampling error associated with the monthly mean difference between the OSTIA analysis and near-surface Argo observations has been investigated. The monthly total number of near-surface Argo observations is suitable for a sampling error of 0.03 K for most major ocean regions. Some exceptions are western boundary current regions (0.082 K) and the Polar regions (0.2 K). The monthly total number of near-surface Argo observations currently available is sufficient to identify a statistically significant difference in standard deviation between two analyses where large differences have been found. The Pacific has enough observations to demonstrate statistical differences between the analyses. However, more floats are needed in the North and South Atlantic. Routine monthly validation of OSTIA and GMPE SST products using quality-controlled Argo observations from the EN4 database 2 has now been set up. Time series of global and regional statistics (using the MyOcean region definitions) are freely available on the web: http://ghrsst-pp.metoffice.com/pages/latest_analysis/sst_monitor/argo. • Remotely sensed estimates of sea surface salinity (SSS) can be derived from microwave radiometry at L-band. The Soil Moisture and Ocean Salin- ity (SMOS) and the Aquarius missions have been the first ones designed to provide operational estimates of the global SSS fields. They have been launched in 2009 and 2011 respectively. As of today, the Argo array is the only observing system able to provide global measurements of salinity, al- lowing validation of the retrieval algorithms in different geophysical scenarios (sea surface temperature, surface wind speed and distance to the coast). Comparison of Argo near surface salinity data with satellite SSS products generated by the SMOS Barcelona Expert Centre (http://cp34-bec.cmima. csic.es) have demonstrated this high potential of Argo. It has been noticed that the number of available Delayed Mode profiles has been decreasing during the validation period (2011-2013). If in January 2011 more than 6000 Argo salinity profiles are available, by December 2013, less than 1000 Argo salinity profiles are available (Figure 5). This is due to the time required for the Argo data delayed mode quality control but it would be very im- portant to reduce this time delay and/or to produce intermediate data sets where surface observations are validated. The results indicate that robust estimates of the difference between SMOS and Delayed Argo have been found. The standard deviation of the differences are of the order of 0.29 and 0.23 (in the practical salinity scale) depending if the comparison is done in the latitudinal band of 60S-60N or 30S-30N respectively. Conclusions and recommendations Analyses carried out as part of E-AIMS confirm the very strong impact of Argo observations to constrain global and regional ocean models. The exist- ing Argo observing system should thus be as much as possible stabilized with its actual spatial and temporal coverage and should continue to equally sample the entire world ocean (a decrease of the number of profiles will immediately lead to a degradation of the ocean analyses and forecasts). There is a strong need of deep Argo profiles (coarse resolution) for model validation and data assimilation. Deep observations are mandatory to moni- tor and estimate error on forced and assimilative models at large depths.The assimilation of simulated deep Argo floats shows that deep model bias could be corrected for even if the float sampling is coarse. For the upper ocean and for ocean/atmosphere coupled systems, there is a need of higher resolution close to the surface. Other requirements include the continued production of delayed-mode high quality processing of Argo data with mini- mal time delay (to be used for ocean reanalyses). Optimal drifting time and parking depth are still under investigation and will depend on the regions. In parallel, work should be carried out to improve data assimilation schemes to better use the present Argo profile observations and the future deep/ high vertical resolution observations. Although this was not evaluated per se as part of WP3, Bio-Argo data will also be essential to validate Coperni- cus Marine Service global and regional biogeochemical models and, if the sampling is sufficient, to constrain them through data assimilation. There is now a critical lack of biogeochemical observations and this strongly limits our ability to validate Copernicus Marine Service biogeochemical models. The results of the satellite validation activities suggest that current spatial and temporal coverage of Argo array is suited for validation activities of sea level, SST, Ocean Colour and SSS (especially for monthly validation). However, further improvements that will help to improve the robustness of these validations are: 1) Speeding up the scientific validation of Argo data; 2) increase the depth of the vertical sampling; 3) increase the number of measurements in the upper four meters of the ocean; 4) increase sampling in regions of high variability; 5) network coverage should be enlarged in the Atlantic Ocean and at high latitudes. Bio-Argo profilers are already a unique source of observations for the validation of ocean colour satellites. Development of this new capability will require on the longer run to: 1) Optimize the match-up strategy; 2) program high-frequency profile cycles when located in a biologically stable area; 3) Make use of additional recoverable profilers at launch and recovery times. Acknowledgements The authors wish to thank all the participants of the WP3 and WP4 of the FP7-SPACE E-AIMS project (grant agreement 312642). J. Ballabrera-Poy has also been founded by the Spanish Ministry of Economy through the National RD Plan by means of MIDAS-7 project AYA2012–39356-C05-03.   Figure 5: Number of available profiles from January 2011 to December 2013: Shown are the total number of profiles, the delayed mode profiles, and the number of delayed mode profiles with salinity.
  • 16. Mercator Ocean—Coriolis Quarterly Newsletter - Special Issue ARGO and SMOS SSS combination helps monitoring SSS variability from basin scale to mesoscale 16#52-May 2015 - ARGO AND SMOS SSS COMBINATION HELPS MONITORING SSS VARIABILITY FROM BASIN SCALE TO MESOSCALE By N. Kolodziejczyk(1) , J. Boutin(1) , O. Hernandez(1,2) , A. Sommer(1) , G. Reverdin(1) , S. Marchand(1) , N. Martin(1) , J.-L. Vergely(1) , and X. Yin(1) 1 Sorbonne University/LOCEAN, Paris, France 2 LEGOS/OMP, Toulouse, France Abstract The Soil Moisture and Ocean Salinity (SMOS) mission (European Space Agency) launched in November 2009 provides with measurements of Sea Surface Salinity (SSS) over the global ocean at 45 km resolution every 3 to 5 days. For the first time, the SMOS SSS products are used to monitor and address the distribution of mesoscale feature of the SSS (larger than 50-100km, with 10 day to monthly averages). However, SMOS SSS still experience large biases and noise on various time and space scales which are not yet fully understood. Using a 4-year time-series of SMOS SSS data (mid-2010 to mid-2014) and the global Argo array of in situ measurements as reference data base, a statistical approach and Optimal Interpolation are used to characterize and to correct a large part of the biases and reduce the noise. The results are promising and it shows the strong complementarity between SMOS and Argo data. Introduction Changes to the global water cycle are anticipated as a consequence of the climate change. Actually, precipitation and evaporation fluxes are very dif- ficult to monitor accurately over the global ocean. Measuring ocean salinity has been shown to be a good proxy to monitor the evolution of the water cycle (Terray et al., 2012; Durack and Wijffels, 2010). During last 50 years, the global change in the freshwater balance is responsible for a positive trend in Sea Surface Salinity (SSS) in the Subtropical Atlantic (Curry et al., 2003; Durack and Wijffels, 2010). However, SSS is controlled by various processes and is forced on all scales by: evaporation and precipitation; continental freshwater input (e.g. Dai and Trenberth, 2002); vertical mixing with subsurface water masses (e.g. Kolodziejczyk et al., 2015a); and horizontal advection of salinity at large to submesoscale (e.g. Reul et al., 2014; Kolodziejczyk et al., 2015b,c; Reverdin et al., 2015). These processes need to be well assessed to accurately monitor the freshwater flux from SSS variability. Since the 2000’s, the international Argo Program provides an unprecedented spatial and seasonal coverage of temperature and salinity in situ meas- urements (Gould et al., 2006) with more than 3500 active autonomous profiler floats (https//www.coriolis.eu.org) over the global ocean in 2014. The Argo floats provide profiles of temperature and salinity from 2000 m to the surface (~5 m) every 10 days, i.e. on the order of one SSS measurement every 10 days and every 3°x3°. Derived monthly gridded products such as ISAS (Gaillard et al., 2009) provide an objective mapping at spatial resolu- tion of 300-500 km (depending on the sampling). However, this resolution is still too coarse to assess temporal and spatial mesoscale variability over which SSS is known to vary significantly. SSS at higher spatio-temporal resolution is provided by the Soil Moisture and Ocean Salinity (SMOS) satellite mission (European Space Agency’s water mission) since the beginning of 2010 (Mecklenburg et al., 2012). The targeted accuracy for averages over GODAE (Global Ocean Data As- similation Experiment) scale (100x100 km2) is 0.1 pss. Quality assessment of the SMOS products over 100 x 100 km2 and 10 days revealed an accuracy of 0.3-0.4 pss in the tropical and subtropical regions and of 0.5 pss in the more poleward regions (Boutin et al., 2013; Reul et al., 2013). At mesoscales, the additional information brought by SMOS SSS with respect to other existing in situ networks has been locally demonstrated (Reul et al., 2014; Maes et al., 2014; Hernandez et al., 2014; and Kolodziejczyk et al., 2015b). Nevertheless, in some regions, SMOS data are strongly affected by Radio Frequency Interferences (RFI) (Oliva et al., 2012), and suffer from large biases up to several hundreds of kilometers from coastlines (Reul et al. 2013; Boutin et al., 2013). There are also seasonal and latitudinal biases likely due to imperfect corrections of geophysical signals such as galactic noise scattered by the sea surface and antenna sun heating (Kainulainen et al., 2012). Latitudinal dependency of the satellite microwave SSS accuracy is mainly due to the change of SMOS brightness temperature sensitivity to salinity with sea surface temperature. The latter reaches a maximum in warm Sea Surface Temperature (SST) waters (0.7 K for a SSS variation of 1 at SST of 30°C) and strongly decreases in cold waters (0.2 K for a SSS variation of 1 at SST of 0°C) (Klein and Swift, 1977). Two major goals for SMOS SSS have been identified and are tackled in this newsletter: The first one is to reduce the systematic discrepancies be- tween SMOS and in situ SSS which results from various sources (coastal contamination, solar and galactic noise signals imperfect antenna) and which might be systematic at seasonal and large scale. The second goal is to maximize the signal to noise ratio at mesoscale. Retrieving SSS mesoscale features from SMOS Reul et al. (2014) and Kolodziejczyk et al., (2015b) have respectively shown the SMOS capability at detecting 2D mesoscale SSS features in the region of Gulf Stream and the Azores Front/Current in the North Atlantic. Here, we further present the results of Kolodziejczyk et al. (2015b) in the region of the eastward Azores Current. This region located at the northern edge of the Subtropical North Atlantic SSS maximum (Fig. 1) presents a meridional front which separates salty and oligotrophic, poor in organic matter like chlorophyll-a, water to the south from fresher and eutrophic water masses to the north (Fig. 1). Furthermore, the Azores frontal current is baroclinicaly instable creating mesoscale frontal eddies and meanders of hundred kilometers scales with propagation velocities of about 2.5 cm.s-1 (Alves and Colin de Verdière, 1999).
  • 17. Mercator Ocean—Coriolis Quarterly Newsletter - Special Issue ARGO and SMOS SSS combination helps monitoring SSS variability from basin scale to mesoscale 17#52-May 2015 - The monthly situation of July 2011 is presented (Fig. 1). The Azores front is still identified with a significant gain of details from SMOS SSS over ISAS. It is not identified from satellite SST (Fig. 1a-d; black and magenta curve), as a result of the summer heating of the ocean surface. In order to further illustrate the SMOS mesoscale features, the high resolution monthly ocean color data have been considered (Fig. 1e). The meandering front and associated eddies seen on altimetric currents and salinity are consistently seen from the ocean color data. The current advection appears to shape mesoscale features of tracers (SSS, Chlorophyll-a). In particular, west of 30°W, a series of high (low) salinity and low (high) chlorophyll-a signed anticyclonic (cyclonic) eddies are observed (Fig. 1a,e). They characterize the intrusion of surface waters masses at mesoscale from the both part of the Azores front.   Figure 1: July 2011 monthly mean surface salinity from (a) monthly SMOS L3 and (b) ISAS, surface temperature in °C from (c) TMI and (d) ISAS, (e) MODIS sea surface Chlorophyll-a concentration in log(kg.m-3). Arrows are the monthly mean geostrophic surface velocities from AVISO Ssalto-DUACS product (in m.s-1 ). The thick black contour corresponding to the 8 10-5 s-5 vorticity isoline identifies the Azores Front/Current (vort = f+ξ; where f is the planetary vorticity and ξ is the relative vorticity computed as ξ=∂v/∂x-∂u/∂y). The thick magenta (blue) contours corresponding to the 36.6 isohaline (19 °C isotherm) identify the thermohaline front associated with the Azores front. Colored circles are at the Argo float position and the corresponding near-surface (~5 m depth) salinity and temperature values . The figures correspond to the black square region on the lower corner map (after Kolodziejczyk et al., 2015b) The mesoscale resolution of SMOS SSS data helps interpreting individual Argo measurements (see for instance Argo SSS within an anticyclonic eddy around 36°N-35°W) (Fig. 1a). From Argo measurements, this eddy is suggested by two slightly saltier SSS measurements surrounded by fresher ones (Fig. 1b). This eddy probably detached from the Azores Current front, as suggested by its positive relative vorticity signature, higher salinity and higher chlorophyll-a than the surrounding environment (Fig. 1e). On the other hand, during boreal summer the surface heating of the upper ocean totally masks the frontal and eddy signatures in SST fields. This feature is of course not resolved by the smoothed interpolated ISAS Argo product.
  • 18. Mercator Ocean—Coriolis Quarterly Newsletter - Special Issue ARGO and SMOS SSS combination helps monitoring SSS variability from basin scale to mesoscale 18#52-May 2015 - Although the SSS monthly mesoscale features seen by SMOS qualitatively compare well with in situ and ancillary satellite data sources, the quantita- tive agreements are often poor. For example, the previously documented AC is about 0.1-0.2 pss saltier than the in situ measurement (Fig. 1a). In spite of the different nature of in situ (instantaneous at ~5 m depth) and satellite measurements (averaged over 100km, one month? and in the top centimeter) which may introduce discrepancies sensitive to upper stratification and intermittent precipitations, Hernandez et al. (2014), have shown in the Subtropical North Atlantic that SMOS measurement are subject to strong seasonal and large scale biases up to as large as 0.5 pss during winter months. Furthermore, SMOS SSS individual retrievals at 43 km resolution present small signal over noise ratio (much smaller than 1) which can be minimized only by spatial and temporal averages. Thus, the accuracy of 0.15 pss could only be obtained on SMOS SSS retrieved with ESA version 5 processing at the price of a 100x100 km2 spatial filtering and monthly averaging far from coastal regions where biases are dramatically large (±1.5 pss) (Hernandez et al., 2014). SMOS mapping using Argo data We have chosen a statistical approach to tackle these issues taking advantage of the 4 years of available SMOS data. The SMOS SSS data from ESA L2 version 5 processing has been preliminarily processed following three main steps: i) Estimation and removal of systematic bias near the coast and from some RFI sources. ii) Estimation and removal of large scale and seasonal biases. iii) Smoothing and mapping of corrected SMOS data at mes- oscale. The first step uses a statistical approach to estimate climatological SMOS SSS bias based on an internal consistency check between SMOS SSS measured at various locations within the SMOS swath and an absolute bias correction taken from a 4 year mean of Argo climatology (ISAS), while both the second an third steps use optimal mapping methods, with monthly ISAS products as first guess. As done in Hernandez et al. (2014) and Kolodziejczyk et al. (2015b) independent thermosalinograph (TSG) data from ships of opportunity – not included in the ISAS analysis – are used to validate and assess the L2 SMOS SSS corrections.   Figure 2: a) Monthly ISAS SSS interpolated on 7 October 2012. b) 10 days L3 SMOS SSS from CEC-LOCEAN over the period 1-10 October 2012. c) Weekly SMOS OI SSS over the period 4-10 October 2012 (in pss) and M.S. ‘Santa-Cruz’ route between 8-15 October 2012 (dashed black). Corresponding weekly AVISO surface currents are overlaid (in m.s-1 ).
  • 19. Mercator Ocean—Coriolis Quarterly Newsletter - Special Issue ARGO and SMOS SSS combination helps monitoring SSS variability from basin scale to mesoscale 19#52-May 2015 - • Systematic bias corrections (coastal bias and some RFIs) As shown between 1-11 October 2012 (Fig. 2), large discrepancies are observed in the coastal regions between 10 days L3 CATDS CEC-LOCEAN gridded products (100x100km2 ; Fig. 2b) and monthly ISAS climatology (Fig. 2a). They can exhibit amplitudes larger than ±1.5 pss and produce large scale salinity artifacts up to several hundred kilometers (800 km) from the coasts (Reul et al. 2014; Boutin et al., 2013) which are especially well defined along the Western African coast. The coastal biases has been shown on brightness temperatures to come from a shadowing of the continent (Reul et al. 2012; Boutin et al., 2013; pola- rimetry validation report available on http://smosp.acri.fr/docs/vr.pdf; section 3.2.2). SSS is retrieved from about 100 brightness temperatures measured in various parts of the SMOS field of view at various incidence angles so that the contamination by the land on these Tbs depend on the orientation of the cost line and on the emissivity of land. Hence, in our method we estimate a contamination in SSS for each pixel as a function of the location within the swath. The 4 years of SMOS data and Argo climatology (mid-2010-mid-2014) have allowed characterizing systematic near coastal discrepancies. The bias correction is eventually applied at each individual L2 SMOS SSS retrieval. • Large scale and seasonal orbit biases corrections In the Subtropical North Atlantic, Hernandez et al., (2014) have applied a raw seasonal correction for the large scale biases. They estimate the biases for each month by comparing the monthly ISAS products and SMOS products averaged in their study area, i.e. they basically use in situ measurements to adjust the mean SMOS measurement over the Subtropical North Atlantic SSS maximum. As a preliminary noise reduction, we first selected a low pass filtered (2 pixels half window running mean) along dwell lines the L2 SMOS SSS data over a 10 day period for both ascending and descending orbits. Then, ascending and descending orbit data are first mapped separately with an optimal interpolation scheme at large scale (500 km) with a Gaussian shaped correlation function. The seasonal and large scale biases are deduced from the comparison of ascending and descending large scale maps and monthly ISAS SSS product. Then, these estimated seasonal and large scale biases are removed from the L2 SMOS data set. This approach is analog to Reynolds (1988), who used available in situ data measurements to correct large scale retrieved SST from infrared radiometer satellite daytime and nighttime measurements which had been contaminated by the volcanic aerosols from Mont Pinatubo eruption during the 1991-92 years. • Reduction of noise and optimal mapping The last step is a noise reduction and mapping every 7 days using optimal interpolation with a Gaussian correlation function scaled to 75 km over a window of 10 days of L2 SMOS SSS data centered on the day of mapping, using the corresponding monthly ISAS SSS fields as first guess. Remaining biases between different dwell lines of different orbits have been corrected (for more details see Le Traon et al., 1998). At mesoscale, it is hypothesized that SSS features are also strongly constrained by mesoscale current advection. Therefore, an additional correlation scale is included in Gaussian cor- relation function involving a larger correlation along-stream-lines computed from AVISO Ssalto-DUACS altimetric products (Nardelli, 2012). This improved mapping method allows recovering spatial scales slightly smaller than 75 km and improves the geometry of the synoptic features (Fig. 2c). Figure 2c shows preliminary results for the weekly SMOS OI field compared with the L3 SMOS CEC-LOCEAN products between 4-10 October 2012. As hoped for, the coastal and large scale biases appear to be absent. This is confirmed by direct comparison along independent TSG SSS transects which exhibit a much improved agreement especially along the coast and in the tropical region of Inter-Tropical Convergence Zone where strong SSS meridional gradients are present (Fig. 3). Preliminary comparisons with independent TSG data – not included in ISAS product - provide an estimate of the improvement in biases, RMSD (Root Mean Square Difference) and correlation between 10 day L3 LOCEAN products and SMOS OI (Fig. 2 and 4). This mapping procedure strongly reduces the biases (0.2 pss; Fig. 4b) of weekly SSS fields. The RMSD from TSG measurements is on the average improved from 0.53 pss to 0.38 pss over the whole set of valid TSG transects (Fig. 4b). Note that, in re- gions of low SSS variance (far from the rivers run off), such as in the SSS maximum region, the RMSD is less than 0.2 pss (not shown). In the ITCZ area (0-15°N), the SSS gradients are also well reproduced with RMSE on the order of 0.2 pss (Fig. 3 and 4b). This is better than previously expected from 10 days L3 SMOS SSS retrievals (Fig. 4b). Along the TSG sections, the TSG-SMOS OI correlation is also improved (Fig. 4d). This has been possible only because mesoscale features are resolved in SMOS SSS data (Reul et al., 2014; Hernandez et al., 2014; Kolodziejczyk et al., 2015b), but is strongly improved by bias corrections and noise filtering. It is however worth commenting that bias corrections and mapping methods perform better in region where raw L2 SMOS SSS data are less affected by noise and bias contaminations. Many artifacts and unexplained contaminations are left that deserve further work.   Figure 3: a) SSS colocated along M.S. ‘Santa-Cruz’ route (see Fig. 2c) from thermosalinograph (red), ascending (magenta) and descending (cyan) SMOS orbits corrected from coastal bias, SMOS OI SSS (black) and monthly ISAS climatology (blue). b) Comparison between TSG SSS and SMOS SSS. The color code is the same as in Fig. 3a.
  • 20. Mercator Ocean—Coriolis Quarterly Newsletter - Special Issue ARGO and SMOS SSS combination helps monitoring SSS variability from basin scale to mesoscale 20#52-May 2015 -   Conclusion This preliminary work shows a very high complementarity between SMOS and Argo data. SMOS SSS measurements provide for the first time mesoscale resolution maps with an unprecedented coverage in regions poorly sampled by Argo array. Argo provides high quality data at large scales which greatly helps L2 SMOS SSS calibration. Ongoing work is to better quantify the accuracy of the new SSS products and improve the mapping methods. While the present work focuses on a bias correction method applied onto retrieved SSS, it is worth noticing that these biases originate from systematic biases on Tbs. In parallel to these efforts in correcting SSS biases, the reduction of biases at Tb level is under study by other SMOS teams. Acknowledgements N.K. was supported by a CNES post-doctoral grant. O.H. was supported by SMOS+SOS project. A. S. was supported by a CNES doctoral grant. SMOS data are from ESA level 2 version 5 products. Argo float data were collected and made freely available by the International Argo Program and the national programs that contribute to it. The Argo Program is part of the Global Ocean Observing System. TSG SSS data are made freely available by SO SSS at LEGOS (www.legos.obs-mip.fr/observations/sss) and from UK Voluntary Observing Ship Program from SOCAT archives. ISAS Argo interpolated prod- ucts are provided by Fabienne Gaillard at SO Argo (wwz.ifremer.fr/lpo/SO-Argo/Products/ISAS-T-S-fields). Satellite altimetry and surface current data are produced and made freely available by AVISO (www.aviso.altimetry.fr). SST TMI data are provided by Remote Sensing Systems (www.remss.com/ missions/tmi). MODIS ocean color data (chlorophyll-a) are provided by NASA (oceancolor.gsfc.nasa.gov/cms/). Figure 4: In situ and SMOS SSS comparison (0.25°-10 day) statistics along the available TSG transects between 2011-2013 (a): Bias (b); Root Mean Square Difference (c); and correlation (d) for 10 days L3 SMOS LOCEAN prod- ucts (gray crosses) and SMOS OI (circle). Differences between SMOS L3 and SMOS OI is identified by a gray vertical segment. The color of the circle refers to the merchant ship (Black: M.S. Colibri; red: M.S. Toucan, blue: M.S. Santa-Cruz; green: UK VOS)
  • 21. Mercator Ocean—Coriolis Quarterly Newsletter - Special Issue ARGO and SMOS SSS combination helps monitoring SSS variability from basin scale to mesoscale 21#52-May 2015 - References Alves J. L.G. R., and A. Colin de Verdière (1999), Instability Dynamics of a Subtropical Jet and Applications to the Azores Front Current System: Eddy- Driven Mean Flow, J. Phys. Oceanogr., 29, 832-864. Boutin, J., N. Martin , G. Reverdin , X. Yin , and F. Gaillard (2013), Sea surface freshening inferred from SMOS and ARGO salinity: impact of rain, Ocean Sci., 9, 183–192 , doi:10.5194/os-9-183-2013. Curry, R., B. Dickson, and I. Yashayaev (2003), A change in the freshwater balance of the atlantic ocean over the past four decades, Nature, 426 (6968), 826-829. Dai, A., and K. E. Trenberth (2002), Estimates of freshwater disharge from continents: Latitudinal and seasonal variations, Journal of Hydrometeorology, 3(6), 660-687. Durack, P. J., and S. E. Wijffels, (2010), Fifity-Years Trens in Global Ocean Salinities and Their Relationship to Broad-Scale Warming, J. Clim., 23, 4342- 4362. Gaillard, F., E. Autret, V. Thierry, P. Galaup, C. Coatanoan, and T. Loubrieu (2009), Quality Control of Large Argo Datasets, J. Atmos. And Oceanic Tech., 26, 337-351. Gould, W. J., J. Turton, (2006), Argo- Sounding the oceans, Weather, 61(1), 17-21. Hernandez, O., J. Boutin, N. Kolodziejczyk, G. Reverdin, N. Martin, F. Gaillard, N. Reul, and J.-L. Vergely, (2014), SMOS salinity in the subtropical north Atlantic salinity maximum. Part I: Comparison with Aquarius and in situ salinity, J. Geophys. Res., in press, doi: 10.1002/2013JC009610. Kainulainen, J., Colliander, A., Closa, J., Martin-Neira, M., Oliva, R., Buenadicha, G., Rubiales Alcaine, P., Hakkarainen, A., and Hallikainen, M. T. (2012), Radiometric Performance of the SMOS Reference Radiometers – Assessment After One Year of Operation, IEEE Trans. Geosci. Remote Sens., 50, 1367–1383, doi:10.1109/tgrs.2011.2177273. Klein, L., and C. Swift (1977), An improved model for the dielectric constant of sea water at microwave frequencies, Oceanic Engineering, IEEE Journal of, 2(1), 104-111, doi:10.1109/TAP.1977.1141539. Kolodziejczyk, N., G. Reverdin, and A. Lazar, 2015a: Interannual variability of the mixed layer winter convection and spiciness generation in the Eastern Subtropical North Atlantic, Journal of Physical Oceanography, 45(2), 504-525. doi:10.1175/JPO-D-14-0042.1 Kolodziejczyk, N., O. Hernandez, J. Boutin, and G. Reverdin, 2015b: SMOS salinity in the subtropical north Atlantic salinity maximum: 2. Bi-dimensional horizontal thermohaline variability, Journal of Geophysical Research, SMOS/Aquarius Special issue, doi: 10.1002/2014JC010103 Kolodziejczyk, N., G. Reverdin, J. Boutin, and O. Hernandez, 2015c: Observation of the surface horizontal thermohaline variability at meso- to sub- mesoscales in the North-Eastern Subtropical Atlantic Ocean. Journal of Geophysical Research. doi: 10.1002/2014JC010455 Le Traon, P. Y., F. Nadal, and N. Ducet, 1998: An Improved Mapping Method of Multisatellite Altimeter Data, Journal of Atmospheric and Oceanic Technol- ogy, 15, 522-534. Maes C., N. Reul, D. Behringer, and T. O’Kane, 2014: The salinity signature of the equatorial Pacific cold tongue as revealed by the satellite SMOS mis- sion, Geoscience Letters, 1(1), 1-17, doi:10.1186/s40562-014-0017-5 Mecklenburg, S., et al. (2012), ESA’s soil moisture and ocean salinity mission: mission preformance and operations, IEEE Transactions on Geoscience and Remote Sensing. 50(5), 1354-1366, doi:10.1109/TSGRS. 2012.2187666. Nardelli, B. B., (2012), A Novel Appreach for the High-Resolution Interpolation of In Situ Sea Surface Salinity, J. Atm. Oc. Tech., 29,867-879. Oliva, R., E. Daganzo-Eusebio, Y. H. Kerr, S. Mecklenburg, S. Nieto, P. Rchaume, and C. Gruhier (2012), SMOS Radio Frequency Interference scenario: Status and actions taken to improve the RFI environment in the 1400-1427-MHz passive band, IEEE Trans. Geos. Remote Sens., 30, 5, 1427-1439. Reul, N., B. Chapron, T. Lee, C. Donlon , J. Boutin and G. Alory , 2014: Sea Surface Salinity structure of the meandering Gulf Stream revealed by SMOS sensor, Geophys. Res. Lett., doi:10.1002/2014GRL059215 Reul, N., S. Fournier, J. Boutin, O. Hernandez, B. Chapron, G. Alory, Y. Quilfen, J. Tenerelli, S. Morriset, Y. Kerr, S. Mecklenburg, and S. Delwart,2013, Sea Surface Salinity Observations from Space with the SMOS Satellite: A New Means to Monitor the Marine Branch of the Water Cycle, Surveys of Geophys, 1-42, doi:10.007/s10712-013-9244-0. Reverdin, G, S. Morisset, L. Marié, D. Bourras, G. Sutherland, B. Ward, J. Salvador, J. Font, Y. Cuypers, L. Centurioni, V. Hormann, N. Kolodziejczyk, J. Boutin, F. D’Ovidio, F. Nencioli, N. Martin, F. Diverres, G. Alory, and R. Lumpkin, 2015: Meso-scales, fronts and mixing in the stratified surface ocean during the STRASSE/SPURS summer 2012 cruises, Oceanorgraphy, 28(1):84–93, doi:10.5670/oceanog.2015.09. Reynolds, R. W., (1988), A Real-Time Global Sea Surface Temperature Analysis, J. Clim., 1, 75-86. Terray, L., L. Corre, S. Cravatte, T. Delcroix, G. Reverdin and A. Ribes (2012), Near-Surface Salinity as Natrue’s Rain Gauge to Detect Human Influence on the Tropical Water Cycle, J. Clim, 25, 958-977, doi:http://dx.doi.org/10.1175/JLCLI-D-10-05025.1
  • 22. Mercator Ocean—Coriolis Quarterly Newsletter - Special Issue French PIRATA cruises S-ADCP data processing 22#52-May 2015 - FRENCH PIRATA CRUISES S-ADCP DATA PROCESSING By G. Herbert(1) , C. Kermabon(2) , J. Grelet(1) , B. Bourlès(1) 1 IRD, Brest, France 2 IFREMER, Brest, France Abstract In the framework of the PIRATA program, several types of observations are carried out in the Tropical Atlantic during yearly cruises, including Shipboard Acoustic Doppler Current Profilers (SADCP) data. The present note is a brief review of the SADCP data processing methodology applied for 8 PIRATA cruises by using CASCADE software. To illustrate the processing steps and demonstrate the CASCADE software capabilities, an example of SADCP data processing obtained from PIRATA-FR24 cruise has been shown. This data set is made available on the PIRATA website and will also be used in the framework of the EU PREFACE program (see http://preface.b.uib.no/). Introduction The PIRATA (Prediction and Research Moored Array in the Tropical Atlantic) observing network is a contribution to the GOOS (Global Ocean Observing System), GCOS (Global Climate Observing System), and the GEOSS (Global Earth Observing System of Systems), endorsed by the international pro- gram CLIVAR (CLImate VARiability and predictability). Launched in 1997 thanks to a multinational cooperation between France (IRD and Météo-France), Brazil (INPE) and USA (NOAA), PIRATA mostly maintains 18 meteo-oceanographic buoys (ATLAS system; see www.pmel.noaa.gov/tao/ for detail) by carrying out yearly cruises for their servicing (Bourlès et al., 2008). In France, PIRATA is recognized as a National Observatory (“Service National d’Observation”), and yearly cruises also allow, in addition to ATLAS buoys servicing, to carry out different opportunity operations (e.g. ARGO autonomous profilers deployments) and to get several types of observations along repeated track lines, including oceanic currents from Ship mounted Acoustic Dop- pler Current Profiler (SADCP; see http://www.brest.ird.fr/pirata/index_fr.php). After a brief reminder of ADCP principle and a description of main character- istics of SADCP instrument onboard different research vessels used for PIRATA cruises, we present the SADCP data processing that has been applied for 8 PIRATA cruises carried out from 2007 to 2014, by using the CASCADE (Chaîne Automatisée de Suivi des Courantomètres Acoustiques Doppler Embarqués) software (Le Bot et al., 2011). An example of SADCP data processing obtained from one PIRATA cruise is also shown. Shipboard Acoustic Doppler Current Profilers (SADCP) 2.1 Principle We recall here the principle of the ADCP measurements, in order to better understand the data processing steps detailed afterwards. ADCP estimates horizontal and vertical velocity of flowing water with sound, using the principle of Doppler Effect. It does so by emitting « pings» of acoustic signal at a known and constant frequency into the water. The acoustic pulses ricochet off small particles suspended in the moving water (plankton, sediments, or other solid particles) and reflect back to the transducer with a slightly changed frequency. The ADCP uses the Doppler frequency shift of this backscattered signal measured by the transducer to measure the fluid velocity along the beam path. For measuring the three velocity components of the current, ADCP usually uses four beams inclined from the vertical plane at an angle θ (called ‘beam angle’) and pointing in different directions. In this configuration, ADCP estimates horizontal and vertical velocities and also an error used to qualify the data. The deter- mination of the Doppler frequency is made by considering the ensemble of signal in time windows, which define cells or ‘bins’. The accuracy of the measure, the vertical resolution and the acoustic noise, depends on the ADCP‘s type (Broadband or Narrowband) and on the frequency of the SADCP instrument (typically: 38, 75, 150, 300, 600 or 1200 kHz). Low frequency systems provide long range and low resolution measurements, while high frequency systems have shorter ranges with much higher resolution. 2.2 ADCP onboard PIRATA research vessels Table 1 below presents the summary of the 8 cruises carried out from 2007 to 2014 in the framework of the PIRATA program, and the frequency of ship-mounted SADCP instrument used for each cruise. For the 4 first cruises onboard the R/V L’Antéa, an Ocean Surveyor 75 kHz system was used while it was a broad-band 150 kHz system for the 4 last cruises onboard the R/V Le Suroit. The 75 kHz ADCP are suited for a range about twice as deep as the 150 kHz (about 600 meters in broad-band mode). The standard deviation of velocity data obtained using broad-band ADCPs are signifi- cantly lower than that for narrow-band ADCPs, but the range is shallower. For all these PIRATA cruises, the vertical profiling resolution was nominally 8 m (= bin size) for the 150 and 75 kHz ADCPs. For additional background and references on the oceanographic application of shipboard ADCPs, see e.g. Firing and Hummon (2010). Greenland Month Year Latitudinal Range Research Vessel SADCP (KHz) PIRATA-FR16 5 - 6 2007 0° - 15°N L’Antéa OS75 PIRATA-FR17 6 - 7 2007 10°S - 5°N L’Antéa OS75 PIRATA-FR18 9 - 10 2008 10°S - 15°N L’Antéa OS75 PIRATA-FR20 9 - 10 2010 10°S - 15°N L’Antéa OS75 PIRATA-FR21 5 - 6 2011 10°S - 15°N Le Suroit BB150 PIRATA-FR22 3 - 5 2012 10°S - 15°N Le Suroit BB150 PIRATA-FR23 5 - 6 2013 10°S - 15°N Le Suroit BB150 PIRATA-FR24 4 - 5 2014 10°S - 15°N Le Suroit BB150 Table1: Summary of the 2007-2014 PIRATA oceanographic cruises and frequency used by SADCP for each cruise
  • 23. Mercator Ocean—Coriolis Quarterly Newsletter - Special Issue French PIRATA cruises S-ADCP data processing 23#52-May 2015 - To estimate the absolute current velocity in earth coordinates, one needs to remove the ship movement using the best navigation data available (position, speed, tilt, heading). This information is provided by specific instruments that depend upon the ship. During the PIRATA cruises addressed here, the ship’s position, pitch, roll and heading onboard the R/V Le Suroit are measured by an inertial navigation system based on fiber-optic gyro- scope technology which integrated GPS information, whereas they are provided by an optical gyrocompass and motion sensor parted from a high precision GPS system onboard the R/V L’Antéa. The transformation from beam ADCP to earth coordinates is performed using the Vessel-Mounted Data Acquisition System (VmDAS). VmDAS is the constructor’s software (RDI’s software) used for RDI ADCP acquisition. It generates files contain- ing averages mono-ping ADCP data and best navigation data available. The ADCP velocities recorded are relative to the ship, in earth coordinates and averaged in time: FILE.STA files for ‘Short Term Average’ with 2 minutes averages and FILE.LTA files for ‘Long Term Average’ with 10 minutes averages, for instance. These files are then processed and analyzed by the Matlab CASCADE software (“Chaîne Automatisée de Suivi des Couran- tomètres Acoustiques Doppler Embarqués”). The following section presents the CASCADE software and gives a brief review of the basic post-cruise processing steps realized after the cruise. Processing and quality checks of SADCP data The data processing software: CASCADE CASCADE is a Matlab software developed by the Laboratory of Physical Oceanography (Le Bot et al., 2011) in order to process Vessel-mounted ADCP data collected along vessel transects. The programs have been specifically tested for Windows and Linux and can be downloaded from: http:// wwz.ifremer.fr/lpo/Le-Laboratoire/Actualites/CASCADE-V6.2. It is used in different research organisms and has been implemented in operational mode by the data center SISMER (“Systèmes d’Informations Scientifiques pour la MER”) at IFREMER. Regular updates of the software are made in order to take into account the users feedbacks and the suggestions of improvements. The CASCADE inputs files are the binary FILE.STA/FILE.LTA files obtained from the acquisition software VmDAS. In our case, we used the version 6.2 of CASCADE to analyze and process the SADCP data collected during 8 PIRATA cruises carried out between 2007 and 2014 in the eastern tropi- cal Atlantic (see table 1). In the following section, we describe briefly the main processing steps of CASCADE software. Overview of ADCP data cleaning stages in CASCADE Complete cleaning of ADCP data requires several steps. CASCADE first converts the FILE.STA/FILE.LTA files generated by VmDAS software into a single NetCDF file containing all the information but also the absolute current velocities in earth coordinates calculated from the relative and ship ve- locities. From this NetCDF file, the user can add important external ancillary data (like estimations of bathymetry and barotropic tide for example), flag the velocity data according to adjustable parameters, estimate and apply rotations of the ADCP coordinate system to realign it with the ship system, and, finally, smooth the data in time and/or depth. At the end of the cleaning stage, the three components of the absolute current velocity (U, V, W) are flagged 1 (good), 2 (dubious) or 3 to 9 (bad). The cleaning and correction are an iterative process. Automatic and visual quality checks of the data help the user to choose the best cleaning parameters and the best ADCP correction (misalignment/amplitude) if needed. It is also possible to flag suspect data manually between two dates or two ensembles. When the current data are supposed to be the best, the user can create section and/or station files. These files contain the absolute current velocities re-averaged in space (for the section file) or time (for the station file). From these averaged section/station files, user can plot the absolute velocities as vectors or contouring plots. Example of processed SADCP data obtained from PIRATA-FR24 cruise. In this section, an example of PIRATA SADCP data processed with CASCADE software is presented, i.e. the data collected during the leg1 of the PIRATA-FR24 cruise from April 9 to May 22, 2014 aboard the R/V Le Suroit from Dakar (Senegal) to Abidjan (Ivory Coast) (figure 1). The velocity and direction of the currents were measured along the route by a BB150 SADCP (table 1), able to investigate the current field down to nearly 250 m. For this cruise, data were acquired with a blanking interval of 4m and vertical bin size of 8m and were preliminary processed onboard with the VmDAS software. Only the data processed after the cruise by CASCADE software (version 6.2) from VmDAS FILE.STA files (pings averaged in two minutes ensembles) are presented.   Figure 1: Track of the leg1 of PIRATA-FR24 cruise.
  • 24. Mercator Ocean—Coriolis Quarterly Newsletter - Special Issue French PIRATA cruises S-ADCP data processing 24#52-May 2015 -   Figure 2: Mean Echo Intensity (upper plot) and percentage of good data (lower plot). Some controls about the quality of the data can be made before the processing. The Percent Good variable plotted on figure 2 represents the percent- age of pings using the four beams for each two-minute average ensemble. Data are considered as acceptable data when the percentage is 10 %. The percentage of good data is highest for the bins near the surface and rapidly falls below 50 % at some depth. This feature is the basic profile usually observed and indicates that the ADCP data quality for this cruise is rather good. Nevertheless, a decrease of the percentage of good data happens locally for shallow cells (around the ensembles 6000 and 12500), associated to a low echo intensity, indicating that the signal-to-noise for these water cells is also low, maybe due to the presence of passive backscatters. The CASCADE cleaning data step gives the following result: Flag Meaning Percent on the whole ensembles 1 Good data 55.86 % 2 Doubtful data 0.89 % 3 Bad data: median filter over 20 ensembles beyond 3 standard deviations. 0 % 4 Vertical shear 0.2 s-1 0 % 5 Vertical current speed 100 cm/s PGOOD_ADCP 10% 0 % 6 Horizontal current speed component 4 m/s 0 % 7 Missing data 43.25 % 8 Data under the bottom (bottom ping) 0 % 9 Manual invalidation between 2 ensembles 0 % Table 2: Flags attributed to the PIRATA-FR24 SADCP data (leg1 only) using CASCADE software.