Download to read offline
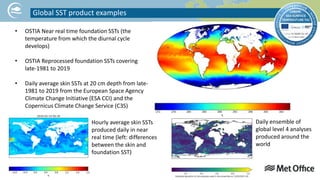
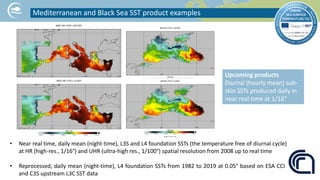
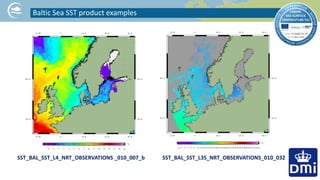
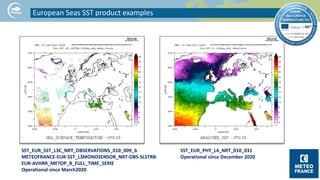
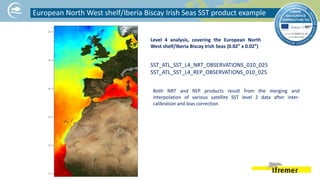

This document provides examples of global and regional sea surface temperature (SST) data products. It lists near real-time and reprocessed foundation SST datasets at various spatial and temporal resolutions going back to the early 1980s. Upcoming hourly and sub-skin SST products are also mentioned. Specific examples of SST products are given for the Mediterranean/Black Seas, Baltic Sea, European Seas, and North West shelf/Iberia/Biscay/Irish Seas regions.


![[Year 2012-13] Wimax](https://cdn.slidesharecdn.com/ss_thumbnails/ppt-180701102645-thumbnail.jpg?width=640&height=640&fit=bounds)


