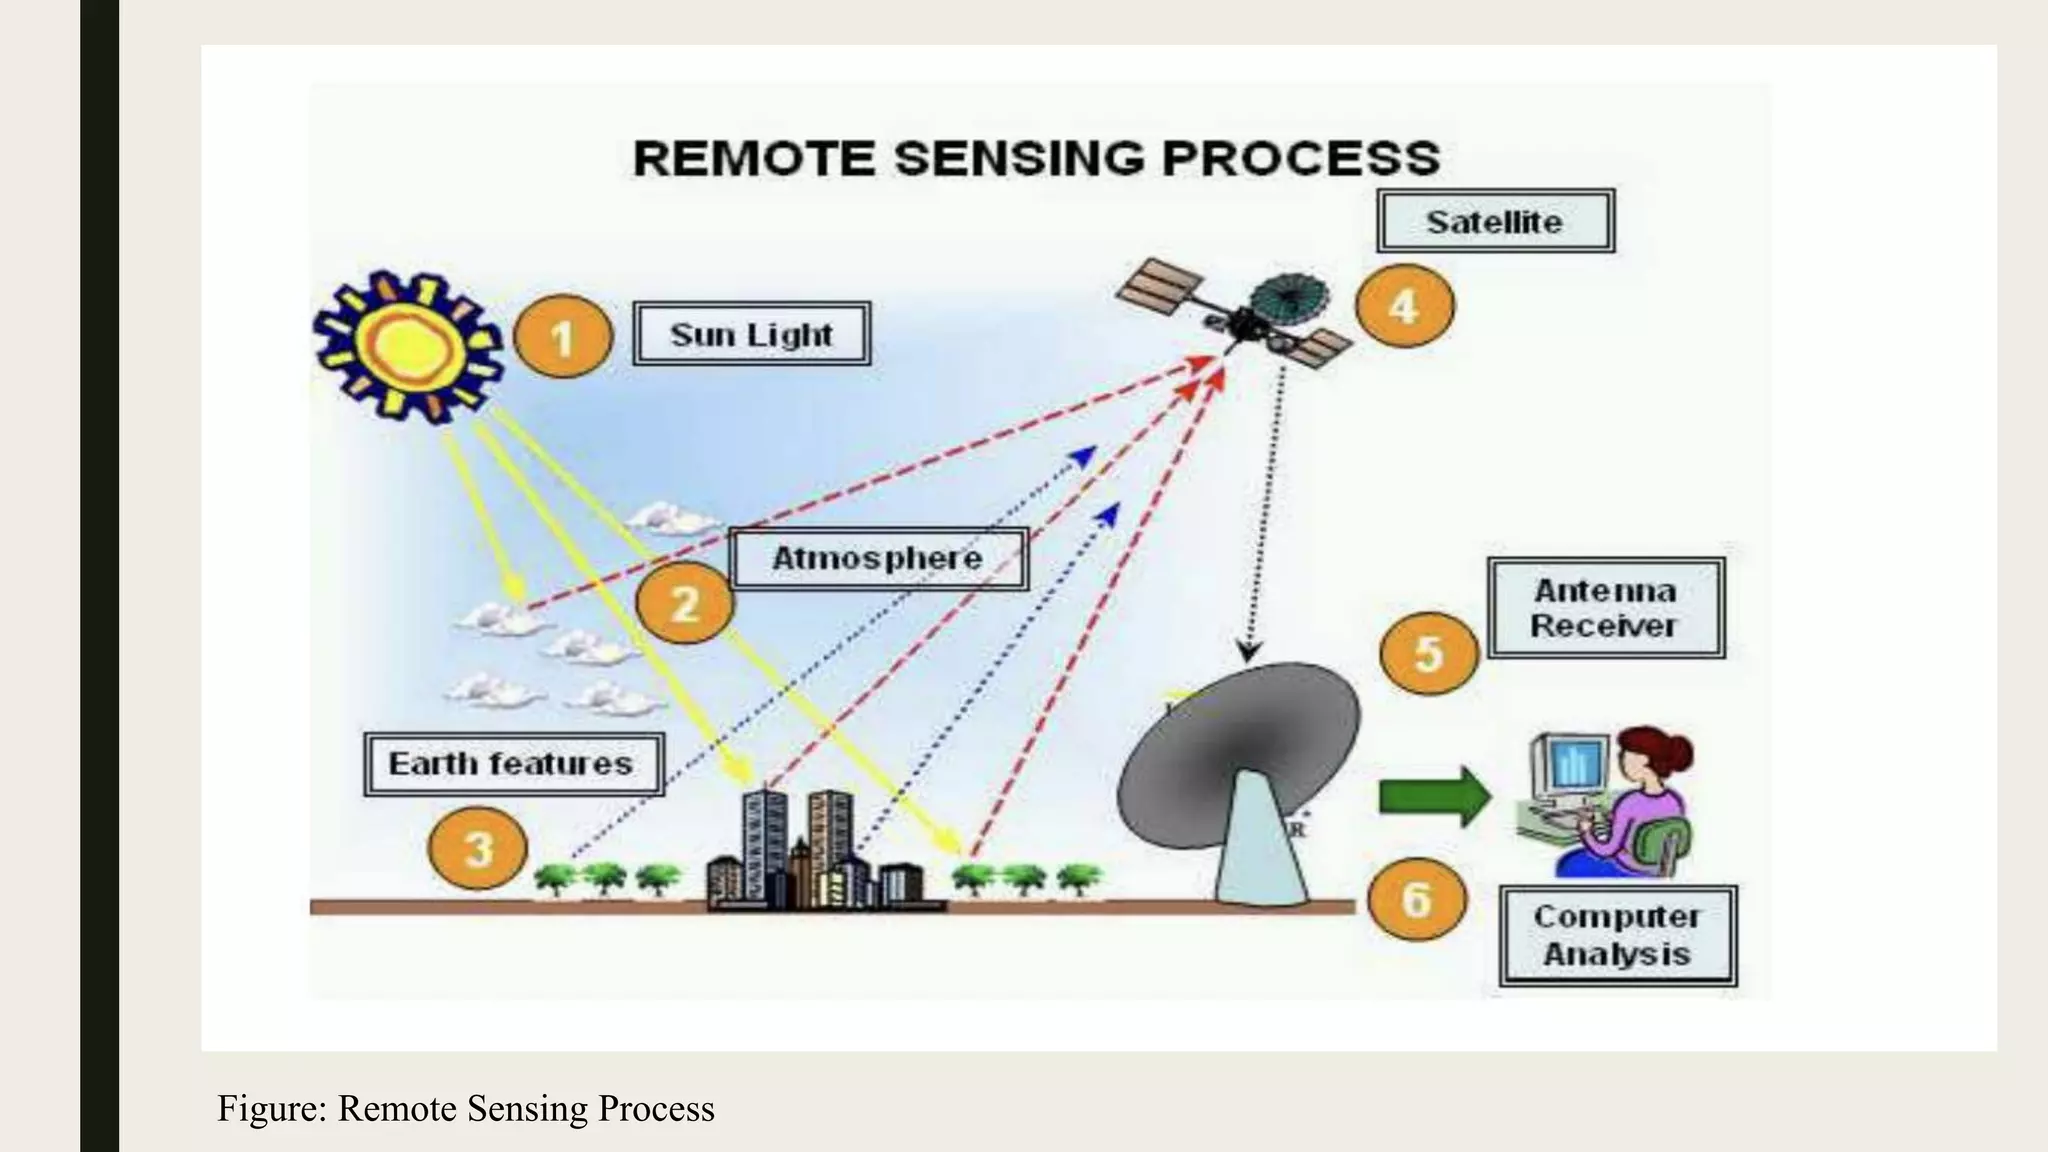
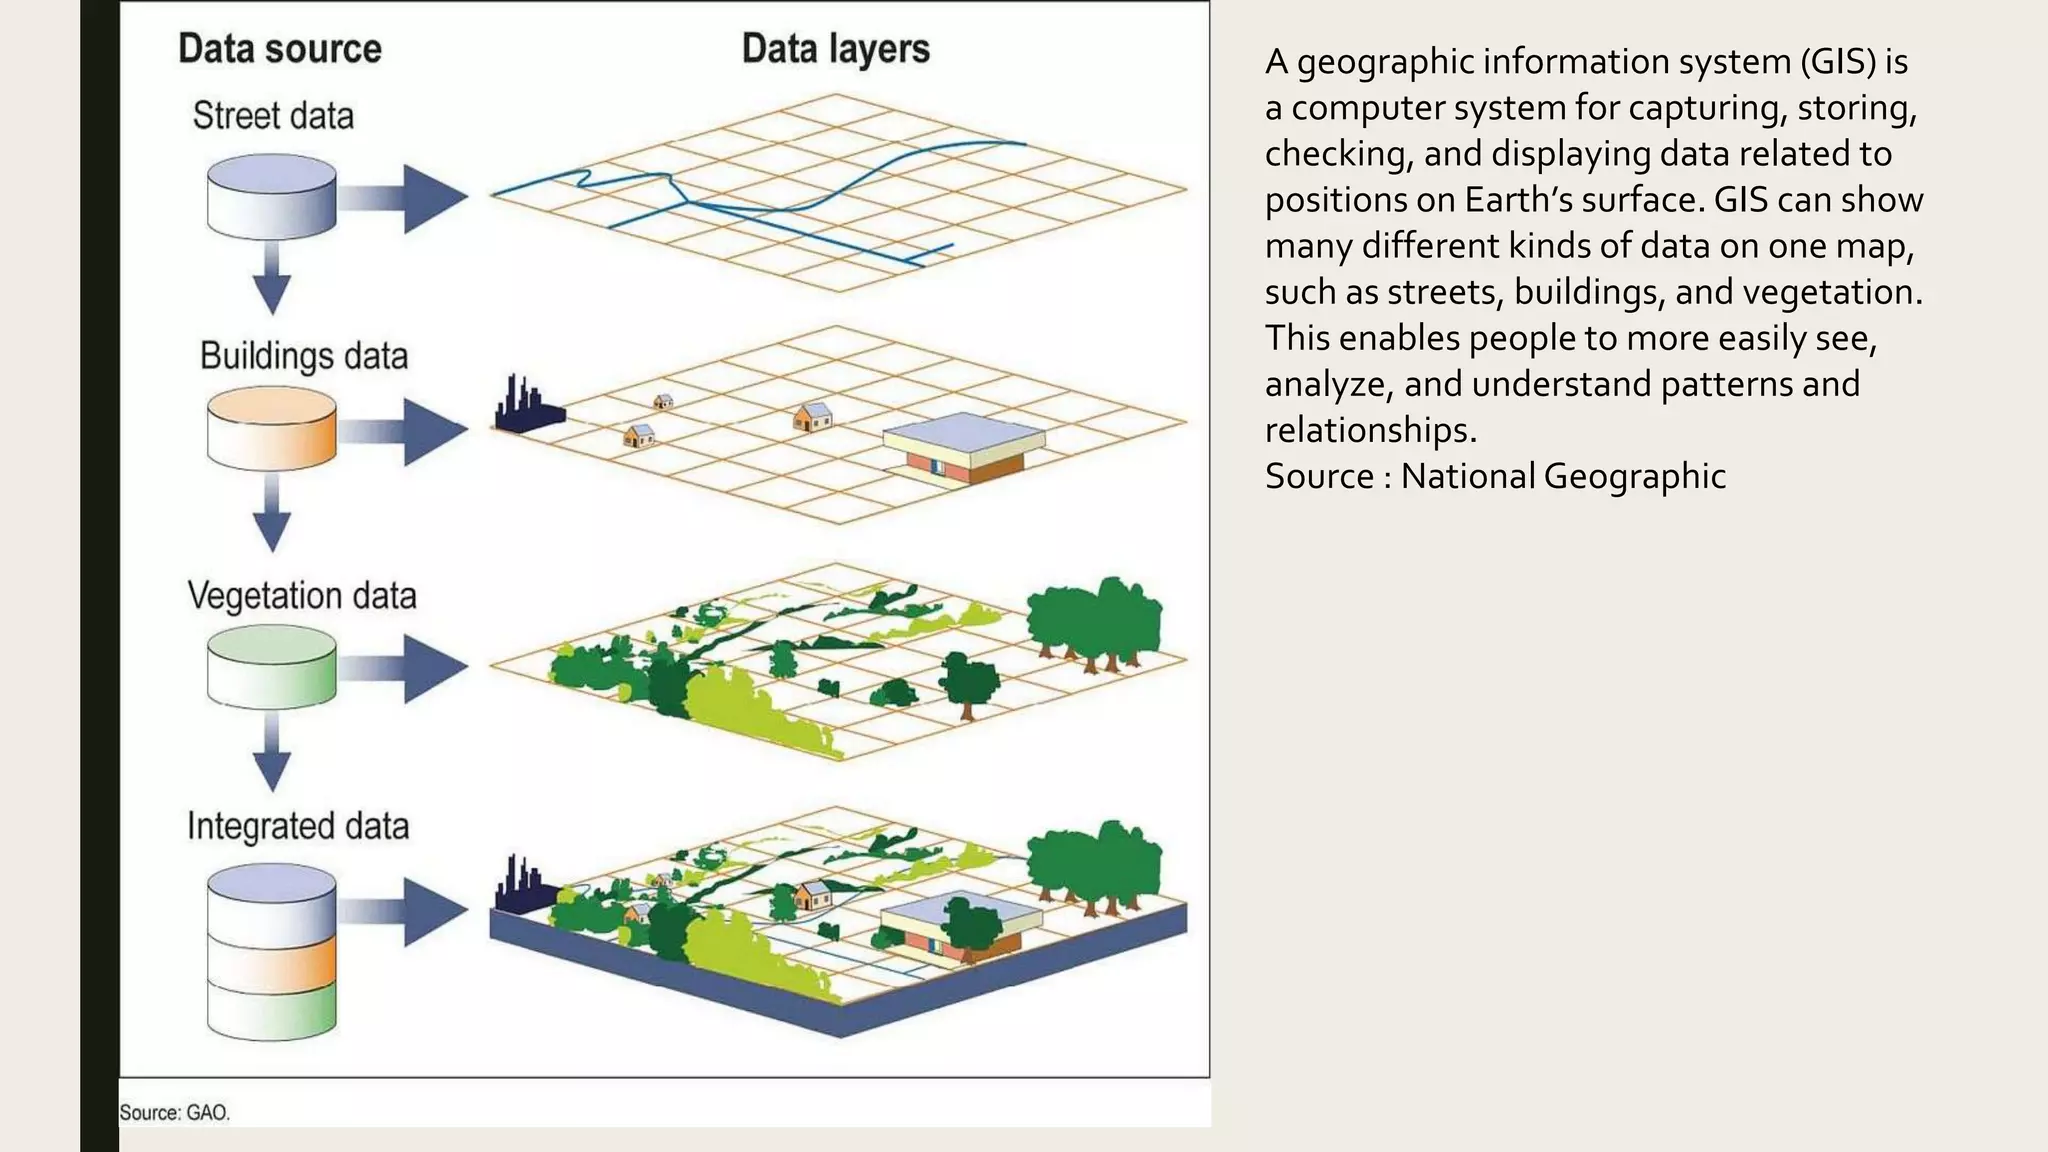
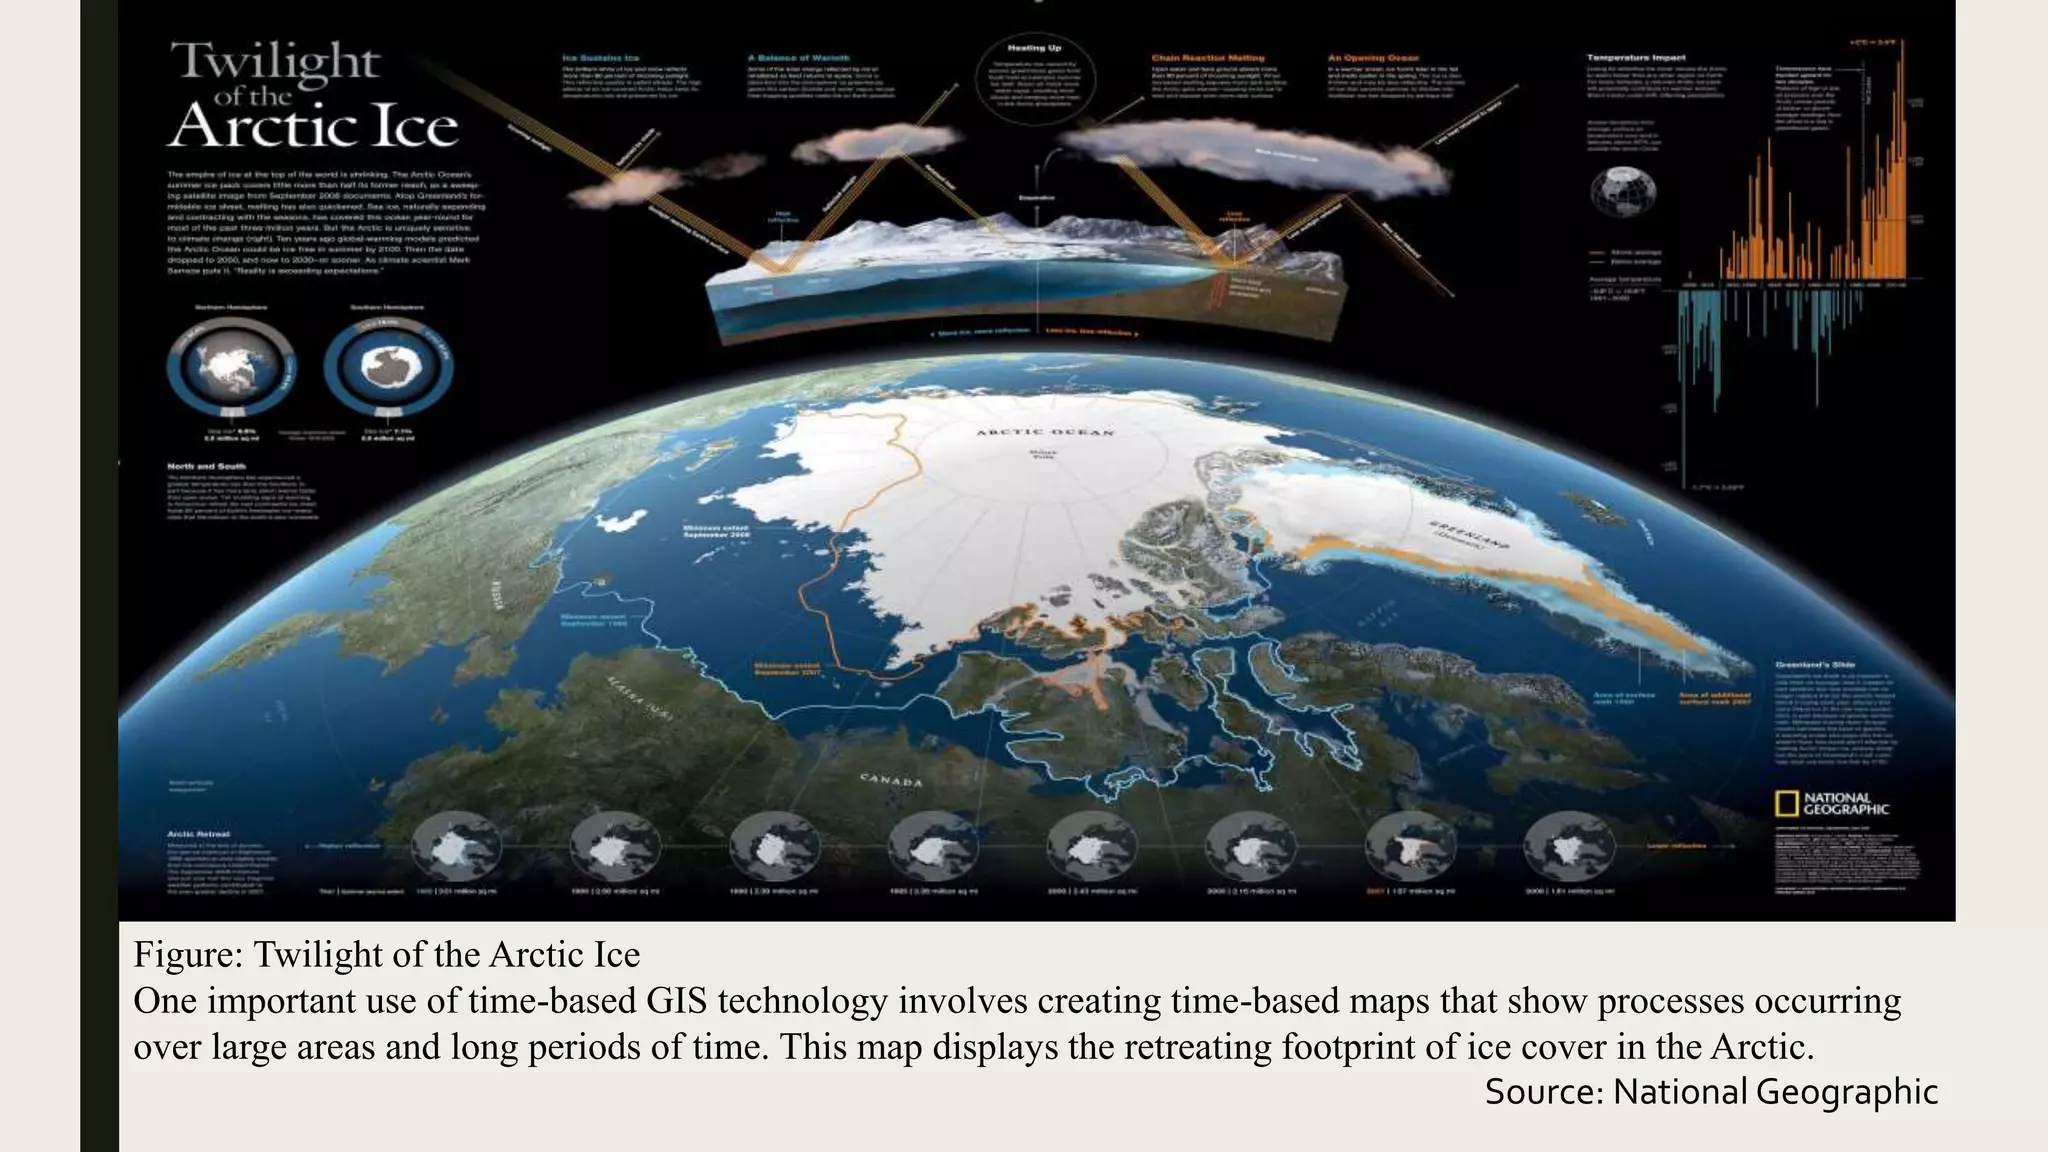
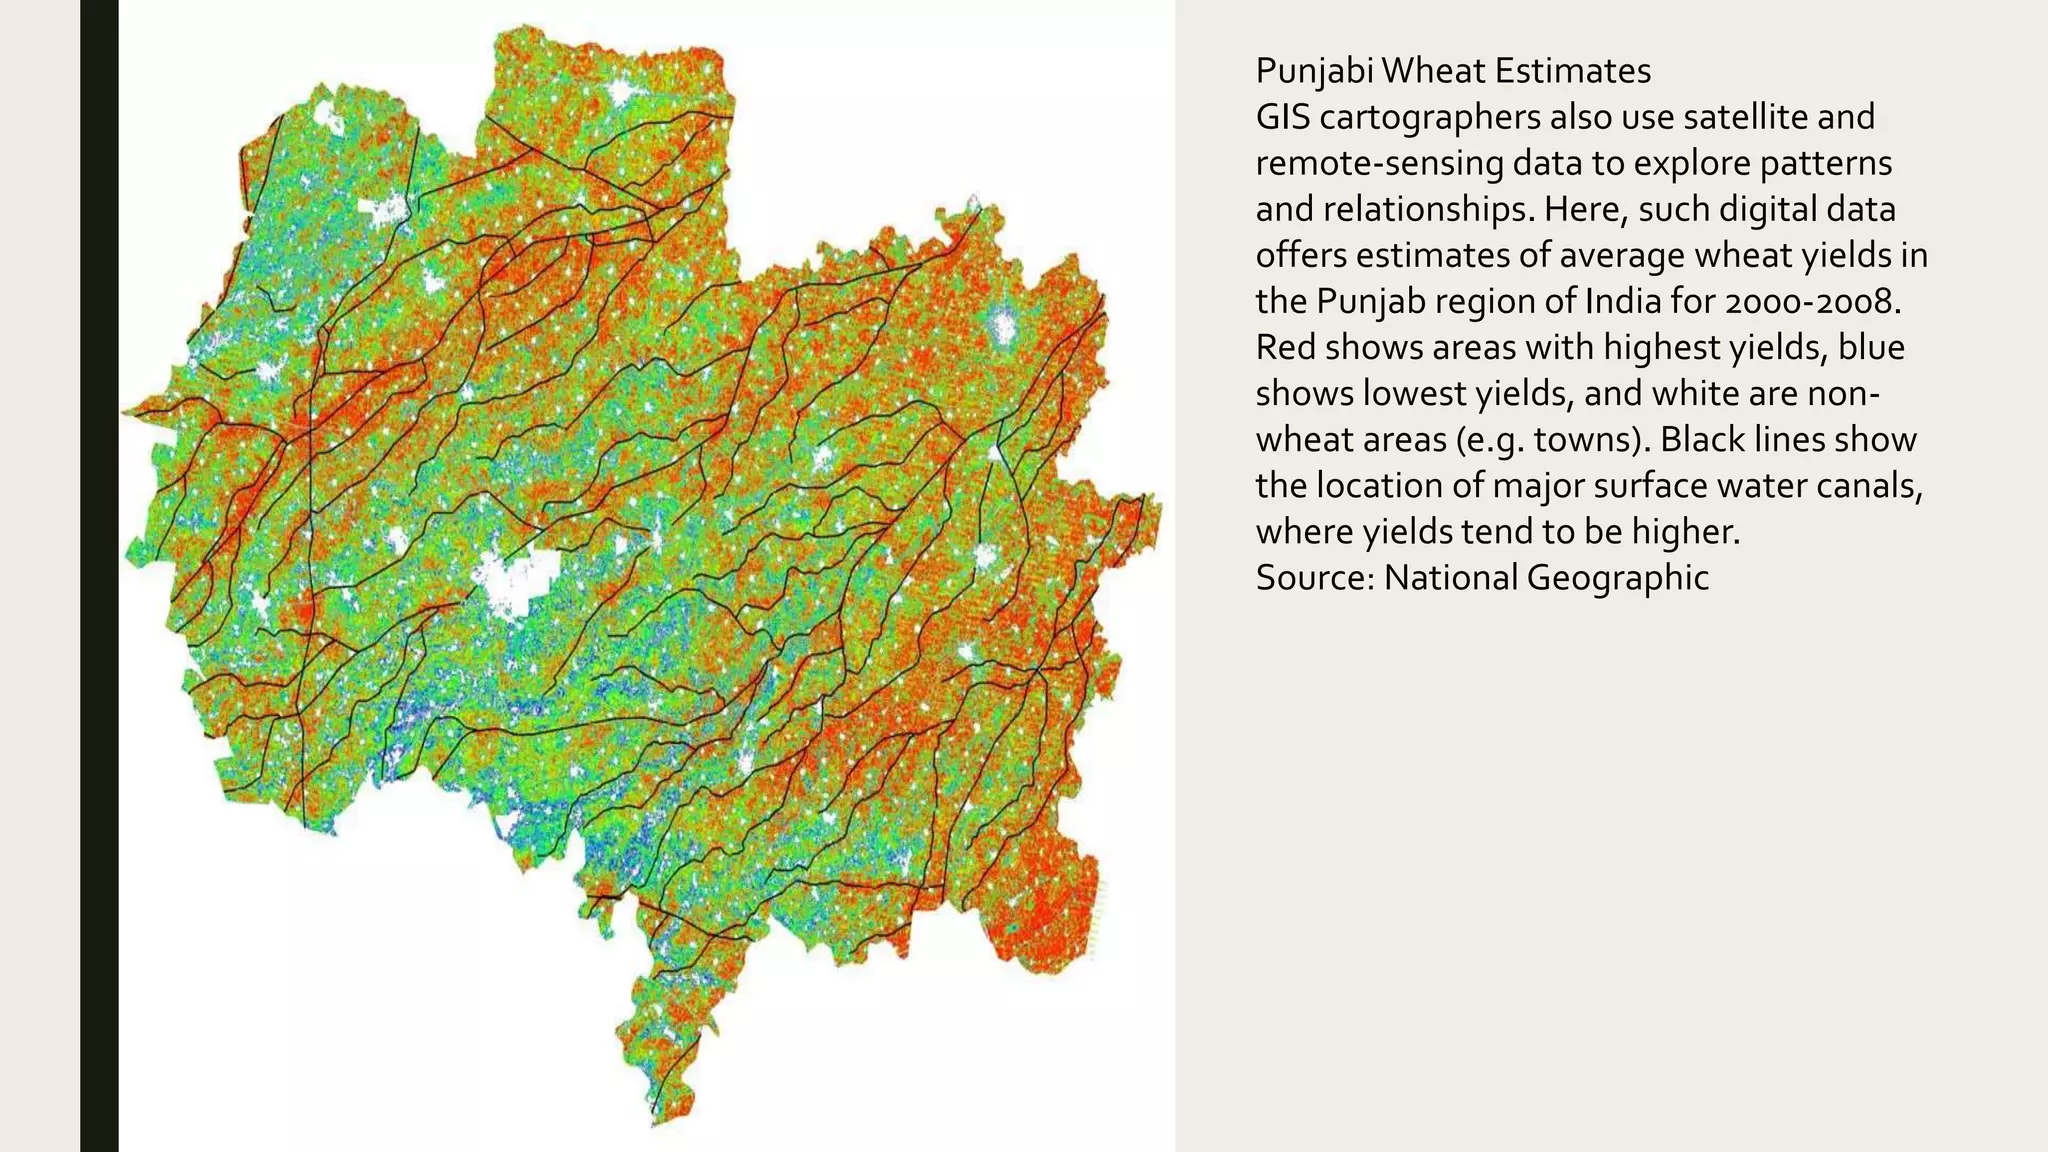
APPLICATION OF REMOTE
SENSING AND GIS FOR
COASTAL MANAGEMENT.
By:
Anuj Sharma
Kerala University of Fisheries and Ocean Studies
Introduction
• The coastal zone is currently a sensitive policy area for those involved with its management.
Phenomena such as erosion and landslides affect the stability of both the natural and the built
environment.
• The coastline is defined as the boundary between land and a water and most dynamic part of
seascape since its shape is affected by different factors, such as hydrography, geology, climate,
and vegetation.
• All these factors contribute to change the coastline morphology. In addition to natural factors,
human activities, such as building dyke, expanded land and aquaculture also play a main role in
modifying coastline.
• a research of coastal morphological is needed to define the levels, forms and period of erosion and
deposition and sand bar movement over years.
• Remote sensing has been used in resource development, the planning and management of the
coastal zone, the monitoring of shoreline changes, and the understanding of physical processes in
the coastal environment with geographic information systems (GIS)
Figure: Remote Sensing Process
Remote sensing
• Remote sensing technology acquires and records information without coming into direct contact with an
object. Remote sensing was redefined as the science and technology of Earth observation, including
space to Earth observation, aerial observation, and field monitoring.
• Remote sensing data can be divided into data on a global scale, a regional scale, and a local scale.
• (i) Global-scale:The satellites include are static meteorological satellites, such as the GOES-8, the
GOES-10, and the GMS meteorological satellite.The GOES-8 and the GOES-10 are the stationary
satellites of NOAA.Their purposes are daily weather observations.They play an important role in the
study of global climate change, weather forecasting, disaster prevention, and disaster reduction.
• (ii) Regional-scale:The data are generally obtained from moderate-resolution remote sensing images,
such as MODIS sensor and Landsat satellites. MODIS is an important sensor equipped withTerra and Aqua
satellites. Its multispectral data can reflect the information of land surface condition, ocean color,
phytoplankton, biological geography, chemistry, atmospheric water vapor, aerosol and surface
temperature, atmospheric temperature, etc.The data can be used in the macroscopic analysis of coastal
zone changes.
Figure 1: a Monthly aggregated average and b
standard deviation of SST for December (2004–
2009) by Moderate Resolution Imaging
Spectroradiometer (MODIS). It is the National
Aeronautic and Space Administration’s (NASA)
36-band ocean colour sensor onboard the
satellitesTerra and Aqua. Fully adapted from
Azmi et al., 2015).
Figure 2: Monthly aggregated average and b standard
deviation of SST for January (2005–2010) by Moderate
Resolution Imaging Spectroradiometer (MODIS).
MODIS mission has been providing global SST data
since 2000. (Fully adapted from Azmi et al., 2015).
Remote sensing
(iii) Local-scale:The satellites are usually used for monitoring in a smaller scope with high resolutions, such as
worldview satellite, airborne satellites, and unmanned aerial vehicles (UAVs).The benefits of high spatial and
high spectral resolution data are their ability to match the rich spectral and spatial diversities observed in
coastal systems.
Currently, remote sensing data are used in various ways: they serve as input boundary conditions and
validation data for numerical simulation models, they are combined with in situ measurements to draw
sediment transport maps, and they are assimilated in 3D coastal sediment transport models and in the light
forcing of an ecosystem model.
Use of remote sensing for other purpose
Figure: Climatological seasonal mean total
suspended matter concentration in Bohai,
Yellow, and East China Seas (BYES).
(Fully adapted from Chen et al., 2015)
Geographic Information System (GIS)
• A geographic information system (GIS) is a system that creates, manages, analyzes, and maps all types
of data.
• GIS connects data to a map, integrating location data (where things are) with all types of descriptive
information (what things are like there).
• GIS helps users understand patterns, relationships, and geographic context.The benefits include
improved communication and efficiency as well as better management and decision making.
• It is the technical system for the collection, storage, management, operation, analysis, display, and
description of geographic distribution data for the entirety or a part of the Earth’s surface (including
the atmosphere) in support of computer hardware and software systems.
• Combining GIS and mathematical models can make modeling easier by improving accuracy and solving
problems effectively.
A geographic information system (GIS) is
a computer system for capturing, storing,
checking, and displaying data related to
positions on Earth’s surface. GIS can show
many different kinds of data on one map,
such as streets, buildings, and vegetation.
This enables people to more easily see,
analyze, and understand patterns and
relationships.
Source : National Geographic
Figure: Twilight of the Arctic Ice
One important use of time-based GIS technology involves creating time-based maps that show processes occurring
over large areas and long periods of time. This map displays the retreating footprint of ice cover in the Arctic.
Source: National Geographic
Punjabi Wheat Estimates
GIS cartographers also use satellite and
remote-sensing data to explore patterns
and relationships. Here, such digital data
offers estimates of average wheat yields in
the Punjab region of India for 2000-2008.
Red shows areas with highest yields, blue
shows lowest yields, and white are non-
wheat areas (e.g. towns). Black lines show
the location of major surface water canals,
where yields tend to be higher.
Source: National Geographic
Why GIS for CZM?
• The ability to handle much larger databases and to integrate and synthesise data from a much wider range of
relevant criteria than might be achieved by manual methods. This in turn means that more balanced and
coordinated management strategies may be developed for considerably longer lengths of coast.
• GIS encourages the development and use of standards for coastal data definition, collection and storage,
which promotes compatibility of data and processing techniques between projects and departments, as well as
ensuring consistency of approach at any one site over time.
• The use of a shared database(especially if the access is provided via a data network) also facilitates the
updating of records, and the provision of a common set of data to the many different departments or offices
that might typically be involved in management of a single stretch of coast. A shared database implies
reduction or elimination of duplicated records, and thus the potential for significant economic savings as well
as improved operational efficiency.
• Provides efficient data storage and retrieval facilities.
• GIS also offers the ability to model, test and compare alternate management scenarios, before a proposed
strategy is imposed on the real-world system. Computer technology allows the consideration of much more
complex simulations; their application to very much larger data bases: and also enables compression of
temporal and spatial scales to more manageable dimensions.
(Bhardwaj 2007)
Reference
• Jiang, D., Hao, M., & Fu, J. (2016). Monitoring the coastal environment using remote sensing and GIS
techniques. Applied Studies of Coastal and Marine Environments, 353-385.
• Azmi, S., Agarwadkar,Y., Bhattacharya, M., Apte, M., & Inamdar, A. B. (2015). Monitoring and trend
mapping of sea surface temperature (SST) from MODIS data: a case study of Mumbai
coast. Environmental monitoring and assessment, 187(4), 1-13.
• Chen, J., Quan,W., Cui,T., & Song, Q. (2015). Estimation of total suspended matter concentration from
MODIS data using a neural network model in the China eastern coastal zone. Estuarine, Coastal and Shelf
Science, 155, 104-113.
• Bhardwaj, R. K. (2007). Application of GISTechnology for Coastal Zone Management: A Hydrographer
Perspective;[In: Management of Coastal Resources:An Introduction.
• National Geographic, https://www.nationalgeographic.org/encyclopedia/geographic-information-system-
gis/
Remote Sensing and GIS for Coastal Management

Remote Sensing and GIS for Coastal Management

  • 1.
    APPLICATION OF REMOTE SENSINGAND GIS FOR COASTAL MANAGEMENT. By: Anuj Sharma Kerala University of Fisheries and Ocean Studies
  • 2.
    Introduction • The coastalzone is currently a sensitive policy area for those involved with its management. Phenomena such as erosion and landslides affect the stability of both the natural and the built environment. • The coastline is defined as the boundary between land and a water and most dynamic part of seascape since its shape is affected by different factors, such as hydrography, geology, climate, and vegetation. • All these factors contribute to change the coastline morphology. In addition to natural factors, human activities, such as building dyke, expanded land and aquaculture also play a main role in modifying coastline. • a research of coastal morphological is needed to define the levels, forms and period of erosion and deposition and sand bar movement over years. • Remote sensing has been used in resource development, the planning and management of the coastal zone, the monitoring of shoreline changes, and the understanding of physical processes in the coastal environment with geographic information systems (GIS)
  • 3.
  • 4.
    Remote sensing • Remotesensing technology acquires and records information without coming into direct contact with an object. Remote sensing was redefined as the science and technology of Earth observation, including space to Earth observation, aerial observation, and field monitoring. • Remote sensing data can be divided into data on a global scale, a regional scale, and a local scale. • (i) Global-scale:The satellites include are static meteorological satellites, such as the GOES-8, the GOES-10, and the GMS meteorological satellite.The GOES-8 and the GOES-10 are the stationary satellites of NOAA.Their purposes are daily weather observations.They play an important role in the study of global climate change, weather forecasting, disaster prevention, and disaster reduction. • (ii) Regional-scale:The data are generally obtained from moderate-resolution remote sensing images, such as MODIS sensor and Landsat satellites. MODIS is an important sensor equipped withTerra and Aqua satellites. Its multispectral data can reflect the information of land surface condition, ocean color, phytoplankton, biological geography, chemistry, atmospheric water vapor, aerosol and surface temperature, atmospheric temperature, etc.The data can be used in the macroscopic analysis of coastal zone changes.
  • 5.
    Figure 1: aMonthly aggregated average and b standard deviation of SST for December (2004– 2009) by Moderate Resolution Imaging Spectroradiometer (MODIS). It is the National Aeronautic and Space Administration’s (NASA) 36-band ocean colour sensor onboard the satellitesTerra and Aqua. Fully adapted from Azmi et al., 2015). Figure 2: Monthly aggregated average and b standard deviation of SST for January (2005–2010) by Moderate Resolution Imaging Spectroradiometer (MODIS). MODIS mission has been providing global SST data since 2000. (Fully adapted from Azmi et al., 2015).
  • 6.
    Remote sensing (iii) Local-scale:Thesatellites are usually used for monitoring in a smaller scope with high resolutions, such as worldview satellite, airborne satellites, and unmanned aerial vehicles (UAVs).The benefits of high spatial and high spectral resolution data are their ability to match the rich spectral and spatial diversities observed in coastal systems. Currently, remote sensing data are used in various ways: they serve as input boundary conditions and validation data for numerical simulation models, they are combined with in situ measurements to draw sediment transport maps, and they are assimilated in 3D coastal sediment transport models and in the light forcing of an ecosystem model.
  • 7.
    Use of remotesensing for other purpose Figure: Climatological seasonal mean total suspended matter concentration in Bohai, Yellow, and East China Seas (BYES). (Fully adapted from Chen et al., 2015)
  • 8.
    Geographic Information System(GIS) • A geographic information system (GIS) is a system that creates, manages, analyzes, and maps all types of data. • GIS connects data to a map, integrating location data (where things are) with all types of descriptive information (what things are like there). • GIS helps users understand patterns, relationships, and geographic context.The benefits include improved communication and efficiency as well as better management and decision making. • It is the technical system for the collection, storage, management, operation, analysis, display, and description of geographic distribution data for the entirety or a part of the Earth’s surface (including the atmosphere) in support of computer hardware and software systems. • Combining GIS and mathematical models can make modeling easier by improving accuracy and solving problems effectively.
  • 9.
    A geographic informationsystem (GIS) is a computer system for capturing, storing, checking, and displaying data related to positions on Earth’s surface. GIS can show many different kinds of data on one map, such as streets, buildings, and vegetation. This enables people to more easily see, analyze, and understand patterns and relationships. Source : National Geographic
  • 10.
    Figure: Twilight ofthe Arctic Ice One important use of time-based GIS technology involves creating time-based maps that show processes occurring over large areas and long periods of time. This map displays the retreating footprint of ice cover in the Arctic. Source: National Geographic
  • 11.
    Punjabi Wheat Estimates GIScartographers also use satellite and remote-sensing data to explore patterns and relationships. Here, such digital data offers estimates of average wheat yields in the Punjab region of India for 2000-2008. Red shows areas with highest yields, blue shows lowest yields, and white are non- wheat areas (e.g. towns). Black lines show the location of major surface water canals, where yields tend to be higher. Source: National Geographic
  • 12.
    Why GIS forCZM? • The ability to handle much larger databases and to integrate and synthesise data from a much wider range of relevant criteria than might be achieved by manual methods. This in turn means that more balanced and coordinated management strategies may be developed for considerably longer lengths of coast. • GIS encourages the development and use of standards for coastal data definition, collection and storage, which promotes compatibility of data and processing techniques between projects and departments, as well as ensuring consistency of approach at any one site over time. • The use of a shared database(especially if the access is provided via a data network) also facilitates the updating of records, and the provision of a common set of data to the many different departments or offices that might typically be involved in management of a single stretch of coast. A shared database implies reduction or elimination of duplicated records, and thus the potential for significant economic savings as well as improved operational efficiency. • Provides efficient data storage and retrieval facilities. • GIS also offers the ability to model, test and compare alternate management scenarios, before a proposed strategy is imposed on the real-world system. Computer technology allows the consideration of much more complex simulations; their application to very much larger data bases: and also enables compression of temporal and spatial scales to more manageable dimensions. (Bhardwaj 2007)
  • 13.
    Reference • Jiang, D.,Hao, M., & Fu, J. (2016). Monitoring the coastal environment using remote sensing and GIS techniques. Applied Studies of Coastal and Marine Environments, 353-385. • Azmi, S., Agarwadkar,Y., Bhattacharya, M., Apte, M., & Inamdar, A. B. (2015). Monitoring and trend mapping of sea surface temperature (SST) from MODIS data: a case study of Mumbai coast. Environmental monitoring and assessment, 187(4), 1-13. • Chen, J., Quan,W., Cui,T., & Song, Q. (2015). Estimation of total suspended matter concentration from MODIS data using a neural network model in the China eastern coastal zone. Estuarine, Coastal and Shelf Science, 155, 104-113. • Bhardwaj, R. K. (2007). Application of GISTechnology for Coastal Zone Management: A Hydrographer Perspective;[In: Management of Coastal Resources:An Introduction. • National Geographic, https://www.nationalgeographic.org/encyclopedia/geographic-information-system- gis/