Downloaded 103 times
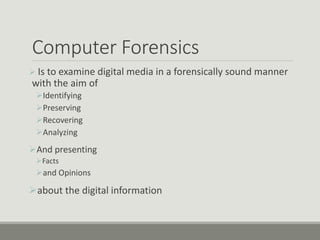
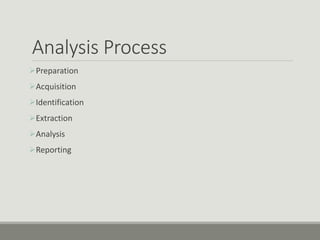
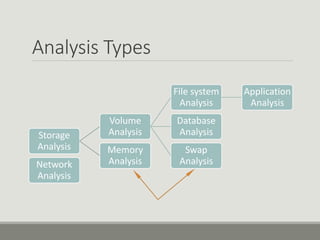
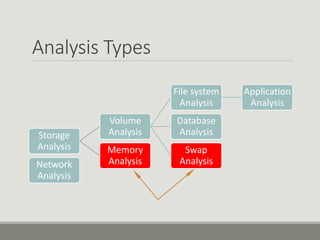
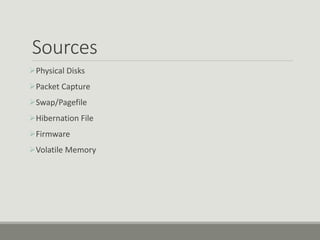
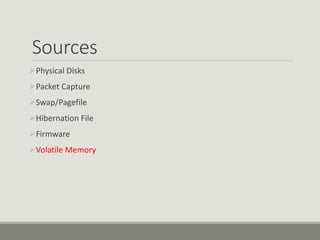


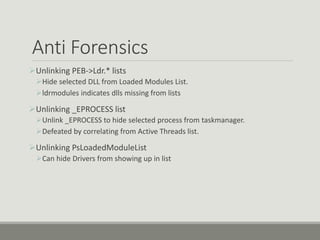


This document discusses computer memory forensics. It explains that memory forensics involves acquiring volatile memory contents from RAM and preserving them for later forensic analysis. The document outlines the different types of forensic analysis that can be performed on memory contents, including storage, file system, application, and network analysis. It also discusses the challenges of memory forensics, such as anti-forensic techniques used by malware to hide processes, drivers, and other artifacts in memory.