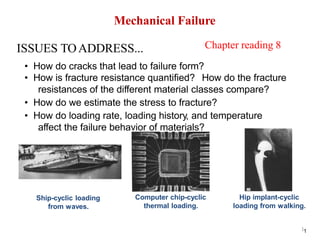
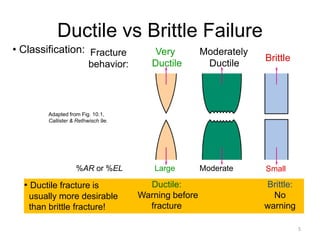
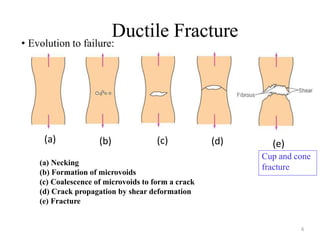
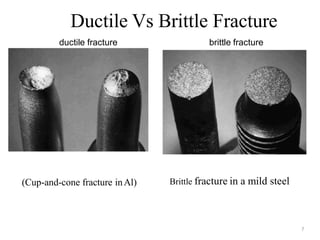
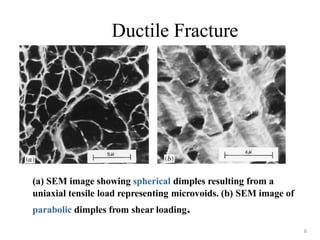
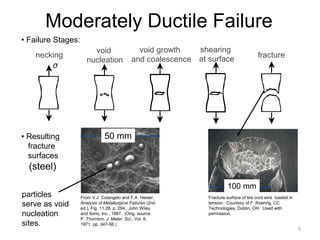
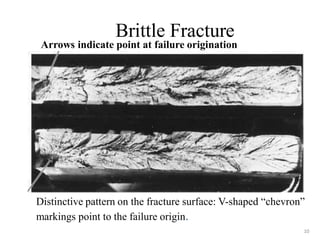
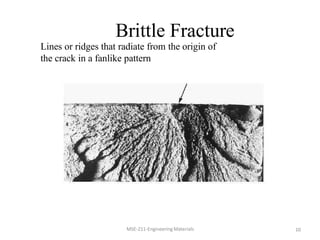
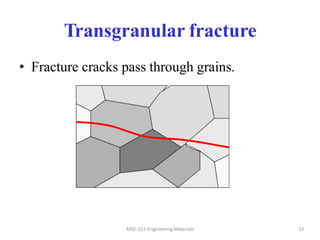
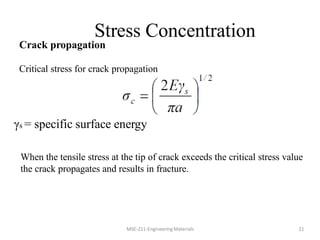
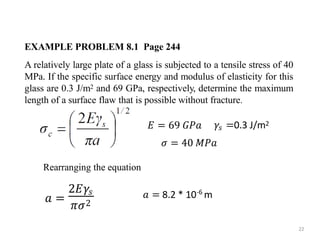
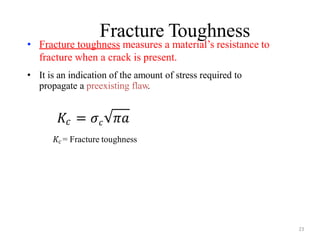
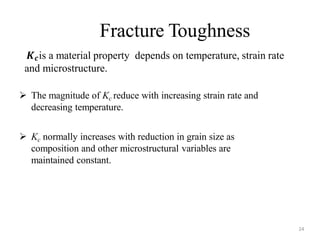
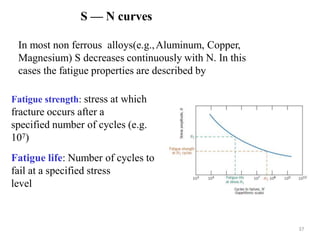
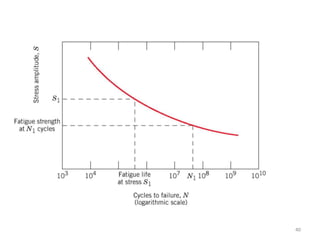
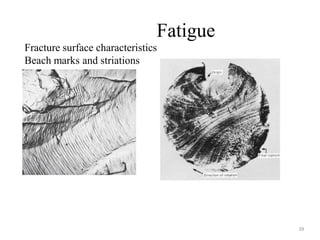
Mechanical Failure
Chapter reading 8
ISSUES TOADDRESS...
• How do cracks that lead to failure form?
• How is fracture resistance quantified? How do the fracture
resistances of the different material classes compare?
• How do we estimate the stress to fracture?
• How do loading rate, loading history, and temperature
affect the failure behavior of materials?
Ship-cyclic loading
from waves.
Computer chip-cyclic
thermal loading.
Hip implant-cyclic
loading from walking.
11
Mechanical Failure
2
Why study failure?
Design of a component or structure: Minimize failure possibility
It can be accomplished by understanding the mechanics of failure
modes and applying appropriate design principles.
Failure cost
1. Human life 2. Economic loss 3.Unavailability of service
Failure causes:
1. Improper material selection 2. Inadequate design 3. Processing
Regular inspection, repair and replacement critical to safe design
Fracture
Fracture is the separation of a body into two or more
pieces in response to an imposed stress
Steps in Fracture:
 Crack formation
 Crack propagation
3
Fracture Modes
• Depending on the ability of material to undergo plastic deformation
before the fracture two fracture modes can be defined - ductile or brittle.
• Ductile fracture - most metals (not too cold):
Extensive plastic deformation ahead of crack
 Crack is “stable”: resists further extension
• unless applied stress is increased
• Brittle fracture - ceramics, ice, cold metals:
 Relatively little plastic deformation
 Crack is “unstable”: propagates rapidly without
increase in applied stress
4
Ductile fracture is preferred in most applications
5
Ductile vs Brittle Failure
Very
Ductile
Moderately
Ductile
Brittle
Fracture
behavior:
Large Moderate
%AR or %EL Small
• Ductile fracture is
usually more desirable
than brittle fracture!
Adapted from Fig. 10.1,
Callister & Rethwisch 9e.
• Classification:
Ductile:
Warning before
fracture
Brittle:
No
warning
Ductile Fracture
6
• Evolution to failure:
(a) (b) (c) (d) (e)
(a) Necking
(b) Formation of microvoids
(c) Coalescence of microvoids to form a crack
(d) Crack propagation by shear deformation
(e) Fracture
Cup and cone
fracture
(Cup-and-cone fracture inAl)
Ductile Vs Brittle Fracture
7
brittle fracture
ductile fracture
Brittle fracture in a mild steel
Ductile Fracture
(a) SEM image showing spherical dimples resulting from a
uniaxial tensile load representing microvoids. (b) SEM image of
parabolic dimples from shear loading.
8
9
• Resulting
fracture
surfaces
(steel)
50 mm
particles
serve as void
nucleation
sites.
50 mm
From V.J. Colangelo and F.A. Heiser,
Analysis of Metallurgical Failures (2nd
ed.), Fig. 11.28, p. 294, John Wiley
and Sons, Inc., 1987. (Orig. source:
P. Thornton, J. Mater. Sci., Vol. 6,
1971, pp. 347-56.)
100 mm
Fracture surface of tire cord wire loaded in
tension. Courtesy of F. Roehrig, CC
Technologies, Dublin, OH. Used with
permission.
Moderately Ductile Failure
• Failure Stages:
necking
σ
void
nucleation
void growth
and coalescence
shearing
at surface
fracture
Brittle Fracture
Arrows indicate point at failure origination
Distinctive pattern on the fracture surface: V-shaped “chevron”
markings point to the failure origin.
10
Brittle Fracture
MSE-211-Engineering Materials
Lines or ridges that radiate from the origin of
the crack in a fanlike pattern
10
Transgranular fracture
• Fracture cracks pass through grains.
MSE-211-Engineering Materials 12
Intergranular fracture
• Fracture crack propagation is along grain
boundaries (grain boundaries are weakened or
embrittled by impurities segregation etc.)
13
14
• Ductile failure:
-- one piece
-- large deformation
Figures from V.J. Colangelo and F.A. Heiser,
Analysis of Metallurgical Failures (2nd ed.), Fig.
4.1(a) and (b), p. 66 John Wiley and Sons, Inc.,
1987. Used with permission.
Example: Pipe Failures
• Brittle failure:
-- many pieces
-- small deformations
Fracture Mechanics
Studies the relationships between:
• material properties
• stress level
• crack producing flaws
• crack propagation mechanisms
15
Stress Concentration
16
Measured fracture strength is much lower than predicted by calculations
based on atomic bond energies. This discrepancy is explained by the
presence of flaws or cracks in the materials.
The flaws act as stress concentrators or stress raisers,
amplifying the stress at a given point.
The magnitude of amplification depends on crack
geometry and orientation.
Stress Concentration
17
18
Flaws are Stress Concentrators!
• Griffith Crack
where
t = radius of curvature
σo = applied stress
σm = stress at crack tip
• Kt= stress concentration factor
• a = length of surface crack or ½ length
of internal crack
t
Fig. 10.8(a), Callister & Rethwisch 9e.
If the crack is similar to an elliptical hole through
plate, and is oriented perpendicular to applied
stress, the maximum stress, at crack tip
19
Engineering Fracture Design
r/h
sharper fillet radius
increasing w/h
0 0.5 1.0
1.0
1.5
2.0
2.5
Stress Conc. Factor, Kt =
• Avoid sharp corners!
σ0
Adapted from Fig.
8.2W(c), Callister 6e.
(Fig. 8.2W(c) is from G.H.
Neugebauer, Prod. Eng. (NY),
Vol. 14, pp. 82-87 1943.)
r,
fillet
radius
w
h
σ
max
σmax
σ0
20
Crack Propagation
Cracks having sharp tips propagate easier than cracks having blunt tips
• A plastic material deforms at a crack tip, which “blunts” the crack.
deformed
region
brittle
Energy balance on the crack
• Elastic strain energy-
• energy stored in material as it is elastically deformed
• this energy is released when the crack propagates
• creation of new surfaces requires energy
ductile
Crack propagation
Critical stress for crack propagation
Stress Concentration
MSE-211-Engineering Materials 21
γs = specific surface energy
When the tensile stress at the tip of crack exceeds the critical stress value
the crack propagates and results in fracture.
EXAMPLE PROBLEM 8.1 Page 244
A relatively large plate of a glass is subjected to a tensile stress of 40
MPa. If the specific surface energy and modulus of elasticity for this
glass are 0.3 J/m2 and 69 GPa, respectively, determine the maximum
length of a surface flaw that is possible without fracture.
𝑎 =
2𝐸𝛾𝑠
𝜋𝜎2
𝐸 = 69 𝐺𝑃𝑎
22
𝛾𝑠 =0.3 J/m2
𝜎 = 40 𝑀𝑃𝑎
Rearranging the equation
𝑎 = 8.2 * 10 m
-6
Fracture Toughness
23
• Fracture toughness measures a material’s resistance to
fracture when a crack is present.
• It is an indication of the amount of stress required to
propagate a preexisting flaw.
𝐾𝑐 = 𝜎𝑐 𝜋𝑎
𝐾𝑐 = Fracture toughness
Fracture Toughness
24
𝑲𝒄is a material property depends on temperature, strain rate
and microstructure.
 The magnitude of Kc reduce with increasing strain rate and
decreasing temperature.
 Kc normally increases with reduction in grain size as
composition and other microstructural variables are
maintained constant.
Impact Fracture Testing
25
Testing fracture characteristics under high strain rates
Two standard tests, the Charpy and Izod, measure the impact
energy (the energy required to fracture a test piece under an
impact load), also called the notch toughness
(Charpy)
Impact Fracture Testing
Izod
final height initial height
26
Ductile-to- brittle transition
27
As temperature decreases a ductile material can become
brittle - ductile-to-brittle transition.
The ductile-to-brittle transition can be measured by impact testing:
the impact energy needed for fracture drops suddenly over a
relatively narrow temperature range – temperature of the ductile-to-
brittle transition.
The ductile to-brittle transition is related to the temperature
dependence of the measured impact energy absorption
Adapted from Fig. 8.15,
Callister & Rethwisch 8e.
• Ductile-to-Brittle Transition Temperature (DBTT)...
Low strength (FCC and HCP) metals (e.g., Cu, Ni)
Low strength steels(BCC)
polymers
Impact
Energy
Temperature
High strength materials
More Ductile
Brittle
Ductile-to-brittle
transition temperature
MSE-211-Engineering Materials 28
29
• Pre-WWII: The Titanic • WWII: Liberty ships
• Problem: Steels were used having DBTT’s just below room
temperature.
Design Strategy:
StayAbove The DBTT!
29
30
Fatigue
Adapted from Fig. 10.18(a),
Callister & Rethwisch 9e.
• Fatigue = failure under applied cyclic stress.
• Stress varies with time S.
-- key parameters are S, σm, and
cycling frequency
σmax
σmin
σ
time
σm
S
• Key points: Fatigue...
--can cause part failure, even though σmax < σy.
--responsible for ~ 90% of mechanical engineering failures.
Fatigue
MSE-211-Engineering Materials 31
Fatigue
Failure under fluctuating / cyclic stresses
e.g., bridges, aircraft, machine components, automobiles,etc..
• Stress varies with time.  m
ax

min

time

m
S
Fatigue failure can occur at loads considerably lower
than tensile or yield strengths of material under a static
load.
Estimated to causes 90% of all failures of metallic structures
Fatigue failure is brittle-like (relatively little plastic
deformation) - even in normally ductile materials. Thus
sudden and catastrophic!
Fatigue failure proceeds in three distinct stages: crack
initiation in the areas of stress concentration (near stress
raisers), incremental crack propagation, final catastrophic
failure.
Fatigue
MSE-211-Engineering Materials 32
Fatigue
CYCLIC STRESSES
Mean stress (𝜎𝑚 )
33
34
Fatigue
35
S — N curves
(stress — number of cycles to failure)
Fatigue properties of a material (S-N curves) are tested in
rotating-bending tests in fatigue testing apparatus
Result is commonly plotted as S (stress) vs. N (number of
cycles to failure)
S — N curves
Fatigue limit (endurance limit) occurs for some materials
(e.g. some Fe and Ti alloys). In this case, the S—N curve
becomes horizontal at large N, limiting stress level. The fatigue
limit is a maximum stress amplitude below which the material
never fails, no matter how large the number of cycles is.
For many steels,
fatigue limits
range between
35% and 60%
of the tensile
strength.
36
S — N curves
In most non ferrous alloys(e.g.,Aluminum, Copper,
Magnesium) S decreases continuously with N. In this
cases the fatigue properties are described by
Fatigue strength: stress at which
fracture occurs after a
specified number of cycles (e.g.
107)
Fatigue life: Number of cycles to
fail at a specified stress
level
37
40
Fatigue
39
Fracture surface characteristics
Beach marks and striations
Creep is a time-dependent and permanent deformation
of materials when subjected to a constant load or stress.
For metals it becomes important at a high temperature
(> 0.4 Tm). Examples: turbine blades, steam
generators, high pressure steam lines.
Creep
40
Polymers are specially sensitive to creep.
For details read the book pages 265-267
Stages of Creep
41
42
Creep
Sample deformation at a constant stress (σ) vs. time
Adapted from
Fig. 10.29, Callister &
Rethwisch 9e.
Primary Creep: slope (creep rate)
decreases with time.
Secondary Creep: steady-state
i.e., constant slope (Δe /Δt).
Tertiary Creep: slope (creep rate)
increases with time, i.e. acceleration of rate.
σ
σ,e
0 t
1.Instantaneous deformation, mainly elastic.
2.Primary/transient creep. Slope of strain vs. time
decreases with time: strain-hardening
3.Secondary/steady-state creep. Rate of straining is
Constant
4.Tertiary. Rapidly accelerating strain rate up to
failure:
formation of internal cracks, voids, grain boundary
separation, necking, etc.
Stages of Creep
43
Parameters of creep behavior
MSE-211-Engineering Materials 44
. ∆𝜺
The stage of secondary/steady-state creep is of longest
duration and the steady-state creep rate 𝜺࢙
= ∆࢙
is the
most important parameter of the creep behavior in long-life
applications e.g. nuclear power plant component.
Another parameter, especially important in short-life
creep situations, is time to rupture, or the rupture
lifetime, tr.. e.g., turbine blades in military aircraft and
rocket motor nozzles, etc….
Creep: stress and temperature effects
MSE-211-Engineering Materials 45
46
• Occurs at elevated temperature, T > 0.4 Tm (in K)
Figs. 10.30, Callister &
Rethwisch 9e.
Creep: Temperature Dependence
elastic
primary
secondary
tertiary

mechanical failure.pptx

  • 1.
    Mechanical Failure Chapter reading8 ISSUES TOADDRESS... • How do cracks that lead to failure form? • How is fracture resistance quantified? How do the fracture resistances of the different material classes compare? • How do we estimate the stress to fracture? • How do loading rate, loading history, and temperature affect the failure behavior of materials? Ship-cyclic loading from waves. Computer chip-cyclic thermal loading. Hip implant-cyclic loading from walking. 11
  • 2.
    Mechanical Failure 2 Why studyfailure? Design of a component or structure: Minimize failure possibility It can be accomplished by understanding the mechanics of failure modes and applying appropriate design principles. Failure cost 1. Human life 2. Economic loss 3.Unavailability of service Failure causes: 1. Improper material selection 2. Inadequate design 3. Processing Regular inspection, repair and replacement critical to safe design
  • 3.
    Fracture Fracture is theseparation of a body into two or more pieces in response to an imposed stress Steps in Fracture:  Crack formation  Crack propagation 3
  • 4.
    Fracture Modes • Dependingon the ability of material to undergo plastic deformation before the fracture two fracture modes can be defined - ductile or brittle. • Ductile fracture - most metals (not too cold): Extensive plastic deformation ahead of crack  Crack is “stable”: resists further extension • unless applied stress is increased • Brittle fracture - ceramics, ice, cold metals:  Relatively little plastic deformation  Crack is “unstable”: propagates rapidly without increase in applied stress 4 Ductile fracture is preferred in most applications
  • 5.
    5 Ductile vs BrittleFailure Very Ductile Moderately Ductile Brittle Fracture behavior: Large Moderate %AR or %EL Small • Ductile fracture is usually more desirable than brittle fracture! Adapted from Fig. 10.1, Callister & Rethwisch 9e. • Classification: Ductile: Warning before fracture Brittle: No warning
  • 6.
    Ductile Fracture 6 • Evolutionto failure: (a) (b) (c) (d) (e) (a) Necking (b) Formation of microvoids (c) Coalescence of microvoids to form a crack (d) Crack propagation by shear deformation (e) Fracture Cup and cone fracture
  • 7.
    (Cup-and-cone fracture inAl) DuctileVs Brittle Fracture 7 brittle fracture ductile fracture Brittle fracture in a mild steel
  • 8.
    Ductile Fracture (a) SEMimage showing spherical dimples resulting from a uniaxial tensile load representing microvoids. (b) SEM image of parabolic dimples from shear loading. 8
  • 9.
    9 • Resulting fracture surfaces (steel) 50 mm particles serveas void nucleation sites. 50 mm From V.J. Colangelo and F.A. Heiser, Analysis of Metallurgical Failures (2nd ed.), Fig. 11.28, p. 294, John Wiley and Sons, Inc., 1987. (Orig. source: P. Thornton, J. Mater. Sci., Vol. 6, 1971, pp. 347-56.) 100 mm Fracture surface of tire cord wire loaded in tension. Courtesy of F. Roehrig, CC Technologies, Dublin, OH. Used with permission. Moderately Ductile Failure • Failure Stages: necking σ void nucleation void growth and coalescence shearing at surface fracture
  • 10.
    Brittle Fracture Arrows indicatepoint at failure origination Distinctive pattern on the fracture surface: V-shaped “chevron” markings point to the failure origin. 10
  • 11.
    Brittle Fracture MSE-211-Engineering Materials Linesor ridges that radiate from the origin of the crack in a fanlike pattern 10
  • 12.
    Transgranular fracture • Fracturecracks pass through grains. MSE-211-Engineering Materials 12
  • 13.
    Intergranular fracture • Fracturecrack propagation is along grain boundaries (grain boundaries are weakened or embrittled by impurities segregation etc.) 13
  • 14.
    14 • Ductile failure: --one piece -- large deformation Figures from V.J. Colangelo and F.A. Heiser, Analysis of Metallurgical Failures (2nd ed.), Fig. 4.1(a) and (b), p. 66 John Wiley and Sons, Inc., 1987. Used with permission. Example: Pipe Failures • Brittle failure: -- many pieces -- small deformations
  • 15.
    Fracture Mechanics Studies therelationships between: • material properties • stress level • crack producing flaws • crack propagation mechanisms 15
  • 16.
    Stress Concentration 16 Measured fracturestrength is much lower than predicted by calculations based on atomic bond energies. This discrepancy is explained by the presence of flaws or cracks in the materials. The flaws act as stress concentrators or stress raisers, amplifying the stress at a given point. The magnitude of amplification depends on crack geometry and orientation.
  • 17.
  • 18.
    18 Flaws are StressConcentrators! • Griffith Crack where t = radius of curvature σo = applied stress σm = stress at crack tip • Kt= stress concentration factor • a = length of surface crack or ½ length of internal crack t Fig. 10.8(a), Callister & Rethwisch 9e. If the crack is similar to an elliptical hole through plate, and is oriented perpendicular to applied stress, the maximum stress, at crack tip
  • 19.
    19 Engineering Fracture Design r/h sharperfillet radius increasing w/h 0 0.5 1.0 1.0 1.5 2.0 2.5 Stress Conc. Factor, Kt = • Avoid sharp corners! σ0 Adapted from Fig. 8.2W(c), Callister 6e. (Fig. 8.2W(c) is from G.H. Neugebauer, Prod. Eng. (NY), Vol. 14, pp. 82-87 1943.) r, fillet radius w h σ max σmax σ0
  • 20.
    20 Crack Propagation Cracks havingsharp tips propagate easier than cracks having blunt tips • A plastic material deforms at a crack tip, which “blunts” the crack. deformed region brittle Energy balance on the crack • Elastic strain energy- • energy stored in material as it is elastically deformed • this energy is released when the crack propagates • creation of new surfaces requires energy ductile
  • 21.
    Crack propagation Critical stressfor crack propagation Stress Concentration MSE-211-Engineering Materials 21 γs = specific surface energy When the tensile stress at the tip of crack exceeds the critical stress value the crack propagates and results in fracture.
  • 22.
    EXAMPLE PROBLEM 8.1Page 244 A relatively large plate of a glass is subjected to a tensile stress of 40 MPa. If the specific surface energy and modulus of elasticity for this glass are 0.3 J/m2 and 69 GPa, respectively, determine the maximum length of a surface flaw that is possible without fracture. 𝑎 = 2𝐸𝛾𝑠 𝜋𝜎2 𝐸 = 69 𝐺𝑃𝑎 22 𝛾𝑠 =0.3 J/m2 𝜎 = 40 𝑀𝑃𝑎 Rearranging the equation 𝑎 = 8.2 * 10 m -6
  • 23.
    Fracture Toughness 23 • Fracturetoughness measures a material’s resistance to fracture when a crack is present. • It is an indication of the amount of stress required to propagate a preexisting flaw. 𝐾𝑐 = 𝜎𝑐 𝜋𝑎 𝐾𝑐 = Fracture toughness
  • 24.
    Fracture Toughness 24 𝑲𝒄is amaterial property depends on temperature, strain rate and microstructure.  The magnitude of Kc reduce with increasing strain rate and decreasing temperature.  Kc normally increases with reduction in grain size as composition and other microstructural variables are maintained constant.
  • 25.
    Impact Fracture Testing 25 Testingfracture characteristics under high strain rates Two standard tests, the Charpy and Izod, measure the impact energy (the energy required to fracture a test piece under an impact load), also called the notch toughness
  • 26.
  • 27.
    Ductile-to- brittle transition 27 Astemperature decreases a ductile material can become brittle - ductile-to-brittle transition. The ductile-to-brittle transition can be measured by impact testing: the impact energy needed for fracture drops suddenly over a relatively narrow temperature range – temperature of the ductile-to- brittle transition. The ductile to-brittle transition is related to the temperature dependence of the measured impact energy absorption
  • 28.
    Adapted from Fig.8.15, Callister & Rethwisch 8e. • Ductile-to-Brittle Transition Temperature (DBTT)... Low strength (FCC and HCP) metals (e.g., Cu, Ni) Low strength steels(BCC) polymers Impact Energy Temperature High strength materials More Ductile Brittle Ductile-to-brittle transition temperature MSE-211-Engineering Materials 28 29
  • 29.
    • Pre-WWII: TheTitanic • WWII: Liberty ships • Problem: Steels were used having DBTT’s just below room temperature. Design Strategy: StayAbove The DBTT! 29
  • 30.
    30 Fatigue Adapted from Fig.10.18(a), Callister & Rethwisch 9e. • Fatigue = failure under applied cyclic stress. • Stress varies with time S. -- key parameters are S, σm, and cycling frequency σmax σmin σ time σm S • Key points: Fatigue... --can cause part failure, even though σmax < σy. --responsible for ~ 90% of mechanical engineering failures.
  • 31.
    Fatigue MSE-211-Engineering Materials 31 Fatigue Failureunder fluctuating / cyclic stresses e.g., bridges, aircraft, machine components, automobiles,etc.. • Stress varies with time.  m ax  min  time  m S
  • 32.
    Fatigue failure canoccur at loads considerably lower than tensile or yield strengths of material under a static load. Estimated to causes 90% of all failures of metallic structures Fatigue failure is brittle-like (relatively little plastic deformation) - even in normally ductile materials. Thus sudden and catastrophic! Fatigue failure proceeds in three distinct stages: crack initiation in the areas of stress concentration (near stress raisers), incremental crack propagation, final catastrophic failure. Fatigue MSE-211-Engineering Materials 32
  • 33.
  • 34.
  • 35.
    Fatigue 35 S — Ncurves (stress — number of cycles to failure) Fatigue properties of a material (S-N curves) are tested in rotating-bending tests in fatigue testing apparatus Result is commonly plotted as S (stress) vs. N (number of cycles to failure)
  • 36.
    S — Ncurves Fatigue limit (endurance limit) occurs for some materials (e.g. some Fe and Ti alloys). In this case, the S—N curve becomes horizontal at large N, limiting stress level. The fatigue limit is a maximum stress amplitude below which the material never fails, no matter how large the number of cycles is. For many steels, fatigue limits range between 35% and 60% of the tensile strength. 36
  • 37.
    S — Ncurves In most non ferrous alloys(e.g.,Aluminum, Copper, Magnesium) S decreases continuously with N. In this cases the fatigue properties are described by Fatigue strength: stress at which fracture occurs after a specified number of cycles (e.g. 107) Fatigue life: Number of cycles to fail at a specified stress level 37
  • 38.
  • 39.
  • 40.
    Creep is atime-dependent and permanent deformation of materials when subjected to a constant load or stress. For metals it becomes important at a high temperature (> 0.4 Tm). Examples: turbine blades, steam generators, high pressure steam lines. Creep 40 Polymers are specially sensitive to creep. For details read the book pages 265-267
  • 41.
  • 42.
    42 Creep Sample deformation ata constant stress (σ) vs. time Adapted from Fig. 10.29, Callister & Rethwisch 9e. Primary Creep: slope (creep rate) decreases with time. Secondary Creep: steady-state i.e., constant slope (Δe /Δt). Tertiary Creep: slope (creep rate) increases with time, i.e. acceleration of rate. σ σ,e 0 t
  • 43.
    1.Instantaneous deformation, mainlyelastic. 2.Primary/transient creep. Slope of strain vs. time decreases with time: strain-hardening 3.Secondary/steady-state creep. Rate of straining is Constant 4.Tertiary. Rapidly accelerating strain rate up to failure: formation of internal cracks, voids, grain boundary separation, necking, etc. Stages of Creep 43
  • 44.
    Parameters of creepbehavior MSE-211-Engineering Materials 44 . ∆𝜺 The stage of secondary/steady-state creep is of longest duration and the steady-state creep rate 𝜺࢙ = ∆࢙ is the most important parameter of the creep behavior in long-life applications e.g. nuclear power plant component. Another parameter, especially important in short-life creep situations, is time to rupture, or the rupture lifetime, tr.. e.g., turbine blades in military aircraft and rocket motor nozzles, etc….
  • 45.
    Creep: stress andtemperature effects MSE-211-Engineering Materials 45
  • 46.
    46 • Occurs atelevated temperature, T > 0.4 Tm (in K) Figs. 10.30, Callister & Rethwisch 9e. Creep: Temperature Dependence elastic primary secondary tertiary