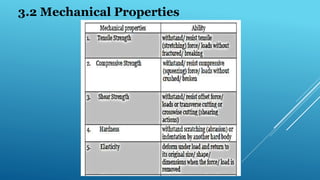
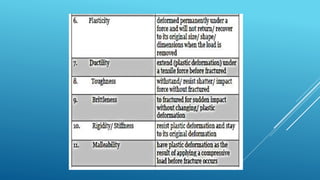
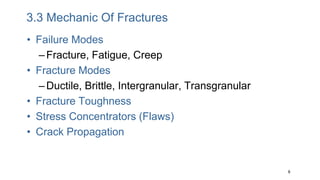
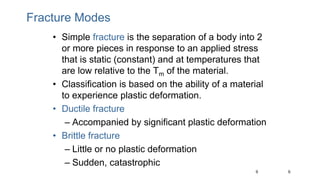
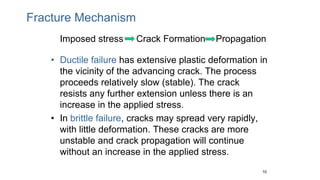
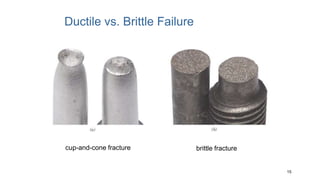
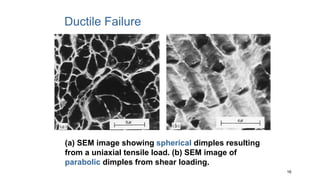
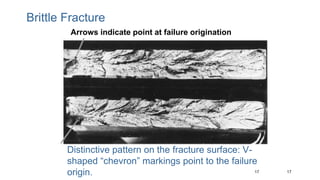
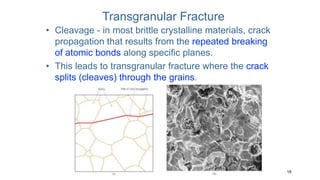
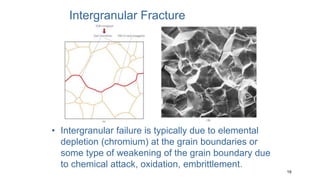
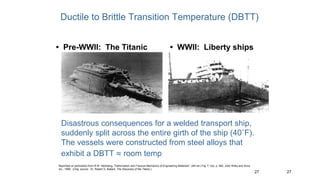
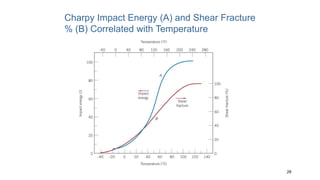
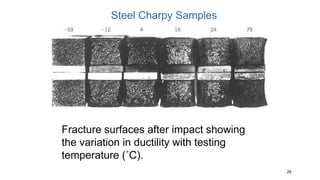
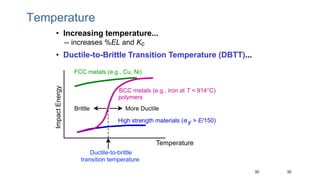
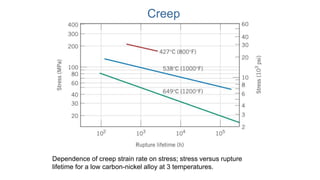
2. 3.1.1Physical Property Definition:
The measurement of a physical property may change the
arrangement of matter in a sample, but not the structure of its molecules.
In other words, a physical property may involve a physical change, but not
a chemical change.
Examples: Examples of physical properties include mass,
• density,
• color,
• boiling point,
• temperature,
• and volume
3. 3.1.2 Thermal properties
• Physical property of a solid body related to application of heat energy is
defined as a thermal property.
• Thermal properties explain the response of a material to the application of
heat
• Examples thermal properties are
o Heat capacity
o Thermal expansion
o Thermal conductivity
o Thermal stresses
4. 3.1.3 Mechanical Properties
The mechanical properties of a material describe how it will react to physical
forces. Mechanical properties occur as a result of the physical properties
inherent to each material, and are determined through a series of
standardized mechanical tests.
Examples mechanical properties are :
• Toughness
• Hardness
• Elasticity
• Plasticity
• Malleablity
• Etc.
9. 9
9
Fracture Modes
• Simple fracture is the separation of a body into 2
or more pieces in response to an applied stress
that is static (constant) and at temperatures that
are low relative to the Tm of the material.
• Classification is based on the ability of a material
to experience plastic deformation.
• Ductile fracture
– Accompanied by significant plastic deformation
• Brittle fracture
– Little or no plastic deformation
– Sudden, catastrophic
10. Fracture Mechanism
Imposed stress Crack Formation Propagation
• Ductile failure has extensive plastic deformation in
the vicinity of the advancing crack. The process
proceeds relatively slow (stable). The crack
resists any further extension unless there is an
increase in the applied stress.
• In brittle failure, cracks may spread very rapidly,
with little deformation. These cracks are more
unstable and crack propagation will continue
without an increase in the applied stress.
10
11. 11
11
Crack Propagation
Cracks propagate due to sharpness of crack tip
• A plastic material deforms at the tip, “blunting” the crack.
deformed
region
brittle
Energy balance on the crack
• Elastic strain energy-
• energy stored in material as it is elastically deformed
• this energy is released when the crack propagates
• creation of new surfaces requires energy
plastic
12. 12
Ductile vs Brittle Failure
Very
Ductile
Moderately
Ductile
Brittle
Fracture
behavior:
Large Moderate
%AR or %EL Small
• Ductile fracture is
usually more desirable
than brittle fracture.
Ductile:
Warning before
fracture
Brittle:
No
warning
13. 13
13
• Evolution to failure:
Moderately Ductile Failure
necking
void
nucleation
• Resulting
fracture
surfaces
(steel)
50 mm
particles
serve as void
nucleation
sites.
50 mm
From V.J. Colangelo and F.A. Heiser, Analysis of
Metallurgical Failures (2nd ed.), Fig. 11.28, p. 294, John
Wiley and Sons, Inc., 1987. (Orig. source: P. Thornton, J.
Mater. Sci., Vol. 6, 1971, pp. 347-56.)
100 mm
Fracture surface of tire cord wire loaded in tension.
Courtesy of F. Roehrig, CC Technologies, Dublin, OH.
Used with permission.
fracture
Crack
propagation
Coalescence
of cavities
14. 14
14
• Ductile failure:
-- one piece
-- large deformation
Figures from V.J. Colangelo and F.A. Heiser, Analysis of
Metallurgical Failures (2nd ed.), Fig. 4.1(a) and (b), p. 66 John
Wiley and Sons, Inc., 1987. Used with permission.
Example: Pipe Failures
• Brittle failure:
-- many pieces
-- small deformations
16. (a) SEM image showing spherical dimples resulting
from a uniaxial tensile load. (b) SEM image of
parabolic dimples from shear loading.
16
Ductile Failure
17. 17
17
Brittle Fracture
Arrows indicate point at failure origination
Distinctive pattern on the fracture surface: V-
shaped “chevron” markings point to the failure
origin.
18. 18
Transgranular Fracture
• Cleavage - in most brittle crystalline materials, crack
propagation that results from the repeated breaking
of atomic bonds along specific planes.
• This leads to transgranular fracture where the crack
splits (cleaves) through the grains.
19. 19
Intergranular Fracture
• Intergranular failure is typically due to elemental
depletion (chromium) at the grain boundaries or
some type of weakening of the grain boundary due
to chemical attack, oxidation, embrittlement.
21. Stress Concentration
• The measured fracture strengths for most brittle
materials are significantly lower than those
predicted by theoretical calculations based on
atomic bond energies.
• This discrepancy is explained by the presence of
very small, microscopic flaws or cracks that are
inherent to the material.
• The flaws act as stress concentrators or stress
raisers, amplifying the stress at a given point.
• This localized stress diminishes with distance
away from the crack tip.
22. Fracture Toughness
• Fracture toughness measures a material’s resistance to
brittle fracture when a crack is present.
• It is an indication of the amount of stress required to
propagate a preexisting flaw.
• Flaws may appear as cracks, voids, metallurgical
inclusions, weld defects, design discontinuities, or some
combination thereof.
• It is common practice to assume that flaws are present
and use the linear elastic fracture mechanics (LEFM)
approach to design critical components.
• This approach uses the flaw size and features,
component geometry, loading conditions and the fracture
toughness to evaluate the ability of a component
containing a flaw to resist fracture.
23. Ductile vs Brittle
• The effect of a stress raiser is more significant
in brittle than in ductile materials.
• For a ductile material, plastic deformation
results when the maximum stress exceeds the
yield strength.
• This leads to a more uniform distribution of
stress in the vicinity of the stress raiser; the
maximum stress concentration factor will be
less than the theoretical value.
• In brittle materials, there is no redistribution or
yielding.
24. 24
Brittle Fracture of Ceramics
• Most ceramics
(at room
temperature)
fracture before
any plastic
deformation can
occur.
• Typical crack
configurations
for 4 common
loading
methods.
25. 25
Fracture of Polymers
fibrillar bridges microvoids crack
aligned chains
The fracture strengths of polymers are low relative to ceramics and
metals.
The fracture mode in thermosetting polymers (heavily crosslinked
networks) is typically brittle.
For thermoplastic polymers, both ductile and brittle modes are possible.
Reduced temperature, increased strain rate, sharp notches, increased
specimen thickness are some factors that can influence a brittle fracture.
One phenomenon that occurs in thermoplastics is crazing, very localized
plastic deformation and formation of microvoids and fibrillar bridges
26. 26
26
Impact Testing
final height initial height
• Impact loading:
-- severe testing case
-- makes material more brittle
-- decreases toughness
(Charpy)
27. 27
27
• Pre-WWII: The Titanic • WWII: Liberty ships
Reprinted w/ permission from R.W. Hertzberg, "Deformation and Fracture Mechanics of Engineering Materials", (4th ed.) Fig. 7.1(a), p. 262, John Wiley and Sons,
Inc., 1996. (Orig. source: Dr. Robert D. Ballard, The Discovery of the Titanic.)
Ductile to Brittle Transition Temperature (DBTT)
Disastrous consequences for a welded transport ship,
suddenly split across the entire girth of the ship (40˚F).
The vessels were constructed from steel alloys that
exhibit a DBTT room temp
30. 30
30
• Increasing temperature...
-- increases %EL and Kc
• Ductile-to-Brittle Transition Temperature (DBTT)...
Temperature
BCC metals (e.g., iron at T < 914°C)
Impact
Energy
Temperature
High strength materials (sy > E/150)
polymers
More Ductile
Brittle
Ductile-to-brittle
transition temperature
FCC metals (e.g., Cu, Ni)
31. 31
Fatigue
Fatigue is a form of failure that occurs in structures subjected
to dynamic stresses over an extended period.
Under these conditions it is possible to fail at stress levels
considerably lower than tensile or yield strength for a static
load.
Single largest cause of failure in metals; also affects
polymers and ceramics.
Common failure in bridges, aircraft and machine
components.
Fatigue testing apparatus for rotating bending test
32. • Variation of stress with time that
accounts for fatigue failures.
• The stress may be axial (tension-
compression), flexural (bending)
or torsional (twisting) in nature.
• There are 3 fluctuating stress-
time modes seen in the figure:
(a) reversed stress cycle -
symmetrical amplitude about a
mean zero stress level; (b)
repeated stress cycle -
asymmetrical maxima and
minima relative to the zero stress
level; (c) variable (random)
stress level
32
Cyclic Stress - Fatigue
33. 33
Fatigue
• Fracture surface with
crack initiation at top.
Surface shows
predominantly dull
fibrous texture where
rapid failure occurred
after crack achieved
critical size.
• Fatigue failure
1. Crack initiation
2. Crack propagation
3. Final failure
34. • Fatigue failure is brittle in nature, even in
normally ductile materials; there is very
little plastic deformation associated with
the failure.
• The image shows fatigue striations
(microscopic). 34
• Striations are close
together indicating
low stress, many cycles.
• Widely spaced striations
mean high stress few
cycles.
35. • Federal investigators say metal fatigue caused a hole to rip open in the roof of a
Southwest Airlines jet as it cruised at 35,000 feet last year (2009). The National
Transportation Safety Board says the 14-inch crack developed in a spot where
two sheets of aluminum skin were bonded together on the Boeing 737 jet.
• The pilot made an emergency landing in Charleston, W.Va. There were no
injuries among the 126 passengers and five crew members. Two months after
the scare, Boeing told all airlines with 737s to conduct repeated inspections of
the top of the fuselage near the vertical tail fin. The Federal Aviation
Administration has since made those inspections mandatory.
• Southwest got the plane in 1994 — it's much older than the average Southwest
jet — and had flown it for 50,500 hours and made 42,500 takeoffs and landings
before it sprang a hole in the roof, according to the safety board report. The
safety board said it found signs of metal fatigue by magnifying the area in front of
the tail fin. In a 3-inch stretch, the crack penetrated completely through the
aluminum skin.
• FAA records showed that eight cracks had been found and repaired in the
fuselage during the plane's 14-year checkup.
36. 36
36
• Crack grows incrementally
typ. 1 to 6
a
~ s
increase in crack length per loading cycle
• Failed rotating shaft
-- crack grew even though
Kmax < Kc
-- crack grows faster as
• s increases
• crack gets longer
• loading freq. increases.
crack origin
Adapted from
Fig. 9.28, Callister &
Rethwisch 3e. (Fig.
9.28 is from D.J.
Wulpi, Understanding
How Components Fail,
American Society for
Metals, Materials Park,
OH, 1985.)
Fatigue Mechanism
m
K
dN
da
37. Crack growth rate
1. Initially, growth rate
is small, but
increases with
increasing crack
length.
2. Growth rate
increases with
applied stress level
for a given crack
length (a1).
38. • A specimen is subjected to stress cycling at a maximum stress
amplitude; the number of cycles to failure is determined.
• This procedure is repeated on other specimens at progressively
decreasing stress amplitudes.
• Data are plotted as stress S versus number N of cycles to failure for all
the specimen.
• Typical S-N behavior: the higher the stress level, the fewer the number
of cycles. 38
S-N Curves
39. • For some iron and titanium alloys, the S-N curve becomes horizontal
at higher number of cycles N.
• Essentially it has reached a fatigue limit, and below this stress level
the material will not fatigue.
• The fatigue limit represents the largest value of fluctuating stress
that will not cause failure for an infinite number of cycles.
39
Fatigue Limit
41. • During machining operations, small scratches
and grooves can be introduced; these can
limit the fatigue life.
• Improving the surface finish by polishing will
enhance fatigue life significantly.
• One of the most effective methods of
increasing fatigue performance is by imposing
residual compressive stresses within a thin
outer surface layer. A surface tensile stress
will be offset by the compressive stress.
• Shot peening (localized plastic deformation)
with small (diameters ranging from 0.1 to 1.0
mm), hard particles (shot) are projected at
high velocities on to the surface. The resulting
deformation induces compressive stresses to
a depth of roughly ¼ to ½ of the shot
diameter.
• The influence of shot peening is compared in
the graph. 41
Surface Treatments
42. 42
Improving Fatigue Life
1. Impose a compressive surface stress
(to suppress surface cracks from growing)
--Method 1: shot peening
put
surface
into
compression
shot
--Method 2: carburizing
C-rich gas
2. Remove stress
concentrators.
bad
bad
better
better
43. 43
Case Hardening
•Case hardening is a
technique where both
surface hardness and
fatigue life are improved
for steel alloys.
•Both core region and
carburized outer case
region are seen in image.
Knoop microhardness
shows case has higher
hardness (smaller indent).
•A carbon or nitrogen rich
outer surface layer (case)
is introduced by atomic
diffusion from the
gaseous phase. The case
is typically 1mm deep and
is harder than the inner
core material.
45. Creep
45
•Materials are often placed in service at elevated
temperatures (>0.4 Tm) and exposed to static
mechanical stresses.
•Examples are turbine rotors in jet engines and steam
generators that experience centrifugal stresses and
high pressure steam lines.
•Creep is time dependent, permanent deformation of the
material when subjected to a constant load or stress.
46. Creep
Creep strain vs time at constant load and
constant elevated temperature. Minimum creep
rate (steady-state creep rate), is the slope of
the linear segment in the secondary region.
Rupture lifetime tr is the total time to rupture.
• A typical creep test consists of
subjecting a specimen to a
constant load or stress while
maintaining constant temperature.
• Upon loading, there is instant
elastic deformation. The resulting
creep curve consists of 3 regions:
primary or transient creep adjusts
to the creep level (creep rate may
decrease); secondary creep-
steady state-constant creep rate,
fairly linear region (strain
hardening and recovery stage);
tertiary creep, there is accelerated
rate of strain until rupture (grain
boundary separation, internal
crack formation, cavities and
voids).
47. 47
Creep
Sample deformation at a constant stress (s) vs. time
Primary Creep: slope (creep rate)
decreases with time.
Secondary Creep: steady-state
i.e., constant slope.
Tertiary Creep: slope (creep rate)
increases with time, i.e. acceleration of rate.
s
s,e
0 t