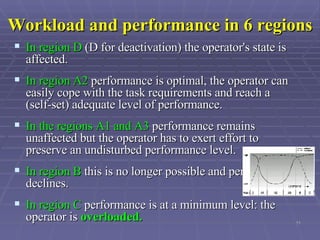
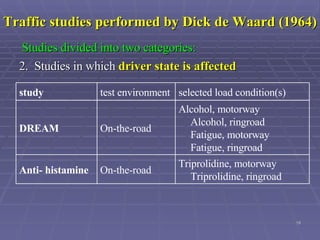
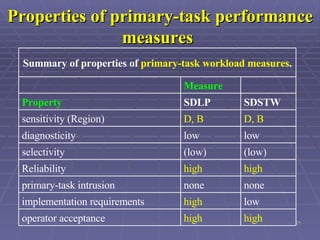
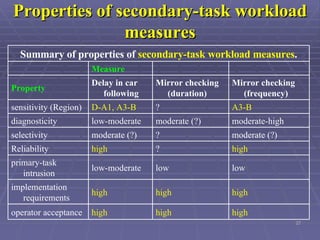
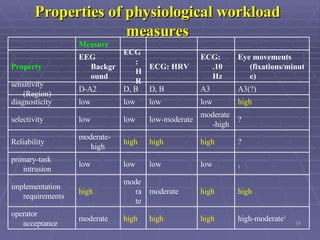
Measurements of Mental Workload Presented by: Yi xiaoli   G0502680F
Content Driver workload overview Model of mental workload, task performance and demands Characteristics of Measures and their dissociation Traffic studies performed by Dick de Waard (1964) Conclusions related to driver workload measures
Definition of Mental Workload A simplistic definition  ---Mental Workload is a  demand  placed upon humans. Defined in term of experienced load ---With experienced load, workload is not only task-specific, it is also  person-specific  (Rouse et al.1993). Not only individual capabilities, but also motivation to perform a task, strategies applied in task performance, as well as mood and operator state, will affect experienced load.
Driver Workload Parkes (1991) defines the  primary task  of the driver as " safe control  of the vehicle within the traffic environment".  Car driving is a dynamic control activity in a continuously changing environment. The driving task is not only influenced by the drivers themselves, but also  by the behavior of other traffic participants . It is not an easy task to model driver behavior.  A useful model offered by Michon (1971, 1985) and Janssen (1979) takes more into account than just “safe control”. In their model, car driving is described  as a complex task  with processes at a minimum of  three hierarchical levels .   A model of the main task of the driver is useful in mental workload research in driving
Three hierarchical levels in Michon and Janssen’s model Top level- --strategic level strategic decisions are made, such as the choice of means of transport, setting of a route goal, and route-choice while driving  Intermediate level- --the maneuvering level.  reactions to local situations including reactions to the behavior of other traffic participants, take place  Lowest level- -- the control level. the basic vehicle-control processes occur, such as lateral-position control. At this level automatic processes occur, while a level higher controlled processing is required.   Driver-performance measures can be connected to the three levels.
Factors that affect driver workload Driver State Affecting Factors   fatigue  monotony  sedative drugs  alcohol   Driver Trait Factors   experience  age  strategy  Environmental Factors   road environment demands  traffic demands  vehicle ergonomics (RTI)  automation  feedback
Model of mental workload, task performance and demands   Figure 1. Hypothetical relationship between demand and performance (based on Meister, 1976)
Model of mental workload, task performance and demands Region A  is described as low operator workload with high performance. An increase in demands does not lead to performance decrements.  In region B  the level of performance declines with increased task demands. So, region B is the region where performance decreases with increases in demand, and increases in workload.  In region C  extreme levels of  load have diminished  performance to a minimum level,  and performance remains at this  minimum level with further  increases in demand
Completing model This model could be completed by adding  a deactivation or D-region  at the far left end. The effects of monotonous tasks, for example, are situated in the D-region.  Since  performance measures themselves  have defined the A-region, it may be useful to split the A-region up into three parts:  In region A2, the operator can easily cope with task demands and performance remains at a stable level with increases in demand without increased effort. In region A3, performance measures still do not show a decline, but the operator is only able to maintain the level of performance by increasing effort.  Put a  workload redline  at the transition from region A2 to A3 to make sure it remains related to  workload  instead of relating it to primary-task performance breakdown.
Workload and performance in 6 regions Task performance and workload as a function of demand figure 2
Workload and performance in 6 regions In region D  (D for deactivation) the operator's state is affected.  In region A2  performance is optimal, the operator can easily cope with the task requirements and reach a (self-set) adequate level of performance. In the regions A1 and A3  performance remains unaffected but the operator has to exert effort to preserve an undisturbed performance level.  In region B  this is no longer possible and performance declines. In region C  performance is at a minimum level: the operator is  overloaded.
Characteristics of Measures   Sensitivity Diagnosticity  Primary-task intrusion  Implementation requirements  Operator acceptance  Selectivity  Bandwidth and reliability
Interdependence characteristics of measures   A highly diagnostic measure is only sensitive to variations in workload in specific computational processes. Therefore  diagnosticity restricts sensitivity . Also,  diagnosticity presupposes selectivity .  Interaction between characteristics can be expected to be particularly high in the case of  secondary tasks . For example, a  diagnostic measure  that is sensitive to secondary-task performance can only be reliable if  primary-task intrusion  of the secondary task is low.  The most desirable characteristics  of measures of mental workload are high sensitivity, preferably in a wide bandwidth, high reliability and low primary task intrusion. Diagnosticity can also be of major importance, in particular, if a certain stage of information processing is suspected to be affected.
Measures 1. Self-report measures   RSME, Rating Scale Mental Effort  Activation scale  NASA Task Load Index  Subjective Workload Assessment Technique  Modified Cooper-Harper scale   Advantages of Self-report scales   high face validity  the ease of application  low costs  limitations of self-report measures   possible confusion of mental and physical load in rating , the operator's inability to distinguish external demands from actual effort or workload experienced  limitations in the operator's ability to introspect and rate expenditure correctly
Measures 2. Performance measures   Primary-task measures   the number of errors made, speed of performance or reaction time measures are frequently used as primary-task performance measures.  Secondary-task measures   Most frequently used as secondary tasks are choice reaction-time tasks, time estimation or time-interval production, memory-search tasks and mental arithmetic (see O'Donnell & Eggemeier, 1986, Eggemeier & Wilson, 1991 and Wickens, 1992, for overviews)  Reference tasks   Reference tasks are standardised tasks that are performed before and after the task under evaluation and they mainly serve as a checking instrument for trend effects. Changes in performance on reference tasks can indicate effects of mental load of the primary task.
Measures 3. Physiological measures   Anatomical category   CNS --- Central Nervous System measures  PNS --- Peripheral Nervous System measures  SNS - The Somatic Nervous System is concerned with the activation of voluntary muscles  ,  ANS - Autonomic Nervous System controls internal organs and is autonomous in the sense that ANS innervated muscles are not under voluntary control.  Peripheral response Cardiac Functions  Background Electroencephalogram (EEG)  Eye fixations  Other physiological measures :  Pupil diameter; Endogenous eye blinks /EOG; Blood pressure; Respiration; Electrodermal Activity, EDA; Hormone levels; Event Related Potentials; Electromyogram, EMG;
Dissociation of measures Measures dissociate if they do not correspond to changes in workload, or if one measure indicates a  decrease  in workload while the other indicates an  increase.   Demand, in particular  in the A3 region  might cause a dissociation between performance and the other measures,  In the C region  performance and self-report ratings may `dissociate'.  ---A good agreement between performance results and self-reports (Vidulich & Wickens, 1986) is only to be expected if performance is in the D, A2 and B region, and  not  in the A1, A3 or C regions.
Traffic studies performed by Dick de Waard (1964) Studies divided into two categories: 1. Studies includes increase in  complexity Increase in  road complexity  (environment) Increase in  task complexity   (additional task) Woodland Road, exp. Moorland Road, exp. On-the-road Road layout  Noise barrier Noise barrier + Eye mark. On-the-road Noise barrier combined entrance/exit entrance/exit + Eye mark. On-the-road Weaving section  selected load condition(s) test environment study warning messages  Simulator  Tutoring  phone, motorway phone, ringroad  On-the-road Car Phone  selected load condition(s) test environment study
Traffic studies performed by Dick de Waard (1964) 2.  Studies in which  driver state is affected Studies divided into two categories: Triprolidine, motorway  Triprolidine, ringroad  On-the-road Anti- histamine Alcohol, motorway  Alcohol, ringroad  Fatigue, motorway  Fatigue, ringroad  On-the-road DREAM  selected load condition(s) test environment study
Properties of self-report measures   high  high  operator acceptance  low low implementation requirements  low low primary-task intrusion  high (?) high   Reliability  (?) prob.  high  selectivity  low  low  diagnosticity  D, (B-C) (D-)A1, A3-B sensitivity (Region) Activation RSME Property   Measure   Summary of properties of  self-report workload measures .
Properties of primary-task performance measures   high  high  operator acceptance  low high implementation requirements  none none primary-task intrusion  high  high  Reliability  (low) (low)  selectivity  low  low  diagnosticity  D, B D, B sensitivity (Region) SDSTW SDLP Property   Measure   Summary of properties of  primary-task workload measures .
Properties of secondary-task workload measures high high  high  operator acceptance  high high high implementation requirements  low low low-moderate primary-task intrusion  high  ?  high  Reliability  moderate (?) ?  moderate (?)  selectivity  moderate-high  moderate (?)  low-moderate  diagnosticity  A3-B ? D-A1, A3-B sensitivity (Region) Mirror checking (frequency) Mirror checking (duration) Delay in car following Property     Measure   Summary of properties of  secondary-task workload measures .
Properties of physiological workload measures high-moderate 1 high high high  moderate  operator acceptance  high high moderate moderate high implementation requirements  1  low low low low primary-task intrusion  ? high  high high moderate-high  Reliability  ? moderate-high low-moderate low low  selectivity  high low  low  low  low  diagnosticity  A3(?) A3 D, B D, B D-A2 sensitivity (Region) Eye movements (fixations/minute) ECG: .10 Hz ECG: HRV ECG: HR EEG Background Property         Measure  
Conclusions related to driver workload measures   The most important characteristic of a measure is its  sensitivity  to workload. Workload reflecting the individual reaction to task demand.  A highly diagnostic measure is selectively sensitive, in particular, diagnosticity has strong links to the  multiple-resource theory  ,on the other hand, diagnosticity restricts sensitivity to a certain bandwidth Of primary importance in mental workload research is the  region of performance . Optimal performance with low mental workload is obtained  in region A2 . Not only driver state, but also the complexity of a task or of the driving environment may cause an increase in mental workload.
Characteristics of measures   Workload in 6 regions and sensitivity of different measures to driver mental workload
Conclusions related to driver workload measures Optimal performance  of driver is in region A2. If the traffic environment becomes more complex, drivers have to exert (task-related) effort to maintain performance. Once the driver is no longer able to successfully act against detrimental effects of increased task demands by means of effort compensation, the level of performance will drop to be  in Region B .  With further increases in demand, performance will further drop until a minimum level is reached and  Region C  is entered. In this region, performance measures are insensitive, nor will measures of heart rate reflect workload.  Only scores on the activation scale may indicate overload.  None of the measures alone is sufficient to reflect mental workload, Only  in combination  with self-reports and/or physiological parameters can a conclusion about workload level be made.
Reference Mayser, C., Piechulla, W., Weiss, K.-E., & König, W. (2003).  Driver workload monitoring . In H. Strasser, K. Kluth, H. Rausch, & H. Bubb (Eds.). Quality of Work and Products in Enterprises of the Future. Proceedings of the 50th-Anniversary Conference of the GfA and the XVII Annual ISOES Conference in Munich, May 07th-09th, 2003 (pp. 41-44). Stuttgart: Ergonomia.  Tatsuru Daimon(1992)  Driver's Characteristics and Performances when using In-Vehicle Navigation System  VEHICLE NAVIGATION  6  INFORMATION SYSTEMS  1992 IEEE 92CH3198-910000-025-1  WILLEM B. VERWEY(2000).  On-line driver workload estimation. EOEects of road situation and age on secondary  task measures,  ERGONOMICS, 2000, VOL. 43, NO. 2, 187± 209 KAREL A. BROOKHUIS* and DICK DE WAARD(2002),  On the assessment of (mental) workload and other subjective qualifications ,  ERGONOMICS, 2002, VOL. 45, NO. 14, 1026 ± 1030 De Waard, D. (1996).  The measurement of drivers' mental workload . PhD thesis, University of Groningen. Haren, The Netherlands: University of Groningen, Traffic Research Centre.
Thank you !

Measurement Of Mental Workload

  • 1.
    Measurements of MentalWorkload Presented by: Yi xiaoli G0502680F
  • 2.
    Content Driver workloadoverview Model of mental workload, task performance and demands Characteristics of Measures and their dissociation Traffic studies performed by Dick de Waard (1964) Conclusions related to driver workload measures
  • 3.
    Definition of MentalWorkload A simplistic definition ---Mental Workload is a demand placed upon humans. Defined in term of experienced load ---With experienced load, workload is not only task-specific, it is also person-specific (Rouse et al.1993). Not only individual capabilities, but also motivation to perform a task, strategies applied in task performance, as well as mood and operator state, will affect experienced load.
  • 4.
    Driver Workload Parkes(1991) defines the primary task of the driver as " safe control of the vehicle within the traffic environment". Car driving is a dynamic control activity in a continuously changing environment. The driving task is not only influenced by the drivers themselves, but also by the behavior of other traffic participants . It is not an easy task to model driver behavior. A useful model offered by Michon (1971, 1985) and Janssen (1979) takes more into account than just “safe control”. In their model, car driving is described as a complex task with processes at a minimum of three hierarchical levels . A model of the main task of the driver is useful in mental workload research in driving
  • 5.
    Three hierarchical levelsin Michon and Janssen’s model Top level- --strategic level strategic decisions are made, such as the choice of means of transport, setting of a route goal, and route-choice while driving Intermediate level- --the maneuvering level. reactions to local situations including reactions to the behavior of other traffic participants, take place Lowest level- -- the control level. the basic vehicle-control processes occur, such as lateral-position control. At this level automatic processes occur, while a level higher controlled processing is required. Driver-performance measures can be connected to the three levels.
  • 6.
    Factors that affectdriver workload Driver State Affecting Factors fatigue monotony sedative drugs alcohol Driver Trait Factors experience age strategy Environmental Factors road environment demands traffic demands vehicle ergonomics (RTI) automation feedback
  • 7.
    Model of mentalworkload, task performance and demands Figure 1. Hypothetical relationship between demand and performance (based on Meister, 1976)
  • 8.
    Model of mentalworkload, task performance and demands Region A is described as low operator workload with high performance. An increase in demands does not lead to performance decrements. In region B the level of performance declines with increased task demands. So, region B is the region where performance decreases with increases in demand, and increases in workload. In region C extreme levels of load have diminished performance to a minimum level, and performance remains at this minimum level with further increases in demand
  • 9.
    Completing model Thismodel could be completed by adding a deactivation or D-region at the far left end. The effects of monotonous tasks, for example, are situated in the D-region. Since performance measures themselves have defined the A-region, it may be useful to split the A-region up into three parts: In region A2, the operator can easily cope with task demands and performance remains at a stable level with increases in demand without increased effort. In region A3, performance measures still do not show a decline, but the operator is only able to maintain the level of performance by increasing effort. Put a workload redline at the transition from region A2 to A3 to make sure it remains related to workload instead of relating it to primary-task performance breakdown.
  • 10.
    Workload and performancein 6 regions Task performance and workload as a function of demand figure 2
  • 11.
    Workload and performancein 6 regions In region D (D for deactivation) the operator's state is affected. In region A2 performance is optimal, the operator can easily cope with the task requirements and reach a (self-set) adequate level of performance. In the regions A1 and A3 performance remains unaffected but the operator has to exert effort to preserve an undisturbed performance level. In region B this is no longer possible and performance declines. In region C performance is at a minimum level: the operator is overloaded.
  • 12.
    Characteristics of Measures Sensitivity Diagnosticity Primary-task intrusion Implementation requirements Operator acceptance Selectivity Bandwidth and reliability
  • 13.
    Interdependence characteristics ofmeasures A highly diagnostic measure is only sensitive to variations in workload in specific computational processes. Therefore diagnosticity restricts sensitivity . Also, diagnosticity presupposes selectivity . Interaction between characteristics can be expected to be particularly high in the case of secondary tasks . For example, a diagnostic measure that is sensitive to secondary-task performance can only be reliable if primary-task intrusion of the secondary task is low. The most desirable characteristics of measures of mental workload are high sensitivity, preferably in a wide bandwidth, high reliability and low primary task intrusion. Diagnosticity can also be of major importance, in particular, if a certain stage of information processing is suspected to be affected.
  • 14.
    Measures 1. Self-reportmeasures RSME, Rating Scale Mental Effort Activation scale NASA Task Load Index Subjective Workload Assessment Technique Modified Cooper-Harper scale Advantages of Self-report scales high face validity the ease of application low costs limitations of self-report measures possible confusion of mental and physical load in rating , the operator's inability to distinguish external demands from actual effort or workload experienced limitations in the operator's ability to introspect and rate expenditure correctly
  • 15.
    Measures 2. Performancemeasures Primary-task measures the number of errors made, speed of performance or reaction time measures are frequently used as primary-task performance measures. Secondary-task measures Most frequently used as secondary tasks are choice reaction-time tasks, time estimation or time-interval production, memory-search tasks and mental arithmetic (see O'Donnell & Eggemeier, 1986, Eggemeier & Wilson, 1991 and Wickens, 1992, for overviews) Reference tasks Reference tasks are standardised tasks that are performed before and after the task under evaluation and they mainly serve as a checking instrument for trend effects. Changes in performance on reference tasks can indicate effects of mental load of the primary task.
  • 16.
    Measures 3. Physiologicalmeasures Anatomical category CNS --- Central Nervous System measures PNS --- Peripheral Nervous System measures SNS - The Somatic Nervous System is concerned with the activation of voluntary muscles , ANS - Autonomic Nervous System controls internal organs and is autonomous in the sense that ANS innervated muscles are not under voluntary control. Peripheral response Cardiac Functions Background Electroencephalogram (EEG) Eye fixations Other physiological measures : Pupil diameter; Endogenous eye blinks /EOG; Blood pressure; Respiration; Electrodermal Activity, EDA; Hormone levels; Event Related Potentials; Electromyogram, EMG;
  • 17.
    Dissociation of measuresMeasures dissociate if they do not correspond to changes in workload, or if one measure indicates a decrease in workload while the other indicates an increase. Demand, in particular in the A3 region might cause a dissociation between performance and the other measures, In the C region performance and self-report ratings may `dissociate'. ---A good agreement between performance results and self-reports (Vidulich & Wickens, 1986) is only to be expected if performance is in the D, A2 and B region, and not in the A1, A3 or C regions.
  • 18.
    Traffic studies performedby Dick de Waard (1964) Studies divided into two categories: 1. Studies includes increase in complexity Increase in road complexity (environment) Increase in task complexity (additional task) Woodland Road, exp. Moorland Road, exp. On-the-road Road layout Noise barrier Noise barrier + Eye mark. On-the-road Noise barrier combined entrance/exit entrance/exit + Eye mark. On-the-road Weaving section selected load condition(s) test environment study warning messages Simulator Tutoring phone, motorway phone, ringroad On-the-road Car Phone selected load condition(s) test environment study
  • 19.
    Traffic studies performedby Dick de Waard (1964) 2. Studies in which driver state is affected Studies divided into two categories: Triprolidine, motorway Triprolidine, ringroad On-the-road Anti- histamine Alcohol, motorway Alcohol, ringroad Fatigue, motorway Fatigue, ringroad On-the-road DREAM selected load condition(s) test environment study
  • 20.
    Properties of self-reportmeasures high high operator acceptance low low implementation requirements low low primary-task intrusion high (?) high Reliability (?) prob. high selectivity low low diagnosticity D, (B-C) (D-)A1, A3-B sensitivity (Region) Activation RSME Property   Measure   Summary of properties of self-report workload measures .
  • 21.
    Properties of primary-taskperformance measures high high operator acceptance low high implementation requirements none none primary-task intrusion high high Reliability (low) (low) selectivity low low diagnosticity D, B D, B sensitivity (Region) SDSTW SDLP Property   Measure   Summary of properties of primary-task workload measures .
  • 22.
    Properties of secondary-taskworkload measures high high high operator acceptance high high high implementation requirements low low low-moderate primary-task intrusion high ? high Reliability moderate (?) ? moderate (?) selectivity moderate-high moderate (?) low-moderate diagnosticity A3-B ? D-A1, A3-B sensitivity (Region) Mirror checking (frequency) Mirror checking (duration) Delay in car following Property     Measure   Summary of properties of secondary-task workload measures .
  • 23.
    Properties of physiologicalworkload measures high-moderate 1 high high high moderate operator acceptance high high moderate moderate high implementation requirements 1 low low low low primary-task intrusion ? high high high moderate-high Reliability ? moderate-high low-moderate low low selectivity high low low low low diagnosticity A3(?) A3 D, B D, B D-A2 sensitivity (Region) Eye movements (fixations/minute) ECG: .10 Hz ECG: HRV ECG: HR EEG Background Property         Measure  
  • 24.
    Conclusions related todriver workload measures The most important characteristic of a measure is its sensitivity to workload. Workload reflecting the individual reaction to task demand. A highly diagnostic measure is selectively sensitive, in particular, diagnosticity has strong links to the multiple-resource theory ,on the other hand, diagnosticity restricts sensitivity to a certain bandwidth Of primary importance in mental workload research is the region of performance . Optimal performance with low mental workload is obtained in region A2 . Not only driver state, but also the complexity of a task or of the driving environment may cause an increase in mental workload.
  • 25.
    Characteristics of measures Workload in 6 regions and sensitivity of different measures to driver mental workload
  • 26.
    Conclusions related todriver workload measures Optimal performance of driver is in region A2. If the traffic environment becomes more complex, drivers have to exert (task-related) effort to maintain performance. Once the driver is no longer able to successfully act against detrimental effects of increased task demands by means of effort compensation, the level of performance will drop to be in Region B . With further increases in demand, performance will further drop until a minimum level is reached and Region C is entered. In this region, performance measures are insensitive, nor will measures of heart rate reflect workload. Only scores on the activation scale may indicate overload. None of the measures alone is sufficient to reflect mental workload, Only in combination with self-reports and/or physiological parameters can a conclusion about workload level be made.
  • 27.
    Reference Mayser, C.,Piechulla, W., Weiss, K.-E., & König, W. (2003). Driver workload monitoring . In H. Strasser, K. Kluth, H. Rausch, & H. Bubb (Eds.). Quality of Work and Products in Enterprises of the Future. Proceedings of the 50th-Anniversary Conference of the GfA and the XVII Annual ISOES Conference in Munich, May 07th-09th, 2003 (pp. 41-44). Stuttgart: Ergonomia. Tatsuru Daimon(1992) Driver's Characteristics and Performances when using In-Vehicle Navigation System VEHICLE NAVIGATION 6 INFORMATION SYSTEMS 1992 IEEE 92CH3198-910000-025-1 WILLEM B. VERWEY(2000). On-line driver workload estimation. EOEects of road situation and age on secondary task measures, ERGONOMICS, 2000, VOL. 43, NO. 2, 187± 209 KAREL A. BROOKHUIS* and DICK DE WAARD(2002), On the assessment of (mental) workload and other subjective qualifications , ERGONOMICS, 2002, VOL. 45, NO. 14, 1026 ± 1030 De Waard, D. (1996). The measurement of drivers' mental workload . PhD thesis, University of Groningen. Haren, The Netherlands: University of Groningen, Traffic Research Centre.
  • 28.