Download to read offline


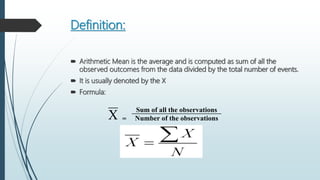
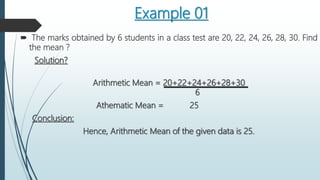
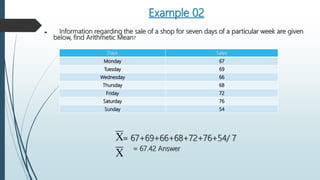

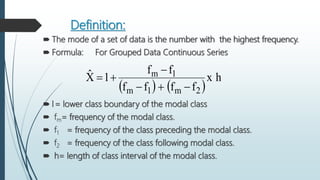
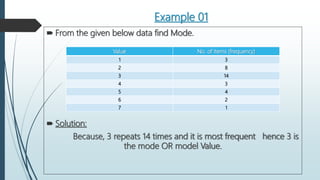
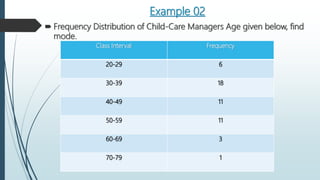
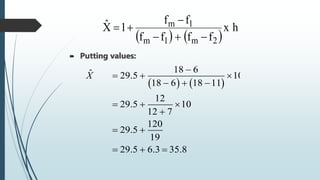


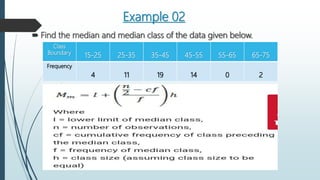

The document defines and provides examples for calculating the mean, mode, and median of a data set. The mean is the average, calculated by summing all values and dividing by the total number of data points. The mode is the value that occurs most frequently. The median is the middle value when the data is arranged in order, and is the value for which half of the data points are above and half below. Examples are provided to demonstrate calculating each measure using various data sets.


