• Mean, Median,and Mode are measures of the
central tendency. These values are used to define
the various parameters of the given data set. The
measure of central tendency (Mean, Median, and
Mode) gives useful insights about the data studied,
these are used to study any type of data such as
the average salary of employees in an organization,
the median age of any class, the number of people
who plays cricket in a sports club, etc.
3.
• Measures ofCentral Tendency
Measure of central tendency is the representation of various values of the given data set.
There are various measures of central tendency and the most important three measures of
central tendency are:
Mean
Median
Mode
• What are Mean, Median, and Mode?
Mean, median, and mode are measures of central tendency used in statistics to summarize a
set of data.
• Mean ( or μ):
x
̅ The mean, or arithmetic average, is calculated by summing all the values
in a dataset and dividing by the total number of values. It’s sensitive to outliers and is
commonly used when the data is symmetrically distributed.
• Median (M): The median is the middle value when the dataset is arranged in ascending
or descending order. If there’s an even number of values, it’s the average of the two
middle values. The median is robust to outliers and is often used when the data is
skewed.
• Mode (Z): The mode is the value that occurs most frequently in the dataset. Unlike the
mean and median, the mode can be applied to both numerical and categorical data. It’s
useful for identifying the most common value in a dataset.
4.
• What isMean?
• Mean is the sum of all the values in the data
set divided by the number of values in the
data set. It is also called the Arithmetic
Average. Mean is denoted as x̅ and is read as x
bar.
5.
• Mean Symbol
•The symbol used to represent the mean, or arithmetic average,
of a dataset is typically the Greek letter “μ” (mu) when
referring to the population mean, and “ ” (x-bar) when
x̄
referring to the sample mean.
• Population Mean: μ (mu)
• Sample Mean: (x-bar)
x̄
• These symbols are commonly used in statistical notation to
represent the average value of a set of data points.
• Mean Formula
• The formula to calculate the mean is:
• Mean (x̅) = Sum of Values / Number of Values
• If x1, x2, x3,……, xn are the values of a data set then the mean is
calculated as:
• x̅ = (x1 + x2 + x3 + . . . + xn) / n
6.
Example: Find themean of data sets 10, 30, 40, 20, and 50.
• Solution:
• Mean of the data 10, 30, 40, 20, 50 is
• Mean = (sum of all values) / (number of values)
• Mean = (10 + 30 + 40 + 20+ 50) / 5 = 30
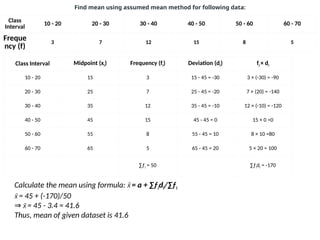
• Question 1: Find the mean of the following data set.
• 10, 20, 36, 12, 35, 40, 36, 30, 36, 40
• Solution:
• Given,
• xi = 10, 20, 36, 12, 35, 40, 36, 30, 36, 40
• n = 10
• Mean = ∑xi/n
• = (10 + 20 + 36 + 12 + 35 + 40 + 36 + 30 + 36 + 40)/10
• = 295/10
• = 29.5
7.
• Calculate themean of the first 10 natural numbers.
• Solution:
• First 10 natural numbers = 1, 2, 3, 4, 5, 6, 7, 8, 9, 10
• Sum of first 10 natural numbers = (1 + 2 + 3 + 4 + 5 + 6 + 7 + 8 + 9 + 10)
• Mean = Sum of 10 natural numbers/10
• ⇒ Mean = (1 + 2 + 3 + 4 + 5 + 6 + 7 + 8 + 9 + 10)/10
• ⇒ Mean = 55/10
• ⇒ Mean = 5.5
• Calculate the mean for the following set of data 2, 6, 7, 9, 15, 11, 13, 12.
• Solution:
• Given,
• Observed values 2, 6, 7, 9, 15, 11, 13, 12
• Total number of observed values = 8
• Using Mean Formula for Grouped Data
• Mean = (Sum of observed values in data) / (Total number of observed values in data)
• Sum of observed values = 2 + 6 + 7 + 9 + 15 + 11 + 13 + 12 = 75
• Total number of observed values = 8
• Mean = 75/8
• ⇒ Mean = 9.375
•
Calculate the mean of the first 5 even natural numbers.
• Solution:
• Given,
• Observed first 5 even natural numbers 2, 4, 6, 8, 10
• Total number of observed values = 5
• Using Mean Formula
• Mean = (Sum of observed values in data)/(Total number of observed values in data)
• ⇒ Sum of observed values = 2 + 4 + 6 + 8 + 10 = 30
• Total number of observed values = 5
• ⇒ Mean = 30/5
• ⇒ Mean = 6
• Therefore, mean for first 5 even numbers = 6
8.
• Calculate themean of the first 10 natural odd numbers.
• Solution:
• Given,
• Observed first 5 odd natural numbers 1, 3, 5, 7, 9.
• Total number of observed values = 5
• Using Mean Formula
• Mean = (Sum of observed values in data)/(Total number of observed values in data)
• Sum of observed values = 1 + 3 + 5 + 7 + 9 = 25
• Total number of observed values = 5
• ⇒ Mean = 25 / 5
• ⇒ Mean = 5
•
Calculate missing values from the observed set 2, 6, 7, x, whose mean is 6.
• Solution:
• Given,
• Observed values 2, 6, 7, x
• Number of observed values = 4
• Mean = 6
• Using Mean Formula
• Mean = (Sum of observed values in data)/(Total number of observed values in data)
• ⇒ Sum of observed values = 2 + 6 + 7 + x = 15 + x
• Total number of observed values = 4
• ⇒ 6 = (15 + x)/4
• ⇒ 6 × 4 = 15 + x
• ⇒ x = 9
• Therefore, missing value from the set is 9
9.
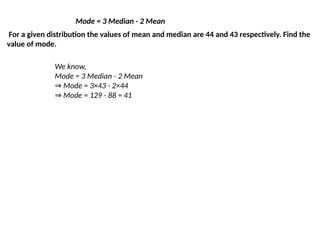
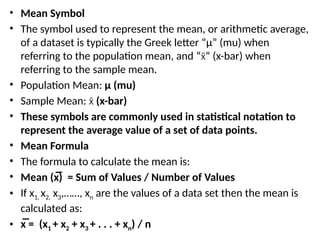
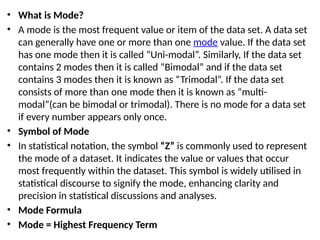
• What isMedian?
• A Median is a middle value for sorted data. The sorting of the data can be
done either in ascending order or descending order. A median divides the
data into two equal halves.
• Median Symbol
• The letter “M” is commonly used to represent the median of a dataset,
whether it’s for a population or a sample. This notation simplifies the
representation of statistical concepts and calculations, making it easier to
understand and apply in various contexts. Therefore, in Indian statistical
practice, “M” is widely accepted and understood as the symbol for the
median.
• Median Formula
• The formula for the median is:
• If the number of values (n value) in the data set is odd then the formula to
calculate the median is:
• Median = [(n + 1)/2]th
term
• If the number of values (n value) in the data set is even then the formula to
calculate the median is:
• Median = [(n/2)th
term + {(n/2) + 1}th
term] / 2
10.
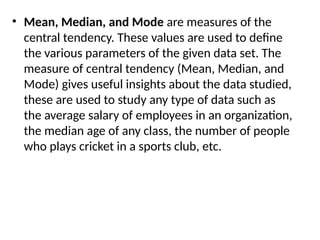
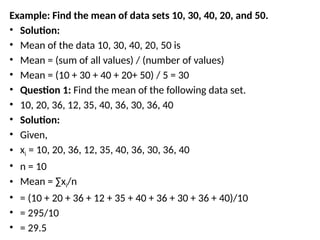
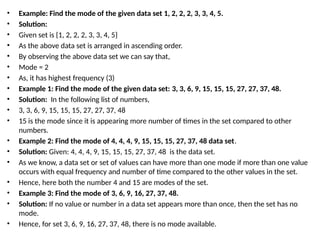
• Find themedian of given data set 30, 40, 10, 20, and 50.
• Solution:
• Median of the data 30, 40, 10, 20, 50 is,
• Step 1: Order the given data in ascending order as:
• 10, 20, 30, 40, 50
• Step 2: Check n (number of terms of data set) is even or odd and find the median of the
data with respective ‘n’ value.
• Step 3: Here, n = 5 (odd)
• Median = [(n + 1)/2]th
term
• Median = [(5 + 1)/2]th
term
• = 30
• Median salary of five friends, where the individual salary of each friend is, 74,000, 82,000,
75,000, 96,000, and 88,000. First arranged in ascending order 74,000, 75,000, 82,000,
88,000, and 96,000 then by observing the data we get the median salary as 82,000.
• Median Age of a Group- Consider a group of people ages 25, 30, 27, 22, 35, and 40. First,
arrange the ages in ascending order: 22, 25, 27, 30, 35, 40. The median age is the middle
value, which is 30 in this case.
• Median Test Scores- In a class, the test scores of 10 students are 78, 85, 90, 72, 91, 68, 80,
95, 87, and 81. Arrange them in ascending order: 68, 72, 78, 80, 81, 85, 87, 90, 91, and
95. Since there are an even number of scores, the median is the average of the two
middle values, which are 81 and 85. The median test score is (81 + 85) / 2 = 83.
11.
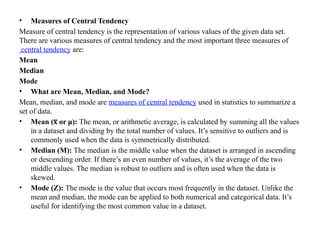
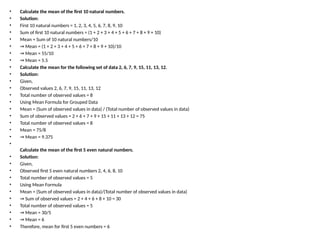
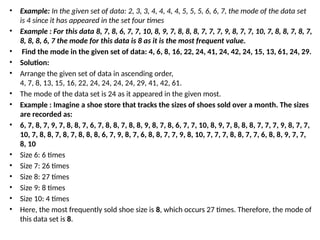
Example 1: Findthe median of the given data set 60, 70, 10, 30, and 50
• Solution:
• Median of the data 60, 70, 10, 30, and 50 is,
• Step 1: Order the given data in ascending order as:
• 10, 30, 50, 60, 70
• Step 2: Check if n (number of terms of data set) is even or odd and find the median of the data with respective ‘n’ value.
• Step 3: Here, n = 5 (odd)
• Median = [(n + 1)/2]th
term
• Median = [(5 + 1)/2]th
term = 3rd
term
• = 50
Example 2: Find the median of the given data set 13, 47, 19, 25, 75, 66, and 50
• Solution:
• Median of the data 13, 47, 19, 25, 75, 66, and 50 is,
• Step 1: Order the given data in ascending order as:
• 13, 19, 25, 47, 50, 66, 75
• Step 2: Check if n (number of terms of data set) is even or odd and find the median of the data with respective ‘n’ value.
• Step 3: Here, n = 7 (odd)
• Median = [(n + 1)/2]th
term
• Median = [(7 + 1)/2]th
term = 4th
term
• = 47
• Consider the dataset: 3,6,1,9,2,73,6,1,9,2,7 with n=6.
• Sort the Data: Arranging in ascending order: 1,2,3,6,7,9.
• Identify the Two Middle Positions: For n=6, the middle positions are 6/2=3 and 6/2+1=4.
• Calculate the Median: The median is the average of the values at positions 3 and 4: (3+6)/2 = 4.5.
• So, the median of the given dataset is 4.5.
12.
• What isMode?
• A mode is the most frequent value or item of the data set. A data set
can generally have one or more than one mode value. If the data set
has one mode then it is called “Uni-modal”. Similarly, If the data set
contains 2 modes then it is called “Bimodal” and if the data set
contains 3 modes then it is known as “Trimodal”. If the data set
consists of more than one mode then it is known as “multi-
modal”(can be bimodal or trimodal). There is no mode for a data set
if every number appears only once.
• Symbol of Mode
• In statistical notation, the symbol “Z” is commonly used to represent
the mode of a dataset. It indicates the value or values that occur
most frequently within the dataset. This symbol is widely utilised in
statistical discourse to signify the mode, enhancing clarity and
precision in statistical discussions and analyses.
• Mode Formula
• Mode = Highest Frequency Term
13.
• Example: Findthe mode of the given data set 1, 2, 2, 2, 3, 3, 4, 5.
• Solution:
• Given set is {1, 2, 2, 2, 3, 3, 4, 5}
• As the above data set is arranged in ascending order.
• By observing the above data set we can say that,
• Mode = 2
• As, it has highest frequency (3)
• Example 1: Find the mode of the given data set: 3, 3, 6, 9, 15, 15, 15, 27, 27, 37, 48.
• Solution: In the following list of numbers,
• 3, 3, 6, 9, 15, 15, 15, 27, 27, 37, 48
• 15 is the mode since it is appearing more number of times in the set compared to other
numbers.
• Example 2: Find the mode of 4, 4, 4, 9, 15, 15, 15, 27, 37, 48 data set.
• Solution: Given: 4, 4, 4, 9, 15, 15, 15, 27, 37, 48 is the data set.
• As we know, a data set or set of values can have more than one mode if more than one value
occurs with equal frequency and number of time compared to the other values in the set.
• Hence, here both the number 4 and 15 are modes of the set.
• Example 3: Find the mode of 3, 6, 9, 16, 27, 37, 48.
• Solution: If no value or number in a data set appears more than once, then the set has no
mode.
• Hence, for set 3, 6, 9, 16, 27, 37, 48, there is no mode available.
14.
• Example: Inthe given set of data: 2, 3, 3, 4, 4, 4, 4, 5, 5, 5, 6, 6, 7, the mode of the data set
is 4 since it has appeared in the set four times
• Example : For this data 8, 7, 8, 6, 7, 7, 10, 8, 9, 7, 8, 8, 8, 7, 7, 7, 9, 8, 7, 7, 10, 7, 8, 8, 7, 8, 7,
8, 8, 8, 6, 7 the mode for this data is 8 as it is the most frequent value.
• Find the mode in the given set of data: 4, 6, 8, 16, 22, 24, 41, 24, 42, 24, 15, 13, 61, 24, 29.
• Solution:
• Arrange the given set of data in ascending order,
4, 7, 8, 13, 15, 16, 22, 24, 24, 24, 24, 29, 41, 42, 61.
• The mode of the data set is 24 as it appeared in the given most.
• Example : Imagine a shoe store that tracks the sizes of shoes sold over a month. The sizes
are recorded as:
• 6, 7, 8, 7, 9, 7, 8, 8, 7, 6, 7, 8, 8, 7, 8, 8, 9, 8, 7, 8, 6, 7, 7, 10, 8, 9, 7, 8, 8, 8, 7, 7, 7, 9, 8, 7, 7,
10, 7, 8, 8, 7, 8, 7, 8, 8, 8, 6, 7, 9, 8, 7, 6, 8, 8, 7, 7, 9, 8, 10, 7, 7, 7, 8, 8, 7, 7, 6, 8, 8, 9, 7, 7,
8, 10
• Size 6: 6 times
• Size 7: 26 times
• Size 8: 27 times
• Size 9: 8 times
• Size 10: 4 times
• Here, the most frequently sold shoe size is 8, which occurs 27 times. Therefore, the mode of
this data set is 8.
15.
Grouped Mean
• Meanof grouped data is the process of finding the average of a set of data
that are grouped together in different categories. To determine the mean of a
grouped data, a frequency table is required to set across the frequencies of
the data which makes it simple to calculate. There are three main methods of
calculating the mean of grouped data, they are - direct method, assumed
mean method, and step deviation method. Each of these methods has its own
formulas and ways to calculate the mean.
Mean of Grouped Data Formula
• The mean formula is defined as the sum of the observations divided by the
total number of observations. There are two different formulas for calculating
the mean for ungrouped data and the mean for grouped data. Let us look at
the formula to calculate the mean of grouped data. The formula is: = Σfixi/N
x̄
Where,
• = the mean value of the set of given data.
x̄
• f = frequency of the individual data
• N = sum of frequencies
• Hence, the average of all the data points is termed as mean.
16.
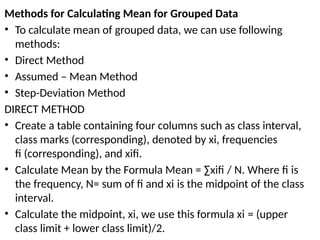
Methods for CalculatingMean for Grouped Data
• To calculate mean of grouped data, we can use following
methods:
• Direct Method
• Assumed – Mean Method
• Step-Deviation Method
DIRECT METHOD
• Create a table containing four columns such as class interval,
class marks (corresponding), denoted by xi, frequencies
fi (corresponding), and xifi.
• Calculate Mean by the Formula Mean = ∑xifi / N. Where fi is
the frequency, N= sum of fi and xi is the midpoint of the class
interval.
• Calculate the midpoint, xi, we use this formula xi = (upper
class limit + lower class limit)/2.
17.
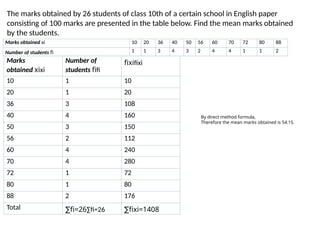
The marks obtainedby 26 students of class 10th of a certain school in English paper
consisting of 100 marks are presented in the table below. Find the mean marks obtained
by the students.
Marks obtained xi 10 20 36 40 50 56 60 70 72 80 88
Number of students fi 1 1 3 4 3 2 4 4 1 1 2
Marks
obtained xixi
Number of
students fifi
fixifixi
10 1 10
20 1 20
36 3 108
40 4 160
50 3 150
56 2 112
60 4 240
70 4 280
72 1 72
80 1 80
88 2 176
Total ∑fi=26∑fi=26 ∑fixi=1408
By direct method formula,
Therefore the mean marks obtained is 54.15.
18.
Class
Interval
0 - 1010 - 20 20 - 30 30 - 40 40 - 50
Frequen
cy (fi)
9 13 8 15 10
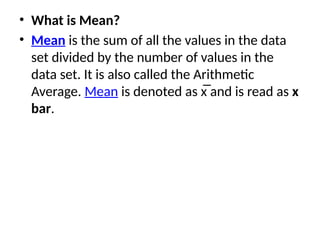
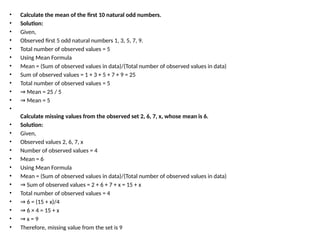
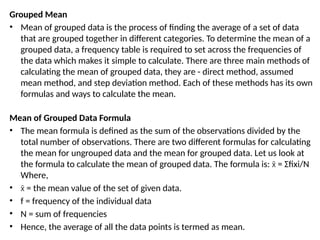
Example: Find the mean of the following
data.
• The first step is to create the table with the
midpoint or marks and the product of the
frequency and midpoint. To calculate the
midpoint we find the average between the class
interval by using the formula mentioned above.
• Midpoint xii = 0 - 10 = 5 ([10 + 0]/2), 10 - 20 =
15 ([20 + 10]/2) and so on.
• xifi = For the class interval 0 - 10 = 5 × 9 = 45,
For the class interval 10 - 20 = 13 × 15 = 195 and
so on.
Once we have determined the totals, let us use the
formula to calculate the estimated mean.
Estimated Mean = ∑xifi / ∑fi = 1415/55 = 25.73.
Class
Interv
al
Freque
ncy (fii)
Class
Mark
(xii)
xiifii
0 - 10 9 5 45
10 - 20 13 15 195
20 - 30 8 25 200
30 - 40 15 35 525
40 - 50 10 45 450
Total 55 1415
19.
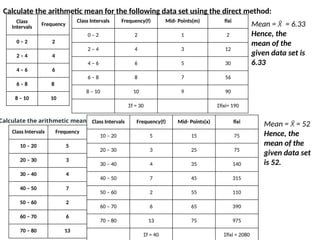
Calculate the arithmeticmean for the following data set using the direct method:
Class
Intervals Frequency
0 – 2 2
2 – 4 4
4 – 6 6
6 – 8 8
8 – 10 10
Class Intervals Frequency(f) Mid- Points(m) fixi
0 – 2 2 1 2
2 – 4 4 3 12
4 – 6 6 5 30
6 – 8 8 7 56
8 – 10 10 9 90
Σf = 30 Σfixi= 190
Mean = = 6.33
X̄
Hence, the
mean of the
given data set is
6.33
Class Intervals Frequency
10 – 20 5
20 – 30 3
30 – 40 4
40 – 50 7
50 – 60 2
60 – 70 6
70 – 80 13
Calculate the arithmetic mean Class Intervals Frequency(f) Mid- Points(x) fixi
10 – 20 5 15 75
20 – 30 3 25 75
30 – 40 4 35 140
40 – 50 7 45 315
50 – 60 2 55 110
60 – 70 6 65 390
70 – 80 13 75 975
Σf = 40 Σfixi = 2080
Mean = = 52
X̄
Hence, the
mean of the
given data set
is 52.
20.
Class Intervals Frequency
100– 120 4
120 – 140 6
140 – 160 10
160 – 180 8
180 – 200 5
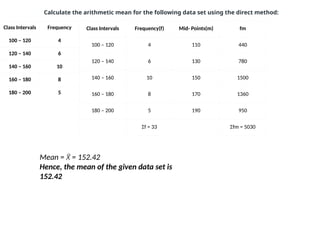
Calculate the arithmetic mean for the following data set using the direct method:
Class Intervals Frequency(f) Mid- Points(m) fm
100 – 120 4 110 440
120 – 140 6 130 780
140 – 160 10 150 1500
160 – 180 8 170 1360
180 – 200 5 190 950
Σf = 33 Σfm = 5030
Mean = = 152.42
X̄
Hence, the mean of the given data set is
152.42
21.
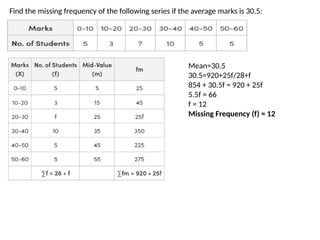
Find the missingfrequency of the following series if the average marks is 30.5:
Mean=30.5
30.5=920+25f/28+f
854 + 30.5f = 920 + 25f
5.5f = 66
f = 12
Missing Frequency (f) = 12
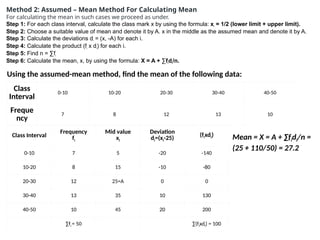
Method 2: Assumed– Mean Method For Calculating Mean
For calculating the mean in such cases we proceed as under.
Step 1: For each class interval, calculate the class mark x by using the formula: xi
= 1/2 (lower limit + upper limit).
Step 2: Choose a suitable value of mean and denote it by A. x in the middle as the assumed mean and denote it by A.
Step 3: Calculate the deviations di
= (x, -A) for each i.
Step 4: Calculate the product (fi
x di
) for each i.
Step 5: Find n = ∑fi
Step 6: Calculate the mean, x, by using the formula: X = A + ∑fi
di
/n.
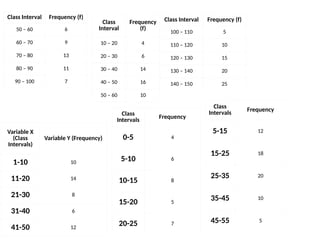
Using the assumed-mean method, find the mean of the following data:
Class
Interval
0-10 10-20 20-30 30-40 40-50
Freque
ncy
7 8 12 13 10
Class Interval
Frequency
fi
Mid value
xi
Deviation
di=(xi-25) (fixdi)
0-10 7 5 -20 -140
10-20 8 15 -10 -80
20-30 12 25=A 0 0
30-40 13 35 10 130
40-50 10 45 20 200
∑fi = 50 ∑(fixdi) = 100
Mean = X = A + ∑fidi/n =
(25 + 110/50) = 27.2
24.
Number
of Plants
0 -2 2 - 4 4 - 6 6 - 8 8 - 10 10 - 12 12 - 14
Number
of Houses
1 2 1 5 6 2 3
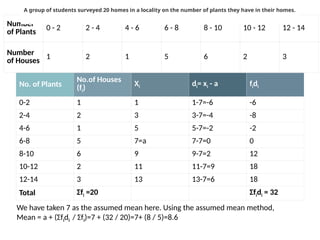
A group of students surveyed 20 homes in a locality on the number of plants they have in their homes.
No. of Plants
No.of Houses
(fi)
Xi di= xi - a fidi
0-2 1 1 1-7=-6 -6
2-4 2 3 3-7=-4 -8
4-6 1 5 5-7=-2 -2
6-8 5 7=a 7-7=0 0
8-10 6 9 9-7=2 12
10-12 2 11 11-7=9 18
12-14 3 13 13-7=6 18
Total Σfi =20 Σfidi = 32
We have taken 7 as the assumed mean here. Using the assumed mean method,
Mean = a + (Σfidi / Σfi)=7 + (32 / 20)=7+ (8 / 5)=8.6
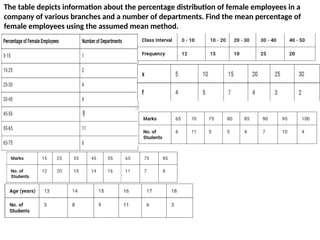
The table depictsinformation about the percentage distribution of female employees in a
company of various branches and a number of departments. Find the mean percentage of
female employees using the assumed mean method.
27.
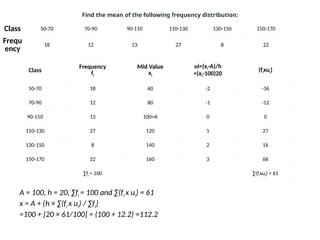
Class 50-70 70-9090-110 110-130 130-150 150-170
Frequ
ency
18 12 13 27 8 22
Find the mean of the following frequency distribution:
Class
Frequency
fi
Mid Value
xi
ui=(xi-A)/h
=(xi-100)20
(fixui)
50-70 18 60 -2 -36
70-90 12 80 -1 -12
90-110 13 100=A 0 0
110-130 27 120 1 27
130-150 8 140 2 16
150-170 22 160 3 66
∑fi = 100 ∑(fixui) = 61
A = 100, h = 20, ∑fi = 100 and ∑(fi x ui) = 61
x = A + {h × ∑(fi x ui) / ∑fi}
=100 + {20 × 61/100} = (100 + 12.2) =112.2
28.
Step-Deviation Method forCalculating Mean
When the values of x, and f are large, the calculation of the mean
by the above methods becomes tedious. In such cases, we use the
step-deviation method, given below.
Step 1: For each class interval, calculate the class mark x, where X =
1/2 (lower limit + upper limit).
Step 2: Choose a suitable value of x, in the middle of the x, column as
the assumed mean and denote it by A.
Step 3: Calculate h = [(upper limit) – (lower limit)], which is the same
for all the classes.
Step 4: Calculate ui = (xi -A) /h for each class.
Step 5: Calculate fu for each class and hence find ∑(fi × ui).
Step 6: Calculate the mean by using the formula: x = A + {h × ∑(fi ×
ui)/ ∑fi}
29.
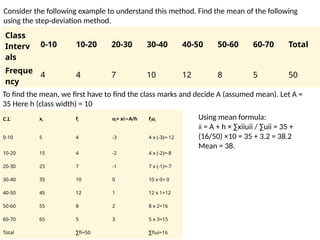
Consider the followingexample to understand this method. Find the mean of the following
using the step-deviation method.
Class
Interv
als
0-10 10-20 20-30 30-40 40-50 50-60 60-70 Total
Freque
ncy
4 4 7 10 12 8 5 50
To find the mean, we first have to find the class marks and decide A (assumed mean). Let A =
35 Here h (class width) = 10
C.I. xi fi ui= xi A/h
− fiui
0-10 5 4 -3 4 x (-3)=-12
10-20 15 4 -2 4 x (-2)=-8
20-30 25 7 -1 7 x (-1)=-7
30-40 35 10 0 10 x 0= 0
40-50 45 12 1 12 x 1=12
50-60 55 8 2 8 x 2=16
60-70 65 5 3 5 x 3=15
Total ∑fi=50 ∑fiui=16
Using mean formula:
= A + h × ∑xiiuii / ∑uii = 35 +
x̄
(16/50) ×10 = 35 + 3.2 = 38.2
Mean = 38.
30.
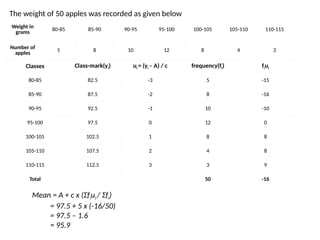
The weight of50 apples was recorded as given below
Weight in
grams
80-85 85-90 90-95 95-100 100-105 105-110 110-115
Number of
apples
5 8 10 12 8 4 3
Classes Class-mark(yi) ui = (yi – A) / c frequency(fi) fiui
80-85 82.5 -3 5 -15
85-90 87.5 -2 8 -16
90-95 92.5 -1 10 -10
95-100 97.5 0 12 0
100-105 102.5 1 8 8
105-110 107.5 2 4 8
110-115 112.5 3 3 9
Total 50 -16
Mean = A + c x (Σfiui / Σfi)
= 97.5 + 5 x (-16/50)
= 97.5 – 1.6
= 95.9
31.
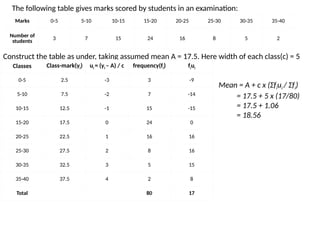
The following tablegives marks scored by students in an examination:
Marks 0-5 5-10 10-15 15-20 20-25 25-30 30-35 35-40
Number of
students 3 7 15 24 16 8 5 2
Construct the table as under, taking assumed mean A = 17.5. Here width of each class(c) = 5
Classes Class-mark(yi) ui = (yi – A) / c frequency(fi) fiui
0-5 2.5 -3 3 -9
5-10 7.5 -2 7 -14
10-15 12.5 -1 15 -15
15-20 17.5 0 24 0
20-25 22.5 1 16 16
25-30 27.5 2 8 16
30-35 32.5 3 5 15
35-40 37.5 4 2 8
Total 80 17
Mean = A + c x (Σfiui / Σfi)
= 17.5 + 5 x (17/80)
= 17.5 + 1.06
= 18.56
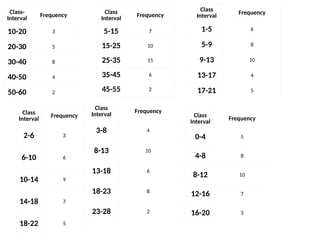
32.
Class-
Interval
Frequency
10-20 3
20-30 5
30-408
40-50 4
50-60 2
Class
Interval
Frequency
5-15 7
15-25 10
25-35 15
35-45 6
45-55 2
Class
Interval Frequency
1-5 6
5-9 8
9-13 10
13-17 4
17-21 5
Class
Interval
Frequency
2-6 3
6-10 6
10-14 9
14-18 7
18-22 5
Class
Interval
Frequency
3-8 4
8-13 10
13-18 6
18-23 8
23-28 2
Class
Interval
Frequency
0-4 5
4-8 8
8-12 10
12-16 7
16-20 3
33.
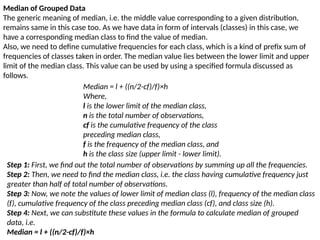
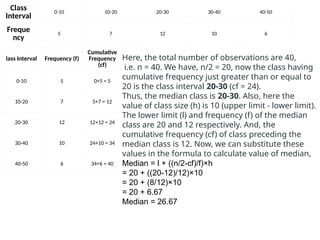
Median of GroupedData
The generic meaning of median, i.e. the middle value corresponding to a given distribution,
remains same in this case too. As we have data in form of intervals (classes) in this case, we
have a corresponding median class to find the value of median.
Also, we need to define cumulative frequencies for each class, which is a kind of prefix sum of
frequencies of classes taken in order. The median value lies between the lower limit and upper
limit of the median class. This value can be used by using a specified formula discussed as
follows.
Median = l + ((n/2-cf)/f)×h
Where,
l is the lower limit of the median class,
n is the total number of observations,
cf is the cumulative frequency of the class
preceding median class,
f is the frequency of the median class, and
h is the class size (upper limit - lower limit).
Step 1: First, we find out the total number of observations by summing up all the frequencies.
Step 2: Then, we need to find the median class, i.e. the class having cumulative frequency just
greater than half of total number of observations.
Step 3: Now, we note the values of lower limit of median class (l), frequency of the median class
(f), cumulative frequency of the class preceding median class (cf), and class size (h).
Step 4: Next, we can substitute these values in the formula to calculate median of grouped
data, i.e.
Median = l + ((n/2-cf)/f)×h
34.
Class
Interval
0-10 10-20 20-3030-40 40-50
Freque
ncy
5 7 12 10 6
lass Interval Frequency (f)
Cumulative
Frequency
(cf)
0-10 5 0+5 = 5
10-20 7 5+7 = 12
20-30 12 12+12 = 24
30-40 10 24+10 = 34
40-50 6 34+6 = 40
Here, the total number of observations are 40,
i.e. n = 40. We have, n/2 = 20, now the class having
cumulative frequency just greater than or equal to
20 is the class interval 20-30 (cf = 24).
Thus, the median class is 20-30. Also, here the
value of class size (h) is 10 (upper limit - lower limit).
The lower limit (l) and frequency (f) of the median
class are 20 and 12 respectively. And, the
cumulative frequency (cf) of class preceding the
median class is 12. Now, we can substitute these
values in the formula to calculate value of median,
Median = l + ((n/2-cf)/f)×h
= 20 + ((20-12)/12)×10
= 20 + (8/12)×10
= 20 + 6.67
Median = 26.67
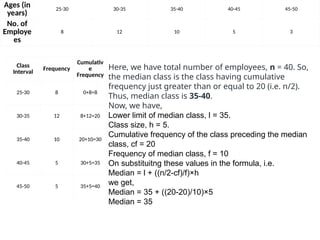
35.
Ages (in
years)
25-30 30-3535-40 40-45 45-50
No. of
Employe
es
8 12 10 5 3
Class
Interval
Frequency
Cumulativ
e
Frequency
25-30 8 0+8=8
30-35 12 8+12=20
35-40 10 20+10=30
40-45 5 30+5=35
45-50 5 35+5=40
Here, we have total number of employees, n = 40. So,
the median class is the class having cumulative
frequency just greater than or equal to 20 (i.e. n/2).
Thus, median class is 35-40.
Now, we have,
Lower limit of median class, l = 35.
Class size, h = 5.
Cumulative frequency of the class preceding the median
class, cf = 20
Frequency of median class, f = 10
On substituitng these values in the formula, i.e.
Median = l + ((n/2-cf)/f)×h
we get,
Median = 35 + ((20-20)/10)×5
Median = 35
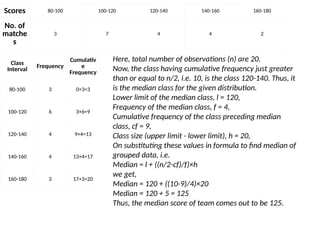
36.
Scores 80-100 100-120120-140 140-160 160-180
No. of
matche
s
3 7 4 4 2
Class
Interval Frequency
Cumulativ
e
Frequency
80-100 3 0+3=3
100-120 6 3+6=9
120-140 4 9+4=13
140-160 4 13+4=17
160-180 3 17+3=20
Here, total number of observations (n) are 20.
Now, the class having cumulative frequency just greater
than or equal to n/2, i.e. 10, is the class 120-140. Thus, it
is the median class for the given distribution.
Lower limit of the median class, l = 120,
Frequency of the median class, f = 4,
Cumulative frequency of the class preceding median
class, cf = 9,
Class size (upper limit - lower limit), h = 20,
On substituting these values in formula to find median of
grouped data, i.e.
Median = l + ((n/2-cf)/f)×h
we get,
Median = 120 + ((10-9)/4)×20
Median = 120 + 5 = 125
Thus, the median score of team comes out to be 125.
37.
Weekly Expenditure ($)0-1000 1000-2000 2000-3000 3000-4000 4000-5000 Total
Number of Families 34 12 43 60 51 200
Weekly
Expendit
ure
No. of
families
(fi)
Cumulati
ve
frequenc
y (c)
0 - 1000 34 34
1000 -
2000
12
34 + 12 =
46
2000 -
3000
43
46 + 43 =
89
3000 -
4000
60
89 + 60 =
149
4000 -
5000
51
159 + 51
= 200
n = 200, n/2 = 200/2 = 100
Median Class = 3000 - 4000
l = 3000, c = 89, f = 60, h = 1000
Median = l + [(n/2−c)/f] × h = 3000 + [(200/2 -
89)/60] × 1000 = 3000 + 183.33 = 3183.33
Answer: ∴ Median is 3183.33
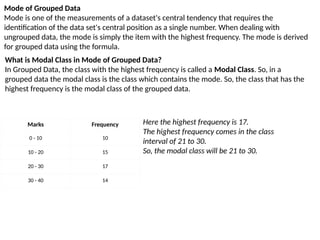
38.
Mode of GroupedData
Mode is one of the measurements of a dataset's central tendency that requires the
identification of the data set's central position as a single number. When dealing with
ungrouped data, the mode is simply the item with the highest frequency. The mode is derived
for grouped data using the formula.
Marks Frequency
0 - 10 10
10 - 20 15
20 - 30 17
30 - 40 14
Here the highest frequency is 17.
The highest frequency comes in the class
interval of 21 to 30.
So, the modal class will be 21 to 30.
What is Modal Class in Mode of Grouped Data?
In Grouped Data, the class with the highest frequency is called a Modal Class. So, in a
grouped data the modal class is the class which contains the mode. So, the class that has the
highest frequency is the modal class of the grouped data.
39.
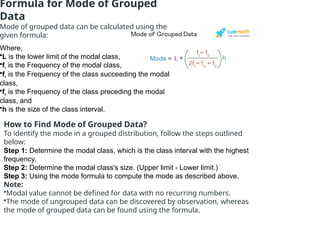
Formula for Modeof Grouped
Data
Mode of grouped data can be calculated using the
given formula:
Where,
•L is the lower limit of the modal class,
•f1
is the Frequency of the modal class,
•f2
is the Frequency of the class succeeding the modal
class,
•f0
is the Frequency of the class preceding the modal
class, and
•h is the size of the class interval.
How to Find Mode of Grouped Data?
To identify the mode in a grouped distribution, follow the steps outlined
below:
Step 1: Determine the modal class, which is the class interval with the highest
frequency.
Step 2: Determine the modal class's size. (Upper limit - Lower limit.)
Step 3: Using the mode formula to compute the mode as described above.
Note:
•Modal value cannot be defined for data with no recurring numbers.
•The mode of ungrouped data can be discovered by observation, whereas
the mode of grouped data can be found using the formula.
40.
Height (in
cm)
Number
of
Students
125-130 7
130-13514
135-140 10
140-145 10
145-150 9
Here the maximum frequency is 14 which is in
130-135 class interval.
Modal class = 130-135
L = 130, h =5, f1= 14, f2 = 10, f0=7
⇒ Mode = 130 + ((14-7)/(2×14-7-10))×5
⇒ Mode = 130 + 3.18 = 133.18
So, modal height = 133.18 cm
Class
Interval
Freque
ncy
10-20 8
20-30 15
30-40 12
40-50 5
Modal class = 20 - 30
Lower limit of the modal class = (L) = 20
Frequency of the modal class = 15
Frequency of the preceding modal class = 8
Frequency of the next modal class = 12
Size of the class interval = (h) = 10.
⇒ Mode = 20 + 10{15-8/(2×15-8-12)}
⇒ Mode = 20 + 10{7/10]
⇒ Mode = 20 + 7 = 27
Therefore, Mode = 27
41.
Class 0-10 10-2020-30 30-40 40-50 50-60 60-70 70-80
Freq
uenc
y
5 8 7 12 28 20 10 10
Class 40-50 has the maximum frequency, so it
is called the modal class.
l = 40, h = 10, fk = 28, fk-1 = 12, fk+1 = 20
Mode = l + h{(fk – fk-1)/(2fk – fk-1 – fk+1)}
Mode = 40 + 10{(28 – 12)/(2 × 28 – 12 – 20)}
Mode = 46.67
Hence, mode = 46.67
Class Interval Frequency
10 - 20 8
20 - 30 15
30 - 40 12
40 - 50 5
Total 40
Modal class = 20 - 30
Lower limit of the modal class = (L) = 20
Frequency of the modal class = (f)1(f)1 = 15
Frequency of the preceding modal class
= (f)0(f)0 = 8
Frequency of the next modal class = (f)2(f)2 =
12
Size of the class interval = (h) = 10.
Mode = L+ (f1−f02f1−f0−f2)(f1−f02f1−f0−f2)h
= 20 + 10{15-8/(2×15-8-12)} = 20 + 10{7/10] =
20 + 7 = 27
Therefore, mode = 27
42.
Mode = 3Median - 2 Mean
For a given distribution the values of mean and median are 44 and 43 respectively. Find the
value of mode.
We know,
Mode = 3 Median - 2 Mean
⇒ Mode = 3×43 - 2×44
⇒ Mode = 129 - 88 = 41


![• What is Median?
• A Median is a middle value for sorted data. The sorting of the data can be
done either in ascending order or descending order. A median divides the
data into two equal halves.
• Median Symbol
• The letter “M” is commonly used to represent the median of a dataset,
whether it’s for a population or a sample. This notation simplifies the
representation of statistical concepts and calculations, making it easier to
understand and apply in various contexts. Therefore, in Indian statistical
practice, “M” is widely accepted and understood as the symbol for the
median.
• Median Formula
• The formula for the median is:
• If the number of values (n value) in the data set is odd then the formula to
calculate the median is:
• Median = [(n + 1)/2]th
term
• If the number of values (n value) in the data set is even then the formula to
calculate the median is:
• Median = [(n/2)th
term + {(n/2) + 1}th
term] / 2](https://image.slidesharecdn.com/meanmedianandmode-250503090904-da294e60/85/CORRELATION-pptx-FOR-ELECTIVE-SUBJETCTS-9-320.jpg)
![• Find the median of given data set 30, 40, 10, 20, and 50.
• Solution:
• Median of the data 30, 40, 10, 20, 50 is,
• Step 1: Order the given data in ascending order as:
• 10, 20, 30, 40, 50
• Step 2: Check n (number of terms of data set) is even or odd and find the median of the
data with respective ‘n’ value.
• Step 3: Here, n = 5 (odd)
• Median = [(n + 1)/2]th
term
• Median = [(5 + 1)/2]th
term
• = 30
• Median salary of five friends, where the individual salary of each friend is, 74,000, 82,000,
75,000, 96,000, and 88,000. First arranged in ascending order 74,000, 75,000, 82,000,
88,000, and 96,000 then by observing the data we get the median salary as 82,000.
• Median Age of a Group- Consider a group of people ages 25, 30, 27, 22, 35, and 40. First,
arrange the ages in ascending order: 22, 25, 27, 30, 35, 40. The median age is the middle
value, which is 30 in this case.
• Median Test Scores- In a class, the test scores of 10 students are 78, 85, 90, 72, 91, 68, 80,
95, 87, and 81. Arrange them in ascending order: 68, 72, 78, 80, 81, 85, 87, 90, 91, and
95. Since there are an even number of scores, the median is the average of the two
middle values, which are 81 and 85. The median test score is (81 + 85) / 2 = 83.](https://image.slidesharecdn.com/meanmedianandmode-250503090904-da294e60/85/CORRELATION-pptx-FOR-ELECTIVE-SUBJETCTS-10-320.jpg)
![Example 1: Find the median of the given data set 60, 70, 10, 30, and 50
• Solution:
• Median of the data 60, 70, 10, 30, and 50 is,
• Step 1: Order the given data in ascending order as:
• 10, 30, 50, 60, 70
• Step 2: Check if n (number of terms of data set) is even or odd and find the median of the data with respective ‘n’ value.
• Step 3: Here, n = 5 (odd)
• Median = [(n + 1)/2]th
term
• Median = [(5 + 1)/2]th
term = 3rd
term
• = 50
Example 2: Find the median of the given data set 13, 47, 19, 25, 75, 66, and 50
• Solution:
• Median of the data 13, 47, 19, 25, 75, 66, and 50 is,
• Step 1: Order the given data in ascending order as:
• 13, 19, 25, 47, 50, 66, 75
• Step 2: Check if n (number of terms of data set) is even or odd and find the median of the data with respective ‘n’ value.
• Step 3: Here, n = 7 (odd)
• Median = [(n + 1)/2]th
term
• Median = [(7 + 1)/2]th
term = 4th
term
• = 47
• Consider the dataset: 3,6,1,9,2,73,6,1,9,2,7 with n=6.
• Sort the Data: Arranging in ascending order: 1,2,3,6,7,9.
• Identify the Two Middle Positions: For n=6, the middle positions are 6/2=3 and 6/2+1=4.
• Calculate the Median: The median is the average of the values at positions 3 and 4: (3+6)/2 = 4.5.
• So, the median of the given dataset is 4.5.](https://image.slidesharecdn.com/meanmedianandmode-250503090904-da294e60/85/CORRELATION-pptx-FOR-ELECTIVE-SUBJETCTS-11-320.jpg)
![Class
Interval
0 - 10 10 - 20 20 - 30 30 - 40 40 - 50
Frequen
cy (fi)
9 13 8 15 10
Example: Find the mean of the following
data.
• The first step is to create the table with the
midpoint or marks and the product of the
frequency and midpoint. To calculate the
midpoint we find the average between the class
interval by using the formula mentioned above.
• Midpoint xii = 0 - 10 = 5 ([10 + 0]/2), 10 - 20 =
15 ([20 + 10]/2) and so on.
• xifi = For the class interval 0 - 10 = 5 × 9 = 45,
For the class interval 10 - 20 = 13 × 15 = 195 and
so on.
Once we have determined the totals, let us use the
formula to calculate the estimated mean.
Estimated Mean = ∑xifi / ∑fi = 1415/55 = 25.73.
Class
Interv
al
Freque
ncy (fii)
Class
Mark
(xii)
xiifii
0 - 10 9 5 45
10 - 20 13 15 195
20 - 30 8 25 200
30 - 40 15 35 525
40 - 50 10 45 450
Total 55 1415](https://image.slidesharecdn.com/meanmedianandmode-250503090904-da294e60/85/CORRELATION-pptx-FOR-ELECTIVE-SUBJETCTS-18-320.jpg)
![Step-Deviation Method for Calculating Mean
When the values of x, and f are large, the calculation of the mean
by the above methods becomes tedious. In such cases, we use the
step-deviation method, given below.
Step 1: For each class interval, calculate the class mark x, where X =
1/2 (lower limit + upper limit).
Step 2: Choose a suitable value of x, in the middle of the x, column as
the assumed mean and denote it by A.
Step 3: Calculate h = [(upper limit) – (lower limit)], which is the same
for all the classes.
Step 4: Calculate ui = (xi -A) /h for each class.
Step 5: Calculate fu for each class and hence find ∑(fi × ui).
Step 6: Calculate the mean by using the formula: x = A + {h × ∑(fi ×
ui)/ ∑fi}](https://image.slidesharecdn.com/meanmedianandmode-250503090904-da294e60/85/CORRELATION-pptx-FOR-ELECTIVE-SUBJETCTS-28-320.jpg)
![Weekly Expenditure ($) 0-1000 1000-2000 2000-3000 3000-4000 4000-5000 Total
Number of Families 34 12 43 60 51 200
Weekly
Expendit
ure
No. of
families
(fi)
Cumulati
ve
frequenc
y (c)
0 - 1000 34 34
1000 -
2000
12
34 + 12 =
46
2000 -
3000
43
46 + 43 =
89
3000 -
4000
60
89 + 60 =
149
4000 -
5000
51
159 + 51
= 200
n = 200, n/2 = 200/2 = 100
Median Class = 3000 - 4000
l = 3000, c = 89, f = 60, h = 1000
Median = l + [(n/2−c)/f] × h = 3000 + [(200/2 -
89)/60] × 1000 = 3000 + 183.33 = 3183.33
Answer: ∴ Median is 3183.33](https://image.slidesharecdn.com/meanmedianandmode-250503090904-da294e60/85/CORRELATION-pptx-FOR-ELECTIVE-SUBJETCTS-37-320.jpg)
![Height (in
cm)
Number
of
Students
125-130 7
130-135 14
135-140 10
140-145 10
145-150 9
Here the maximum frequency is 14 which is in
130-135 class interval.
Modal class = 130-135
L = 130, h =5, f1= 14, f2 = 10, f0=7
⇒ Mode = 130 + ((14-7)/(2×14-7-10))×5
⇒ Mode = 130 + 3.18 = 133.18
So, modal height = 133.18 cm
Class
Interval
Freque
ncy
10-20 8
20-30 15
30-40 12
40-50 5
Modal class = 20 - 30
Lower limit of the modal class = (L) = 20
Frequency of the modal class = 15
Frequency of the preceding modal class = 8
Frequency of the next modal class = 12
Size of the class interval = (h) = 10.
⇒ Mode = 20 + 10{15-8/(2×15-8-12)}
⇒ Mode = 20 + 10{7/10]
⇒ Mode = 20 + 7 = 27
Therefore, Mode = 27](https://image.slidesharecdn.com/meanmedianandmode-250503090904-da294e60/85/CORRELATION-pptx-FOR-ELECTIVE-SUBJETCTS-40-320.jpg)
![Class 0-10 10-20 20-30 30-40 40-50 50-60 60-70 70-80
Freq
uenc
y
5 8 7 12 28 20 10 10
Class 40-50 has the maximum frequency, so it
is called the modal class.
l = 40, h = 10, fk = 28, fk-1 = 12, fk+1 = 20
Mode = l + h{(fk – fk-1)/(2fk – fk-1 – fk+1)}
Mode = 40 + 10{(28 – 12)/(2 × 28 – 12 – 20)}
Mode = 46.67
Hence, mode = 46.67
Class Interval Frequency
10 - 20 8
20 - 30 15
30 - 40 12
40 - 50 5
Total 40
Modal class = 20 - 30
Lower limit of the modal class = (L) = 20
Frequency of the modal class = (f)1(f)1 = 15
Frequency of the preceding modal class
= (f)0(f)0 = 8
Frequency of the next modal class = (f)2(f)2 =
12
Size of the class interval = (h) = 10.
Mode = L+ (f1−f02f1−f0−f2)(f1−f02f1−f0−f2)h
= 20 + 10{15-8/(2×15-8-12)} = 20 + 10{7/10] =
20 + 7 = 27
Therefore, mode = 27](https://image.slidesharecdn.com/meanmedianandmode-250503090904-da294e60/85/CORRELATION-pptx-FOR-ELECTIVE-SUBJETCTS-41-320.jpg)